
Abstract
Generally, interactions at surface asperities are the cause of wear. Two-Thirds of wear in industry occurs because of the abrasive or adhesive mechanisms. This research presents an analytical model for abrasion of additive manufactured Digital Light Processing products using pin-on-disk method. Particularly, the relationship between abrasion volume, normal load, and surface asperities’ angle is investigated. To verify the proposed mathematical model, the results of this model are verified with the practical experiments. Results show that the most influential parameters on abrasion rate are normal load and surface’s normal angle. Abrasion value increases linearly with increasing normal load. The maximum abrasion value occurs when the surface’s normal angle during fabrication is 45°. After the asperities are worn the abrasion volume is the same for all specimens with different surface’s normal angle. Though layer thickness does not directly affect the wear rate, but surface roughness tests show that layer thickness has a great impact on the quality of the abraded surface. When the thickness of the layers is high, the abraded surface has deeper valleys, and thus has a more negative skewness. This paper presents an original approach in abrasion behavior improvement of DLP parts which no research has been done on it so far; thus, bringing the AM one step closer to maturity.
Introduction
Additive Manufacturing (AM) is an appropriate name to describe the technologies that build 3D objects by adding layer-upon-layer. Early use of AM in the form of rapid prototyping focused on preproduction visualization models. More recently, AM is being used to fabricate end-use products in aircraft, dental restorations, medical implants, automobiles, and even fashion products. While the adding of layer-upon-layer approach is simple, there are many applications of AM technology with degrees of sophistication to meet diverse needs.
Digital light processing (DLP), as an AM process, consolidates liquid resin into a final solid product by applying radiation on it. In order to more industrial popularity of DLP products, supplementary researches should be executed. The mechanical and physical properties of the DLP products depend on the parameters of the process by which they are fabricated. 1 Many of the mechanical properties of components manufactured by DLP depend heavily on microstructure which must be controlled by changing the parameters’ values. 2
DLP is a similar technology to stereolithography (SL) in that it is a 3D printing process that works with photopolymers. The major difference is the light source. DLP uses a more conventional light source, such as an arc lamp with a liquid crystal display panel, which is applied to the entire surface of the vat resin in a single pass, generally making it faster than SL. 3 Also like SL, DLP produces highly accurate parts with excellent resolution. One advantage of DLP over SL is that only a shallow vat of resin is required to facilitate the process, which generally results in less waste and lower running costs. 3D models of the parts are modeled using a CAD software. These models are converted into STL format. Then, these models are sliced by the AM software and they get ready for manufacturing in DLP machine. In DLP process, once the model is sent to the printer, a vat of liquid polymer is exposed to light from a DLP projector. The DLP projector displays the images of layers of the 3D model onto the liquid polymer. The exposed liquid polymer hardens and the build plate moves down and the liquid polymer is once more exposed to light. This cycle is repeated until the 3D model is complete and the vat is drained of liquid, revealing the solidified model. 4
One of the ongoing aims of the engineering field is to find a mathematical relationship between different parameters in a specific process. This aim also applies to Tribology; as engineers must know equations as a means to forecast abrasion rates. The phenomenon of wear, defined as material removal occurring on the outer layer of a part is due the relative movement of the adjacent components which in turn, leads to many economic losses such as replacement expenses and downtime of the machine. Generally, interactions at surface asperities are the cause of wear. Wear is divided into six distinct mechanisms, namely, (1) abrasive; (2) adhesive; (3) fatigue; (4) erosion; (5) corrosive; and (6) electrical-arc-induced wear, which all pave the way for the same result, that is, material removal from component surfaces. Assessments have revealed that two-thirds of wear in the industry occurs because of abrasive or adhesive mechanisms. 5
Abrasive has two mechanisms: fracture or plastic deformation.1,2 Regarding ductile materials, hard asperities or hard particles result in the plastic flow of the material. During abrasion, material removal due to plastic deformation may occur by different mechanisms which include cutting, wedge formation, and plowing. 1 The controlling factors for these mechanisms are the angle of surface peaks, penetration rate, and the shear strength of the interface. 6
Despite the development of analytical models by many researchers regarding abrasion in different manufacturing processes, additive manufacturing (AM) processes have received far less attention as fewer mathematical models for abrasion rate have been presented. Westphal et al. 7 investigated the performance and friction properties of injection hybrid molds with stereolithography molding zones and concluded that materials with solubility parameters close to that of the stereolithography resin are likely to cause wear of the molding core, due to chemical adhesion between the materials during the injection phase. Istephanous et al. 8 presented implants based on engineered metal matrix composite materials having enhanced imaging and wear resistance using additive manufacturing. Gonçalves et al. 9 studied tribological properties (such as abrasive resistance) of molds obtained by additive manufacturing. Palacio and Bhushan 10 studied to achieve ultrathin wear-resistant films for novel MEMS/NEMS applications with the help of digital light processing (DLP). Nezhad et al. 11 provided a pareto-based method for optimization of part orientation in stereolithography to achieve the desired mechanical properties. Strano et al. 12 researched multi-objective optimization of selective laser sintering processes for surface quality and energy saving. Naiju et al. 13 investigated the lubricated wear of direct metal laser sintered components, from which had been found that the applied normal load has the most effect on lubricated wear. In 2015, a research conducted by Zhang et al. 14 on the additive manufacturing of Ti-Si-N ceramic coatings on titanium, revealed the direct influence of microstructural variations and phase changes on coating’s wear and hardness resistance. Chiu et al. 15 studied multi-objective optimization of process parameters in the rapid prototyping system using the Taguchi method and a gray relational analysis. De Leon et al. 16 studied the development of high-performance polymer nanocomposites with high abrasion resistance for components manufactured by AM methods. Lovo et al. 17 investigated the optimal deposition orientation in fused deposition modeling for maximizing the strength of three-dimensional printed truss-like structures. In Akhoundi et al. 18 came up with an innovative design approach in three-dimensional printing of continuous fiber–reinforced thermoplastic composites via fused deposition modeling process. Nabipour and Akhoundi 19 conducted an experimental study of FDM parameters effects on some mechanical properties and production time of ABS/Cu composites.
This research presents an analytical model, besides the experimental study, for abrasion regarding the products of DLP process using a pin-on-disk apparatus. More specifically, the relationship between abrasion volume and surface asperities is investigated. DLP process has been targeted in this study in which an entire layer of the part is fabricated at one time. DLP is similar to the stereolithography (SL) process, with the difference being that DLP projects bitmap onto the desired resin to cure each layer at one time. By controlling and adjusting the mechanical properties, high efficiency polymer products using DLP can be fabricated which can be utilized to manufacture functional components. 20 Thus, this research focuses on the influence of layer thickness, normal load, and surface angle during fabrication on the abrasion testing of DLP components. The reason for choosing the layer thickness as an influential parameter is that usually in additive manufacturing processes, the layer thickness is usually a parameter affecting most mechanical properties of the products. 21 Two other parameters have been selected according to the extracted abrasion model. To the best of authors’ knowledge, abrasive behavior of DLP parts has not yet been studied. Results of this research lead to a preferable part that can content functional and operational applications.
In addition, an optimization algorithm created based on principles of PSO algorithm is applied to find best fabrication orientation and reduce the ability to wear of DLP parts. The purpose of the algorithm is to explore the optimum fabrication orientation of a DLP products and then fabricate them in the selected orientation on the machine platform to reduce the ability to wear.
Materials and methods
A common classification of interactions regarding the unlubricated surface is mild or severe abrasion. 22 Experience-wise, the intensification of loading severity (e.g. by the growth of the normal load, temperature or sliding speed.) for any pair of materials, leads at some point to a rather sudden jump in the abrasion rate. 1 Such jumps in abrasion rate have remarkable empirical outcomes for engineers. From an engineering point of view, mild abrasion may be considered acceptable, whilst the transition to severe abrasion usually demonstrate a conversion to unacceptable results. 23
Abrasive wear modeling
A common point in order to start the analysis of abrasive wear is the Archard equation which declares that the amount of abrasion is proportional to the applied load (W) and the sliding distance (x) while inversely proportional to the hardness (H) of the surface being worn away,1,24 so that the abrasive wear volume (v) can be calculated through equation (1).
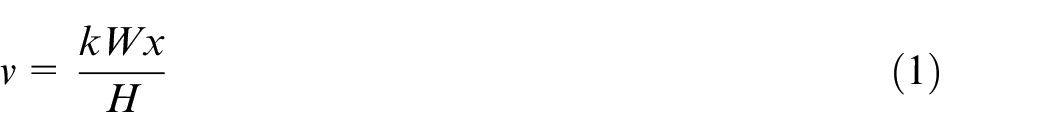
Where “k” is the dimensionless wear coefficient. “k” depends on the materials in contact and surfaces’ cleanliness. Generally, the value of “k” is lower than unity. When expounding situation of experiments, the part uppermost layer hardness in the contact may not be calculated with certainty; hence, so a more useful quantity than merely “k” alone is the ratio “
In this research, in order to acquire a mathematical equation for abrasive wear volume, a simplified model is investigated, in which the surface includes an array of asperities, with a triangular cross section (due to the stair-stepping effect of additive manufacturing processes.
26
), sliding on a flat surface and plowing a uniform depth groove.
27
Figure 1 shows a single asperity. It is clear that the apex angle of asperities is
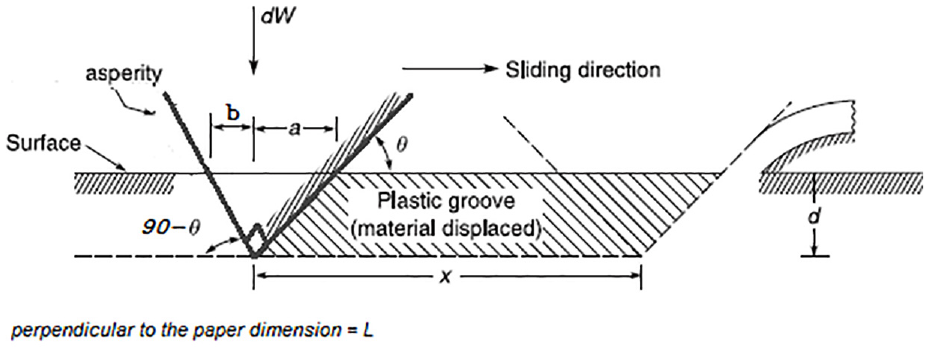
Abrasion model of a single asperity.
In Figure 1:


From equations (2) and (3), it is concluded that:
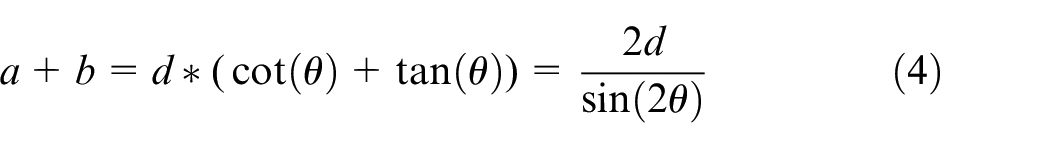
It is also clear that:
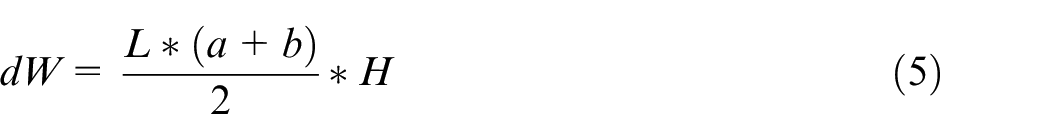
From equations (4) and (5), it is concluded that:
Also:

Where “dv” is the volume displaced by one asperity in the distance “x.” From equations (6) and (7), it is concluded that:
Total abraded material volume by all triangular cross-section asperities can be calculated by integration from equation (8); therefore:
On the other hand, given the inherent nature of additive manufacturing processes, a surface with a “

From equations (9) and (10), it is concluded that:
Assuming that the parameters “x,”“W,” and “H” are constant for a pair of material in a specific condition, “v” is just a function of “

With the values of “
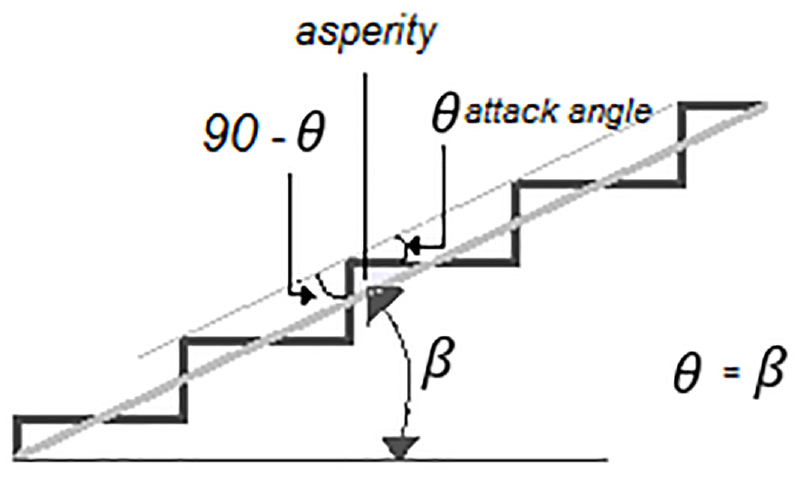
The relationship between attack angle and surface’s normal angle.
To verify the proposed mathematical model, the results of this model should be compared with the results of practical experiments.
Experimentation
In this section, the relationship between the abrasion properties and asperities’ angles of DLP parts is investigated through experiments. As mentioned in the previous section, a surface with a “
Materials
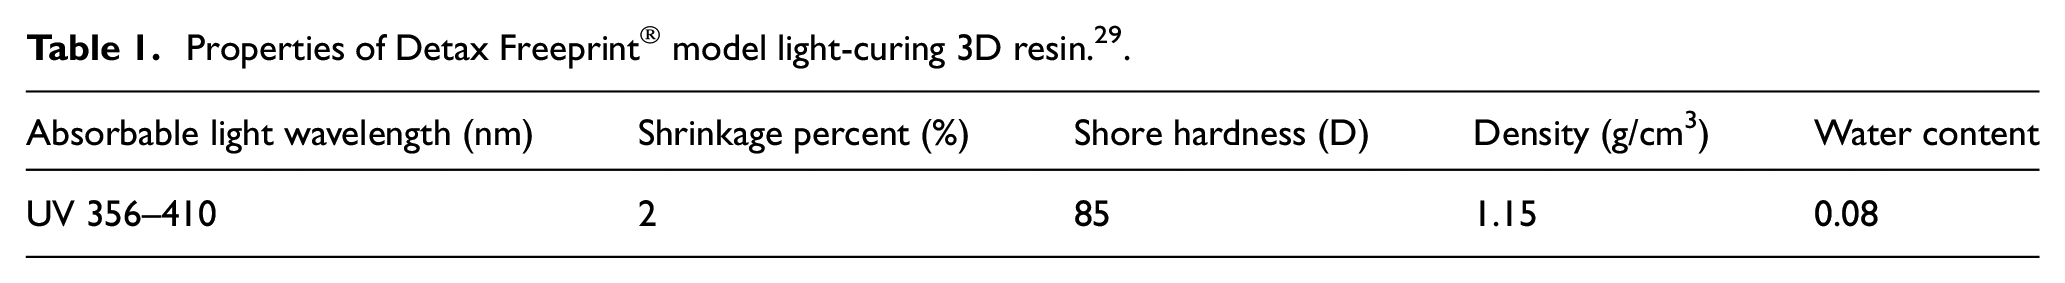
DLP products were fabricated using ALL3DP DLP machine (manufactured in Munich, Germany). With a DLP 3D printer, the light source is a specially developed digital light projector screen. Thanks to this screen, DLP is generally considered to be faster than stereolithography. Detax resin (Freeprintxi® model Light-curing 3D resin manufactured by Detax company in Germany) was used to fabricate the test specimens. Table 1 shows some important properties of this resin.
Properties of Detax Freeprint® model light-curing 3D resin. 29
Among process parameters of DLP layer thickness, load, and surface angle during fabrication are investigated. Then, corresponding contribution of each parameter toward abrasion testing is studied. The parameters were chosen using preliminary studies which specified the optimum levels of each parameter for the fabrication of the specimens. In the preliminary experiments, the effect of exposure time on abrasion resistance was measured. It was found that after 9 s the increase in exposure time did not have a significant effect on abrasion resistance. In all subsequent tests, the exposure time was set to 9 s. Regarding the surface’s normal angle parameter, preliminary experiments showed that the results for the range of zero to 45 degrees can be generalized to the range of 45°–90°. Table 2 shows the results of the preliminary experiments.
Average of preliminary test results.
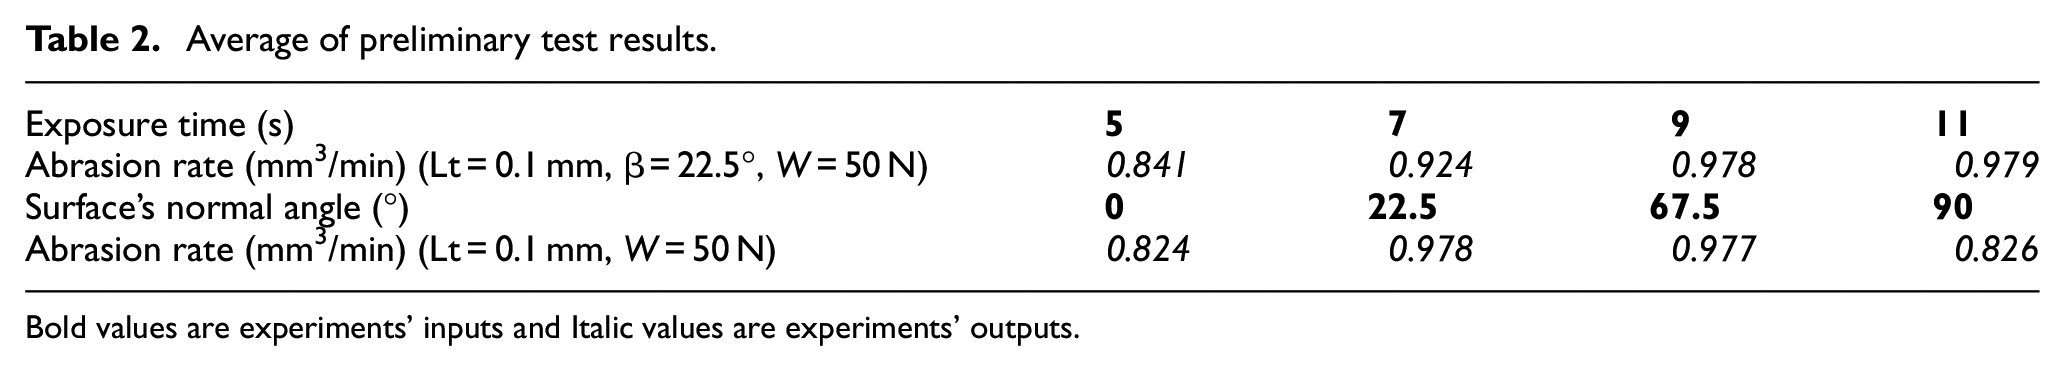
Bold values are experiments’ inputs and Italic values are experiments’ outputs.
For pin-on-disk tests, nine pin specimens (7.85 mm in diameter) were fabricated according the CAD model illustrated in Figure 3. The disk specimens were 60 mm in diameter and 5 mm in thickness. These disks were manufactured using the same resin as the pin specimens. For this experimental study, the specimens were fabricated with the optimum set of parameters such as exposure time, attach over cure time and shutter open and close speeds on previous studies. Specimens were fabricated as per the standards for reciprocating pin-on-disk. Specimens’ weight was measured and noted before the abrasion testing.
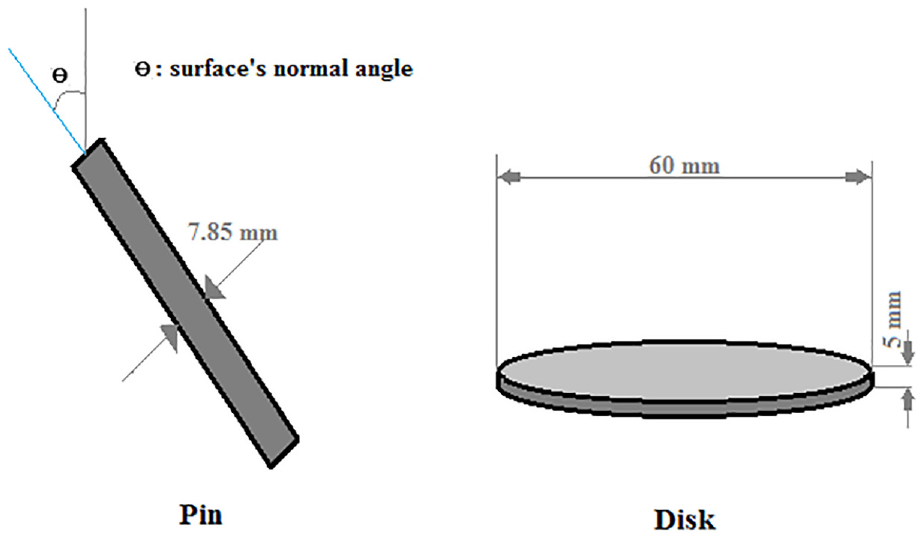
CAD models of pin and disk specimens.
Abrasion testing
A pin-on-disk tribometer consists of a stationary pin that is normally loaded against a rotating disk. 25 Abrasion either happens to the pin or to the disk or for both. In these tests, number and time of cycles and frequency can be set. An analytical balance is utilized for measuring the weight of the specimens before and after the abrasion tests. The pin-on-disk test apparatus is illustrated in Figure 4. In these tests, the pin is used as the abrasive and disk as the test specimen. Therefore, the amount of abrasion on the disk is tested. In pin-on-disk apparatus (manufactured by Rtec instrument, San Jose, USA), the specimens describe a spiral trajectory, keeping linear speed constant. The testing conditions were: Linear speed: 10 (m/min), Room humidity: 45x%–55%.
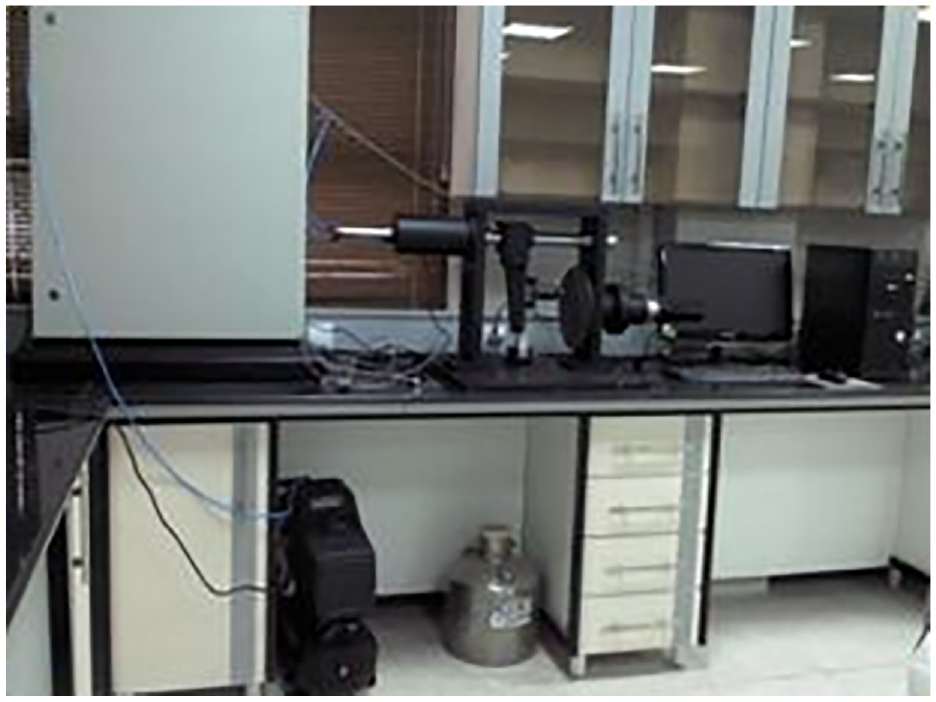
The pin-on-disk test machine.
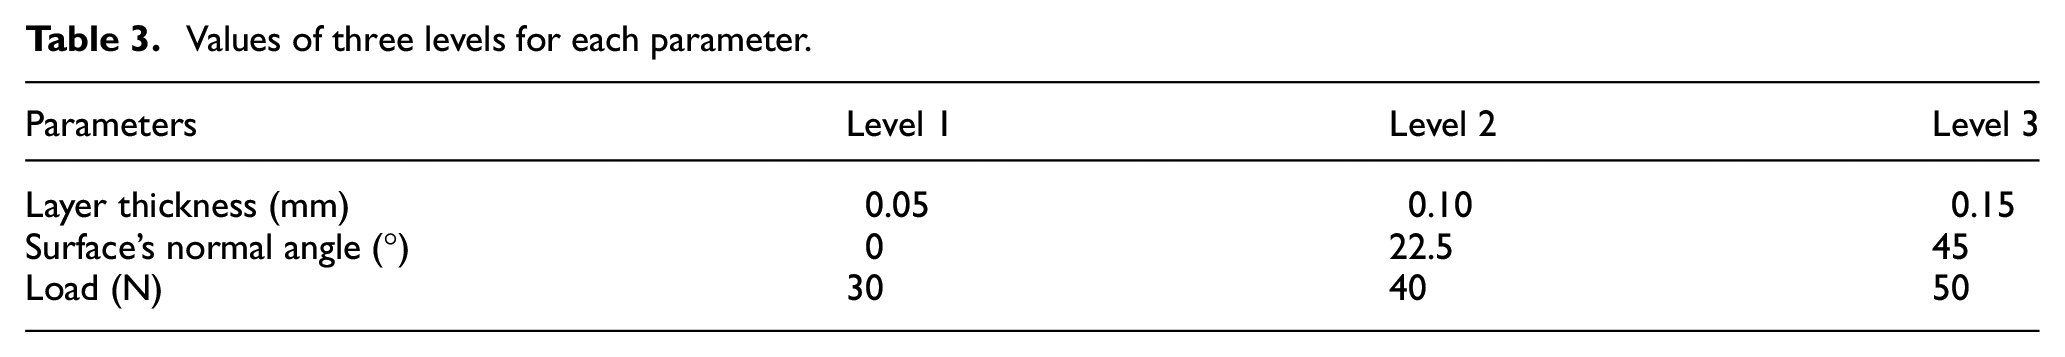
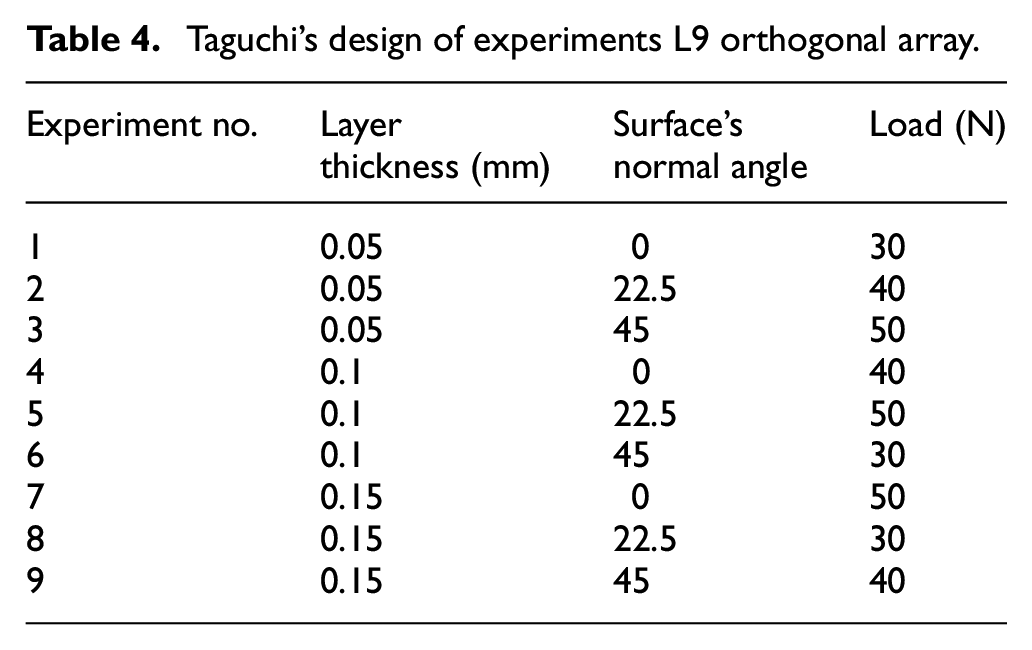
As mentioned above, this research focuses on the influence of layer thickness, load, and surface angle during fabrication on the abrasion testing of DLP components. Three levels were selected for each parameter. According to limitation of the DLP machine, levels for layer thickness were set and according to preliminary experiments levels of surface’s normal angle and Load parameters were set as Table 3. In the case of surface’s normal angle, preliminary experiments showed that abrasion rate increases when this angle increases from 0°–45° and then abrasion rate decreases by increasing this angle up to 90°, so this parameter’s levels were selected in the range of zero to 45° which can be generalized to range of 45°–90°. Table 4 shows the Taguchi’s design of experiments L9 orthogonal array. Abrasion specimens were tested five times at each condition (i.e. nine different set ups), and the average values were taken. Before weighing, the pins and disks were cleaned. The initial masses of pin and disk specimens were noted. The wear volumes of the disks were determined after the tests.
Values of three levels for each parameter.
Taguchi’s design of experiments L9 orthogonal array.
The final weight of the disk specimens was taken and then weight changes were calculated. Abrasion rate was specified in the following way:


Results and discussion
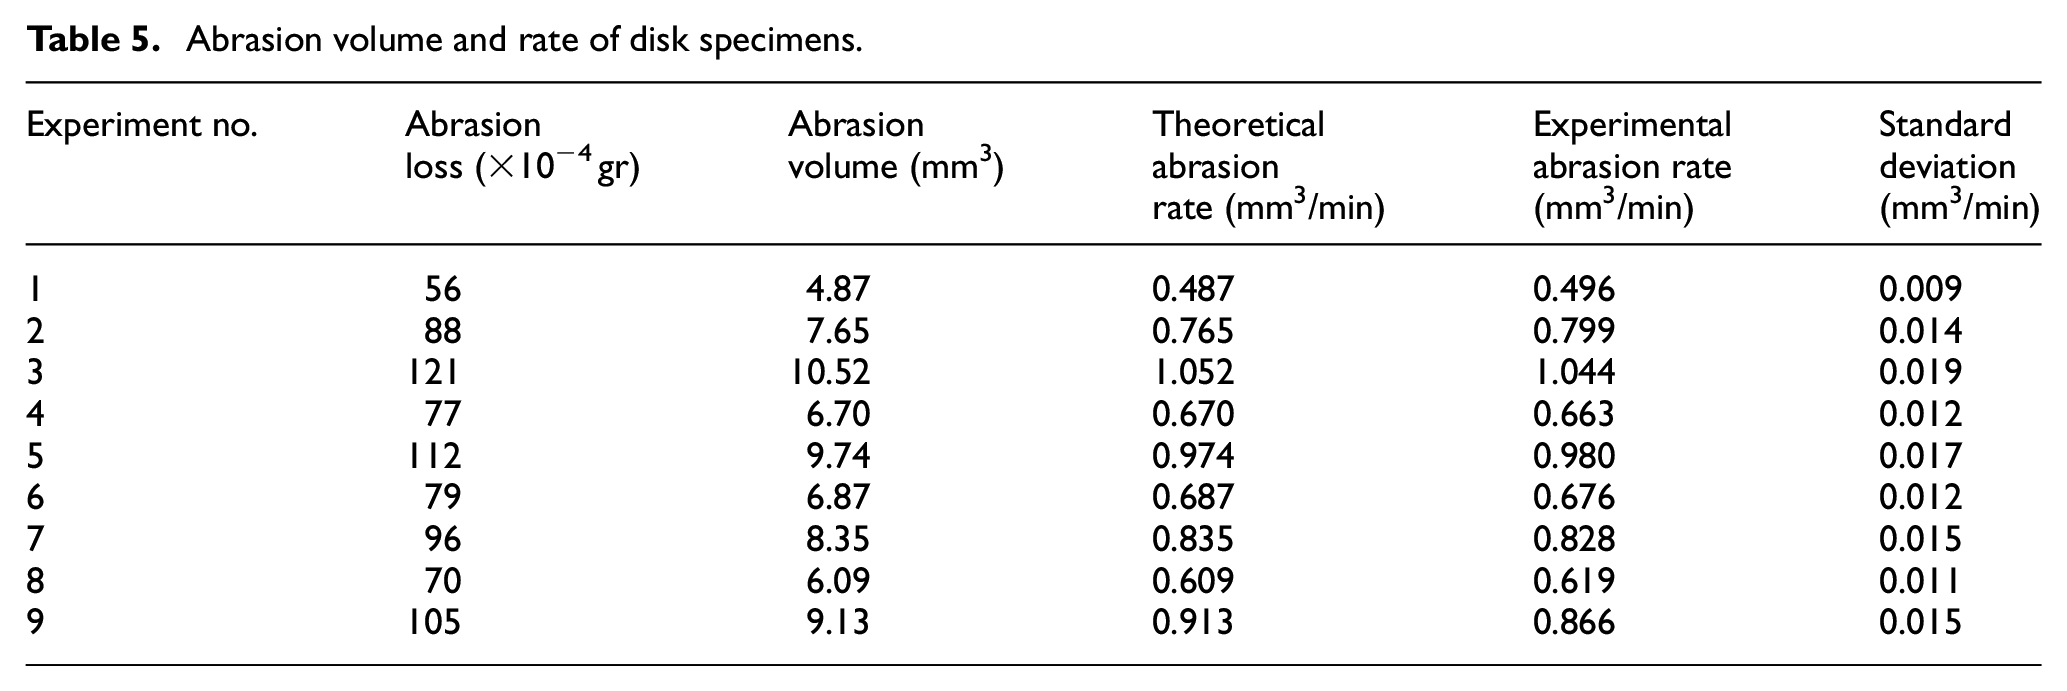
The measured values of abrasion parameters for the specimens are presented in Table 5. because this research focuses on investigation the effect of layer thickness, load, and surface angle on the abrasion of the DLP products, only the disk specimens were analyzed.
Abrasion volume and rate of disk specimens.
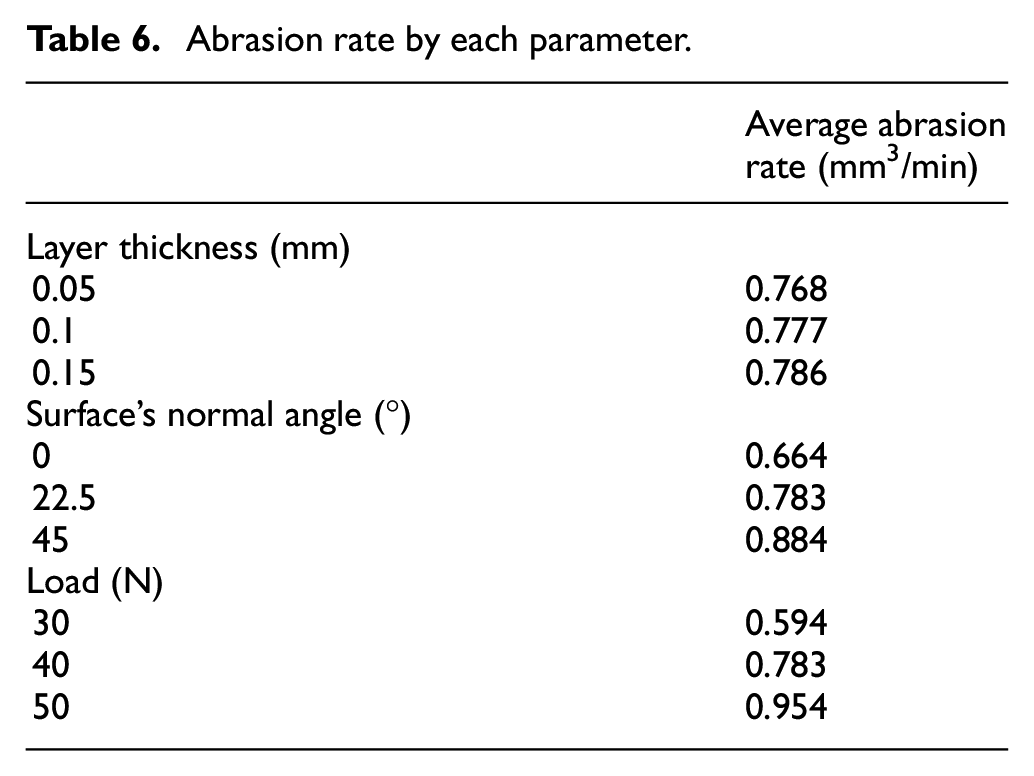
Average abrasion rate by each parameter was calculated and is given in Table 6, also Figure 5 shows the influence of each parameter on the abrasion rate.
Abrasion rate by each parameter.
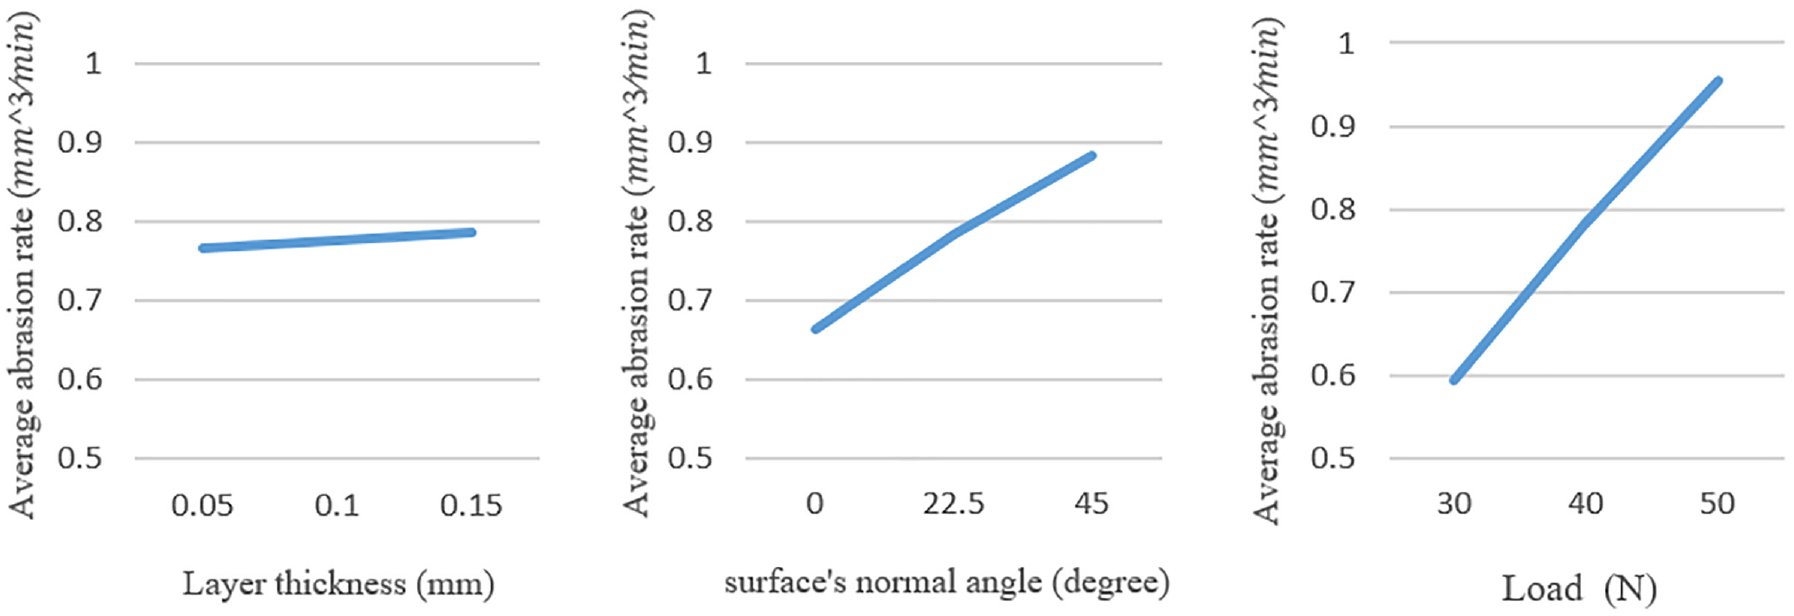
Abrasion rate versus parameters.
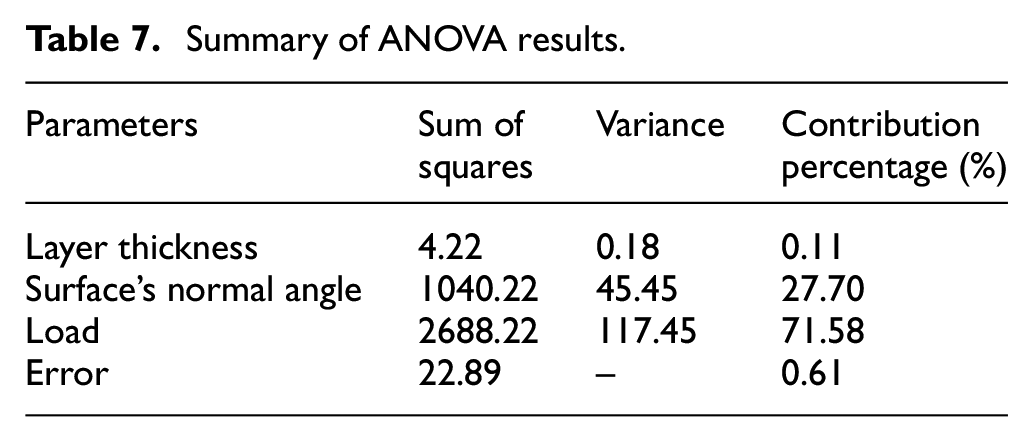
Analysis of variance (ANOVA) is a collection of statistical models and their associated estimation procedures, such as the variation among and between groups, used to analyze the differences among group means in a sample. 30 In this study, the results of this experiments were analyzed with the aid of ANOVA method. Each parameter’s contribution to the abrasion behavior of specimens was determined. The ANOVA for results of abrasion tests is presented in Table 7. The ANOVA demonstrates that layer thickness doesn’t have significant contribution but other two parameters have their own considerable contribution on abrasion. It was revealed that load had the maximum contribution percentage of 71.58%. It was followed by surface’s normal load with 27.70% and minimum contribution belongs to layer thickness with 0.11%. Pie chart of contribution percentage is illustrated in Figure 6.
Summary of ANOVA results.
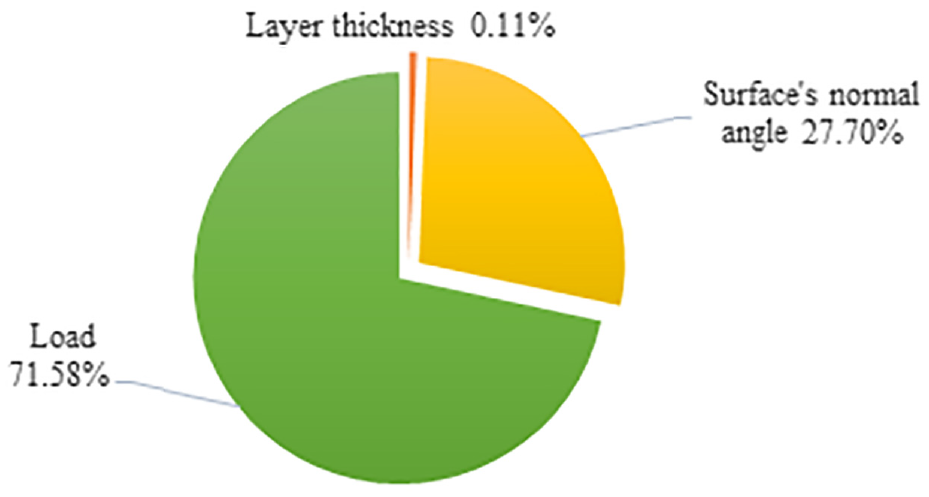
Pie chart of contribution percentage.
At higher loads, abrasion rate was revealed to be higher. The pressure in contact zone are higher when load is high, leading to a high localized temperature and thus easier and faster abrasion.31,32 The abrasion value increases as the surface’s normal angle of the pin increases up to
The maximum abrasion value occurs when the surface’s normal angle is
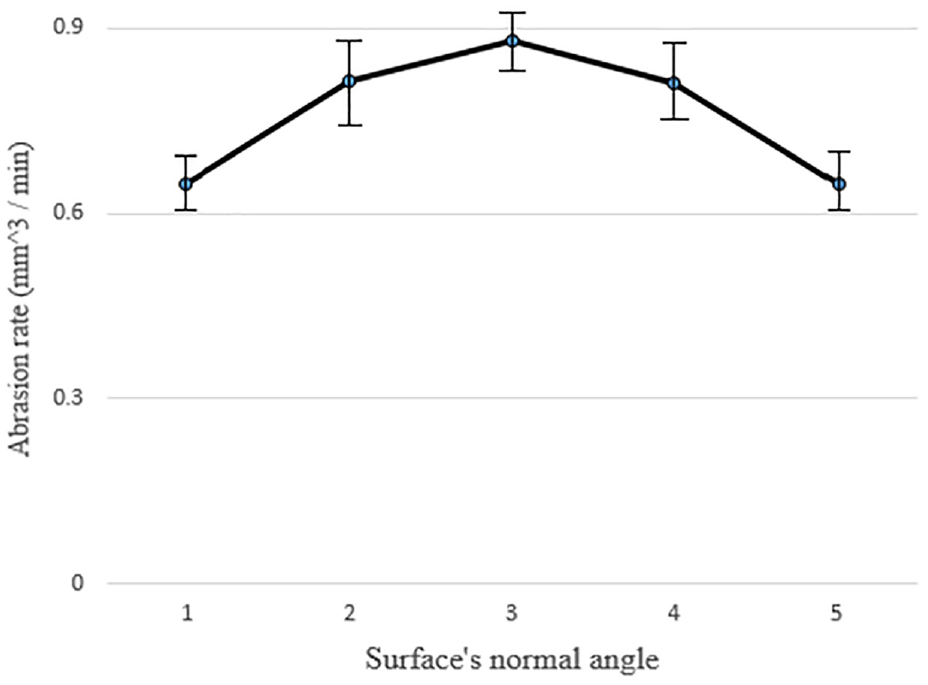
Extended chart of abrasion rate as a function of surface’s normal angle.
Layer thickness doesn’t have significant influence on abrasion values because number of picks per unit length decreases by increasing the layer thickness and so that the load is distributed among fewer picks. Therefore, when layer thickness is higher the number of picks per unit length is lower but instead of that the value of load per each pick is higher. These two opposing effects of layer thickness are offset by each other and for this reason, layer thickness doesn’t have significant effect on abrasion value.
Figure 8 shows the dimensional wear coefficient “k/H” values as a function of the surface’s normal angle, according to results of the experiments. It is observed that the maximum value of the dimensional wear coefficient occurs when the surface’s normal angle is
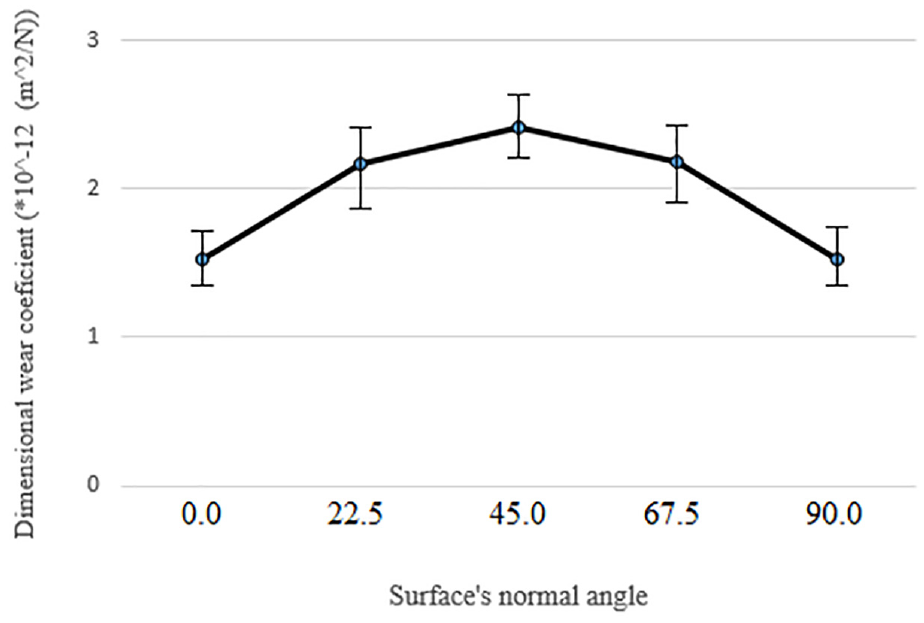
Dimensional wear coefficient (k/H) values as a function of the surface’s normal angle.
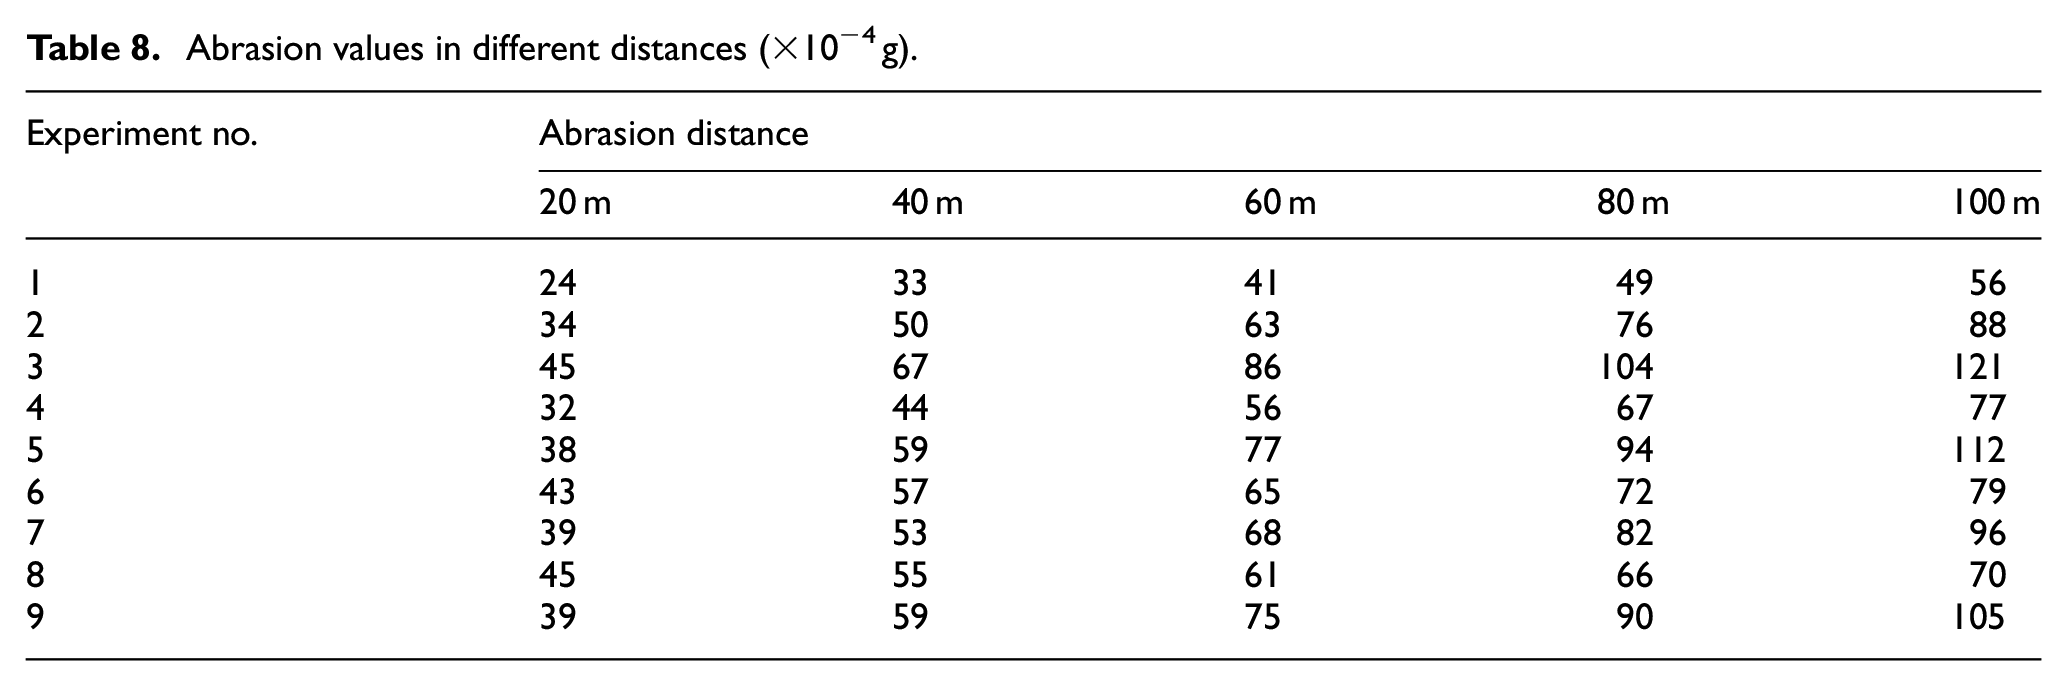
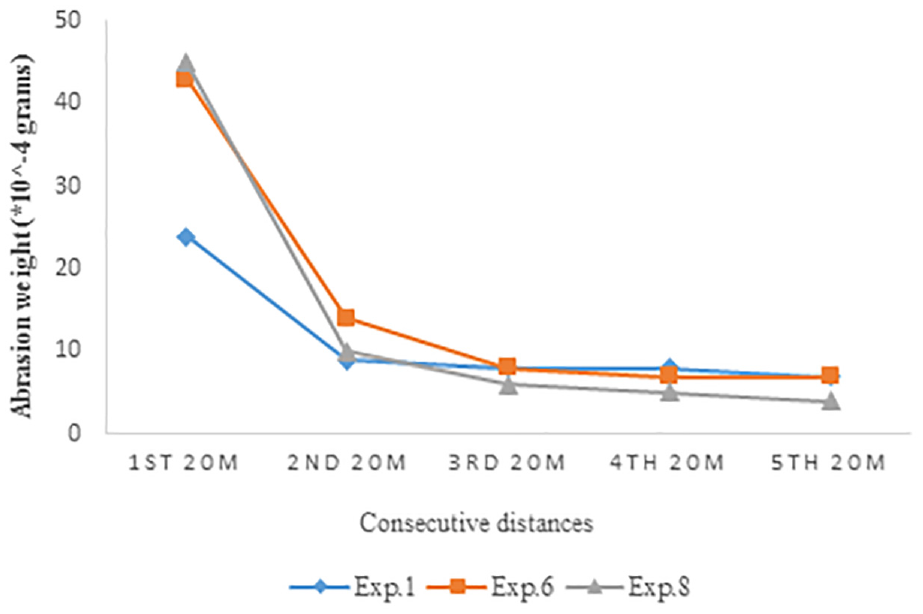
By calculating the difference in abrasion values for the consecutive distances presented in Table 8, the amount of abrasion can be calculated at the first, second, third, fourth, and fifth 20-m distance. (For example, the difference in abrasion values in the 20 and 40-m distances provides the abrasion value in the second 20-m distance.) Figures 9 to 11 show the results of these calculations. Given these figures, it becomes obvious that the abrasion rate is high at first 20-m distance but gets approximately constant at other 20-m distances. In the other words, these charts don’t show significant changes in different 20-m distances. The reason for these results can be that asperities of abrasive surface have been worn at the first 20-m distance and abrasive surface becomes smoother.
Abrasion values in different distances (×10−4 g).
Abrasion values at consecutive distances with a load of 30 N.
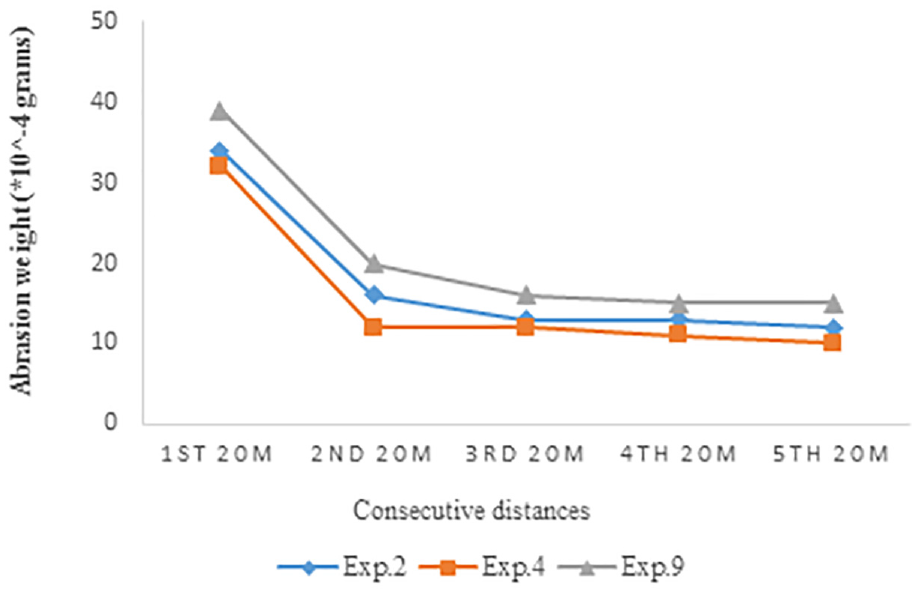
Abrasion values at consecutive distances with a load of 40 N.
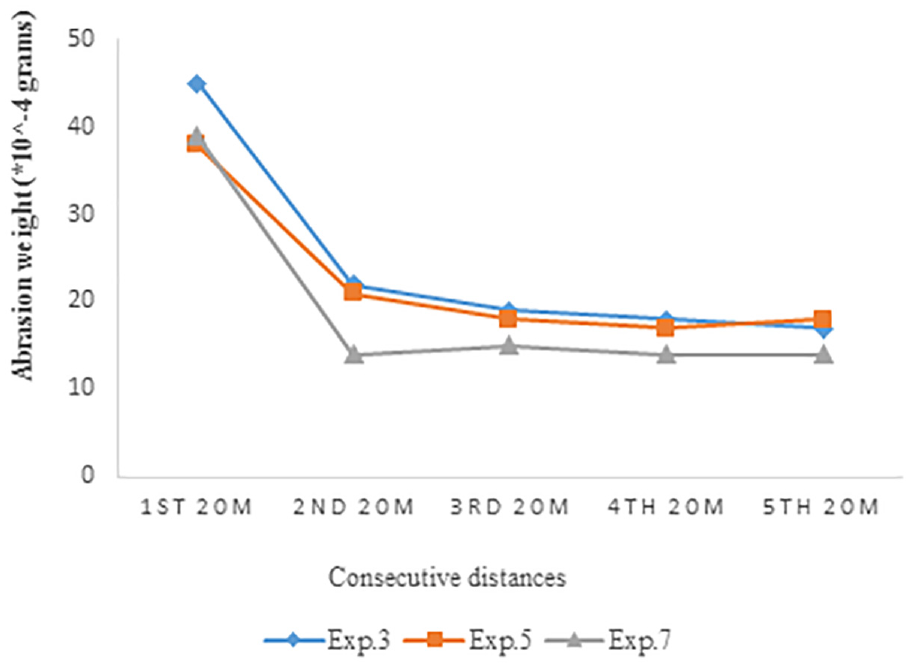
Abrasion values at consecutive distances with a load of 50 N.
By comparing Figures 9 to 11, it is evident that as the force increases, the rate of elimination of asperities increases. For example, when the force is 30 (N), the line in the chart between second and third 20-m distances is steep but when the force is 50 (N) the line is low slope. The abrasion weight for the rest of the graphs are approximately constant at different surface’s normal angle. In the other words, these graphs don’t show significant changes for different surface’s normal angle after elimination of asperities. These results confirm that the angles of surface asperities have a very significant impact on the amount of abrasion. On all charts, the abrasion curve becomes almost horizontal after a certain distance; but the abrasion value is different at different loads. Regardless of the shape of asperities, the abrasion value increases with increasing the force.
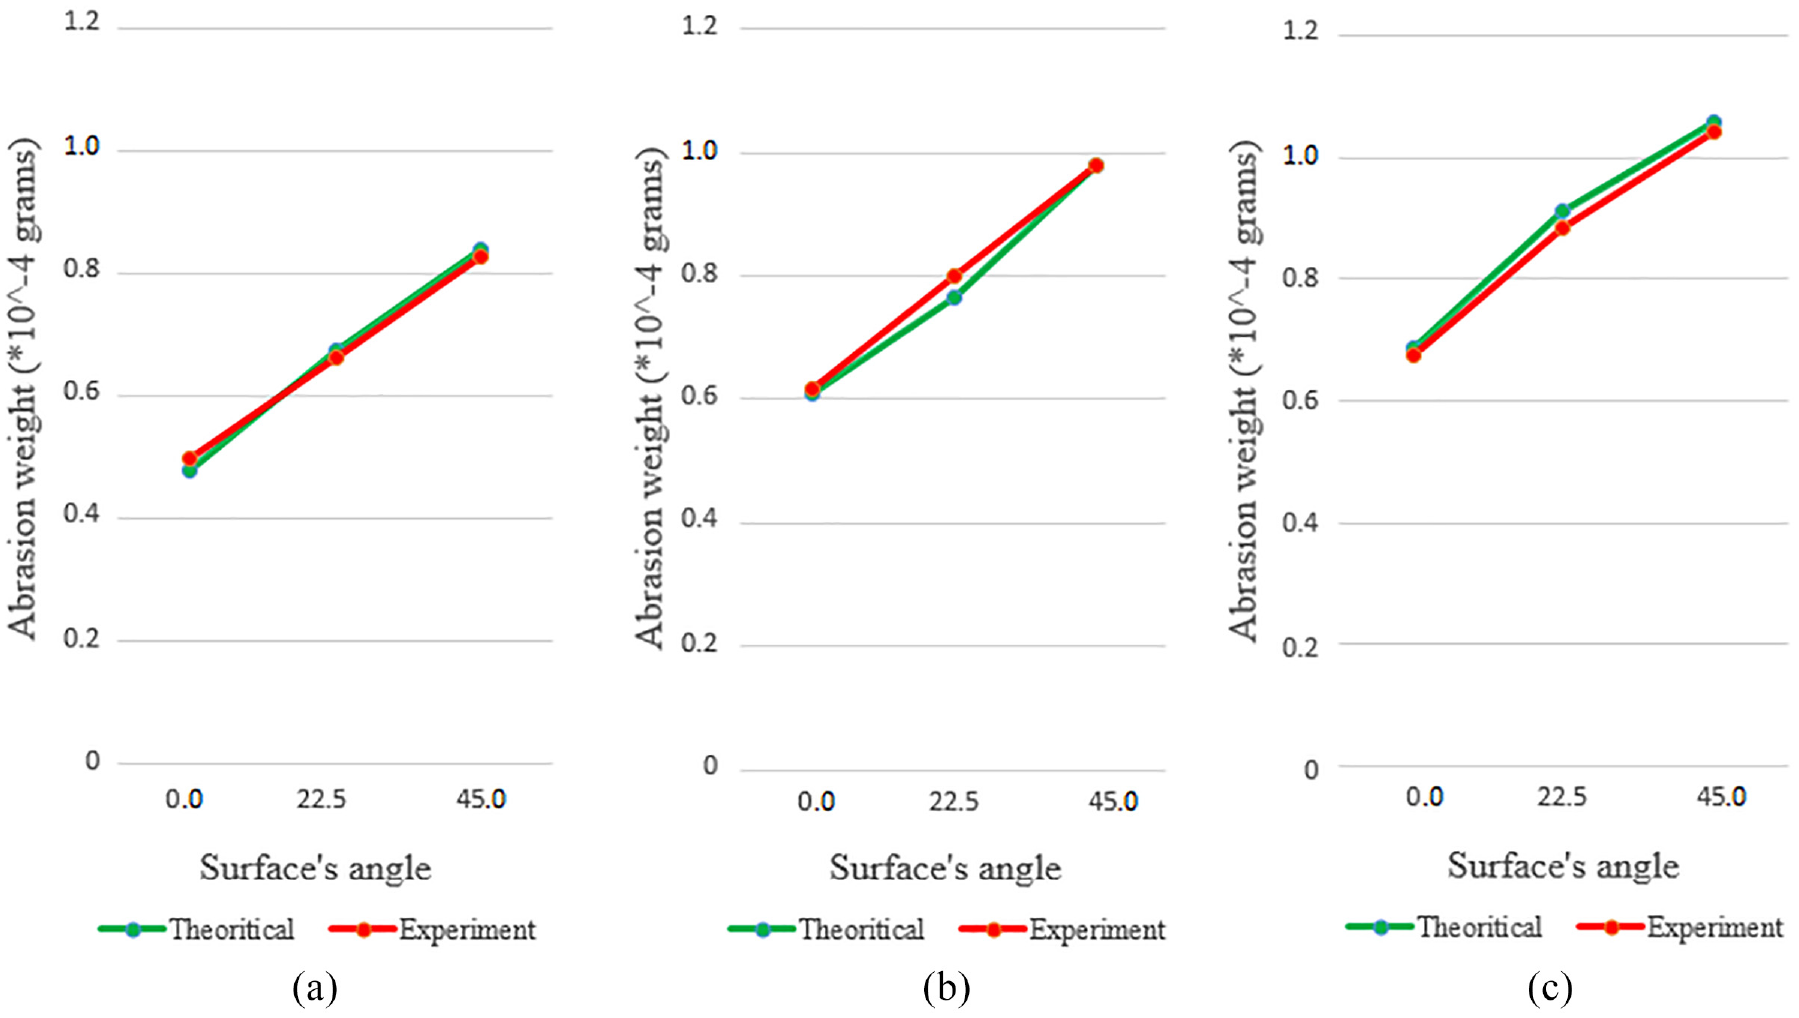
Figure 12 shows comparison between theoretical and practical results at different loads. Given this figure, it turns out that the results of practical experiments are very consistent with theoretical results. it can be concluded that surfaces with an exact or approximate normal angle of
Comparison between theoretical and practical results: (a) W = 30 N, (b) W = 40 N, and (c) W = 50 N.
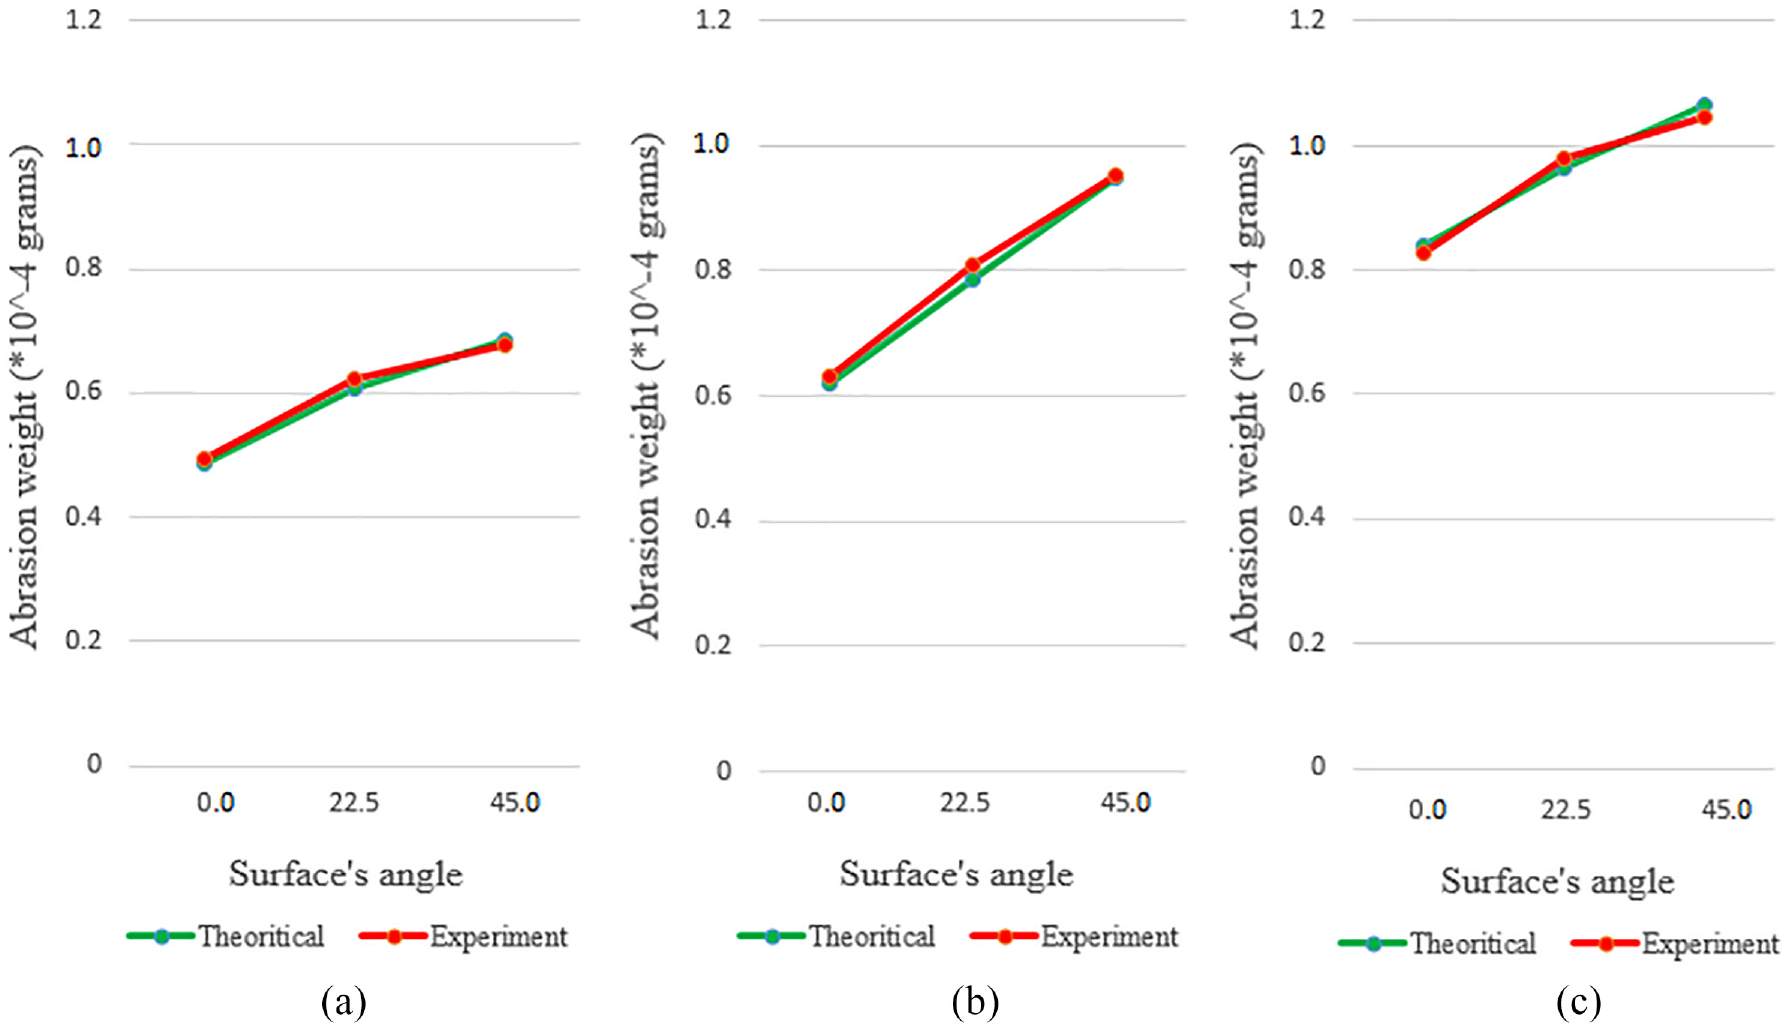
Figure 13 shows comparison between theoretical and practical results at different surface’s normal angle. Given the considerable adaptation of theoretical and practical results, it can be concluded that the abrasion weight increases linearly as the normal load increases. As evident from the charts, the gradient of the graphs is independent of the surface’s normal angle. Referring to the equation (11), the cause is apparent. The research of Naiju et al. 13 is the only research that has been ever done on the abrasion resistance of AM parts using pin-on-disc method, whose results confirm the linear relationship between load and wear rate.
Comparison between theoretical and practical results: (a) β = 0, (b) β = 22.5, and (c) β = 45.
Measurement of surface roughness
Over the years, hundreds of roughness parameters have been suggested. Taylor Hobson Ltd (THL) lists 24 parameters that are commonly used by industry.
34
Of these parameters, two cases have been investigated in this research: (1) The root mean square (RMS) parameter (Rq) is one of the sample length average parameters. It is defined in ISO 4287 (1997) as the root mean square deviation of the assessed profile. The RMS parameter is statistically significant because it is the standard deviation of the profile about the mean line; (2)
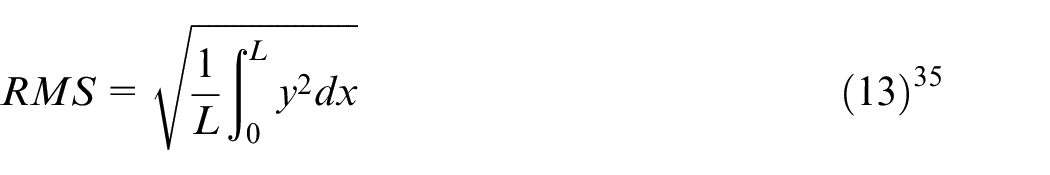
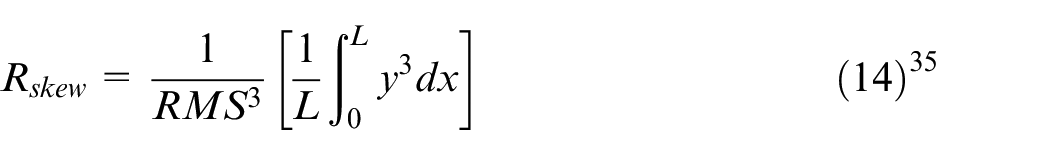
Where L is sample length and y is ordinate height. Before and after the tests, these two surface roughness parameters for the specimens was measured using a Taylor Hobson Form Talysurf to determine the roughness of the contacting part of the disc and pin specimens. The average values of RMS and
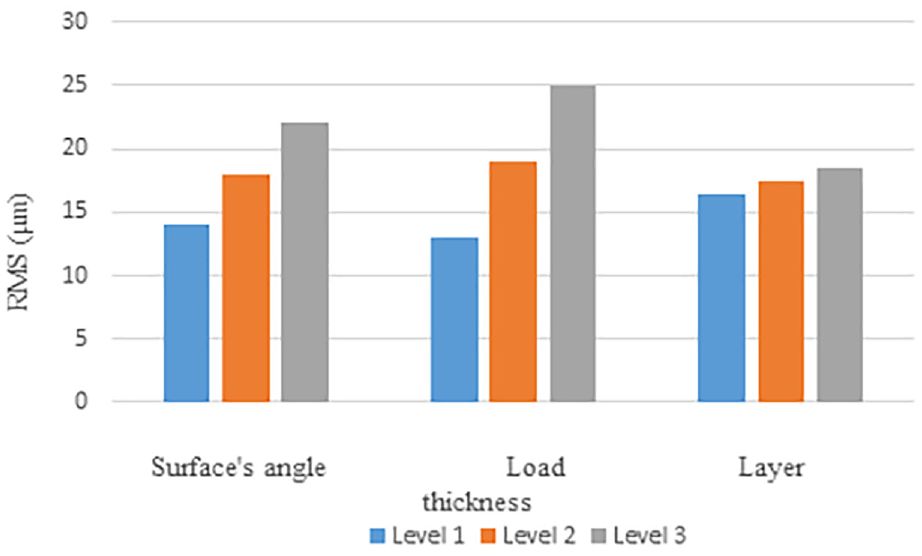
RMS of disc’s surface after abrasion test.
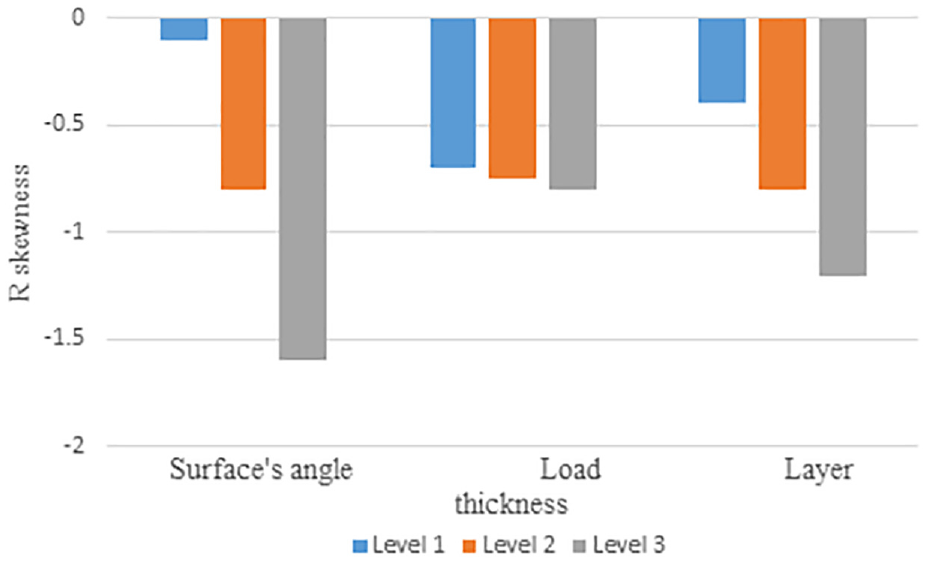
Figure 14 indicates that as the surface’s angle rises from 0° to 45°, the RMS value increases. When the value of the surface’s angle is 0°, the abrasive surface of the pin does not have asperities due to the stair-step effect. When this angle increases, the asperities become larger, which can increase the surface roughness. It is also clear that, with increasing load between the two surfaces under wear, more rough surfaces are obtained. As the right diagram of Figure 14 shows, the layer thickness does have significant effect on the RMS value, because with the increase in layer thickness, the number of asperities in a certain length decreases, but instead they grow larger. Therefore, RMS does not change significantly with layer thickness.
Figure 15 indicates that surface’s angle has the greatest impact on
Abrasion appearances
Figure 16 represents micrographs regarding the abrasion scars of the pin specimens on the disk specimens, obtained in a magnification of 200×. Grooves parallel to the moving direction of the pin appear in the abrasion scar. It is to be noted that the number of grooves and the scratches per unit length on the disk in the radial direction increases when surface’s normal angle of the pin approaches
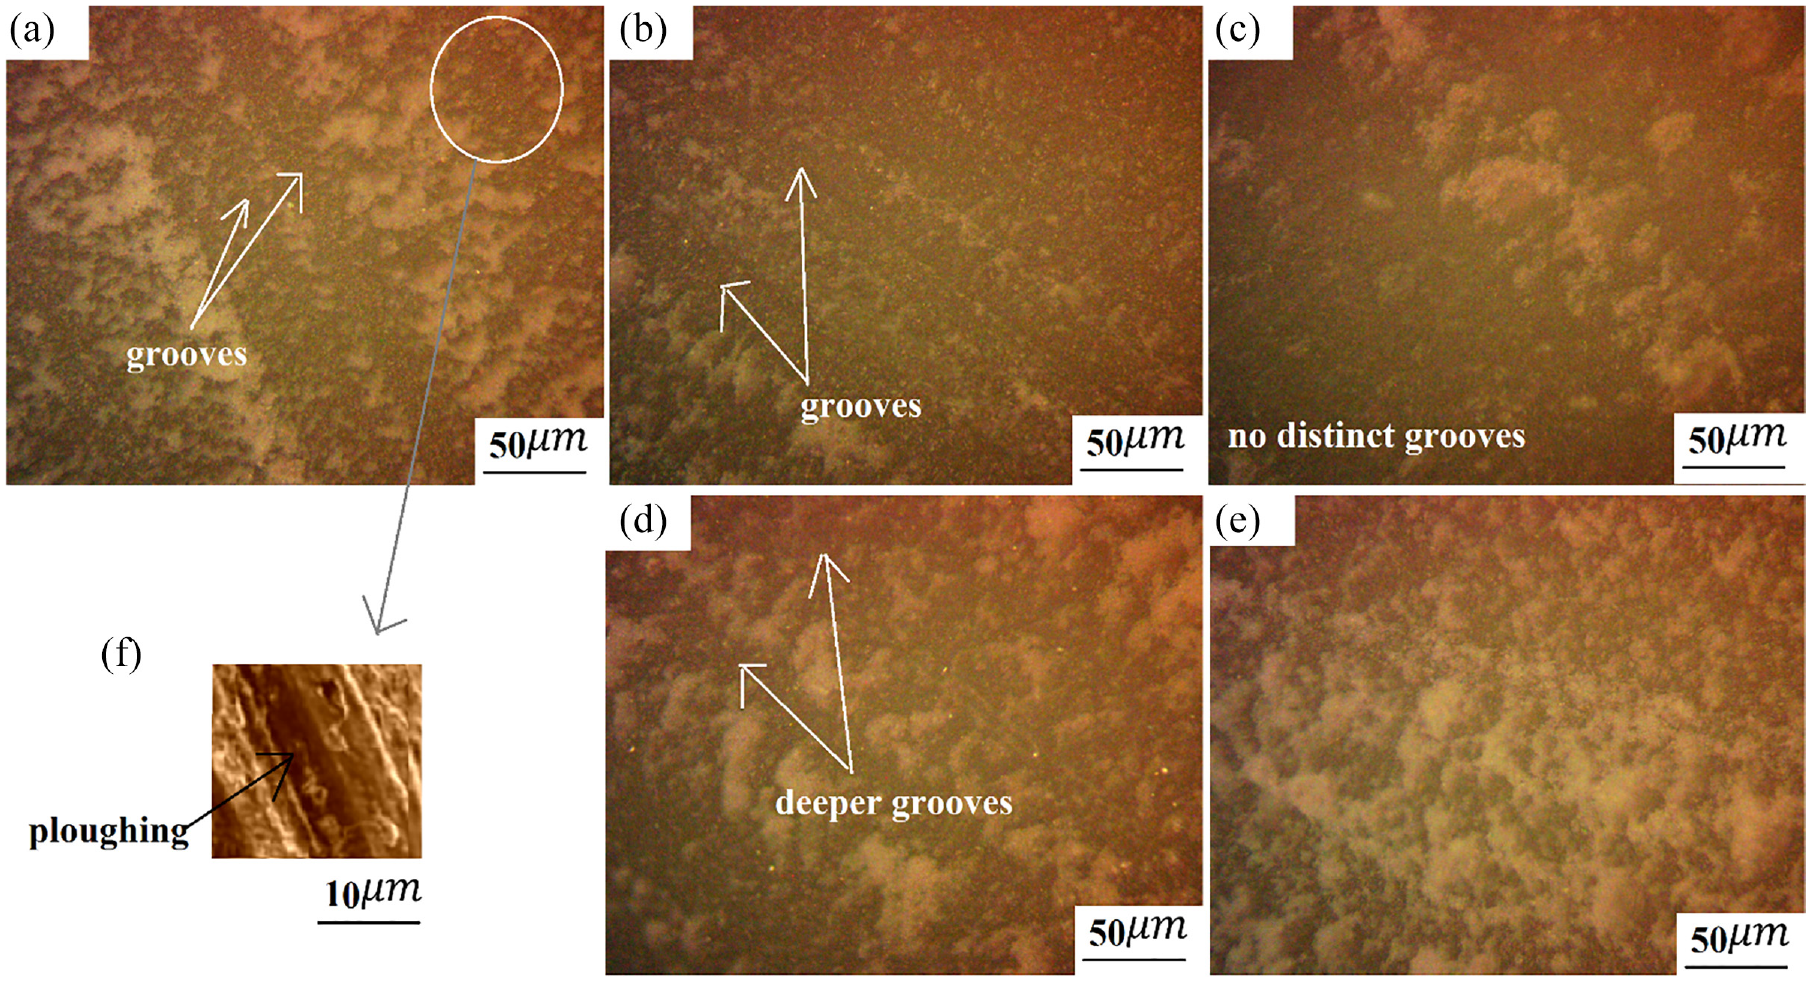
Micrographs obtained in a magnification of 200× of the abrasion scars of the pin: (a) Exp.6, (b) Exp.8, (c) Exp.1, (d) Exp.5, and (e) Exp.7. (d) An isolated abrasion scar on the abraded surface (1000×).
Micrographs show the material is pushed primarily to the sides of the grooves, so a wedge is formed on the sides and in front of the scratching asperities. For the
Optimization of fabrication orientation
Among the parameters that were identified as an effective parameter on abrasion rate (surface’s normal angle and normal load), surface’s normal angle can be completely controlled; but the normal load depends directly on the functional conditions of a part. Thus, it is possible to identify surfaces that will be exposed to friction and relative motion with other components. After determination of such surfaces, it is possible to determine the orientation of fabrication of the piece on the platform of the DLP device so that these surfaces have an optimized angle. The purpose of this section is to find the optimum orientation of fabrication for this purpose automatically using a PSO algorithm. This optimization algorithm rotates the part to achieve the optimum fabrication orientation.
Rotation of components
Different fabrication orientations of each component are achieved by rotating them about the X and Y axes. The orientation which generates optimum objective function value, as per equation (1), is selected as the best orientation. Components are rotated with the angles of δα and δβ about the X and Y axes respectively. The matrix of transformation is as equation (15).
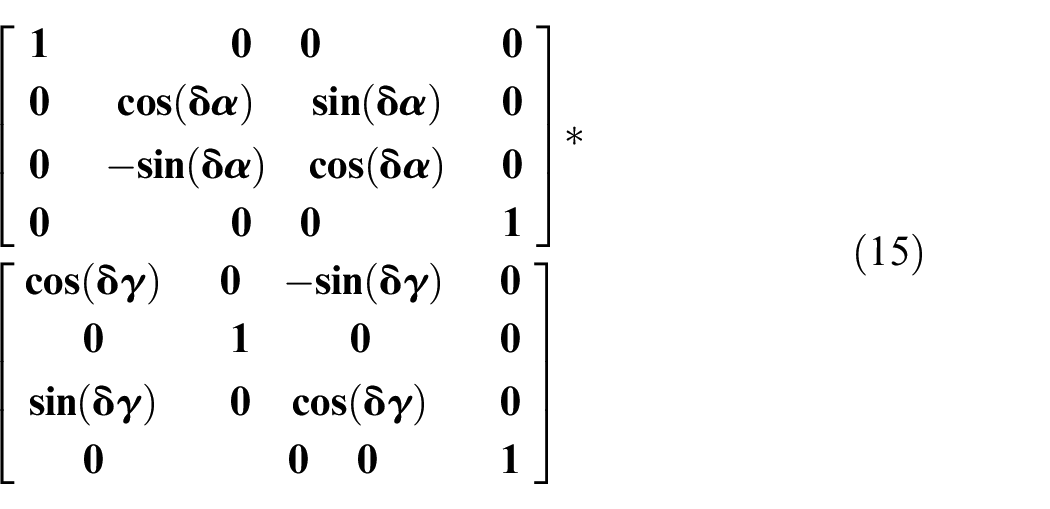
Therefore, the coordinates of each vertex are transformed utilizing this matrix. Decision variables to select the optimal fabrication orientation of segments are
Particle swarm optimization
Particle swarm optimization is a population-based stochastic optimization technique inspired by social behaviour of bird flocking or fish schooling. 36
PSO shares many similarities with evolutionary computation techniques such as Genetic Algorithms (GA). The system is initialized with a population of random solutions and searches for optimum by updating generations. However, unlike GA, PSO has no evolution operators such as crossover and mutation. In PSO, the potential solutions, called particles, fly through the problem space by following the current optimum particles. 37 All of the particles have fitness values which are evaluated by the fitness function to be optimized and have velocities which direct the flying of the particles. The particles fly through the problem space by following the current optimum particles.
In every iteration, each particle is updated by following the two “best” values. The first one is the best solution (fitness) it has achieved so far. The fitness value is also stored. This value is called p-best. Another “best” value that is tracked by the particle swarm optimizer is the best value, obtained so far by any particle in the population. This best value is a global best called g-best. After finding the two best values, the particle updates its velocity and positions by following equations (16) and (17), respectively.
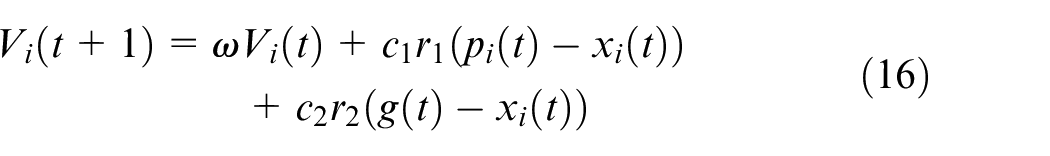

Where, V is the particle velocity, i is particle number,

Flowchart of the presented pseudo algorithm.
Now, the model that was developed in “abrasive wear modeling” section should be written comprehensibly for the PSO algorithm. The PSO algorithm is written in SOLIDWORKS’s Visual Studio Tools for Application environment using C# language. This tool of SOLIDWORKS software allows the user to achieve values of some geometric characteristics of the model, such as the faces’ normal vector and volume of a body, with a series of simple commands. With these interpretations, the objective function will be as follows.
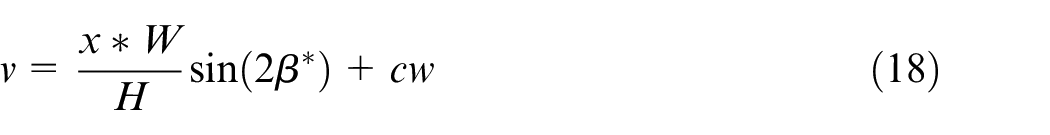
In equation (18),
In equation (19),
Case study
In order to verify the performance of the proposed algorithm, the part shown in Figure 18(a) is considered in this research. The criteria for selecting a model for the case study were that the selected model had flat and curved surfaces of varying normal angles. There are one curved and seven flat surfaces in this model. It is assumed that all surfaces will be under abrasion condition. The proposed algorithm suggested that these part should be printed in the orientation illustrated in Figure 18(b). Using the proposed algorithm, the average of surfaces’ normal angle is optimized. The calculations based on equation (11) show that if it is assumed that the performance conditions of this model are exactly the same as the abrasive tests (hardness = 85 D, load = 40 N, and layer thickness = 0.1 mm) in orientation shown in Figure 18(a) the abrasion rate would be 0.891 (
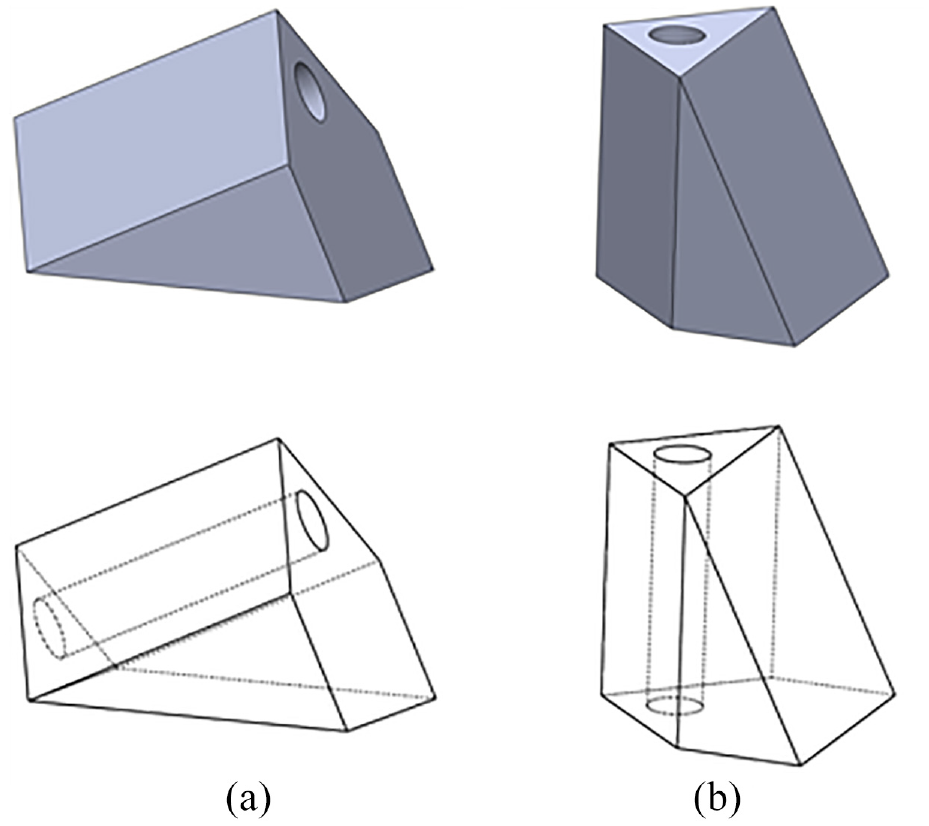
(a) The part selected for case study and (b) fabrication orientation suggested by the algorithm.
Conclusion
The most influential parameters on the abrasion rate of Digital Light Processing parts was normal load followed by surface’s normal angle. Results showed that abrasion value increased linearly with increasing normal load. On the other hand, the maximum value of abrasion occurs when the surface’s normal angle is
Analysis of variance method revealed that, load was the most affecting factor by 71.58% contribution percentage, followed by surface’s normal angle with 27.7%. It was found that layer thickness has almost no influence on the abrasion values because when layer thickness is higher, number of picks per unit length is lower but the value of load per each pick is higher. On the other hand, surface roughness tests showed that layer thickness had a great impact on the quality of the abraded surface. When the layer thickness is high, the abraded surface has deeper valleys, and thus has a more negative skewness.
For the same load value, it was revealed that the specimens tested with the surface’s normal angle of
Footnotes
Appendix
Declaration of conflicting interests
The author(s) declared no potential conflicts of interest with respect to the research, authorship, and/or publication of this article.
Funding
The author(s) received no financial support for the research, authorship, and/or publication of this article.