
Abstract
Performance analysis, which plays a key role in the design stage, is employed to estimate whether product performance can satisfy design requirements. In general, product performance is gained after parts are assembled; product performance is influenced by the position and orientation deviations (PODs) that occur in directions of the constrained degrees of freedom (DOFs) due to the surface deviations of mating-surfaces. Furthermore, PODs are uncertain because the surface deviations as well as positions in the unconstrained DOF directions can vary randomly. Thus, predicting the consequences of uncertain PODs on product performance is key for performance analysis. Considering that planes are extensively used in assemblies, this study aims to propose a statistical approach to analyze the uncertain PODs of non-ideal planes. A modeling method from the perspective of manufacturing errors is employed to describe the uncertain surface deviations. A method for computing the uncertain PODs based on the progressive adjustment of coordinate systems is proposed. The maximum PODs that characterize the most unfavorable assembly situation are determined as evaluation indicators. Finally, the effectiveness of the presented approach is verified by a case study. Because both the effects of uncertain surface deviations and uncertain positions on PODs can be considered, the approach is expected to help predict the practical effects of uncertain PODs on product performance accurately during the design stage.
Introduction
Surface deviations, which inevitably occur on manufactured parts, can lead to deviations in the position and orientation between two assembled parts, which directly affect product performances.1,2 For instance, the performance of machining accuracy of the horizontal machining center is directly affected by the position and orientation deviations (PODs) generated after column and base mating-planes are assembled.3,4 Thus, the effects of PODs on product performance need to be studied by analyzing the performance at the design stage.
PODs emerge along the directions of the constrained degrees of freedom (DOFs) after two mating-surfaces are assembled because the surface deviations at the contact points are different. Furthermore, if surface deviations or positions in the directions of the unconstrained DOFs are changed, the contact points will be substituted by new ones and result in new PODs. Surface deviations are random because of the random errors generated during the manufacturing process, and the positions can still vary randomly in the directions of the unconstrained DOFs after mating-surfaces are assembled. Therefore, the PODs are uncertain because surface deviations as well as positions change randomly.
To analyze the PODs and their uncertainties, an assembly of Part A and B is illustrated in Figure 1. As shown in Figure 1(a), even though three DOFs (one translational DOF along the Z-axis and two rotational DOFs along the X- and Y-axes) are constrained after assembling ideal Part Ai and Bi by the mating-planes, PODs are non-existent because the mating-planes do not undergo deviation under the ideal circumstances. In contrast, surface deviations become inevitable in actual manufactured parts. Because of the surface deviations of mating-planes, the three DOFs will be constrained via at least three non-collinear contact points. Additionally, the deviations at the contact points are different. Thus, as shown in Figure 1(b), PODs occur. Furthermore, random manufacturing errors make the surface deviations uncertain even under the same manufacturing conditions. Thus, different PODs, as shown in Figure 1(c), might emerge after Part
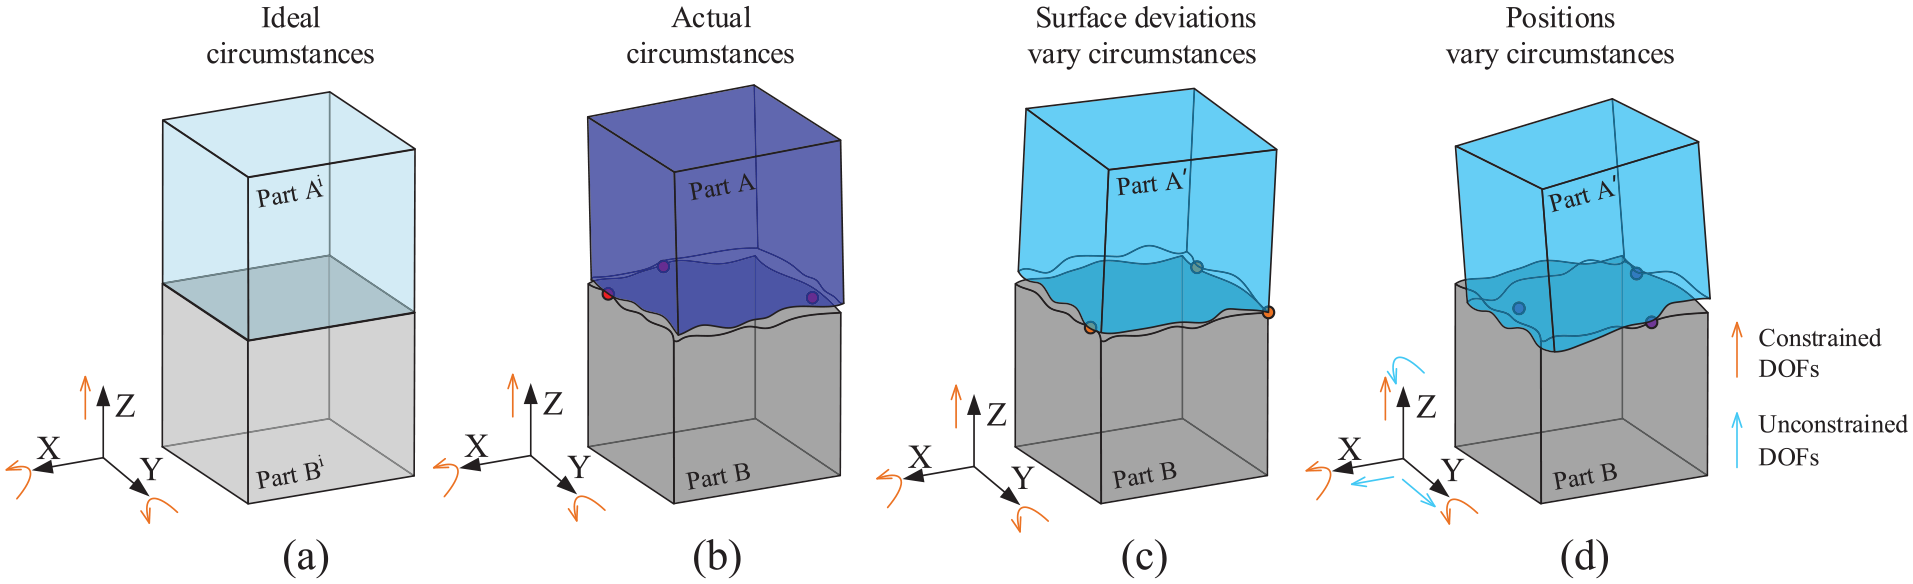
PODs generated after the mating-planes of two parts are assembled.
To make the predicted effects of uncertain PODs on product performance consistent with the actual situation, PODs should be analyzed under conditions in which surface deviations and positions between the assembled parts randomly vary. Li and Roy 5 computed the position and orientation between two polyhedron parts using translational and rotational constraints. The uncertain surface deviations were described by the small displacement torsor (SDT) model, and the random positions were described using coefficients of the constrains.6,7 Ostrovsky-Berman et al. 8 proposed a tolerance model of control points from boundary curves of the mating-surfaces to express the surface deviations and showed how to determine the position and orientation between two assembled parts using the functions that express the distances between control points. The uncertainty of surface deviations and positions were characterized through the randomness of the control points. The studies listed have proposed several effective methods for analyzing PODs considering the uncertain geometric deviations and the positions between assembled parts. However, the employed tolerance models are modeled using parameters in the tolerance zone (e.g. SDTs or coordinates of the control points); they simplify the uncertain non-ideal surfaces within the same tolerance zone to the ones with ideal geometry and consequently fail to describe the morphologies of non-ideal surfaces. Furthermore, different surface morphologies can lead to different PODs. Therefore, tolerance-model based POD analysis cannot determine the effects of surface morphologies, which will make the analysis results differ from the actual situation.
Aiming to acquire practical outcomes of POD analysis, surface deviation models have been progressively employed to describe that morphologies of the manufactured surfaces. When performing POD analysis, deviation models are established in the first place for the random surface deviations. For instance, skin model shapes (SMSs)9,10 are generally employed, using which the uncertainty of surface deviations can be characterized by random deviations that can be modeled by Gibbs sampling or random fields.11,12 Modal decomposition technologies13,14 can be employed as well; using such methods, uncertain surface deviations can be obtained by randomly generating the proportionality coefficients of deterministic multi-modal shapes, which are generally achieved by finite element analysis (FEA)15,16 or discrete cosine transform (DCT).17,18 The main reason for the uncertainty of surface morphologies is the random variations of manufacturing errors over the machining process. However, it is difficult to understand the impacts of different manufacturing errors on surface deviations of manufactured surfaces using the aforementioned deviation models. Qiao and Wu19–21 established a modeling method from the perspective of manufacturing errors using which surface deviations caused by manufacturing errors can be conveniently modeled via deviation functions.
How to compute the uncertain PODs is a key issue for POD analysis based on non-ideal surfaces. Several effective computing methods have been proposed that determine the contact points between two mating-surfaces. 22 For instance, the iterative closest point method, 23 the linear complementarity condition based model of quadratic linear optimization, 24 and the difference surface method. 13 Using these methods, uncertain PODs can be computed only when the effects of random surface deviations are considered. Nonetheless, not only the variations of surface deviations can lead to uncertain PODs but the positions also have impacts on the PODs because of the inherent uncertainty during assembling. Furthermore, if the uncertain positions are considered when computing PODs, the correspondences between the points on mating-surfaces will change. However, all computing methods mentioned above cannot analyze this problem because a necessary condition for their application is that the points on mating-surfaces should be corresponding to each other. Thus, how to compute PODs considering the effects of uncertain surface deviations and positions is still a key issue for POD analysis based on non-ideal surfaces.
Evaluating the impacts of uncertain PODs on product performance is the last procedure of POD analysis, and some statistical indicators are employed in general. For instance, assembly clearance is considered by some researchers 22 because it is a key performance requirement of product design and is directly influenced by PODs. The probability of the PODs outside the functional requirement domain, called the nonconformity rate, can be computed as well. 13 The smaller these indicators are, the better the product performance will be. During the design stage, the range of position and orientation between assembled parts will be restricted to control the product performance. If the maximum PODs that characterize the most unfavorable position and orientation between assembled parts can meet the design requirements, the other uncertain PODs can meet the design requirements consequently. Therefore, the maximum PODs can be employed as indicators. Furthermore, they can be obtained easily and make the evaluation convenient.
As is shown, the influence of uncertain surface deviations and the positions between two assembled parts should be considered when predicting the effects of uncertain PODs on product performance. However, if non-ideal surfaces are employed in this type of POD analysis, two issues occur, which remain unsolved in existing literature.
The existing deviation models fail to describe the impacts of random manufacturing errors on the morphologies of the manufactured surfaces.
The existing methods for computing the uncertain PODs can only consider the influence of uncertain surface deviation, but cannot consider the influence of uncertain positions.
Therefore, this study aims to establish a statistical analysis approach for uncertain PODs of non-ideal planes with respect to the wide application of planes in assemblies. The paper is organized as follows: the framework of the analysis approach for PODs is proposed in Section 2. Thereafter, how to establish surface deviation models and sample non-ideal planes and positions is introduced in Section 3. The method for computing uncertain PODs is introduced in Section 4. Section 5 presents how to determine indicators using statistical analysis. In Section 6, a case study is described to verify the proposed approach. Finally, the conclusions are detailed.
Monte Carlo sampling-based analysis approach framework for PODs
To predict the effects of uncertain PODs of non-ideal planes on product performance, a statistical analysis approach is proposed, and its framework is shown in Figure 2. Random surface deviations and positions between two assembled parts, which act as inputs, are acquired through the Monte Carlo sampling method. And the uncertain PODs are computed based on these inputs. After sampling and computing multiple times, statistical analysis of PODs is performed to obtain the maximum PODs.
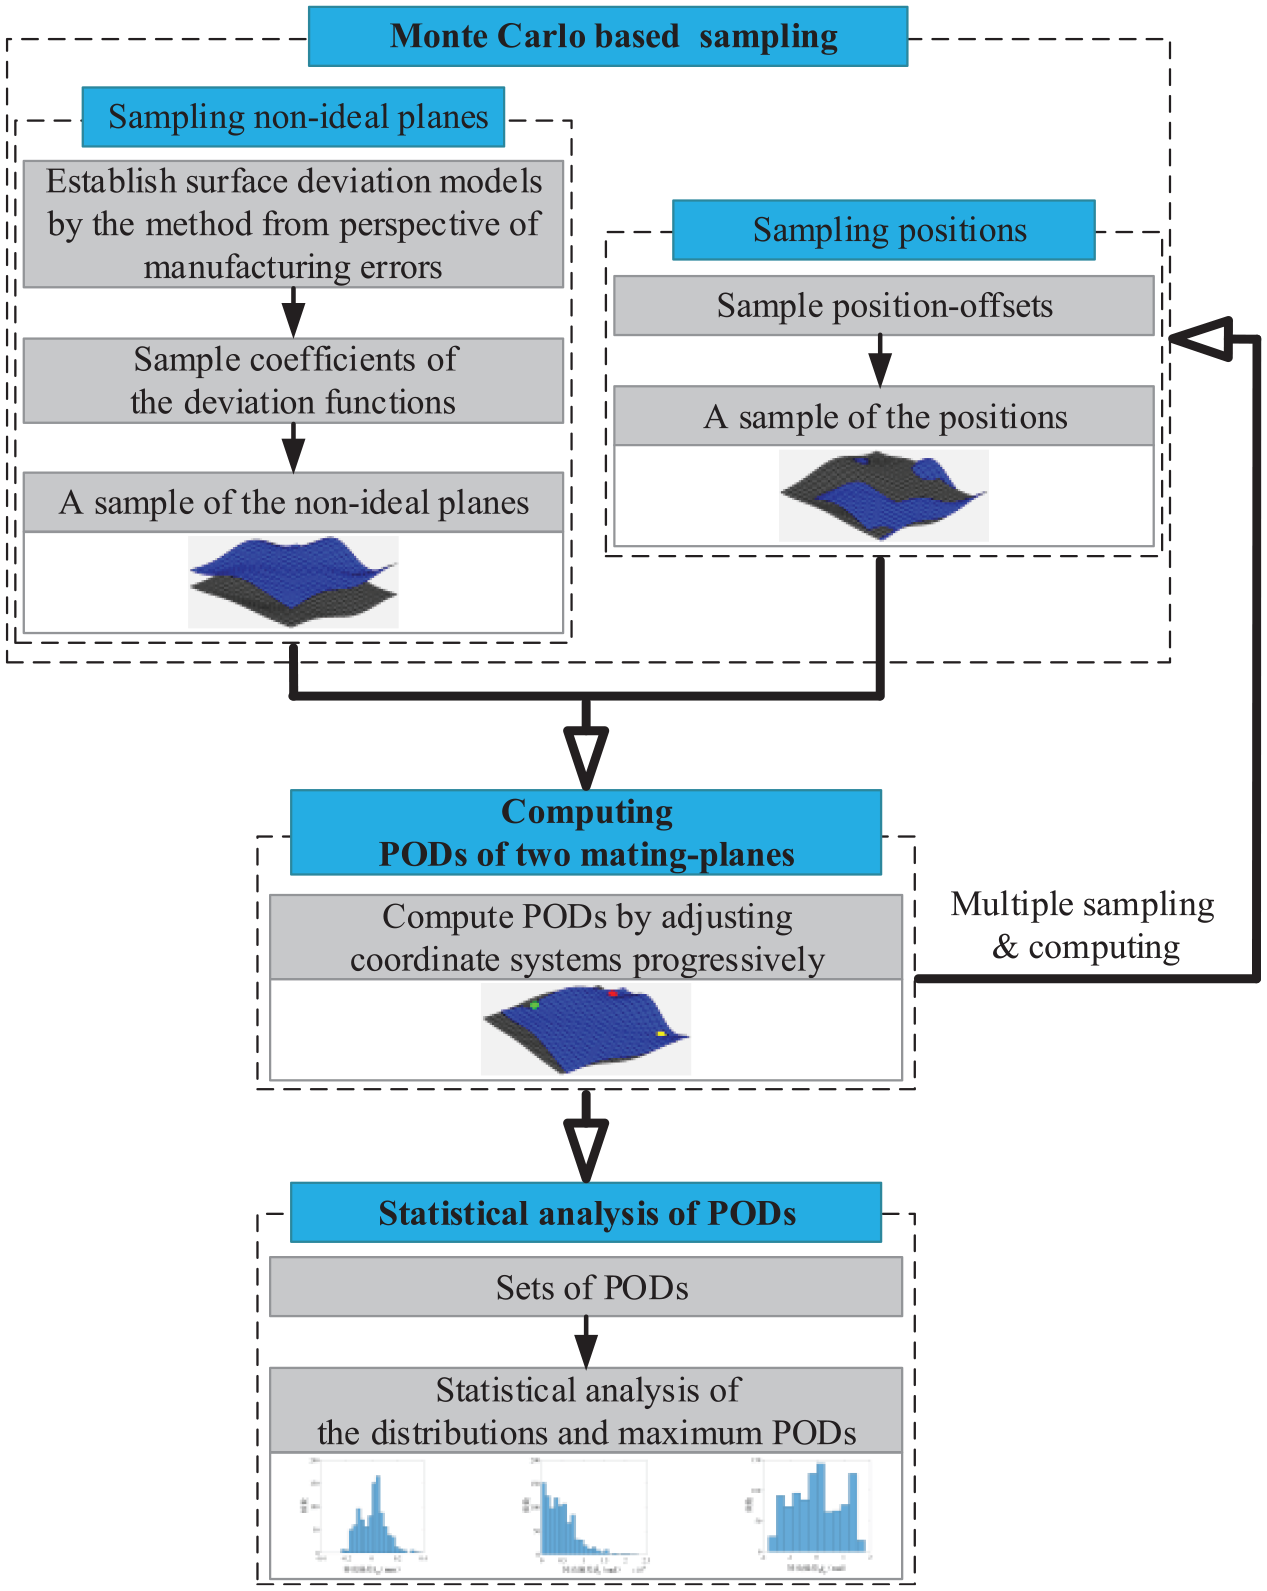
Framework of the Monte Carlo sampling-based analysis approach for PODs.
The specific procedures of the approach framework are as follow:
Monte-Carlo based sampling
For sampling non-ideal planes, surface deviation models should be established first. To describe the impacts of different manufacturing errors on the non-ideal planes conveniently, a modeling method from the perspective of manufacturing errors is employed. Based upon this type of deviation model, surface deviations are expressed using deviation functions established in the deviation coordinate system (DCS). Consequently, the uncertainty of the surface deviations can be characterized by the uncertain coefficients of deviation functions. Therefore, to obtain a sample of non-ideal planes, the coefficients should be sampled according to their distributions. The positions are directly determined by the position-offsets corresponding to the three unconstrained DOFs. Thus, to acquire a sample of positions, these position-offsets should be sampled within their allowable ranges. And Monte Carlo sampling method is employed because it has been widely used to analyze assembling issues. For example, Monte Carlo sampling was employed to generate geometric deviations of mating-surfaces in researches focusing on assembly simulation.25,26,27
Computing PODs by adjusting coordinate systems progressively
The method to represent the PODs should be determined before computing. Here, the position and orientation between two part define coordinate systems (PDSs) within the view coordinate system (VCS) are employed. To acquire the position and orientation between two PDSs after assembly, three non-collinear contact points between two mating-planes are identified by adjusting one of the PDSs progressively. Thereafter, PODs are determined by computing the deviations of the position and orientation between the two PDSs along the three constrained DOFs.
Statistical analysis of PODs
Among the uncertain PODs, the maximum ones characterize the most unfavorable position and orientation between assembled parts and will be employed as evaluation indicators. To determine the maximum PODs, statistical analysis of the uncertain PODs are performed. First, sets of PODs are obtained through multiple cycles of sampling and computing. Depending on the numerical statistics of the data in these sets, the maximum PODs and distribution regulations are acquired.
Based on the analysis approach framework for uncertain PODs, three key issues involved were analyzed, which will be discussed in detail in the following sections.
Sampling non-ideal planes and positions
Establishing surface deviation models
Establishing surface deviation models, which is one of the foundation tasks, should be performed before sampling non-ideal planes. During the design stage, surfaces are nominal without any deviation for defining the geometric shapes of a part. Thus, they can be called ideal surfaces. Furthermore, because of the inaccuracy of machining, points on manufactured surfaces deviate from the corresponding points on the ideal surface, which make the manufactured surfaces have non-ideal morphologies. Consequently, they are called non-ideal surfaces. As an example shown in Figure 3, three arbitrary points (
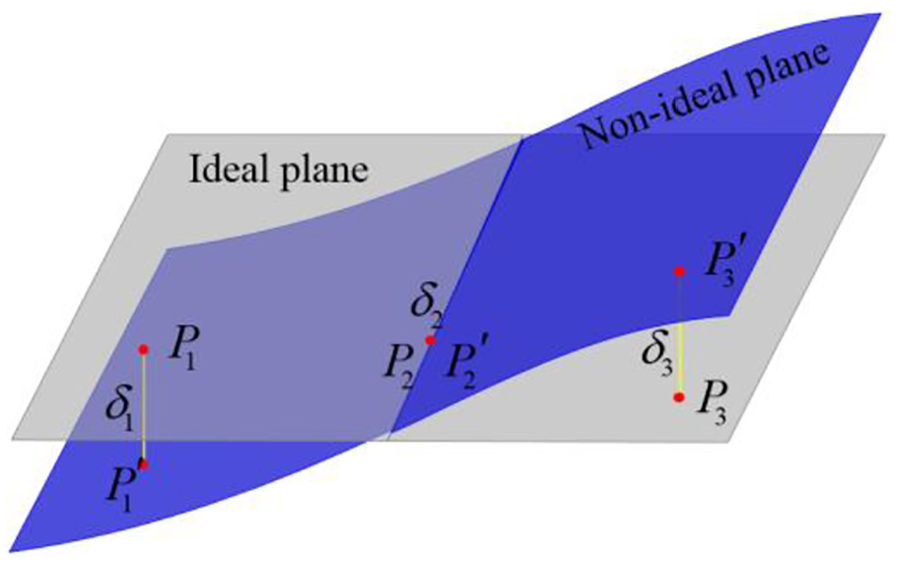
Relation between non-ideal and ideal planes.
In this modeling method, a new three-dimensional coordinate system, called the DCS, is established. In the DCS, two coordinates are defined as two tracks in the directions of the cutting tool in motion, and they are employed to describe the points on the ideal surface. The third coordinate is added to the two coordinates of an arbitrary point on the ideal surface in the orthogonal direction, the value of which equals the deviation between the nominal surface point and the corresponding point on the non-ideal surface. By utilizing DCS, surface deviations of a random manufactured error i can be expressed as a function of the coordinates of the points on the ideal surface. The function, called the deviation function, can be expressed as

where
Because the total-surface deviations of a non-ideal surface are the results of combining the impacts of various manufacturing errors, a deviation model of a non-ideal surface can be established by accumulating various deviation functions, which can be expressed as
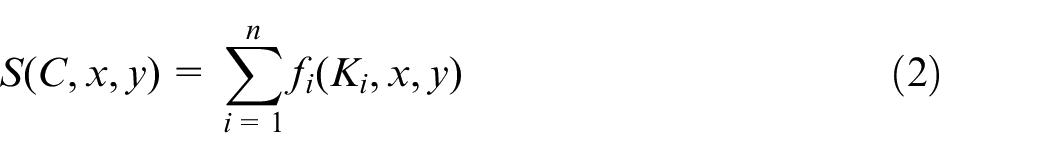
where S represents the total-deviation function, and n represents the number of manufacturing errors. C represents the coefficients set of S, and
Sampling non-ideal planes
When sampling non-ideal surfaces, characterizing the uncertainty of surface deviations using a deviation model is important. Based on equation (2), a certain non-ideal surface can be acquired with the forms and coefficients of the functions. For specific processing methods and environments, the type and number of the manufacturing errors are determined. Additionally, each type of manufacturing error corresponds to a certain form of the deviation function. Therefore, the form of the total-deviation function can be obtained, and the random manufacturing errors can lead to random coefficients of the total-deviation function; that is, the uncertainty of the total-surface deviations can be characterized by the randomness of the coefficients of the total-deviation function.
When sampling two assembled non-ideal planes, the sample consists of two total-surface deviations of non-ideal planes. For instance, if two total-surface deviations are denoted as
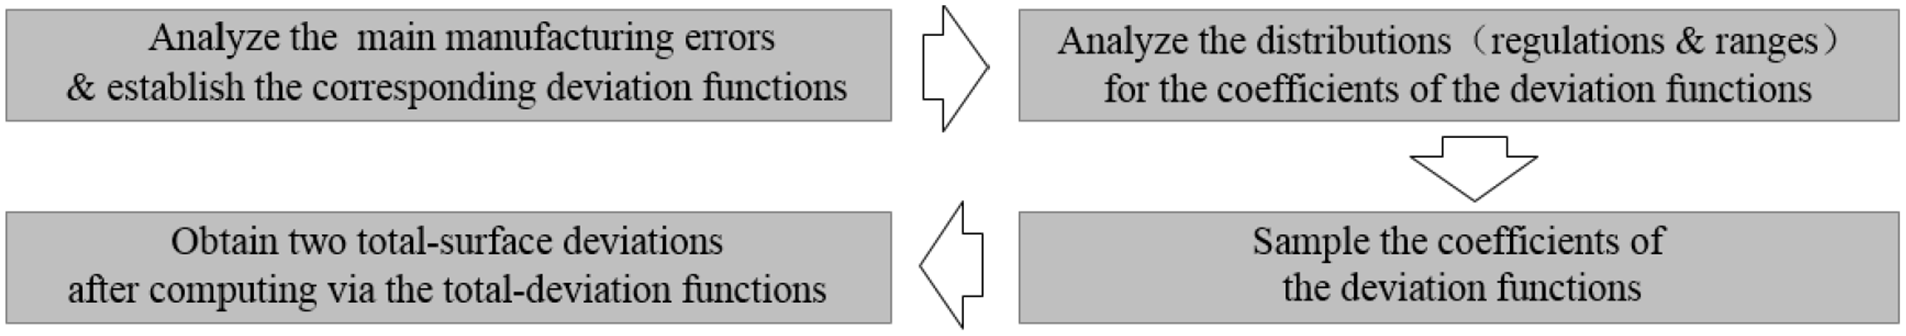
Process of generating the sample for two non-ideal planes.
First, the main manufacturing errors that affect the surface deviations of the non-ideal planes are analyzed, such that the deviation functions corresponding to manufacturing errors can be established. Next, the distributions (regulations and ranges) of these deviation function coefficients should be analyzed. The distributions can be obtained by analyzing the knowledge of typical processing technology or by experimentally measuring and analyzing a batch of manufactured surfaces. Next, continuous numbers within the ranges of coefficients should be discretized. Subsequently, corresponding sets of uniformly increasing numbers will be obtained. Next, according to the regulations, the coefficients of each total-deviation function are sampled by selecting numbers within the sets; these selected numbers are computed for each total-surface deviation of two non-ideal planes. Consequently, the sample for non-ideal planes can be obtained.
Sampling positions
Describing the positions between two assembled parts as well as their randomness is key to sampling positions. To express the positions, VCS and PDS are established; these coordinate systems belong to the Cartesian coordinate system. The position and orientation of a part as well as the positions between parts will be expressed in VCS. Part geometric shapes will be described using PDS, and they will be specifically expressed as composed geometric characteristics of a part, such as plane, cylinder, etc., as well as the relations between them. Note that data regarding geometric shapes of a part will never be changed with variations in the position and orientation of the part. For representing the position and orientation of a part, the coordinates of the PDS origin as well as the orientation of the PDS within the VCS will be required.
When describing the positions between two parts within VCS, one of the two PDSs should coincide with the VCS to simplify the process of description. The position and orientation of the other PDS within the VCS are used to express the required positions, and they are specifically represented as three coordinates of the origin,
Assume that Part A and B are assembled by mating-planes. The VCS is denoted as V, the PDS of Part A and B are denoted as PDa and PDb, respectively, and PDb coincides with V. Consequently, as shown in Figure 5, three DOFs of Part A are unconstrained after two parts are assembled, which are translational DOFs along the
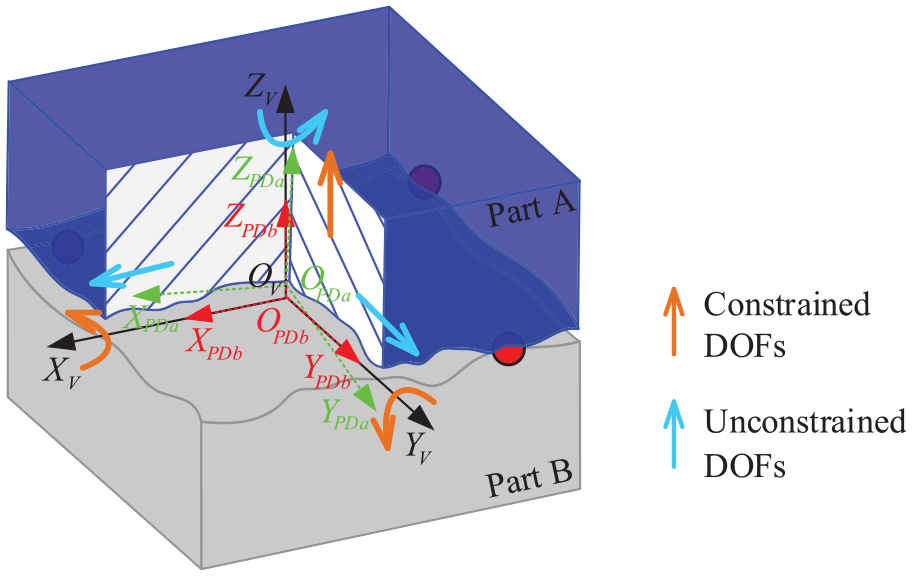
Relations between coordinate systems after Part A and B are assembled.
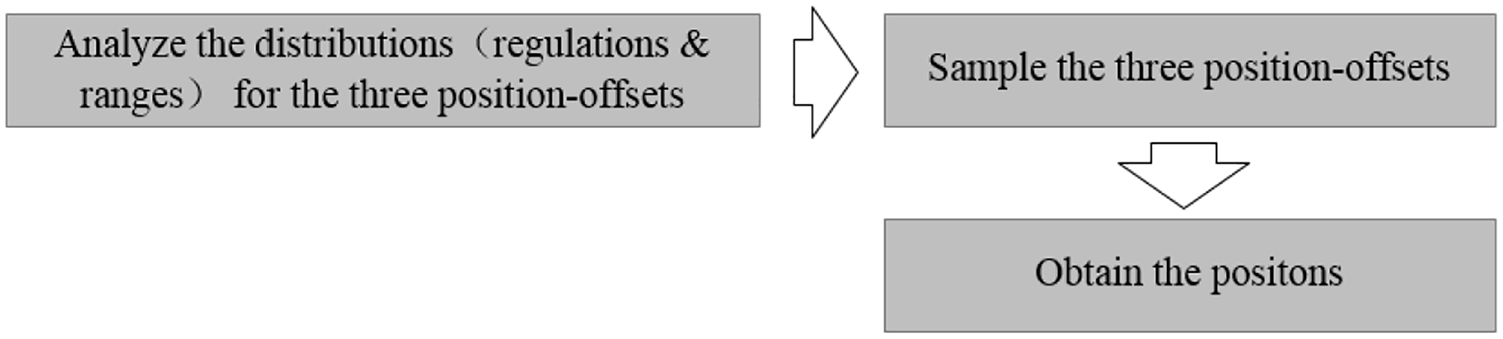
Process of generating a sample for the positions.
First, the distributions (regulations and ranges) of position-offsets are analyzed. Next, the regulations are determined by analyzing the knowledge of the assembly process or by analyzing the data of positions obtained by assembly experiments. The ranges of the position-offsets can be analyzed according to the actual assembling conditions. Next, continuous numbers within these ranges should be discretized. Subsequently, the corresponding sets of uniformly increasing numbers will be obtained. Finally, the sample for the positions will be acquired by sampling the position-offsets according to the set regulations.
Using the modeling method from the perspective of manufacturing, how to establish non-ideal plane models has been introduced in detail. A sample of uncertain non-ideal planes can be conveniently obtained by sampling coefficients of deviation functions established in DCS. Furthermore, a sample of uncertain positions can be acquired by sampling the offsets between PDS. Using these two types of samples as inputs, the uncertain PODs of non-ideal planes can be computed; the computing method is introduced in the following section.
Method of computing PODs of assembly of non-ideal planes
Representation of the PODs
The PODs express the position and orientation between two assembled parts. Consequently, they can be described by the position and orientation of two PDSs in VCS. For instance, after the non-ideal planes of Part A and B in Figure 5 are assembled, the position and orientation between the two assembled parts deviate from the ideal circumstance because of the surface deviations, expressed by one translational and two rotational deviations. Thus, these three deviations (called PODs) should be expressed by the position and orientation between PDa and PDb within V. However, note that the surface deviation is the data expressed in the DCS and its type is different from the data expressed in Cartesian coordinate system. Therefore, for unified description of the PODs in V, the surface deviation data of these non-ideal planes should be transformed to the data described within PDa and PDb through coordinate transformation. Thereafter, these data from PDa and PDb can be transformed into data in V according to the position and orientation between PDa and PDb set within V.
Assume that the mating-planes of Part A and B are denoted as Pa and Pb, and the DCS corresponding to these mating-planes are denoted as Da and Db. To simplify the process of expressing PODs, set V, PDb, and Db coincide with each other. Consequently, the position and orientation of PDa after mating-planes are assembled express one translational and two rotational deviations. These three PODs are shown in Figure 7. Translational deviation is represented as Md, which is the PDa origin coordinate on the
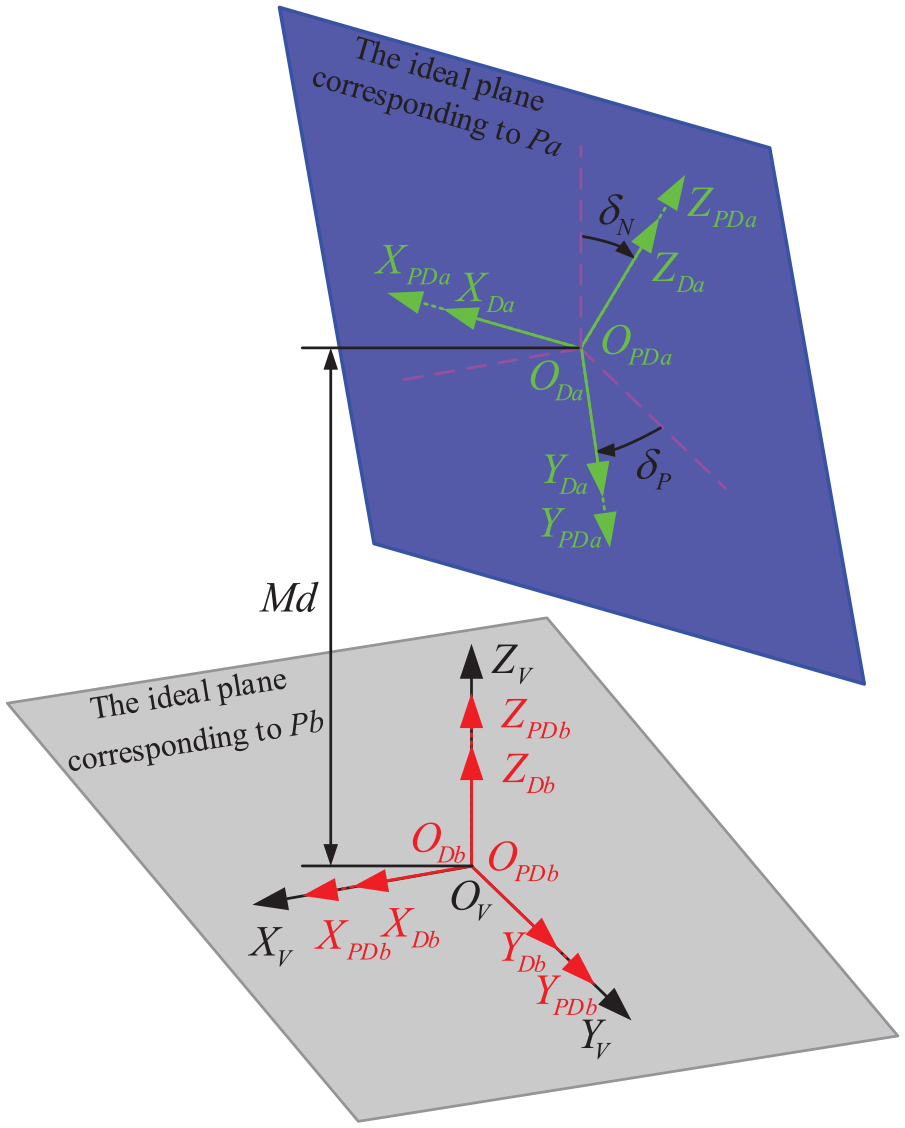
Expression of the three PODs.
Computing process of PODs
The process of computing PODs based on progressively adjusting the coordinate systems is demonstrated in Figure 8. The process is divided into the following: pre-processing stage, determining the position and orientation between two PDSs stage, and determining the POD stage. At the beginning of the pre-processing stage, V, PDa, PDb, Da, and Db coincide with each other. Furthermore, Da and Db should be set at each geometric center of the corresponding ideal planes. Next, the total-surface deviations of each non-ideal plane,
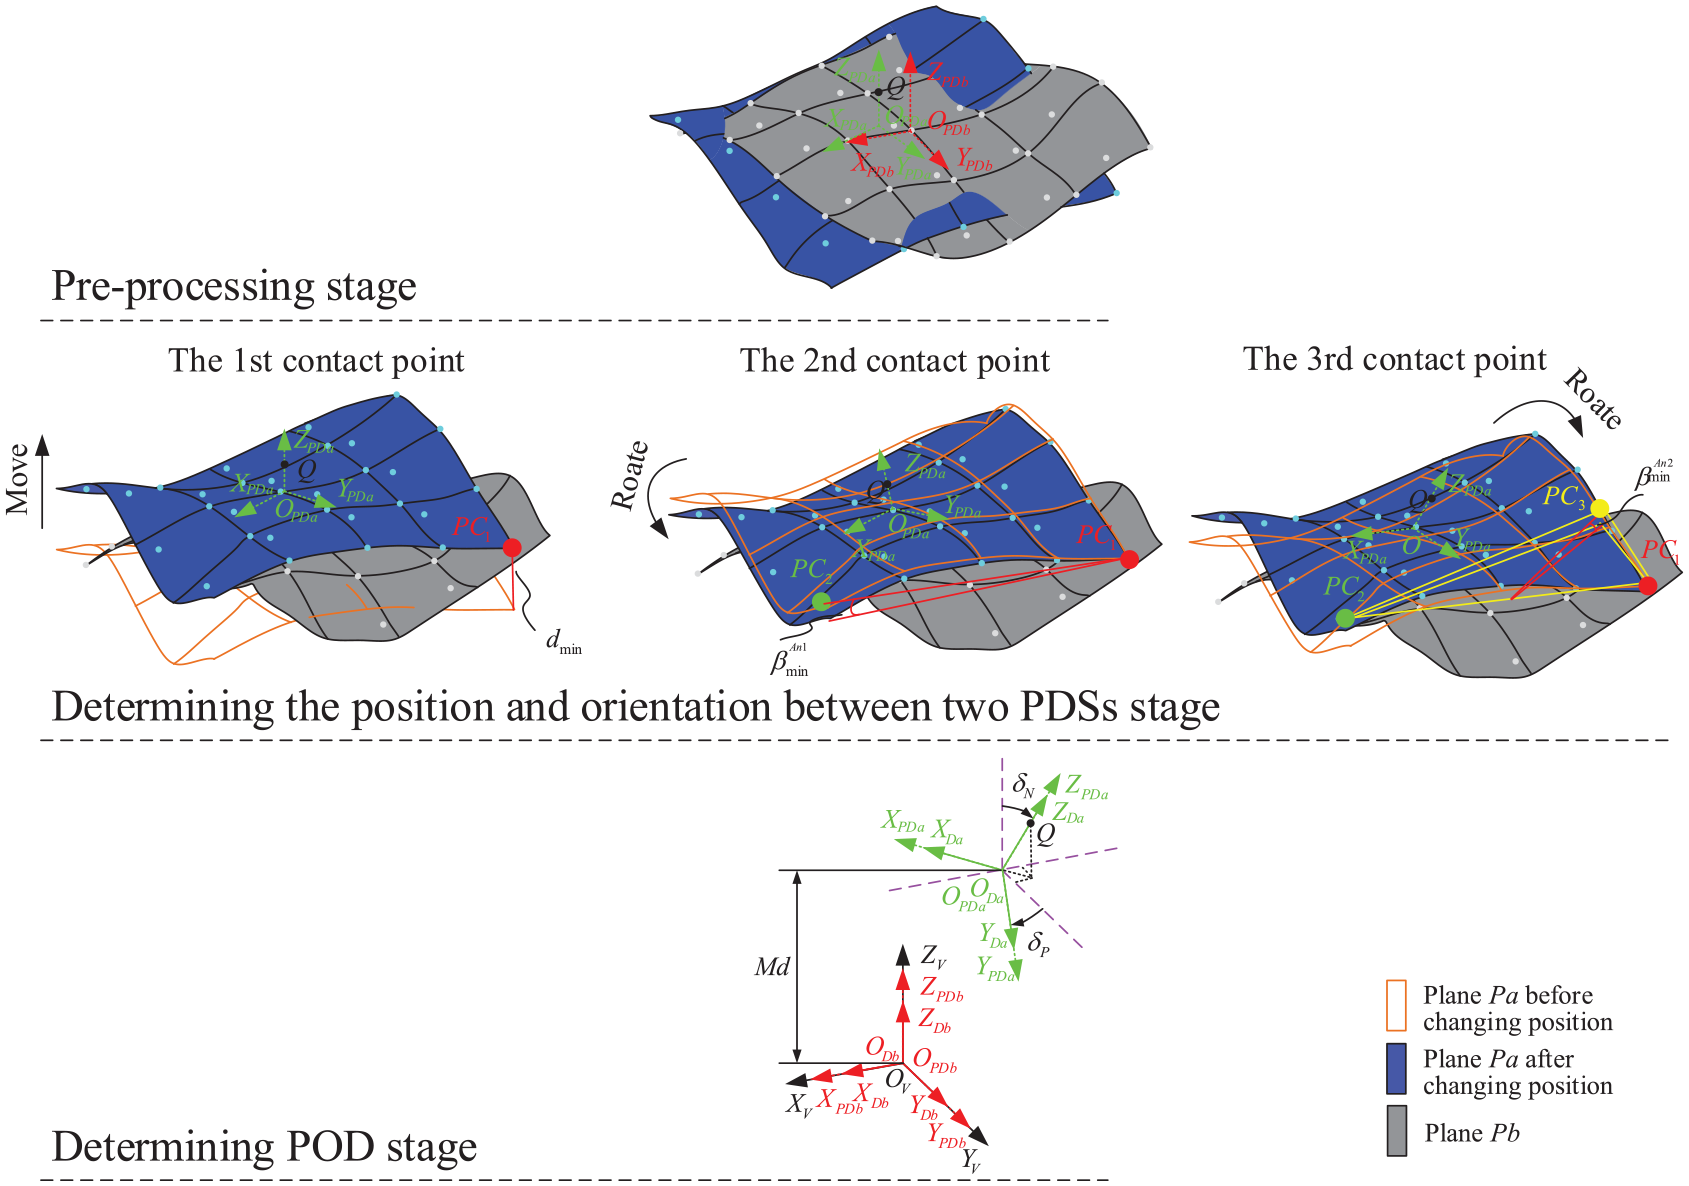
Computing process of PODs.
In the second stage, the position and orientation between two PDS will be determined. There are three procedures in this stage, and one contact point will be found in each procedure by changing the positions of PDa progressively. Assume that
After

If Pa is rotated along the axis built by


The angle between

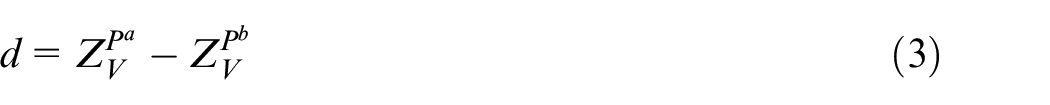
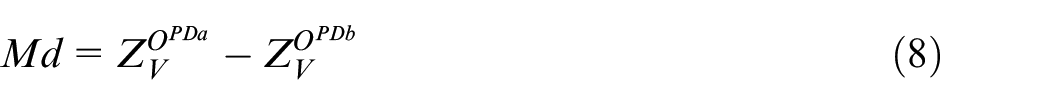
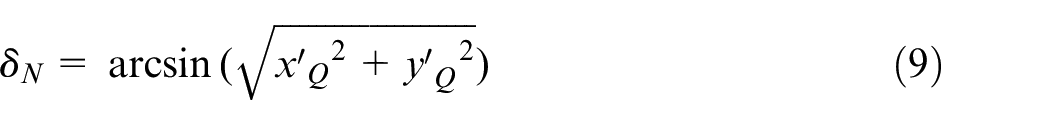
In the last stage, three PODs will be obtained. The translational deviation Md is the coordinate upon the
During the processes of finding the second and third contact points, the variations in the origin coordinates of PDa on the
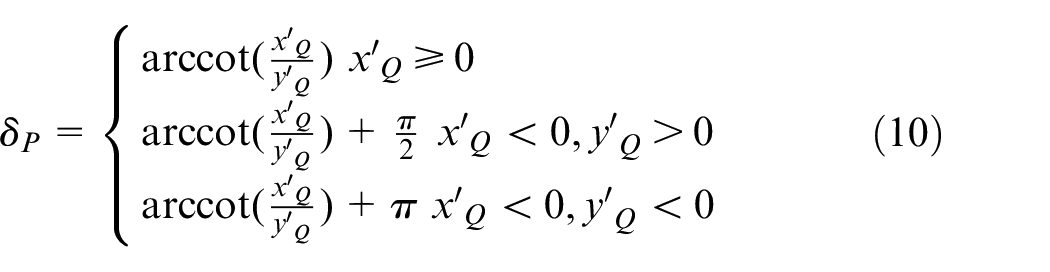
Principle for computing the projection point
The projection point is computed to obtain the points projected from one plane to the other one along the
Computing principle for projection points.
Whether point
The PODs of non-ideal planes are represented by one translational and two rotational deviations between two PDSs. To compute the uncertain PODs considering uncertainties of the non-ideal planes as well as the positions, a progressive adjustment based method of coordinate systems is introduced. This method is employed to obtain the set of uncertain PODs for statistical analysis in the following section.
Statistical analysis of PODs
The three PODs are uncertain variables which are influenced by random variations of surface deviations and positions, and each of them has a certain distribution. Thus, uncertain PODs can be expressed using the statistical eigenvalues of their distributions. Furthermore, their effects on product performance can be estimated using different eigenvalues whose types should be determined according to the performance requirements. For instance, if a product is designed according to the most unfavorable principle, whether product performance meets requirements will be evaluated using the position and orientation of assembled parts of the most unfavorable assembly situation in general. Therefore, the maximum PODs, which are among the eigenvalues, can be employed as the evaluation indicators because they express the most unfavorable position and orientation between two assembled parts.
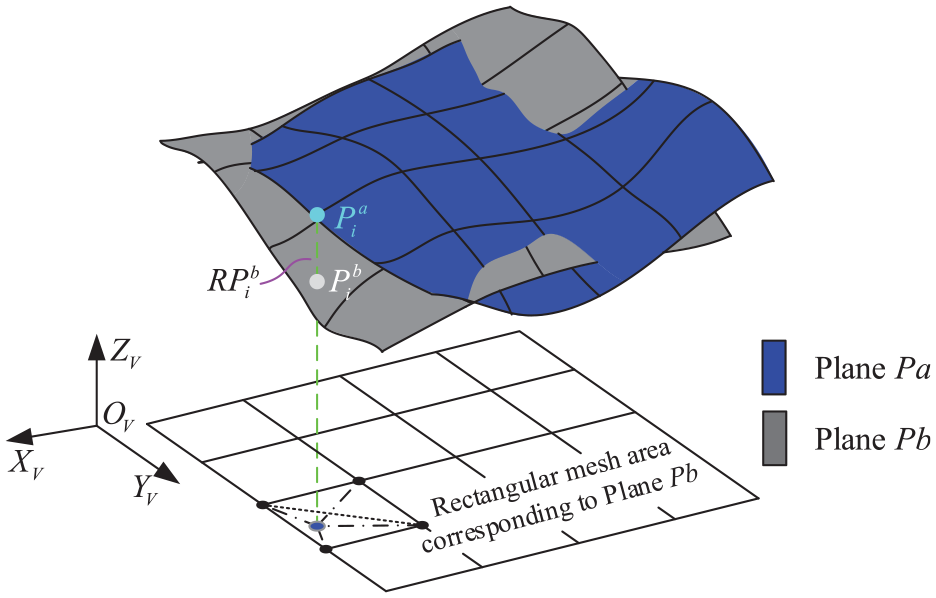
An example of a horizontal machining center, as shown in Figure 10, is employed to show how the maximum PODs work. The horizontal machining center is a type of precision machining equipment, and its performance of machining accuracy is up to the position and orientation between the spindle axis and the workbench datum. Thus, this type of position and orientation will be accurately limited in the design stage. Whether this performance requirement can be satisfied is directly influenced by the position and orientation between the key mating-surfaces of the equipment. Mating-planes of the column and bed are two key mating-surfaces, and uncertain PODs caused by assembling these two mating-planes consequently directly affect the performance of machining accuracy after they are propagated in the assembly dimension chain. Therefore, if other errors influencing the machining accuracy are ignored, the maximum PODs can be employed in the design stage to compare with the performance requirements.
Main structure of the horizontal machining center.
The maximum PODs, which are eigenvalues of uncertain PODs, can be obtained conveniently by numerically analyzing the data in a set. The set of uncertain PODs can be acquired by sampling the uncertain mating-planes and positions between two assembled parts multiple times as well as computing these samples.
Case study
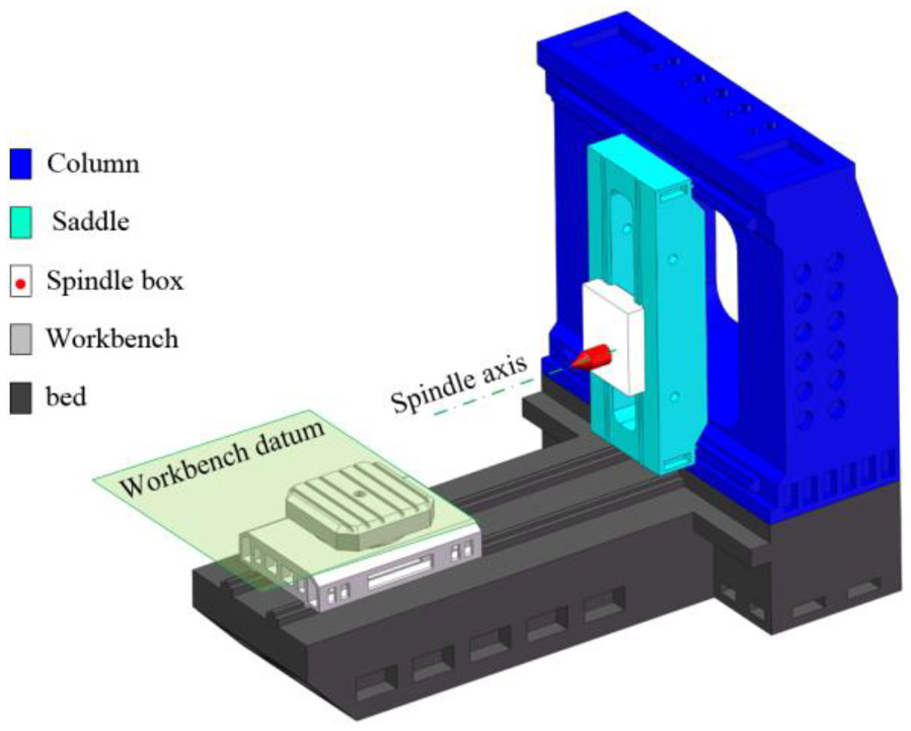
To verify the feasibility of the proposed analysis approach, the assembly of the column and bed of a horizontal machining is used as a case study because they are assembled by non-ideal planes and the uncertain PODs generated affect the performance of machining accuracy directly. The uncertain PODs are analyzed to predict their effects on the performance of the machining accuracy under the premise that other errors influencing the machining accuracy performance are ignored. The simplified horizontal machining center is shown in Figure 11.
Simplified horizontal machining center.
The mating-planes of the column and bed are both rectangular, and their given dimensions are L = 4000 mm and B = 2800 mm. In this section, assume that the translational ranges along the X- and Y-axes between the two mating-planes are both
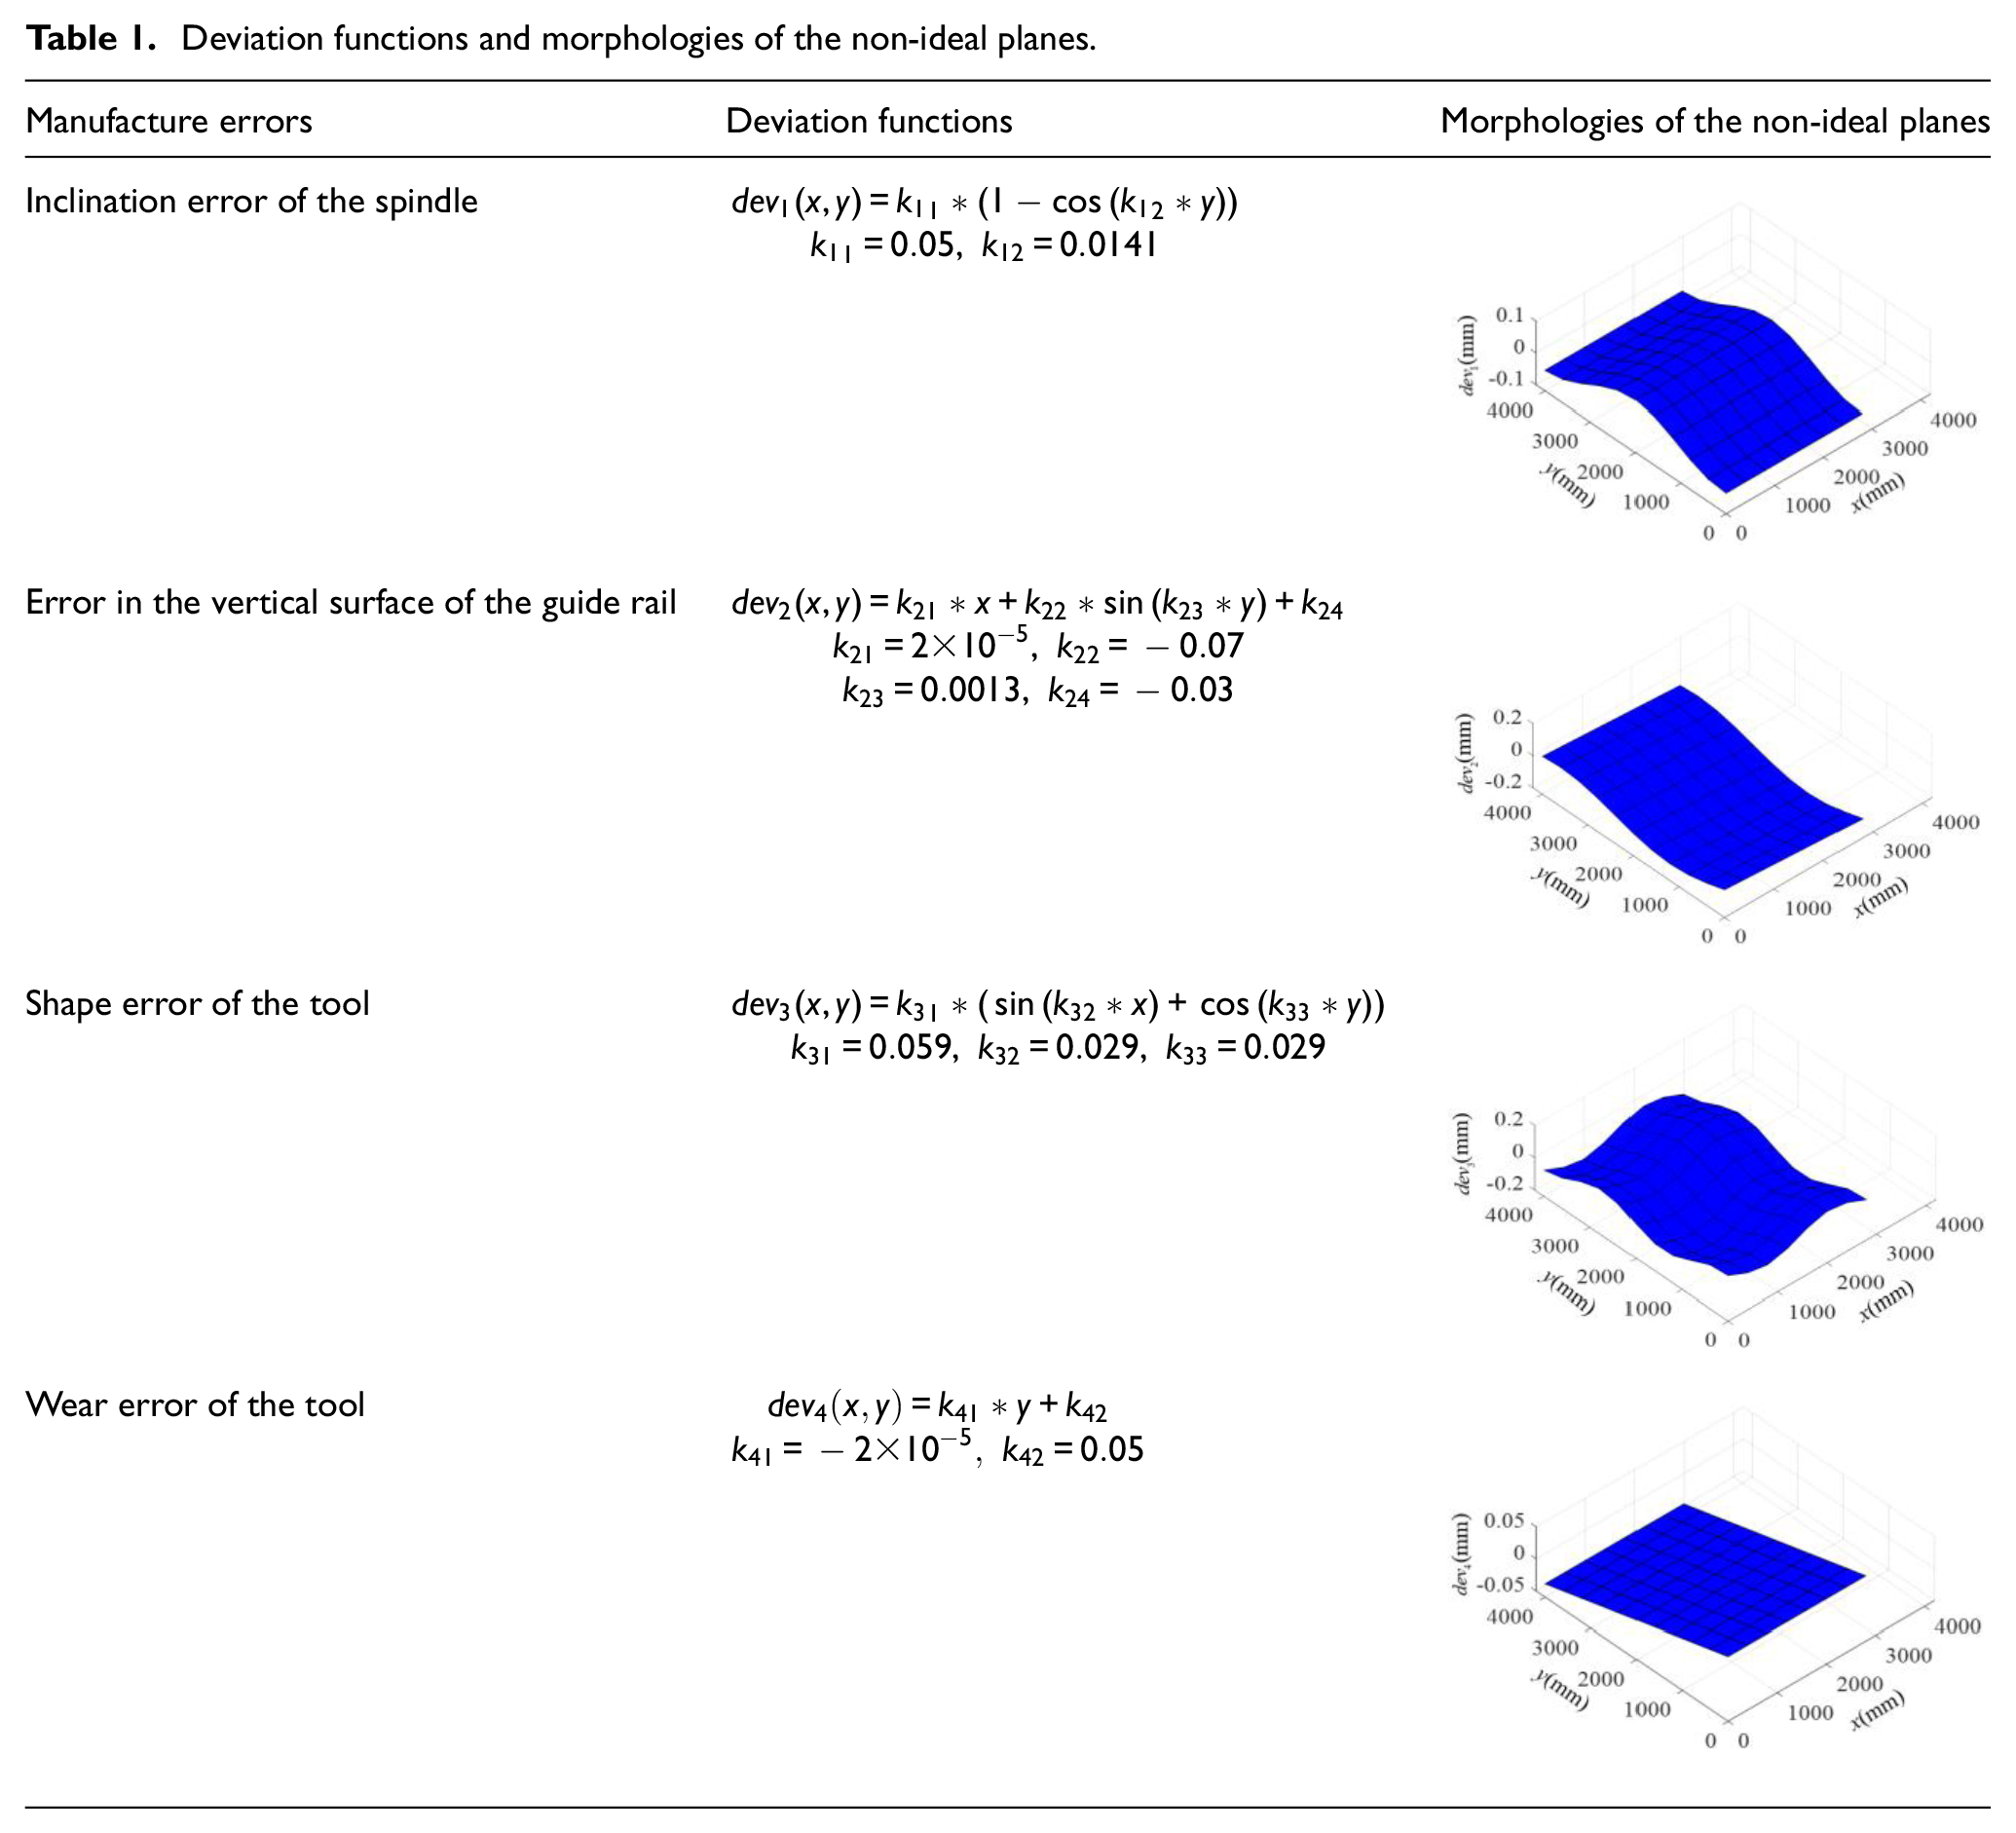
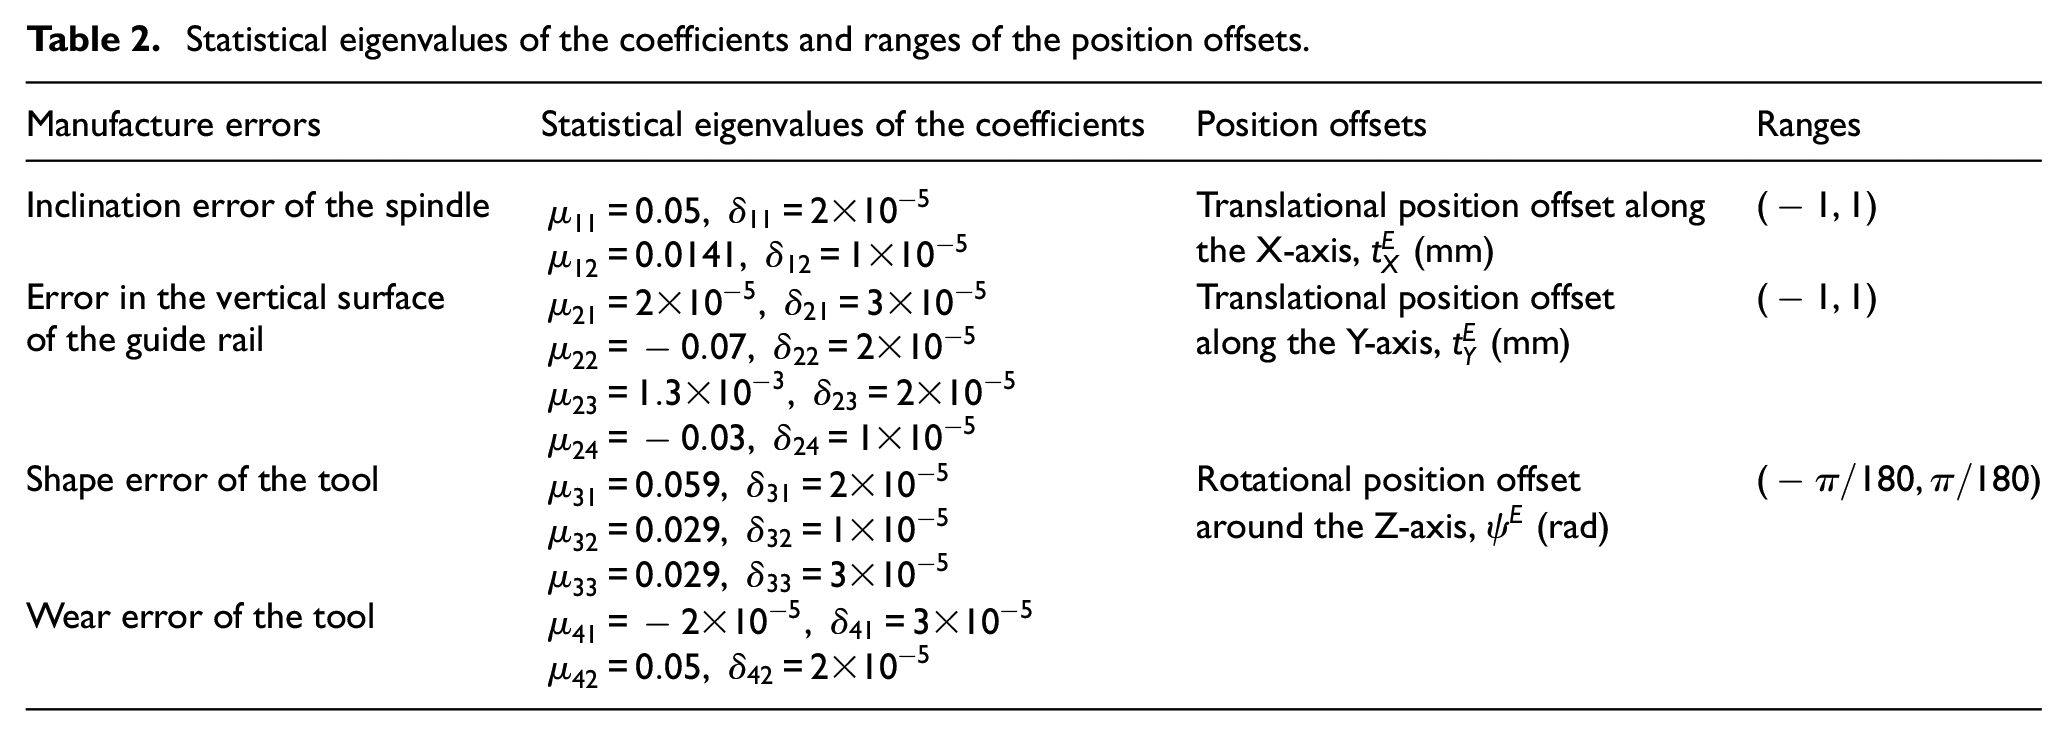
Based on analyzing the knowledge on cylindrical milling, the deviation functions corresponding to the four main manufacturing errors are established, and the specific deviation functions as well as the morphologies of the non-ideal planes are shown in Table 1. After that, the Monte Carlo sampling method is employed to sample the mating-planes as well as the positions, and 1000 sampling times are set. The random variations of coefficients and the position-offsets are assumed to be normal and uniform distributions, and the statistical eigenvalues of the coefficients (mean
Deviation functions and morphologies of the non-ideal planes.
Statistical eigenvalues of the coefficients and ranges of the position offsets.
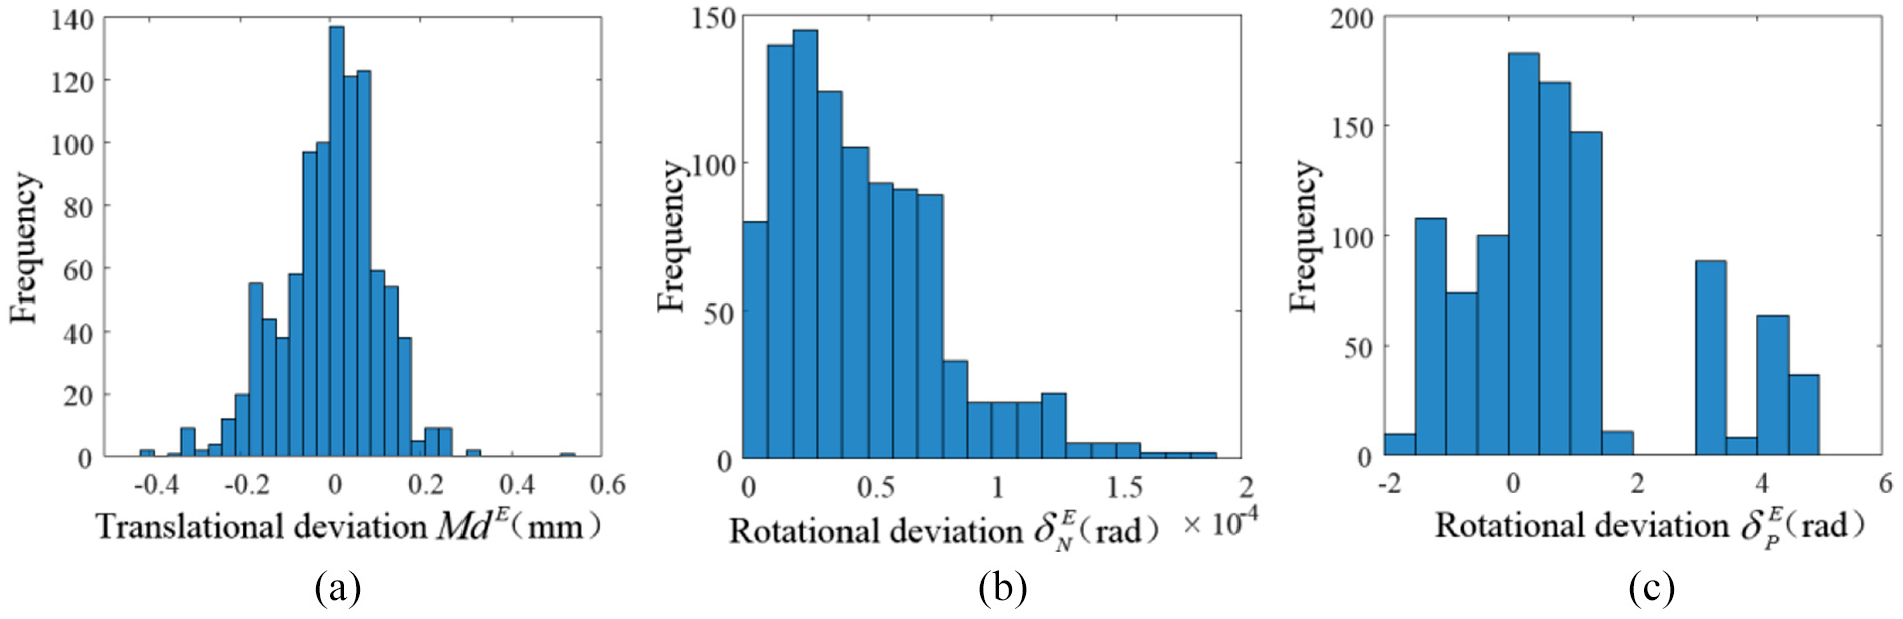
Histograms of the three deviations.
According to these three histograms, the three deviations are known to be uncertain variables and have certain distributions under the condition that surface deviations and positions between two assembled parts vary randomly. In Figure 12(a), the absolute value of
Other errors that affect the position and orientation between the spindle axis and workbench datum have been ignored; for example, the effects of error accumulation can be avoided because they are beyond the research scope of this study. Consequently, the maximum translational and rotational PODs can characterize the most unfavorable position and orientation between the spindle axis and the workbench datum. Furthermore, the machining accuracy performance can be conveniently evaluated by comparing these two maximum PODs with the design requirements.
Conclusion
Not only the uncertain surface deviations caused by multi-manufacturing errors but also the uncertain positions corresponding to the unconstrained DOFs make the PODs uncertain and the uncertain PODs have a direct impact on product performance. However, performing analysis based on non-ideal surfaces for predicting the effects of uncertain PODs on product performance is still an issue during the design stage. In this study, a Monte Carlo sampling-based analysis approach for PODs has been proposed and its feasibility has been verified by performing POD analysis of a horizontal machining center while ignoring other errors influencing the machining accuracy performance.
A modeling method from the perspective of manufacturing errors was employed such that the non-ideal surface deviations caused by muti-manufacturing errors could be conveniently modeled using deviation functions established in DCS. Furthermore, a method for computing uncertain PODs based on progressively adjusting the coordinate systems was proposed, and it could compute the projection point, using which correspondences of the points could be established at any assembly position such that the influence of random positions on PODs could be considered. Moreover, the maximum of uncertain PODs was defined as an indicator using which product performance can be conveniently estimated by comparing them with the required PODs.
This study provides an effective method for predict the practical effects of uncertain PODs on product performance accurately during the design stage because both the effects of uncertain surface deviations and uncertain positions on PODs can be considered. This will lay a basis for further researches on assembly deviation propagation and accumulation in the assembly dimension chain. Nevertheless, the research is limited to assembly with only a pair of mating-planes. The ongoing extension of the proposed method will be on the assembly with multi-pairs of mating-surfaces.
Footnotes
Declaration of conflicting interests
The author(s) declared no potential conflicts of interest with respect to the research, authorship, and/or publication of this article.
Funding
The author(s) disclosed receipt of the following financial support for the research, authorship, and/or publication of this article: This work is supported by the National Science Foundation of China (Grant 51575031). The authors would also like to thank the Beijing Municipal Education Commission (Build a Project) for its support.
Publisher’s note
Springer Nature remains neutral concerning jurisdictional claims in published maps and institutional affiliations.