
Abstract
The range of roll-bending that inhibits the edge cracking of high-silicon (3.0 wt%) steel strip during cold rolling was investigated by performing a pilot cold rolling test. In the rolling test, roll-bending was emulated by lathe-machining the work roll surface to be concave (corresponding to negative roll-bending) or convex (corresponding to positive roll-bending). Crack growth length that propagated during rolling and crack growth direction were measured. Three-dimensional finite element analysis coupled with ductile fracture criterion was conducted to predict the crack growth length and crack growth direction. The reliability of the finite element analysis was verified by comparing the predictions with measurements. A series of finite element simulations were then conducted with different levels of roll-bending, expressed as the ratio of the radius of curvature of work roll surface (R) to its barrel length (L).The difference between the measurements and the predictions of the crack growth length and crack growth direction was 6.5% and 8.3%, respectively, when the initial notch length was 6 mm. Even if a high reduction ratio for a given pass was applied to the silicon steel strip, edge cracking did not occur if the L/R ratio was less than −0.15, with a negative value corresponding to a concave surface profile, representing negative bending.
Introduction
High-silicon steel (i.e. steel that contains 3.0–4.0 wt% silicon) produced by cold rolling (thickness: 0.035–0.5 mm; width: 50–1200 mm) is commonly used as a core material in various electric transformers and motors because it has a highly efficient magnetic field when charged with electricity. 1 Cold-rolled high-silicon steel strips typically become the final product after appropriate heat treatment.
The ductility of high-silicon steel strips is lower than that of carbon or stainless steel strips due to their high-silicon content. Edge cracks in hot-rolled high-silicon steel strip are cut longitudinally before cold rolling begins. Due to the lack of ductility of high-silicon steel strip, however, microcracks still remain in the cutout area regardless of the size of the steel strip end width being cut. These result in edge cracking in the cold-rolled high-silicon steel strip (hereafter referred to as silicon strip). The growth of the microcracks into a macrocrack and the propagation of the macrocrack at an angle on the side of the silicon strip during cold rolling are called edge cracking at the cold rolling mill yard.
The most straightforward way to suppress edge cracking is either by increasing the temperature of the silicon strip before or during rolling or by decreasing the rolling speed. However, these approaches are not employed at production sites because of the loss of productivity (i.e. an increase in manufacturing costs due to the higher temperature and/or reduction in rolling speed). Another approach that is somewhat complicated but does not affect productivity is to control the amount of deflection at both ends of the work rolls, which is referred to as roll-bending. Roll-bending can be induced by introducing an artificial bending moment at both ends of the work rolls and/or by controlling the draft (i.e. reduction ratio) for each pass. However, this approach depends heavily on the experiences of the workers in cold rolling mills. Hence, the systematic analysis of roll-bending when producing silicon strips has been required, in particular, investigating a range of roll-bending.
With regard to the production of carbon steel strips in cold rolling, several useful studies have recently been made for controlling the shape of the steel strips. Linghu et al. 2 developed three-dimensional (3D) finite element (FE) model of cold strip rolling for six-high continuous variable crown control rolling mill and investigated the flatness control capability of the cold rolling mill in terms of work roll-bending forces, intermediate roll-bending forces, and intermediate roll shifting values. Wang et al. 3 carried out 3D dynamic strip rolling FE simulation to obtain the actuator efficiency factors in terms of work roll-bending, intermediate roll-bending, and roll shifting for a six-high universal crown control mill. They finally examined the effects of the actuators on strip thickness profile, crown, and edge drop.
However, only a few papers have been published on such roll-bending conditions that suppress the edge cracking of silicon strips during cold rolling. Na and Lee 4 adopted a ductile fracture criterion and performed 3D FE simulation to better understand the effect of negative and positive roll-bending on edge cracking when silicon strips with an artificially created sharp notch on its side were cold-rolled. Negative and positive roll-bending were simulated by modeling the roll surface profile as concave or convex, respectively, in the roll axis direction. They predicted the onset of the fracture and an element removing method 5 to simulate crack growth. However, their FE simulations were all carried out with the stress triaxiality η (i.e. mean stress over von Mises stress) fixed at 0.25, even though the η generated around the edge changes greatly (η = −0.8 to 1.0).
In another study, Byon and Lee 6 conducted a pilot rolling test to examine the effects of roll-bending on the edge cracking of silicon strips with specially designed work roll surface profiles. The effects of roll-bending on edge cracking were emulated by machining the work roll surface outline so that the work roll surface outlines along its axis were concave and convex to imitate negative and positive roll-bending, respectively. They performed FE analysis to examine stress distributions around the notch-tip region only, but did not predict edge cracking.
Yan et al. 7 conducted the cold rolling testing and FE analysis coupled with the Gurson–Tvergaard–Needleman (GTN) damage model 8 to examine the effects of various rolling parameters (the reduction ratio for a given pass, tension applied to the silicon strip during rolling, and friction coefficient between silicon strip and work rolls) on the edge cracking. In the cold rolling test, 2% silicon strip specimens (length of 1000 mm and width of 100 mm) with differently shaped edge notches were machined and used. However, they could not examine the effect of roll-bending on edge cracking because of the narrow width of the silicon strip and the use of flat work rolls.
In this work, the effect of positive and negative roll-bending on the edge cracking of 3.0 wt% silicon steel strips was systematically investigated by performing the pilot rolling test in which the surface profile of work rolls was lathe-machined to emulate up/downward sagging of work rolls in the actual rolling and by computing deformation behavior including local fracture (macrocrack initiation and growth) of the silicon strips under positive and negative roll-bending conditions. 3D FE analysis simulating the cold rolling process was incorporated into the ductile damage model proposed by Johnson and Cook, 9 and then the crack growth direction (CGD) and macrocrack growth length (CGL) were subsequently calculated. We also performed a pilot cold rolling test with specimens produced from hot-rolled silicon strip to measure the CGD and CGL. In the pilot rolling test, specially designed and machined work rolls 6 that emulated roll-bending were used. For industrial applications, a simple ratio based on work roll barrel length (L) and radius of curvature (R) of work roll surface profile has been defined so that operators working in actual cold rolling mills can easily use the ratio (L/R) to figure out the effect of roll-bending.
The validity of the FE simulations was verified by comparing the predictions with the measurements. After confirming that the FE analysis was accurate, a series of FE simulations were carried out by changing the ratio to identify the L/R range that can suppress edge cracking during the cold rolling of silicon strips.
Experiments
Specimens for the pilot cold rolling test
A portion of a 3.0 wt% silicon strip hot-rolled at POSCO was taken out and processed into specimens with a length of 300 mm, a width of 25 mm, and a thickness of 2.3 mm. The specimens also have a keyway slot in the form of a round-ended notch created using wire electro-discharge machining to allow crack propagate at low rolling pressures during the pilot rolling test (Figure 1(a)). The round-ended notches have a radius of 0.1 mm and two different slot lengths of 4 and 6 mm, respectively, as shown in Figure 1(b).
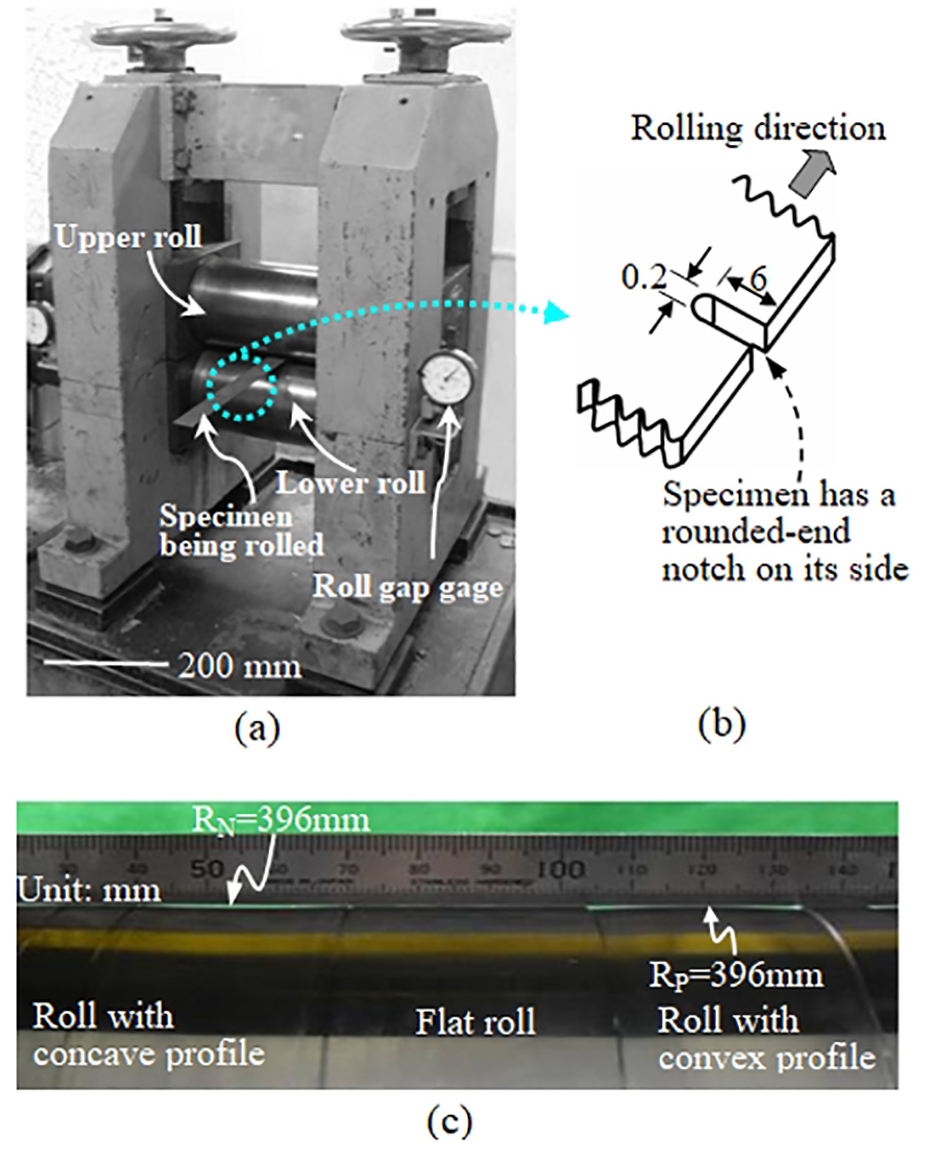
(a) Configuration of the pilot rolling mill used in this study. (b) Specimen shape with a rounded-end notch. (c) Two types of roll profile machined by a numerically controlled (NC) lathe. RN indicates the radius of curvature of the concave profile and RP indicates the radius of curvature of the convex profile.
A pilot cold rolling mill with a single stand driven by an 11 kW constant torque DC motor was used. The work rolls have a maximum diameter of 120 mm and a barrel length of 200 mm. The two types of work roll surface profile used in the pilot rolling test, convex and concave when viewed from the rolling direction, are illustrated in Figure 1(c). The concave and convex profiles correspond to negative and positive roll-bending, respectively. The left-hand side shows a concave profile that leads to greater reduction at the edges, and accordingly, less reduction in the center. RN denotes the radius of curvature of the concave outline (or negative roll-bending), while the right-hand side indicates a convex outline that creates more reduction in the center. RP represents the radius of curvature of the convex outline (or positive roll-bending).
Specimens for tensile testing
A portion of hot-rolled silicon strip was taken and then machined into sheet-type specimens according to ASTM A370. The gauge length of the sheet-type specimens was 60 mm. The tensile engineering stress–strain curves measured using the two types of sheet-type specimen are illustrated in Figure 2. The difference between the two specimens is that the first has no notch in the gauge region, but the second has a notch on one side. The notch had the shape of a keyway slot in the form of a round-ended notch. The round-ended notch had a diameter of 0.5 mm and a length of 0.5 mm.
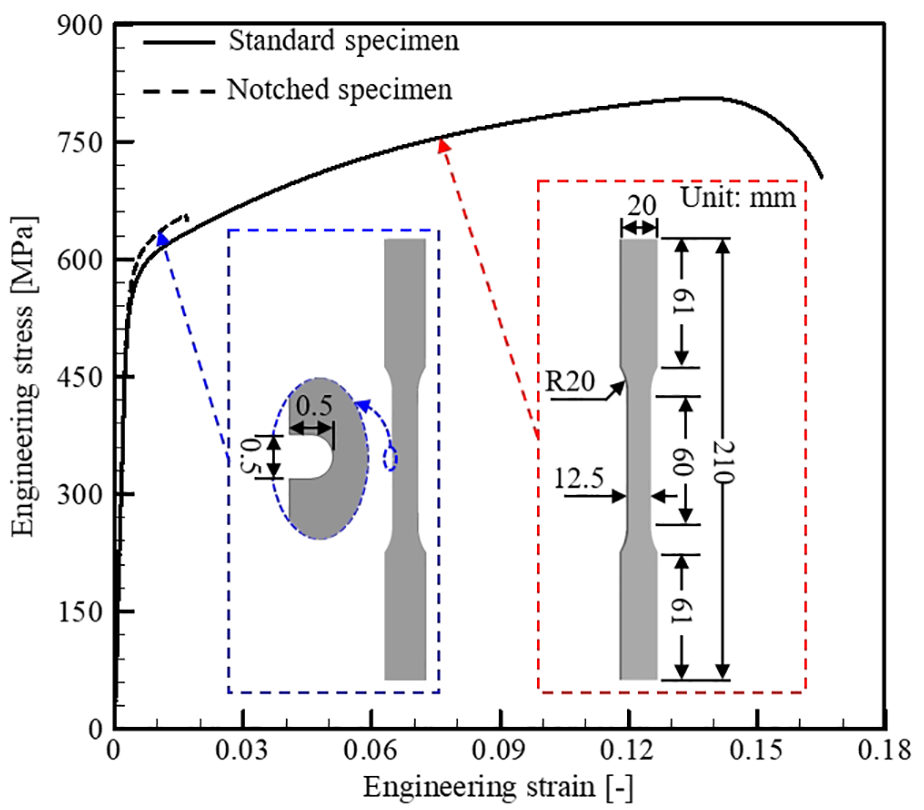
Measured engineering stress–strain curves for standard and notched tensile specimens.
For convenience, un-notched specimens are referred to as standard specimens in this article. The stress–strain curves were measured at room temperature using a Zwick Z100® testing machine. The speed of the pulling jaws was 0.5 mm/min. The strain at fracture of the specimen with a notch was about 10.2% of that of the standard specimen. It was observed that the specimen with a notch fractured after a very small amount of strain localization.
Ductile damage and the fracturing of metal
From a metallurgical perspective, damage is identified as the nucleation of (micro)voids or shear bands around the inclusions or near the grain boundaries in the material and the growth of voids and shear bands due to significant irreversible deformation. Coalescence of the voids or linking of the shear bands, which represents the final stages of the damage process, leads to the formation of a macrocrack. Macroscopically, damage is the irreversible progressive degradation of material stiffness and strength during deformation.
Cao10,11 reviewed ductile damage models developed over 50 years and described their advantages and disadvantages in detail. He divided these into three groups from the perspective of their definition of damage as follows:
Fracture initiation
In this study, an uncoupled damage fracture (DF) criterion proposed by the Johnson and Cook 9 was adopted. Even though this model has limitations when applied to a material (or structure) with complex strain paths, this criterion has been extensively used in the industry27,28 due to its simplicity in terms of material damage characterization and numerical implementation. The damage indicator w is expressed as follows
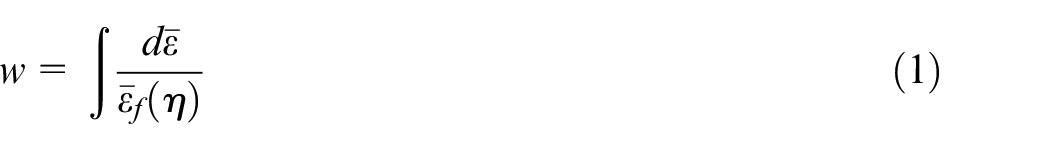
w increases monotonically with plastic deformation proportional to the incremental change in the equivalent strain. Fracture initiates when w = 1.0.
In this study, the relation between
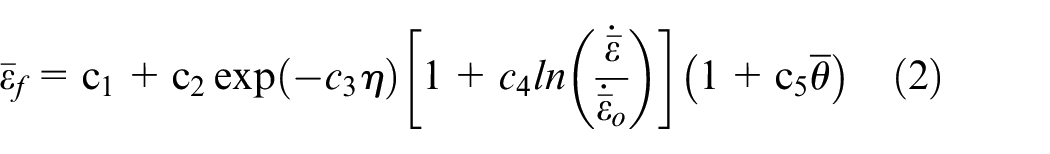
If a material is deformed at room temperature, the non-dimensional temperature

The constant
For aluminum alloys and other metals, Bai and Wierzbicki 25 showed that, in addition to stress triaxiality and equivalent strain rate, ductile fracture also depends on the third invariant of deviatoric stress, which is related to the Lode angle. While the silicon strip specimen with a notch is being rolled, the stress triaxiality ratio at the notch-tip is high. With high stress triaxiality, the Lode angle has little effect on the equivalent strain at fracture. Therefore, the Lode angle was not considered in this study.
Stiffness degradation
Once the fracture initiated for any element, the material stiffness at that element is gradually reduced until it reaches zero. If the material stiffness reduces to zero immediately, numerical instability may occur. The value of
This mesh dependency can be overcome by replacing the softening part of the equivalent stress–strain curve with the equivalent stress (
The rate of stiffness degradation
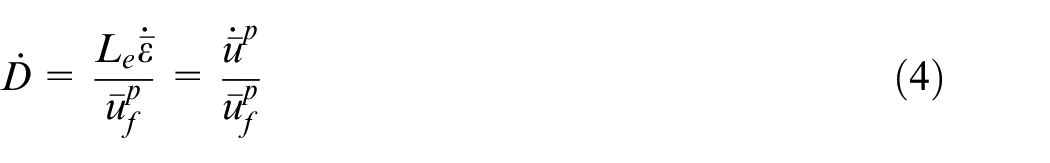
The rate of the equivalent plastic displacement at an element is expressed as follows

Le is the characteristic length of the element and depends on the element geometry and formulation. The definition of Le associated with an integration point is necessary to implement the stress–displacement relation in FE analysis. For example, Le is the length of a line across an element for a first-order element.
Numerical analysis
FE analyses with the von Mises plasticity were carried out using ABAQUS/Standard. Figure 3 illustrates FE meshes of the tensile specimens and boundary conditions. un, ut, σn, and σt represent the normal displacement, the tangential displacement, the normal surface traction, and the tangential surface traction, respectively. We adopted a quarter model for the standard tensile specimen and a half model for notched tensile specimens to reduce the run time. The element type was C3D8. In order to take into account strain localization, we modeled the elements with a size of ∼0.2 mm in the center and larger elements away from the center. The FE mesh also had eight elements in the thickness direction of the specimen to take into account the convergence of the equivalent strain at fracture. The elastic modulus of silicon strip specimen is 202 GPa, the density is 7650 kg/m3, and Poisson’s ratio is 0.3.
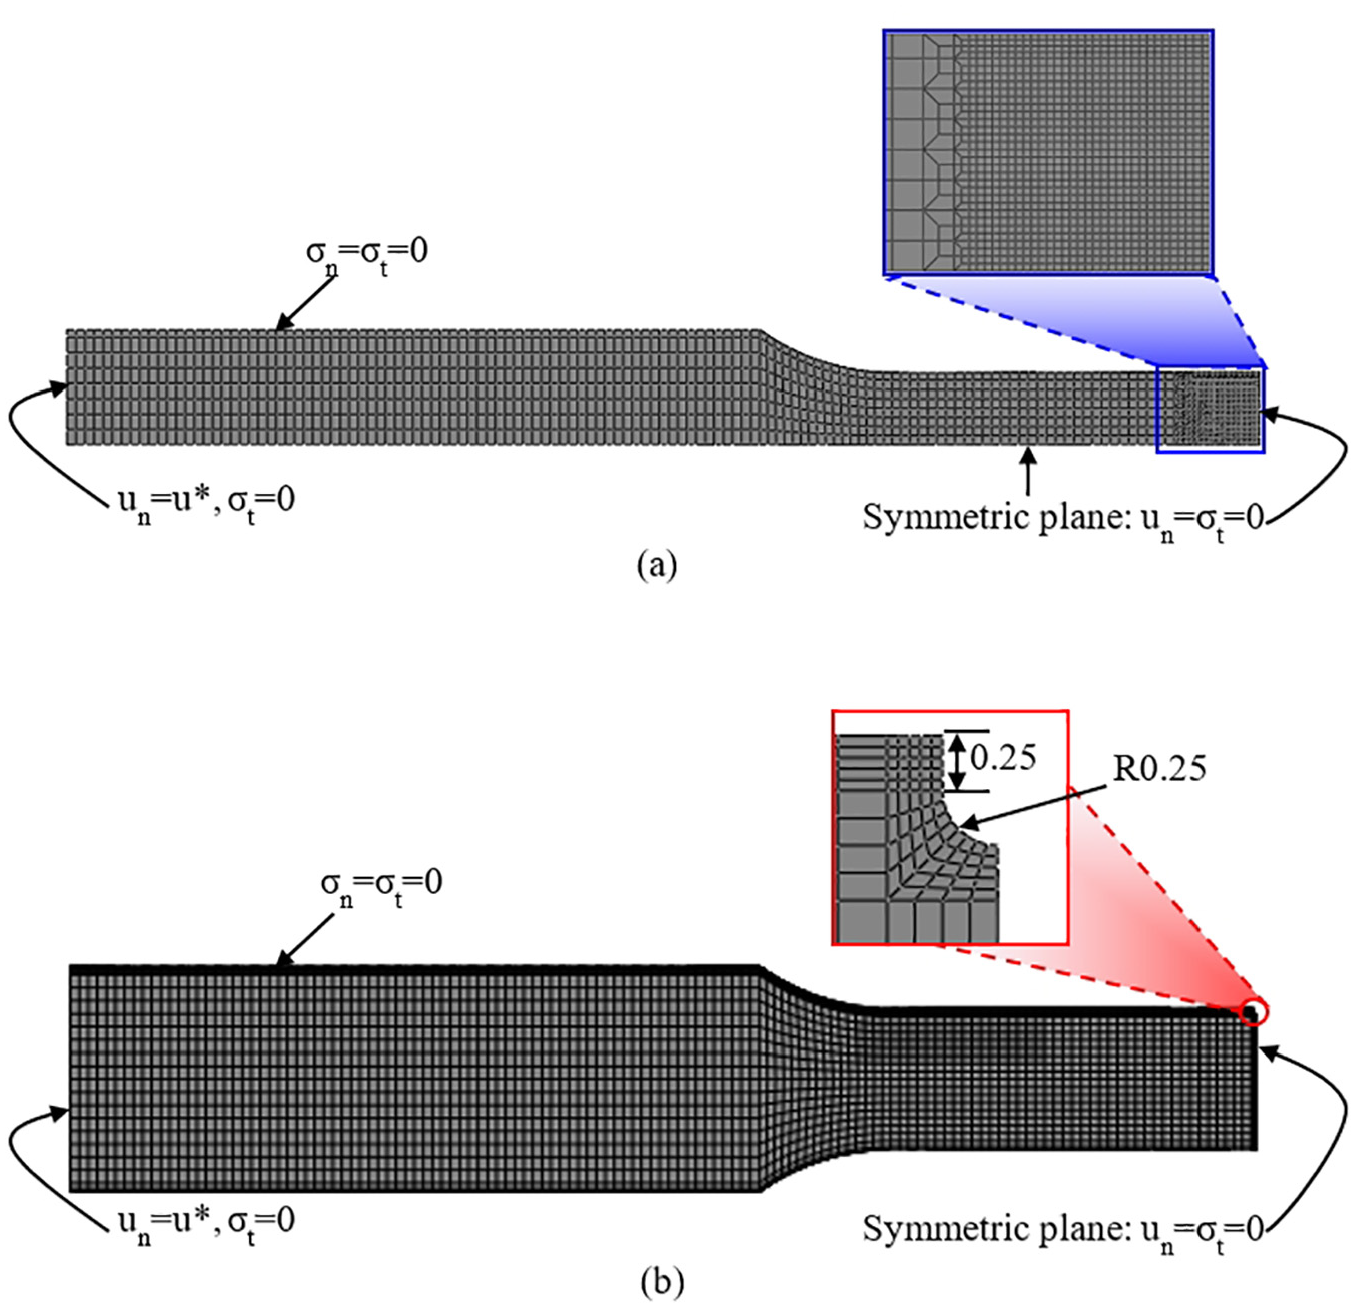
Finite element meshes and boundary conditions for the FE analysis of the tensile tests for (a) standard specimen and(b) notched specimen.
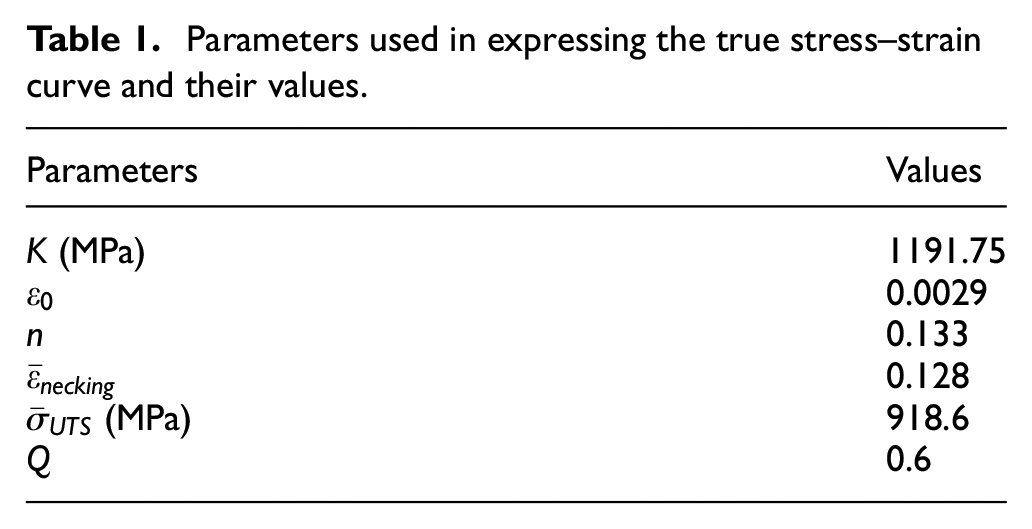
Empirical material (or constitutive) model for 3.0 wt% silicon strip has been adopted and method for parameter determination in this model is described. The stress–strain curve measured using a standard specimen was divided into two sections: before and after necking. Swift 29 power model was applied to express stress–strain curve before necking as follows

Mohr and Marcadet’s 30 approach was adopted to depict the stress–strain curve after necking, as shown in equation (7)

K, ε0, n, and
Parameters used in expressing the true stress–strain curve and their values.
The engineering stress–strain curve resulting from tensile testing with a standard specimen and those calculated using FE simulations with different values for Q are presented in Figure 4. Measurements and calculations most closely matched when Q was 0.6.
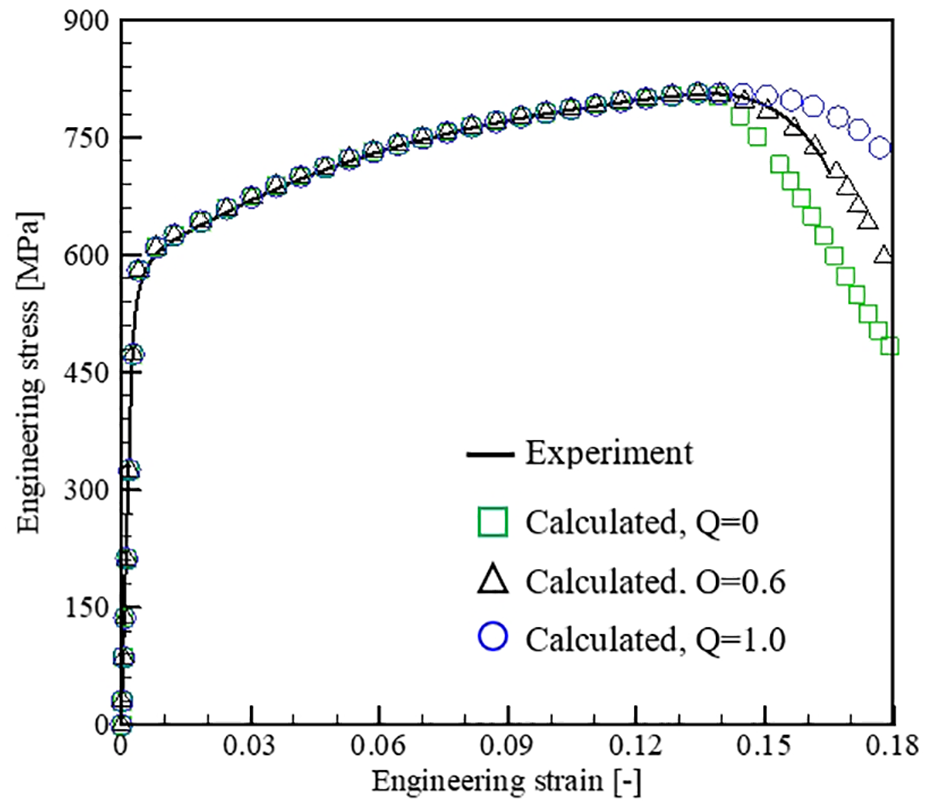
Stress–strain curve resulting from uniaxial tensile testing with a standard specimen and those calculated by FE simulations with different post-necking hardening parameter Q.
To verify the true stress–strain curve used in the FE analysis, we compared the force–displacement response between the experiment and the FE simulations. In Figure 5, the force–displacement curves measured from the tensile testing are compared with that calculated from the FE simulations of the tensile testing. For the standard specimen, the overall shape of the two curves was very similar, as shown in Figure 5(a). This means that the true stress–strain curve for the 3.0 wt% silicon strip specimen used in the FE analysis was appropriate. For the notched specimen (Figure 5(b)), the shapes of the two curves were generally similar but differed slightly locally.
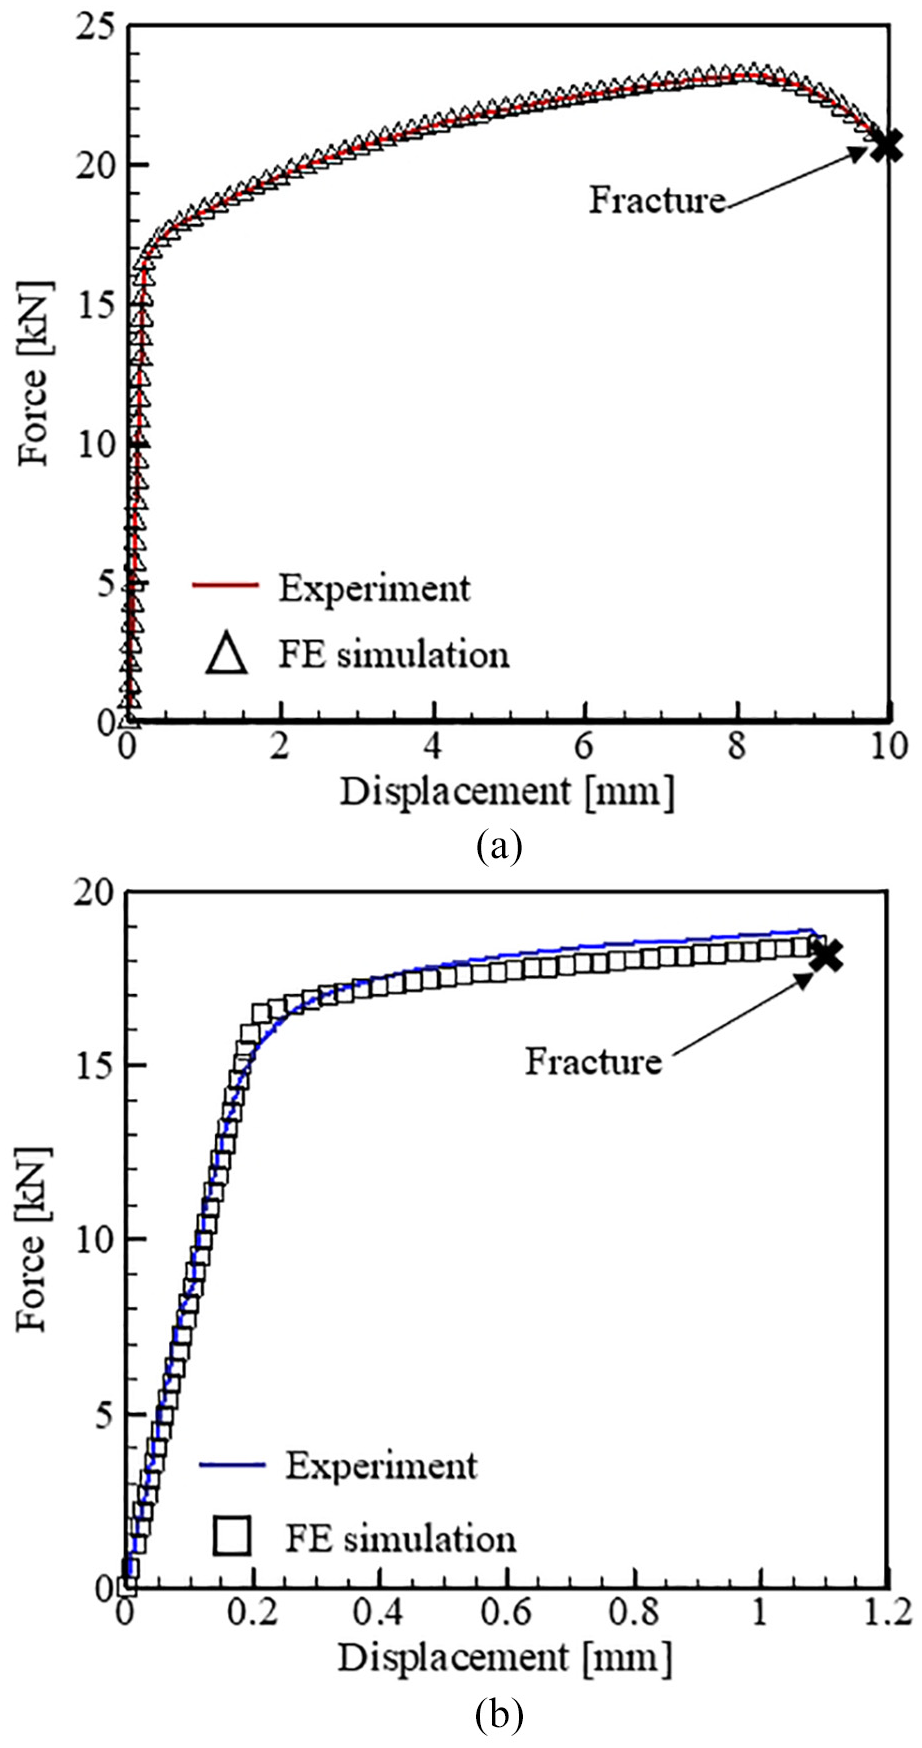
Global force–displacement curve obtained from uniaxial tension testing and FE simulations of tensile testing for (a) standard and (b) notched specimens.
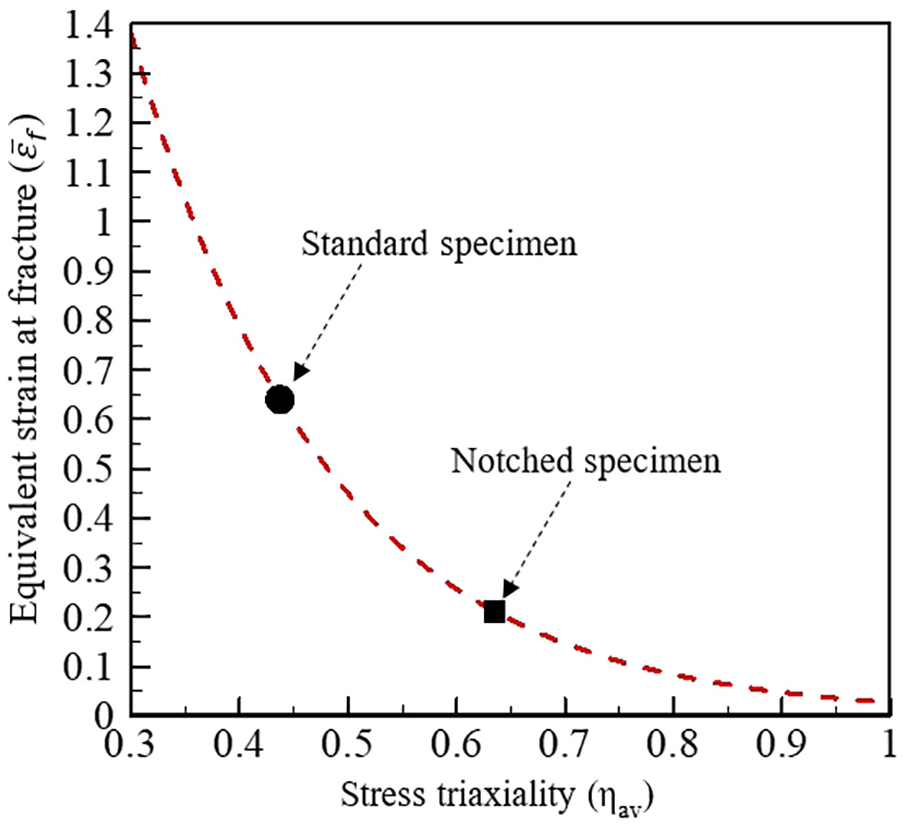
In Figure 6, the fracture locus of 3.0 wt% silicon strip specimen at a strain rate of 0.1 s−1and at room temperature is presented. The data represented by the two solid symbols were obtained using the scheme outlined in section “Fracture initiation” with a standard tensile specimen (solid circle) and a notched tensile specimen (solid square). For tensile specimens, the change in η at the center and at the edge of the specimen was very large from the start of plastic deformation to the onset of fracture. In the fracture locus, the average value of η is defined as
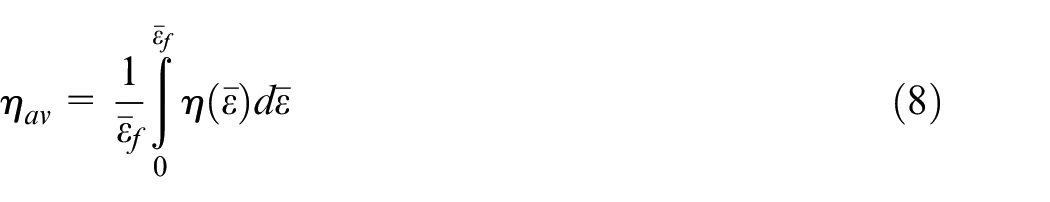
They are then fitted to the function as follows

Fracture locus of 3.0 wt% silicon steel.
Results and discussion
CGD and CGL
Figure 7 shows the history of stress triaxiality (η) and equivalent strain (
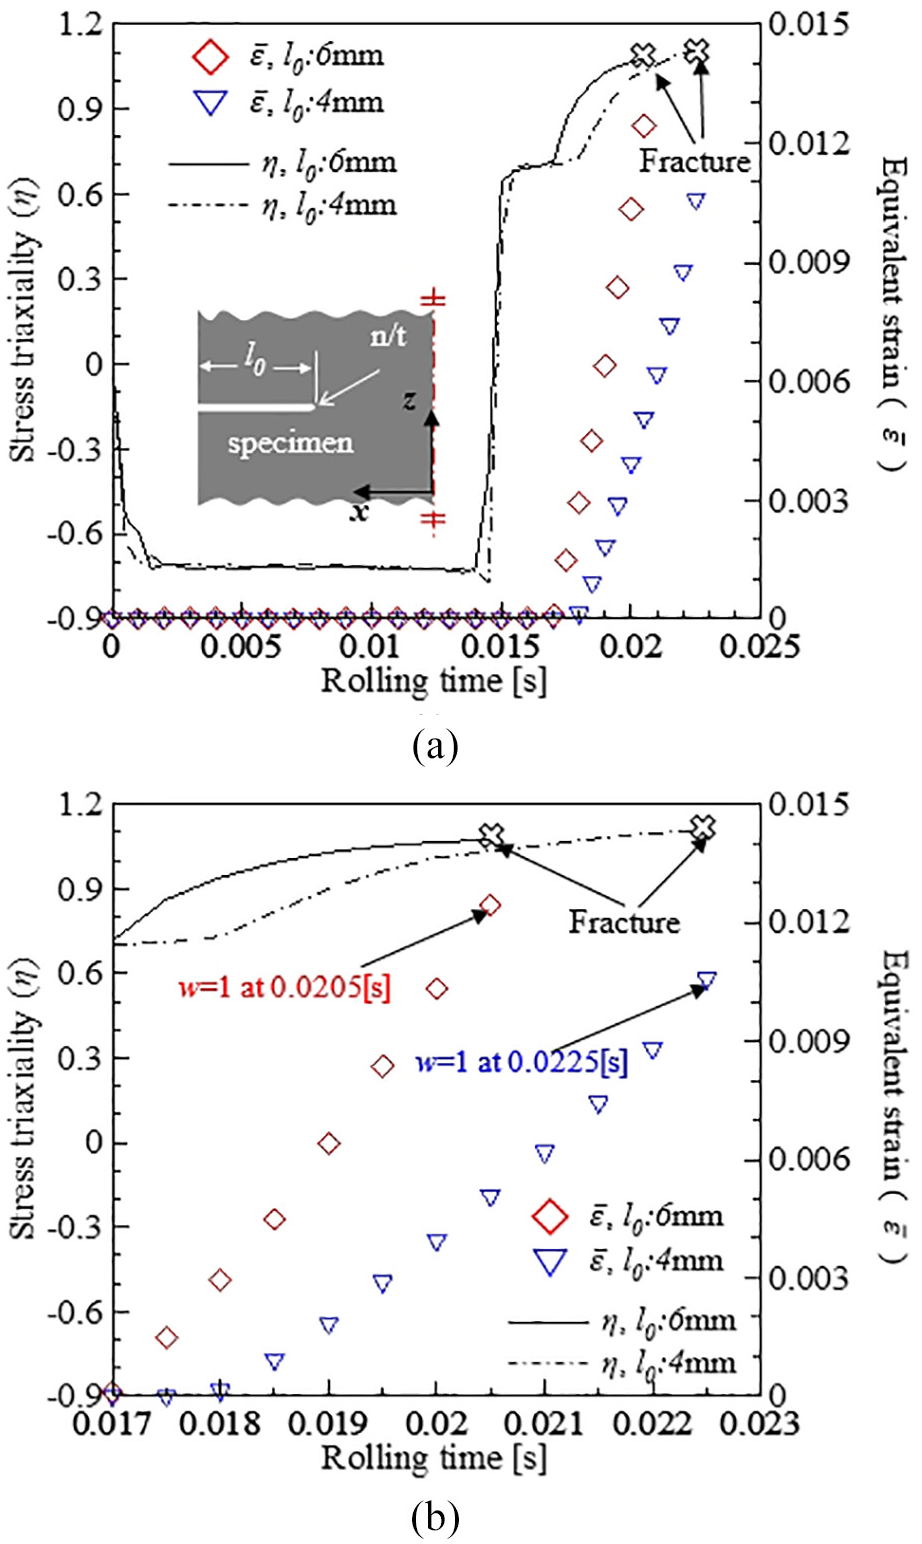
Variations of η and
Figure 7(b) presents an enlarged view of the variation in η and
Figure 8 shows the change in the CGD until crack growth stopped after fracture initiation. The direction of maximum principal stress is indicated by a straight arrow open in both directions (↔ and  ) and the CGD by a straight arrow open in a single direction (→). Figure 8(a) and (d) displays the instant when a fracture began to grow in the vertical direction of the maximum tensile principal stress at the notch-tip element. The reason why the CGD was not perpendicular to the rolling direction is that the work roll surface had a convex profile and the load direction at the notch-tip was slightly oblique clockwise to the transverse rolling direction. Therefore, fracturing began to grow diagonally from the notch-tip.
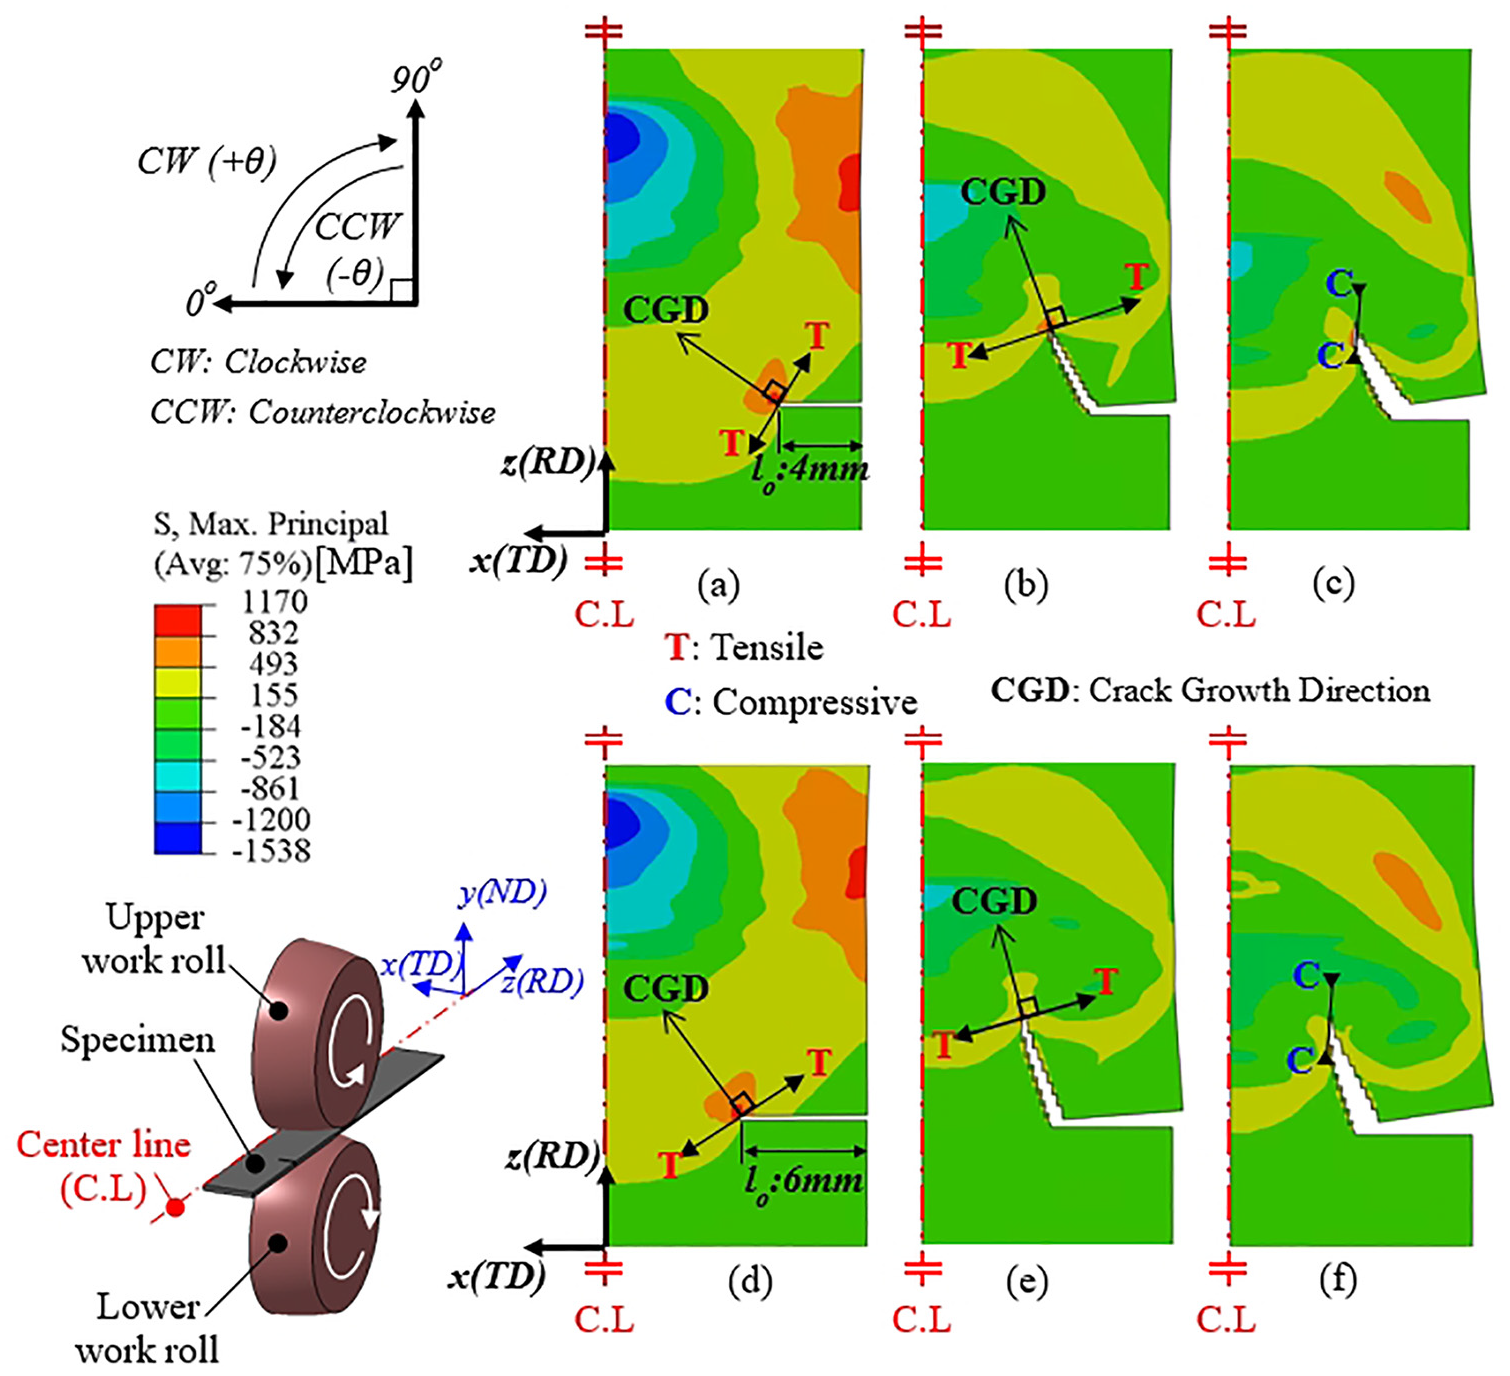
The predicted crack growth direction when specimens are rolled using work rolls with a convex profile. (a) and (d) The moment at which the fracture initiated, (b) and (e) the crack being grown, and (c) and (f) when the crack growth is complete.
Figure 8(b) and (e) shows that the cracks propagated clockwise as they approached the work roll with a convex surface. The growth of the crack continued until it came into contact with the work roll with a convex surface. The crack growth angle was larger when l0 was 6 mm than when l0 was 4 mm. The work roll surface with a convex profile produced the largest plastic deformation at the center of the specimen during rolling. Therefore, the longer l0 was, the higher the tensile stress in the rolling direction at the notch-tip and the larger the crack growth angle.
Figure 8(c) and (f) indicates that crack growth stopped at the crack tip. The maximum compressive principal stress was created at the crack tip, which halted crack growth because the convex profile of the work roll surface came into contact with the crack.
Figure 9 compares the CGL and CGD predicted by the FE simulations with those measured from the rolling test. For the CGL, the difference between the measurements and the predictions was 0.7% when l0 was 4 mm and 6.5% when l0 was 6 mm. Overall, the CGL predicted by FE analysis was in agreement with the measured CGL. This indicates that FE analysis results can be used to control roll-bending in actual silicon strip cold rolling applications. For the CGD, the difference between the measurements and the predictions was 10.4% when l0 was 4 mm and 8.3% when l0 was 6 mm.
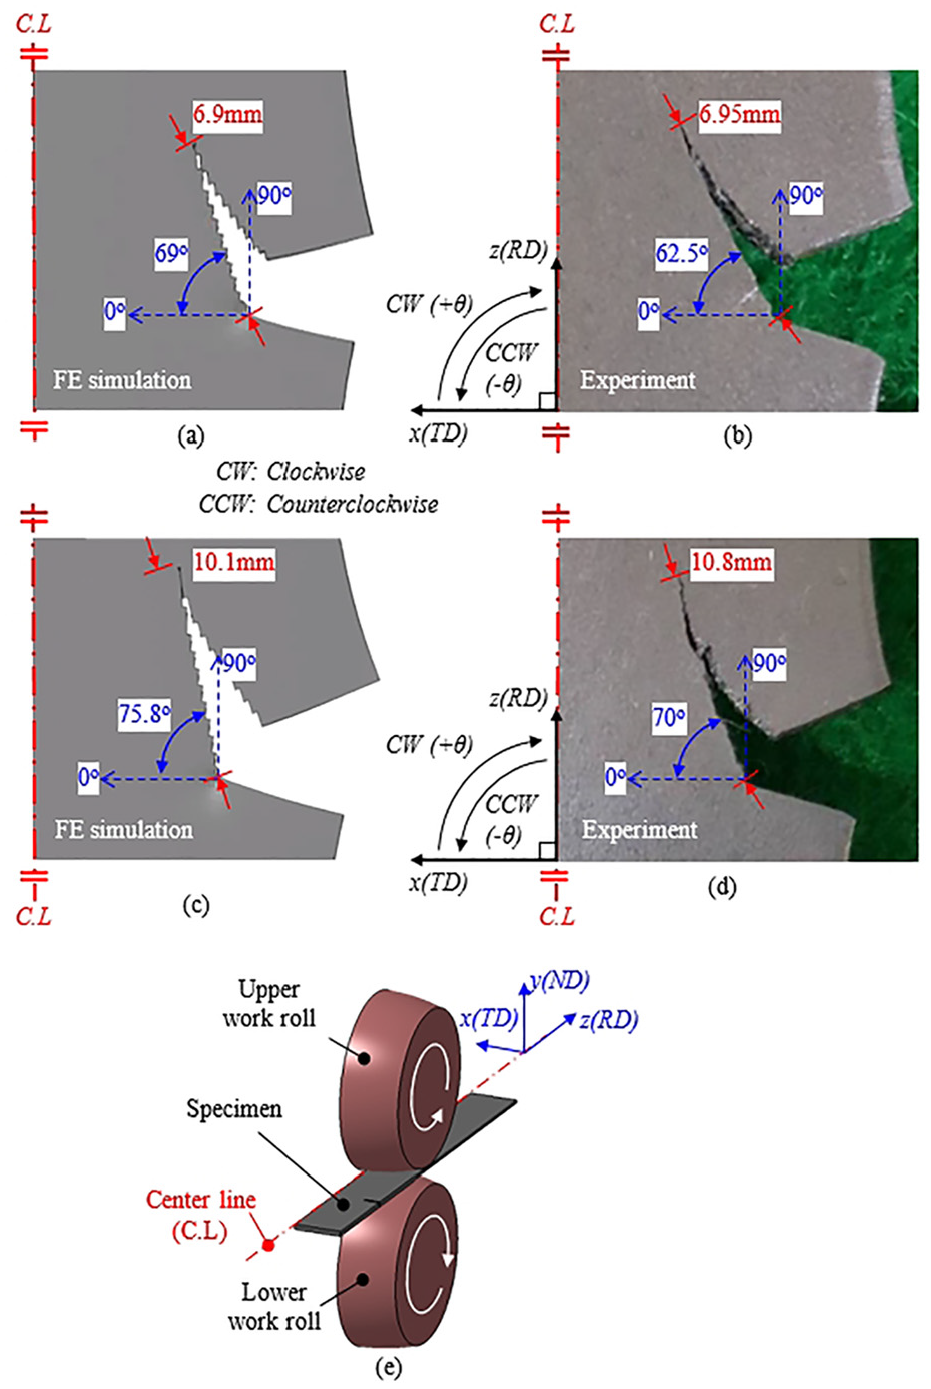
Comparison of the crack growth length and crack growth direction (FE simulation vs. experiment). (a) and (b) when the initial notch length is 4 mm, (c) and (d) when the initial notch length is 6 mm, and (e) the configuration of cold rolling with a convex profile.
Figure 10 presents the distribution of the stress triaxiality and normal stresses generated in a specimen with an initial notch length of 4 mm when the work roll surface with a concave profile was used. This type of work roll surface profile led to greater reduction in the edge regions of the specimen and subsequently lower reduction in the center region. Consequently, compressive stress was generated at the edges, and tensile stresses were generated in the center.
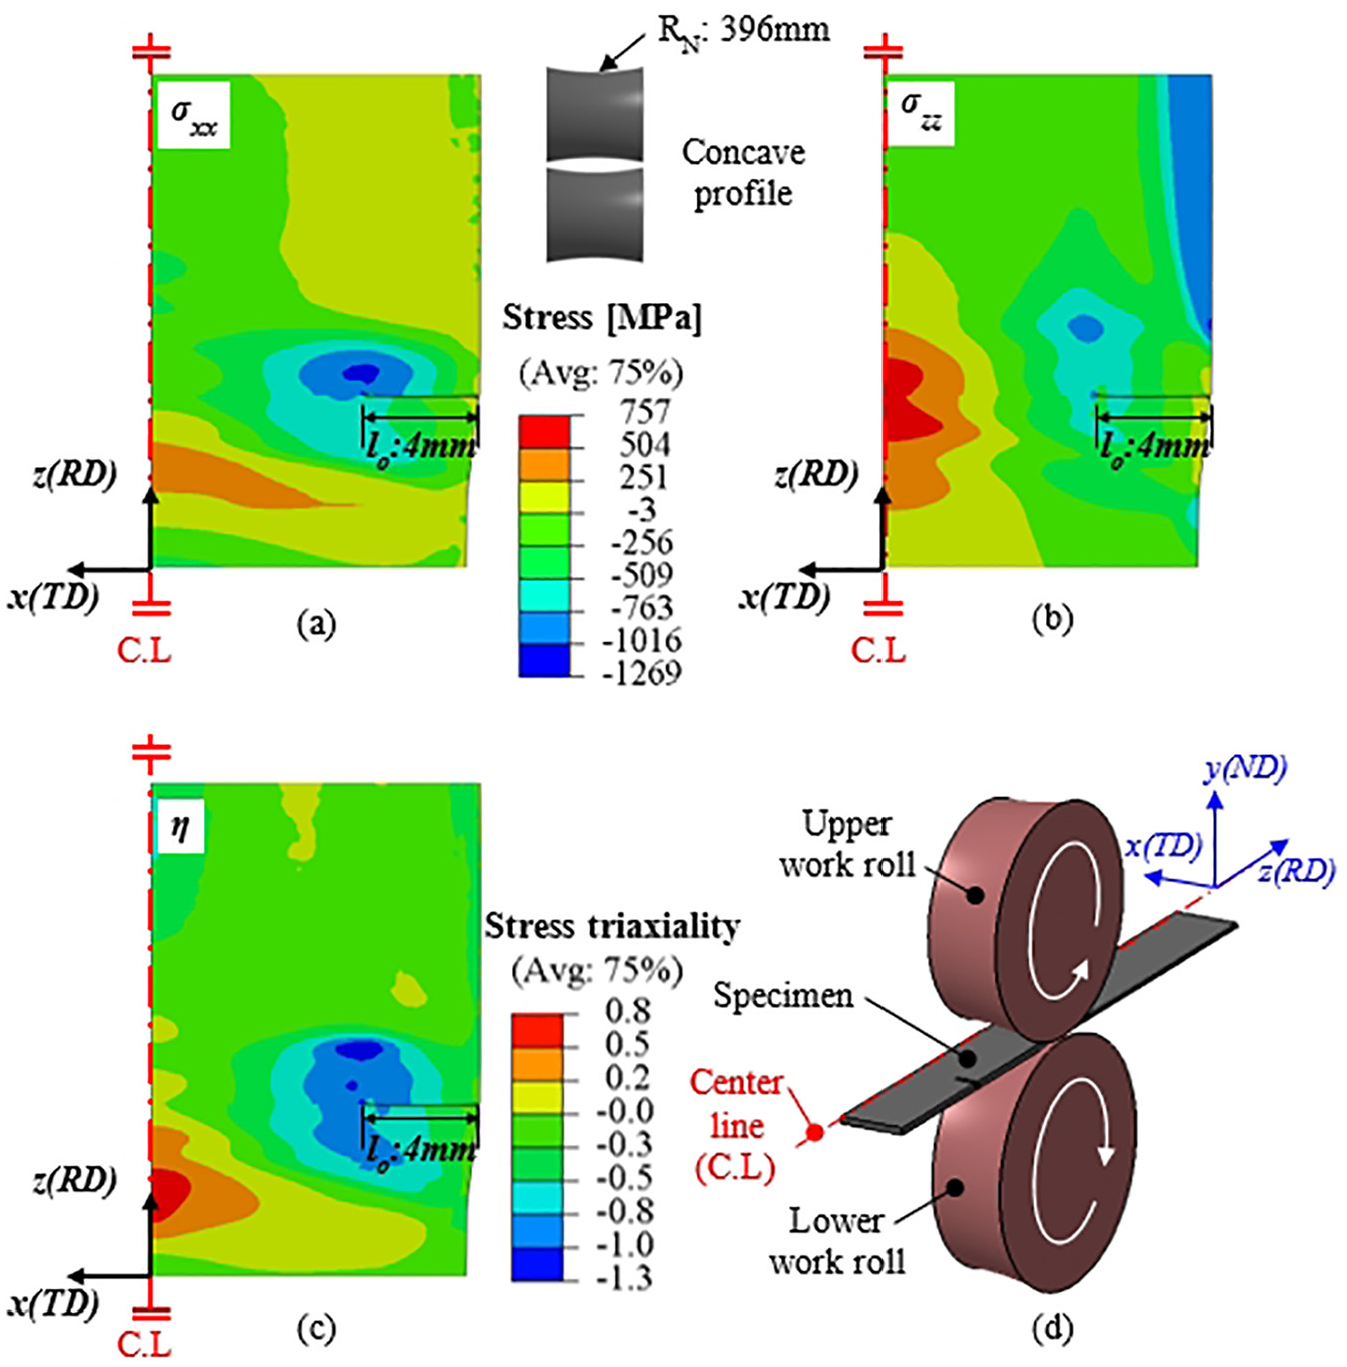
FE simulation when rolled using a concave profile work roll. (a) σxx(TD) distribution, (b) σzz(RD) distribution,(c) distribution of stress triaxiality (η), and (d) configuration of cold rolling with a concave profile.
Figure 10(a) and (b) displays the distribution of compressive stresses (
Figure 11 compares the measured notch shapes with the predicted notch shapes when the specimen was rolled by the work roll surface with a concave profile. The closed notch shapes predicted by FE analysis were in approximate agreement with the measurements. Hence, it can be assumed that edge cracking (crack initiates on the side of a silicon strip specimen and propagates at an angle during cold rolling) can be inhibited if the roll bender has the appropriate configuration in a cold rolling mill, that is, the surface profiles of the work rolls are set to be concave or convex in a proper shape.
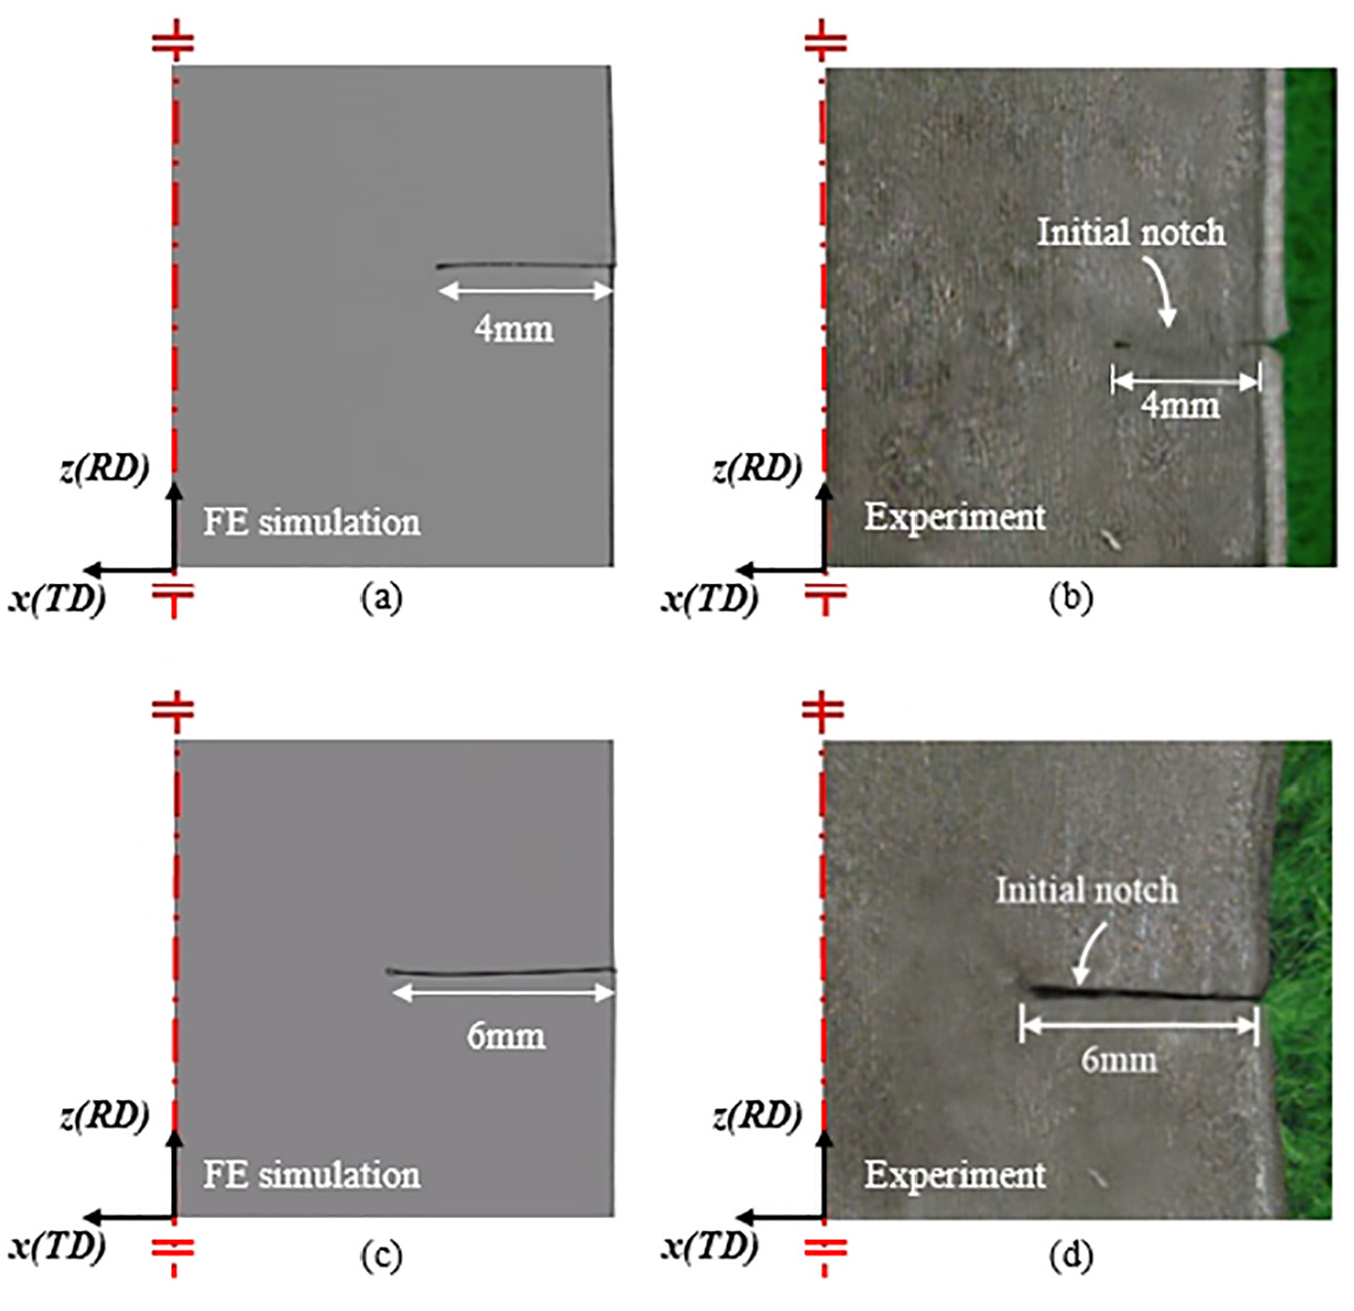
Comparison of crack growth behavior when the specimen is deformed by a work roll with a concave profile: (a) FE simulation and (b) experiment when the initial notch length is 4 mm. (c) FE simulation and (d) experiment when the initial notch length is 6 mm.
Effect of roll-bending profile on CGL
Figure 12 presents the predicted CGL as a function of the ratio of the barrel length (L) to the radius of curvature (RN, RP) of the work roll surface profile. RN is the radius of a concave profile curvature to simulate negative roll-bending, and RP is the radius of a convex profile curvature to simulate positive roll-bending (see Figure 1). In order to represent the two roll-bending modes as dimensionless numbers, RN is written as a negative number and RP is written as a positive number. A flat work roll is represented by an L/RN of 0.
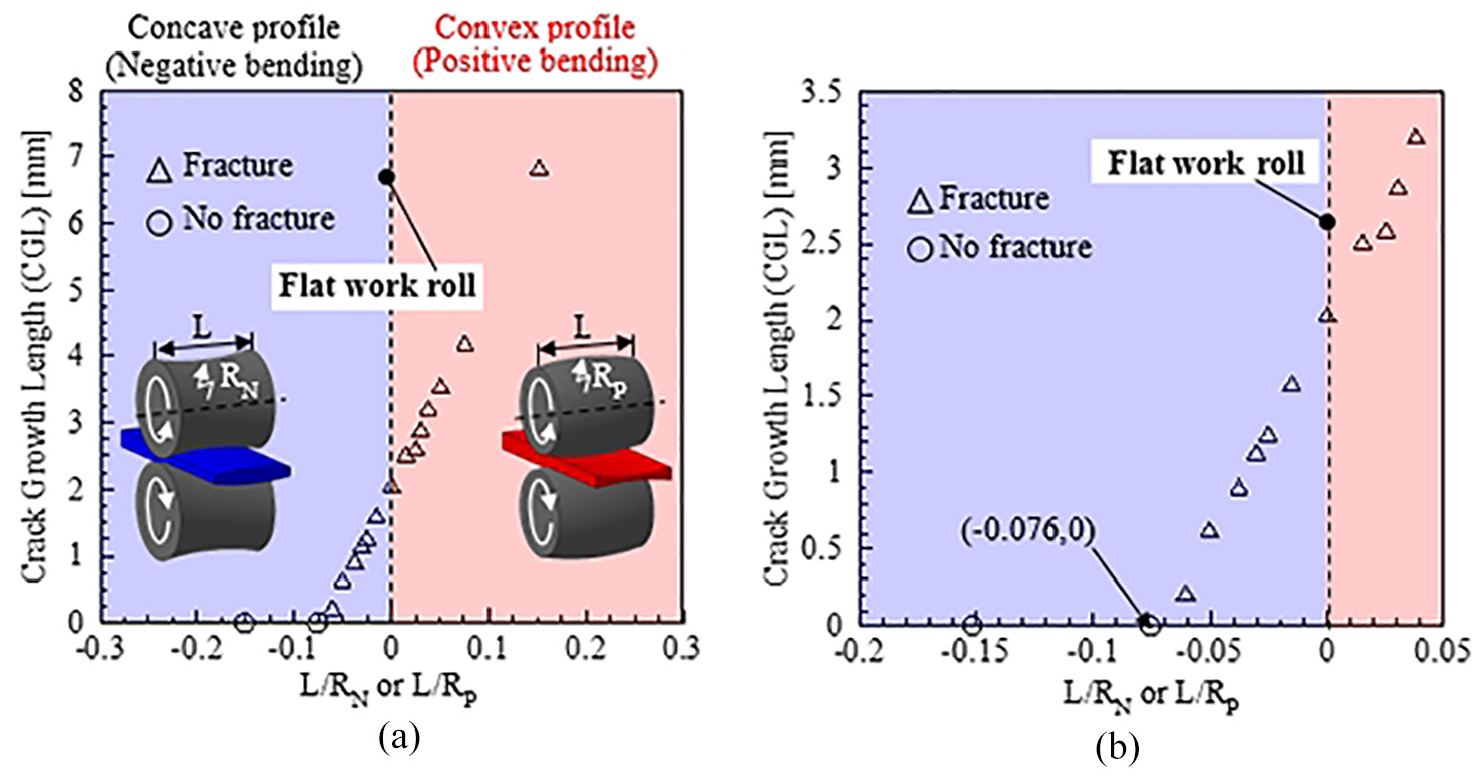
(a) Predicted crack growth length with the variation of the ratio of barrel length (L) to the radius of curvature of the work roll surface profile (RN or RP). (b) Enlarged view.
Figure 12(a) shows that the CGL was high (2.5–6.8 mm) in the positive roll-bending zone (0.15 ≥ L/RP > 0) but decreased almost linearly as RP increased. The convex profile became flatter as L/RP approached zero. It should be noted, however, that edge cracking occurs even when using flat work rolls. This is because there is basically a tensile stress that causes the specimen to stretch in the rolling direction regardless of the work roll surface profile. Figure 12(b) is an enlarged view of Figure 12(a). It can be observed that edge cracking was generated even though the work roll surface had a concave profile (equivalent to negative roll-bending) in the negative roll-bending zone (0 ≥ L/RN > −0.076). It can be seen that the crack growth stopped if the radius of curvature of the concave profile was less than the threshold value of 0.076.
Figure 13(a) and (b) shows stress triaxiality
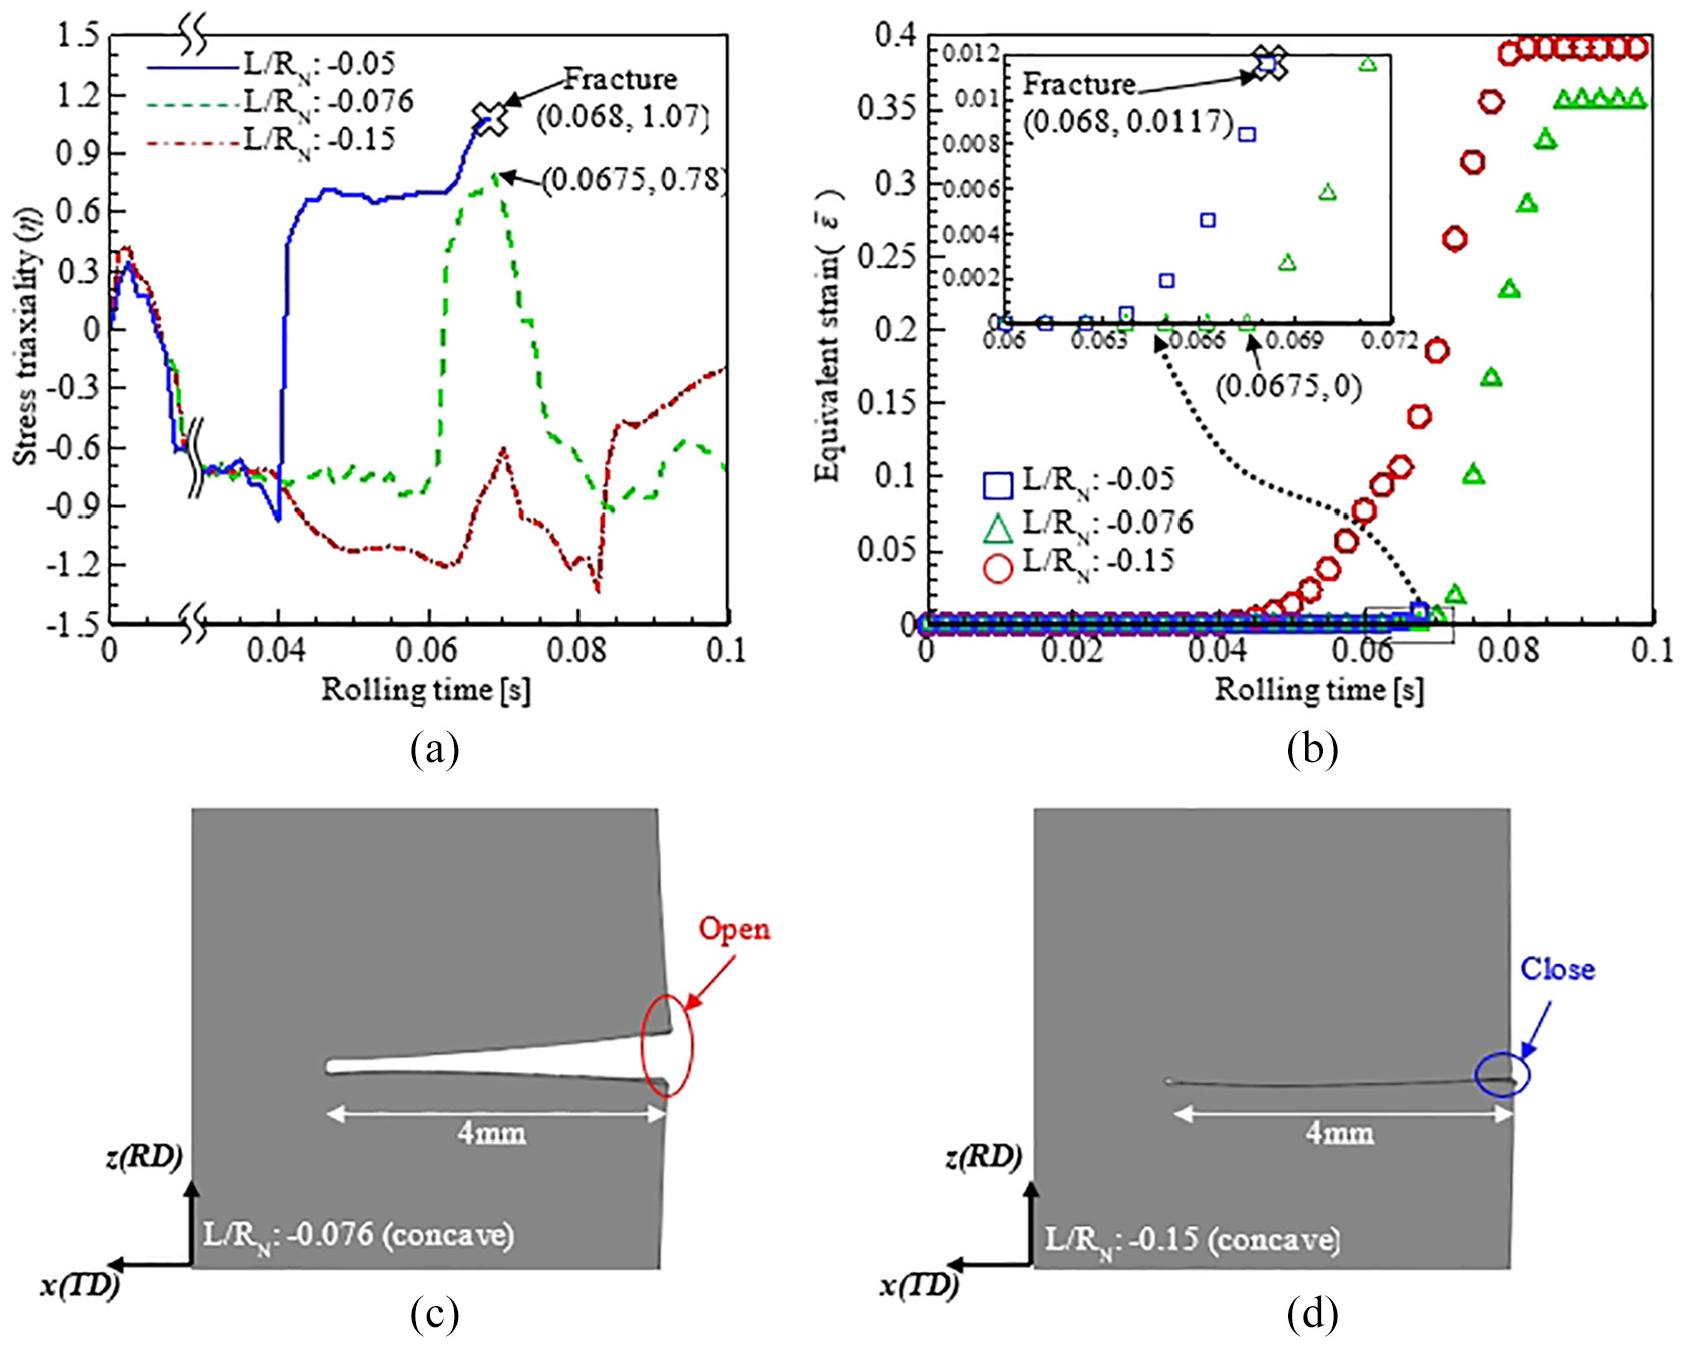
Crack closure behavior when the specimen is deformed by a work roll with a concave profile: (a) history of stress triaxiality, (b) history of equivalent strain, (c) predicted notch shape at L/R of −0.076, and (d) predicted notch shape at L/R of −0.15.
When L/RN was −0.076 (marked as the green dashed line and triangles),
Finally, when L/RN was −0.15 (marked as the red dashed line and circles),
As can be seen from Figure 13(a) and (b), η was less than zero during rolling when L/RN ratio was −0.15. Meanwhile, when the ratio was −0.076,
Figure 13(c) indicates that there was no fracture (edge cracking) at the notch-tip but that the mouth of the notch opened when L/RN was −0.076, and the specimen was deformed by the work rolls with a concave surface profile. Just opening the notch at the edge of the silicon strip in actual cold rolling may not increase the amount of trimming on the silicon strip sides in the longitudinal direction after cold rolling. However, due to fine misalignment of work rolls and backup rolls during operation, the possibility of edge cracking still remains. Hence, the ratio should be increased further to alleviate these concerns.
Figure 13(d) shows that there was no fracture at the notch-tip and that the notch closed when L/RN was −0.15, with the specimen deformed by the work rolls with a concave surface profile. In this situation, the stress triaxiality always remained below zero. Even when a larger reduction ratio was applied to the silicon strip, edge cracking did not occur and the notch-tip closed. Therefore, maintaining the L/RN ratio at −0.15 or lower is likely to limit edge cracking during the cold rolling of high-silicon (3.0 wt%) steel strip.
The work roll surface with a concave shape can cause waviness at the sheet edge. The larger ductile material (for example, low-carbon steel), the more elongation occurs at the edges during rolling. In that case, concave rolls increase chances of prominent waviness generation during rolling. However, the high-silicon steel has low ductility and thus the effect of concave rolls on the waviness can be negligible. However, it is appropriate to use a value near −0.15 because L/RN ratio less than −0.15 may cause waviness at the strip edge.
Concluding remarks
In this study, a 3D FE model coupled with the ductile fracture criterion was set up to compute edge cracking in high-silicon (3.0 wt%) steel strip during cold rolling. The ratio of the barrel length of the work roll (L) to the radius of the curvature of the work roll surface profile (R) was introduced to represent the degree of roll-bending. A series of FE analyses were then carried out to determine the L/R ratio range that suppressed edge cracking after the effectiveness of 3D FE model/analysis combined with the ductile failure criterion was confirmed by pilot cold rolling test. The conclusions are as follows.
The ductile fracture criterion (i.e. the ductile damage model) proposed by Johnson and Cook 9 is suitable for predicting edge cracking that forms in the high-silicon steel strip during cold rolling. To prevent edge cracking, work rolls with a flat surface profile should not be used; rather, a concave surface profile corresponding to negative roll-bending should be employed and the L/R ratio should be lower than −0.15. In addition, the cold rolling process designer may also use the proposed methodology to predict local fracture in high-silicon steel strips when the rolling conditions are changed.
Footnotes
Appendix 1
Declaration of conflicting interests
The author(s) declared no potential conflicts of interest with respect to the research, authorship, and/or publication of this article.
Funding
The author(s) disclosed receipt of the following financial support for the research, authorship, and/or publication of this article: This work was supported by the Dong-A University research fund.