
Abstract
This research investigates the effect of process parameters on real-time temperature and forces distribution during friction stir welding of AA7039. Experiments are conducted at different rotational speed, welding speed, and tilt angle conditions. For the experimentation, a low-cost real-time force-measuring fixture is indigenously developed in-house. However, eight K-type L-shaped thermocouples are used to examine the real-time temperature distribution. The forces in the z-direction are of a higher magnitude than the x-direction. The maximum force in the z-direction of 3.25 kN is witnessed for 2° tilt angle and a minimum of 2.1 kN for 26 mm/min of welding speed. The maximum force in the x-direction of 0.97 kN is obtained at 2° tilt angle and a minimum of 0.27 kN is obtained at 1.3° tilt angle. The maximum temperature of 390 °C is observed at 1812 r/min, whereas a minimum of 283 °C is observed at 43 mm/min of welding speed. The variations in temperature and force distribution during friction stir welding are also evaluated by utilizing two phenomenological models.
Keywords
Introduction
The conventional fusion arc welding of low melting point (aluminum and its alloys, copper, magnesium and its alloys, etc.) metals inflict problems such as porosity and solidification shrinkage. Alternatively, the solid-state-joining processes, namely friction stir welding (FSW), hot press welding, ultrasonic welding, and so on can be successfully employed to join these metals. Among these, FSW is highly suitable for aluminum alloys. Hence, FSW has been widely used in aerospace, spacecraft, marine, automobile, and so on. 1 The process principle of FSW is quite simple. A non-consumable rotating tool with specially designed pin and shoulder is employed for FSW. The frictional heat during (owing to friction between shoulder surface and workpiece) FSW softens the faying surface of plates. The translational and rotational movement of tool produced joint. 2
Both thermal and mechanical aspects significantly affect the quality of joints. Besides, tool forces are responsible for an indirect evaluation of shear stress acting on the interface between tool and workpiece that helps in determining the heat generation and plastic flow during the process. 3 Thus, forces significantly affect weld quality. The process parameters, namely rotational speed, welding speed, tilt angle, tool-related parameters, and so on significantly affect the force and heat distribution during the process.4,5
Numerous research works have been conducted on experimental study on FSW of aluminum alloys. Investigators tried to study the mechanical and metallurgical properties of FSW welds under different welding conditions. Verma et al. 6 tried to enhance the weld quality of FSW AA6082 plates using different pin geometries. It is found that the square pin provides an improved result. It is also observed that the minimum temperature is observed at the FSW joint fabricated by the square pin profile. Azimzadegan and Serajzadeh 7 studied the effect of rotational speed on FSW joints. The maximum joint strength is achieved at a rotational speed of 1300 r/min and a welding speed of 40 mm/min. The grain size of the nugget zone (NZ) is decreased with an increase in rotational speed. Yaduwanshi et al. 8 conducted FSW with preheating arrangement for joining dissimilar metals and obtained defects-free joints. It is observed that tensile strength and bending strength enhanced. Besides this, literature reports the application of temperature and force distribution during the process.9–16 Yaduwanshi et al. 9 developed a numerical model of heat generation during the FSW process and compared with experimental results under similar working conditions. It is found that the temperature distribution is non-symmetrical in nature with respect to the welding line, and maximum temperature is obtained at behind the tool pin. Verma and Misra 10 employed FSW for joining AA6082 plates. It is observed that the advancing side (AS) temperature is higher than the retreating side (RS) temperature. Besides experimental approaches, numerous models have been established for predicting the thermal and force distribution during the process. Su et al. 11 employed computational fluid dynamics (CFD) model for analyzing the thermo-physical phenomena during FSW. The temperature obtained by the model is in line with the experimental results. Shi and Wu 12 developed a transient model to determine heat distribution during the FSW process. The heat input is increased from the plunging stage and reaches peak value until the tool shoulder contacts with the workpiece surface. Longhurst et al. 13 used various modeling techniques for a better understanding of force distribution under different process parameters. Jain et al. 14 developed a model to study the effect of pin profile on the FSW process. This model is validated with the temperature, forces, and spindle torque at different welding conditions. It is observed that the triflate pin produces higher temperatures and strain rates. Su et al. 15 used a load cell measurement system for measuring the forces indirectly during FSW with the help of power absorbed by the motor. Cui et al. 16 also predict the tool torque, power, and the specific energy flow during FSW using mathematical models.
It is apparent that researchers predominantly concentrated on mechanical and metallurgical behavior of weld. Limited research work is carried out on real-time force and temperature distribution during FSW. Besides this, in the case of aluminum 7xxx series, researchers primarily focused on FSW of AA7075 and AA7050 alloy. However, these two alloys are enriched with copper content that results in stress corrosion cracking in all atmosphere. In the present-day scenario, AA7075 and AA7050 are replaced by AA7039 owing to better stress corrosion resistance in all atmosphere due to enrichment of magnesium. Moreover, to the best knowledge of authors, no work is reported on real-time force and temperature distribution during FSW of AA7039. The current research discusses the effect of process parameters on real-time temperature and forces distribution during FSW of AA7039. Furthermore, the equipment used to date for measuring the forces and temperature is costly. In this research work, investigators employed an indigenously in-house developed low-cost real-time force-measuring fixture to perform the study. Also, the variations in temperature and force distribution during FSW are described utilizing two phenomenological models.
Material and procedure
Workpiece preparation
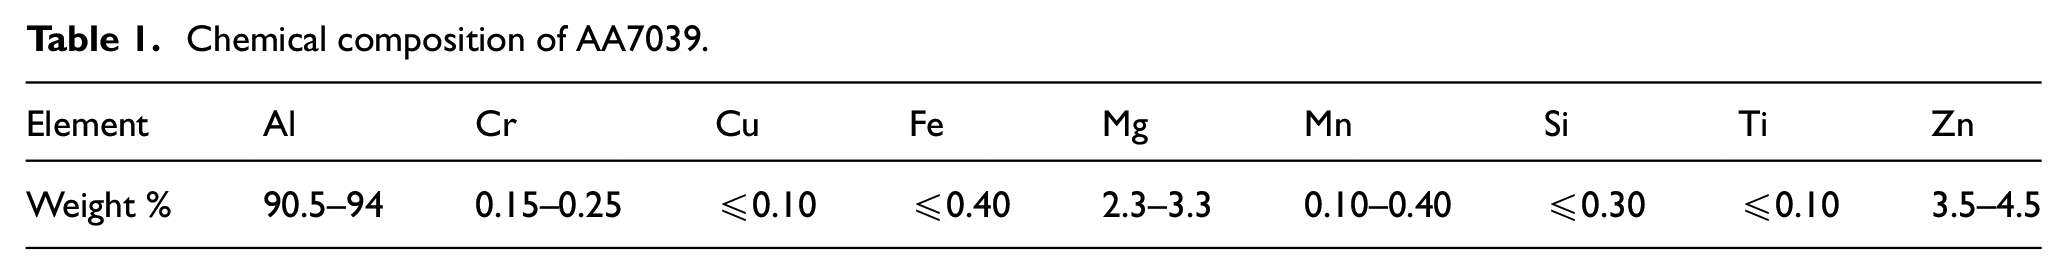
Rolled sheet having 4.35 mm thickness of AA7039 is butt joined by the FSW process. The specimen plates are cut from the rolled sheet utilizing power hacksaw to a dimension of 75 × 100 (W × L (mm)). Then, the faying surfaces sheets are appropriately matched using a vertical milling machine. The chemical composition of AA7039 is presented in Table 1.
Chemical composition of AA7039.
Experimental setup and measurements
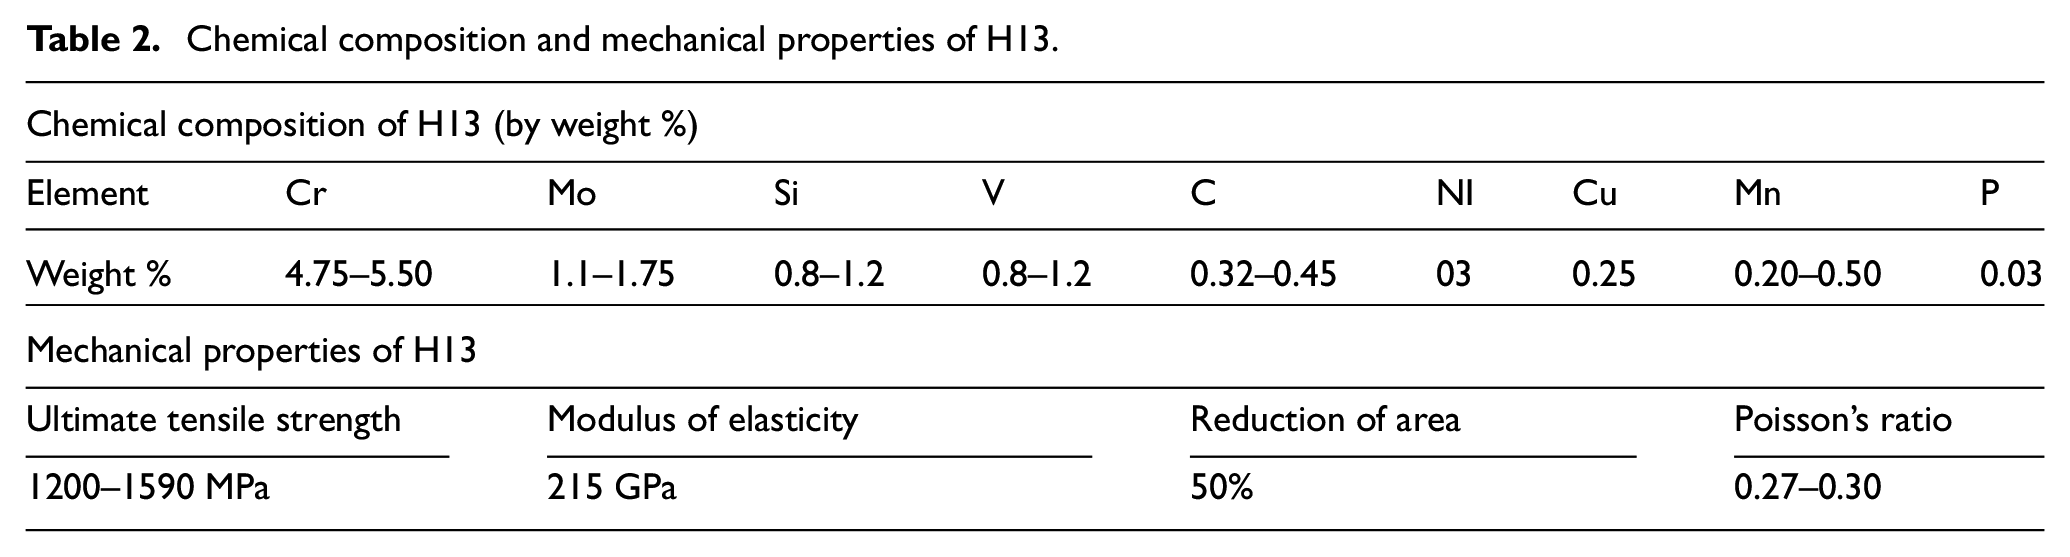
For the current research, a vertical machine center (VMC) is modified by fabricating fixture and tool for performing FSW operations. The developed fixture has a provision of real-time measurement of frictional temperature and forces during the process. The schematic and photographic diagram of the experimental setup for FSW is depicted in Figure 1(a) and (b). Figure 1(c) illustrates the schematic and photographic view of the fabricated tool. The tool is made up of H13 material (54–56 HRC), and properties of tool material are presented in Table 2. The shoulder of the tool is kept 16 mm in diameter with a concavity of 8° at the bottom surface. The tool pin geometry is square with a length of 4.1 mm. The dimensions of the fabricated tool are depicted in Figure 1(c).
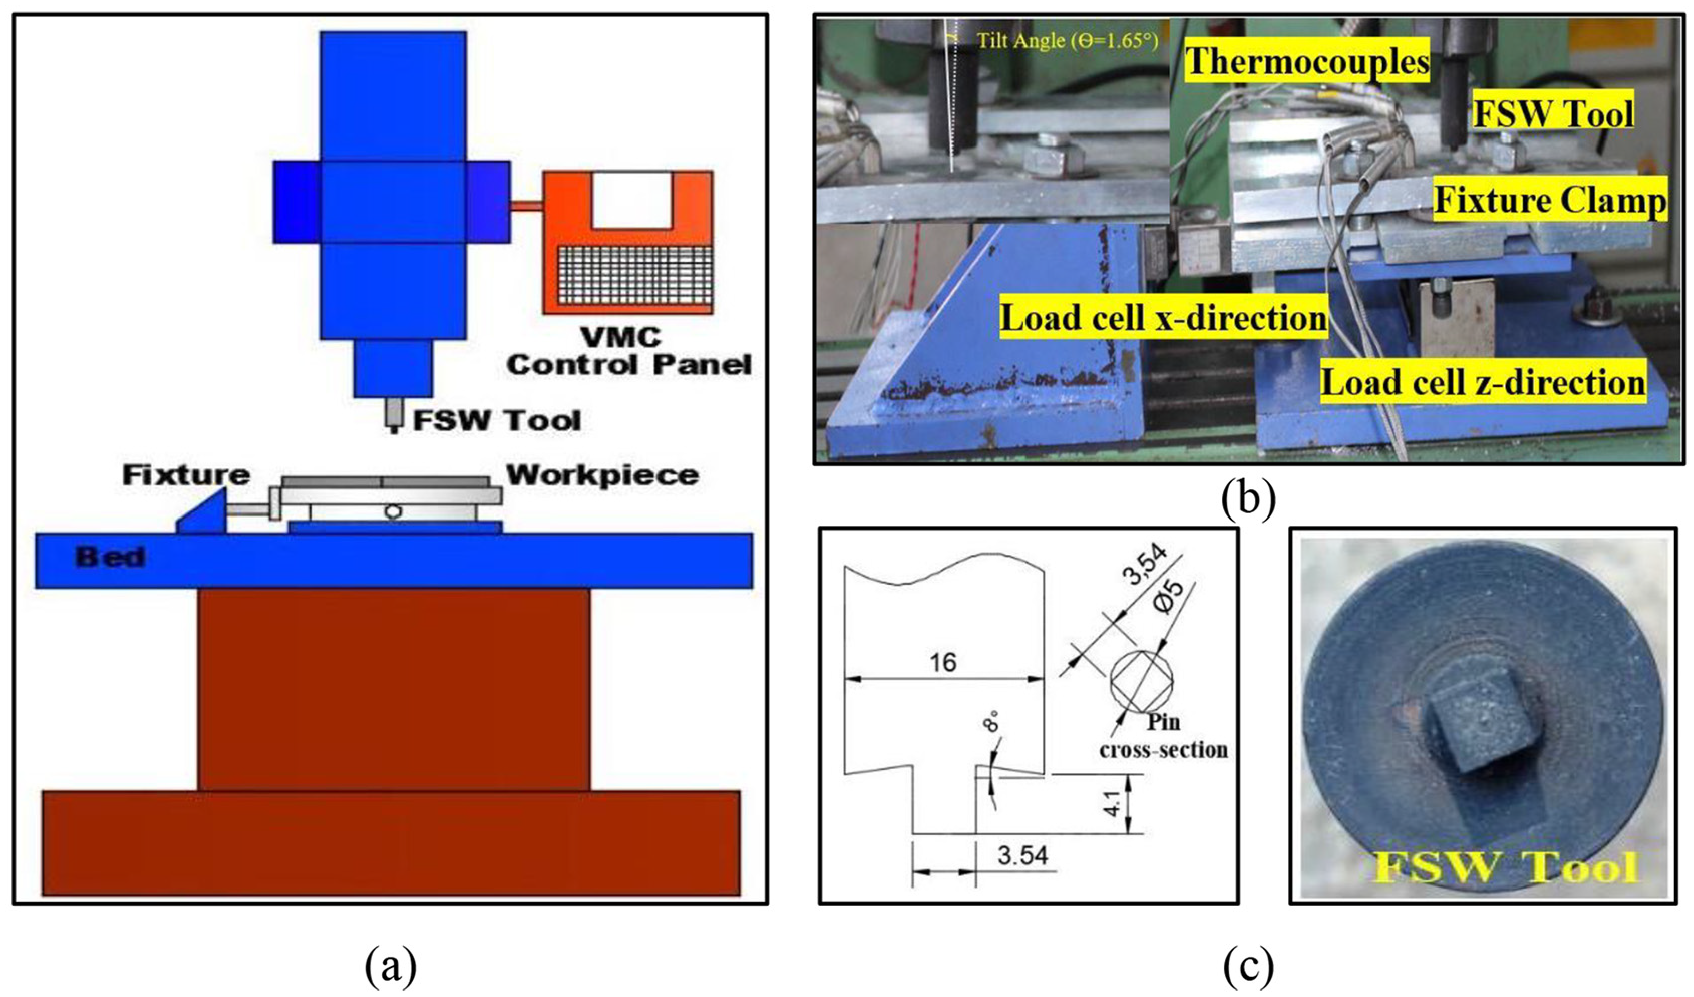
(a) Schematic diagram of machine, (b) photographic view of FSW setup, and (c) schematic and photographic view of fabricated tool (dimensions are in mm).
Chemical composition and mechanical properties of H13.
Force measurement system
A fixture is specially designed for measuring forces during the FSW process. The schematic and isometric views of the fabricated fixture is depicted in Figure 2(a) and (b). The photographic view of the fabricated fixture is shown in Figure 2(c). The detailed dimension of the developed fixture is available in Verma et al. 17 It consists of three components, namely load cells, transducer unit, and clamps and plates. Load cells are utilized for measuring the forces in two directions, that is, x-direction and z-direction. The S-type load cell is used for measuring x-direction forces, while the bending load cell is used for measuring z-direction forces. Unlike other typical load cells, S-type load cells take its name from its shape. These load cells are used in many successful choices of applications because it provides accuracy and compact design features. S-type load cells deliver excellent performance in both tension and compression. A transducer unit is employed to collect the data and convert it into a usable form, as shown in Figure 2(d). Clamps and plates are utilized for supporting and holding the workpiece during the process.
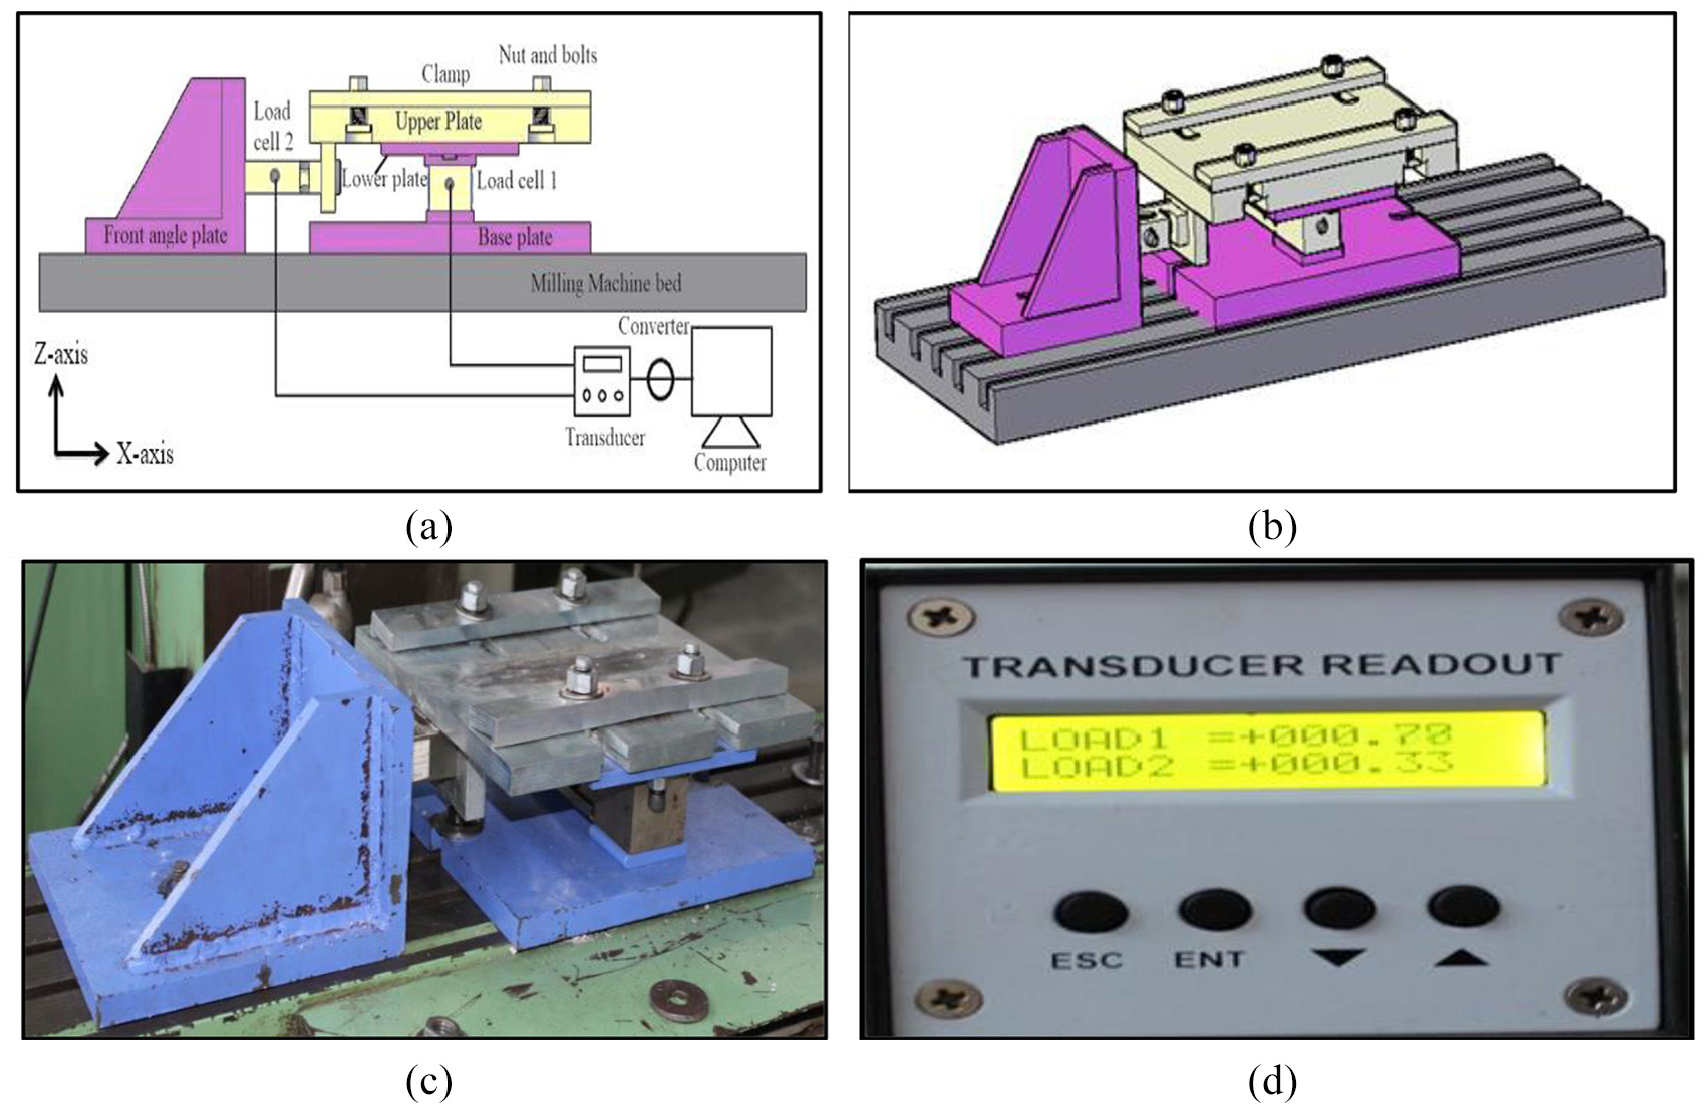
(a) Schematic diagram of fabricated fixture, (b) isometric view of fabricated fixture, (c) photographic view of fabricated fixture, and (d) load cell transducer for measuring the forces.
Temperature measurement system
Eight thermocouples, K-type and L-shaped (diameter 3 mm), are employed for measuring the frictional temperature at different positions during the process. The thermocouples are linked with a device named UNILOG (Make: Process Precision Instruments) for data acquisition, as shown in Figure 3. It consists of two units: a channel interface module and a data recorder. The first unit transfers the data from thermocouples to the data recorder while the second unit converts the data into a usable form and records it on an excel sheet. The layout of the thermocouples and photographic view of the temperature measurement system are illustrated in Figure 3. The hole is drilled up to a distance less than 1.5 mm from the base of the plate. The first two thermocouples are put in such a way of preventing the crushing of thermocouples by tool shoulder during FSW.
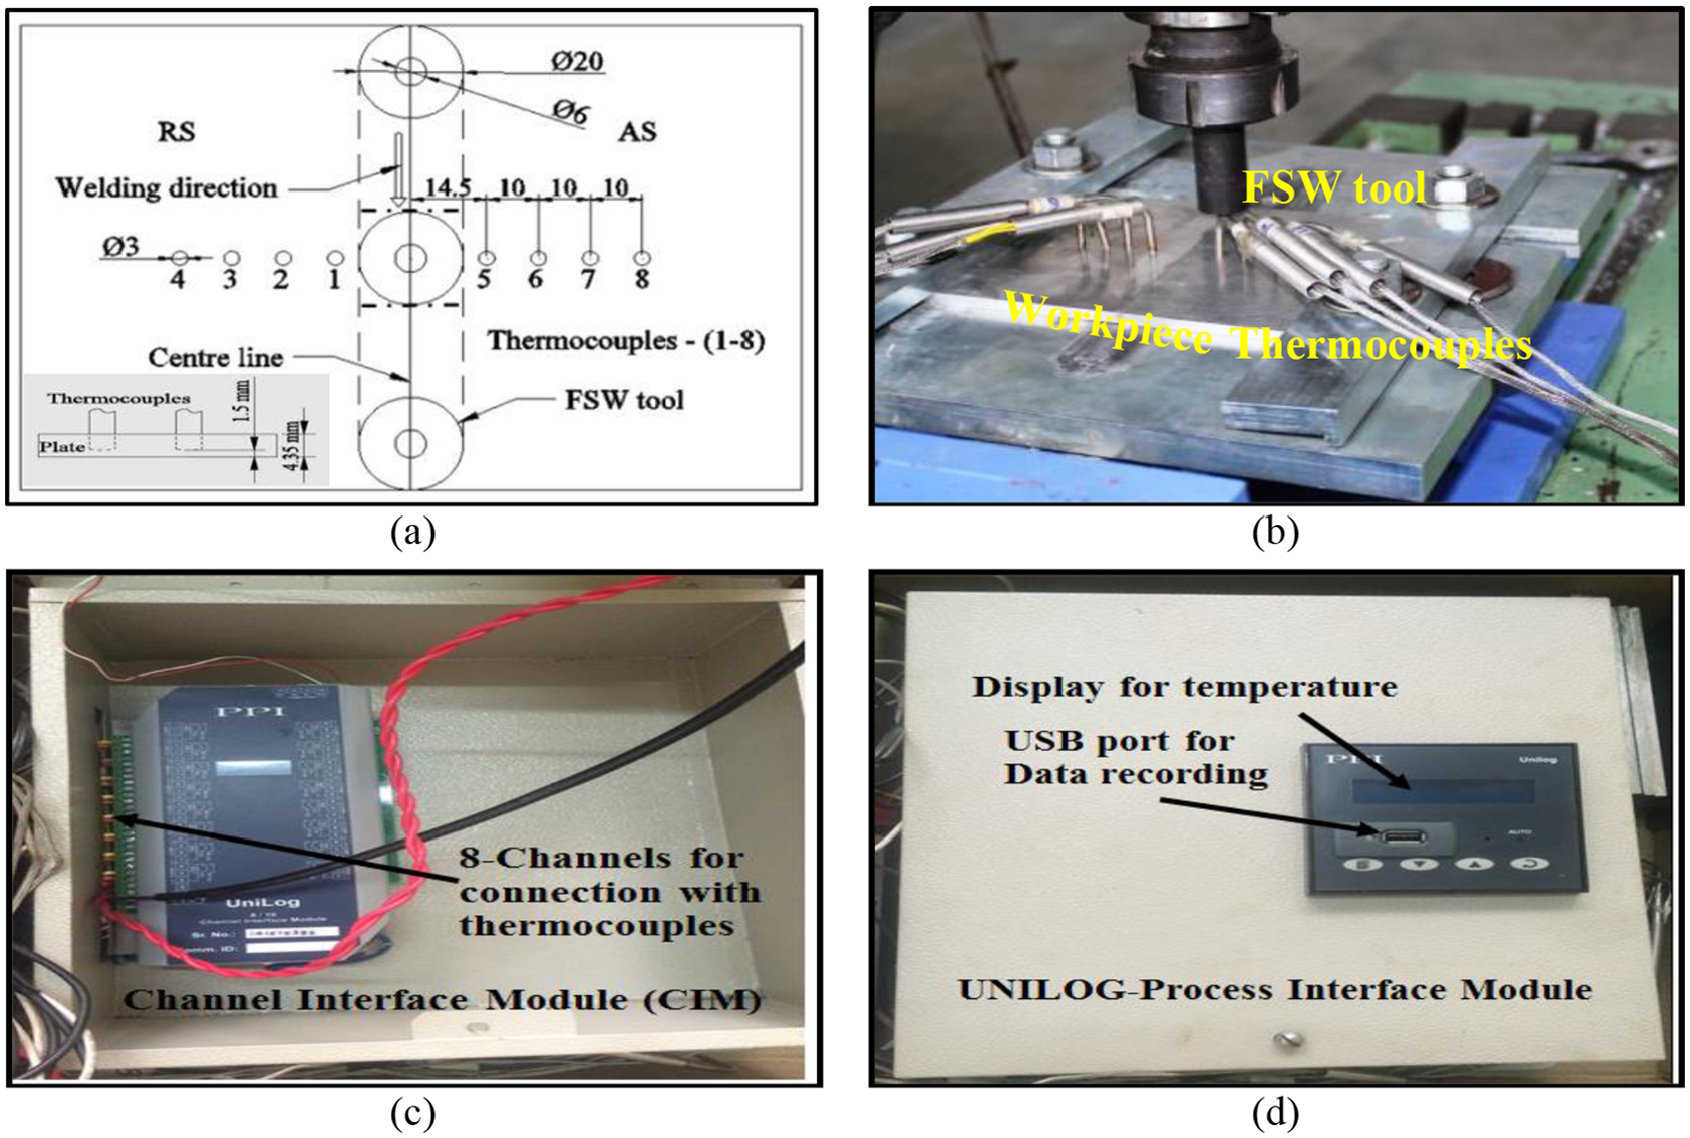
(a) Schematic layout of thermocouples, (b) photographic layout of thermocouples, (c) photographic view of the channel interface module, and (d) photographic view of the universal process data recorder.
Experimentation
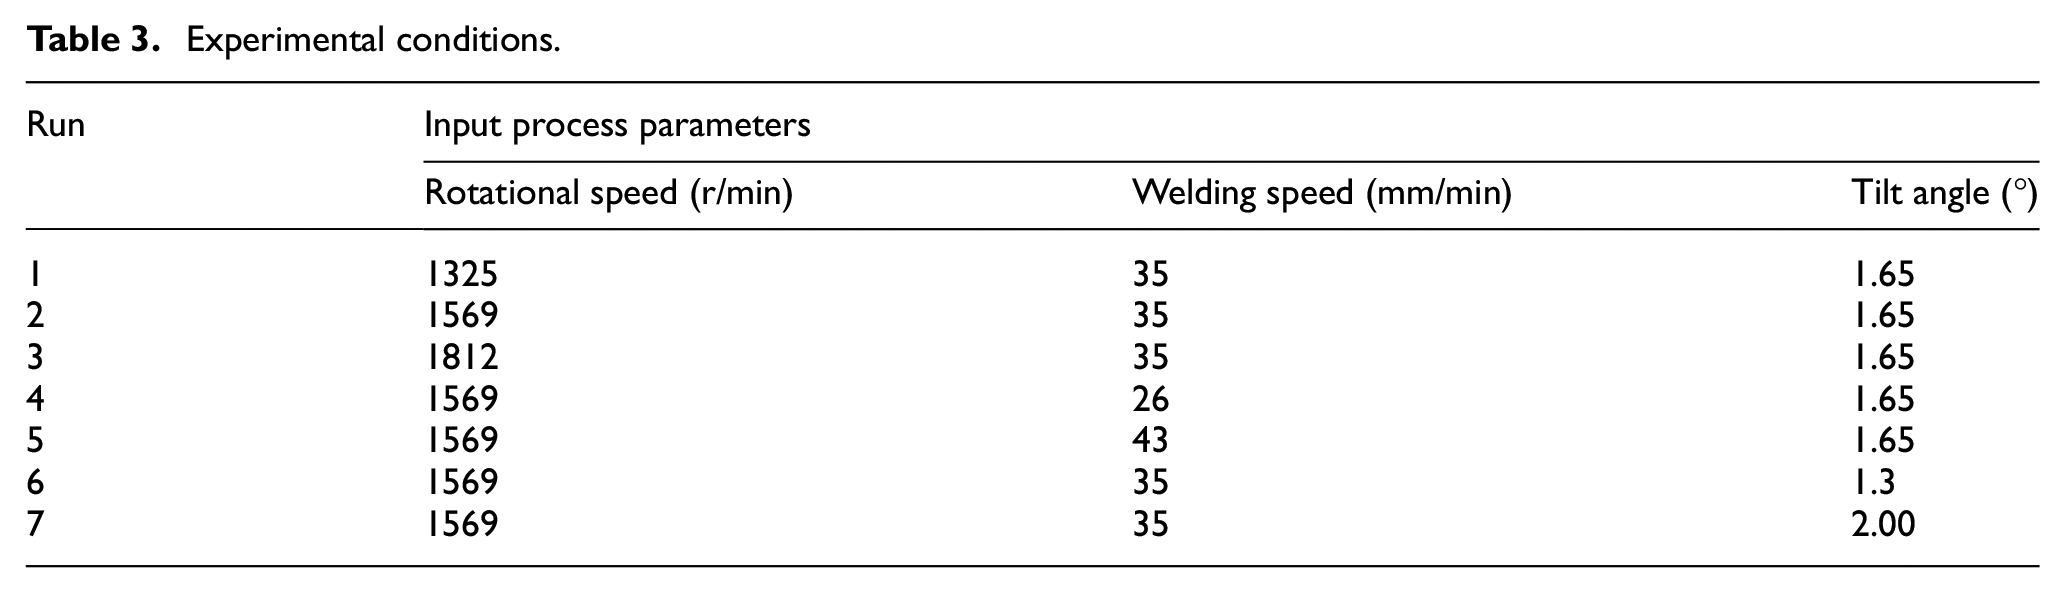
Table 3 presents the experimental condition for this study. Rotational speed, welding speed, and tilt angle are taken into consideration for experimentation. The welding condition is carefully chosen as per the literature. 18
Experimental conditions.
Results and discussion
Thermal analysis
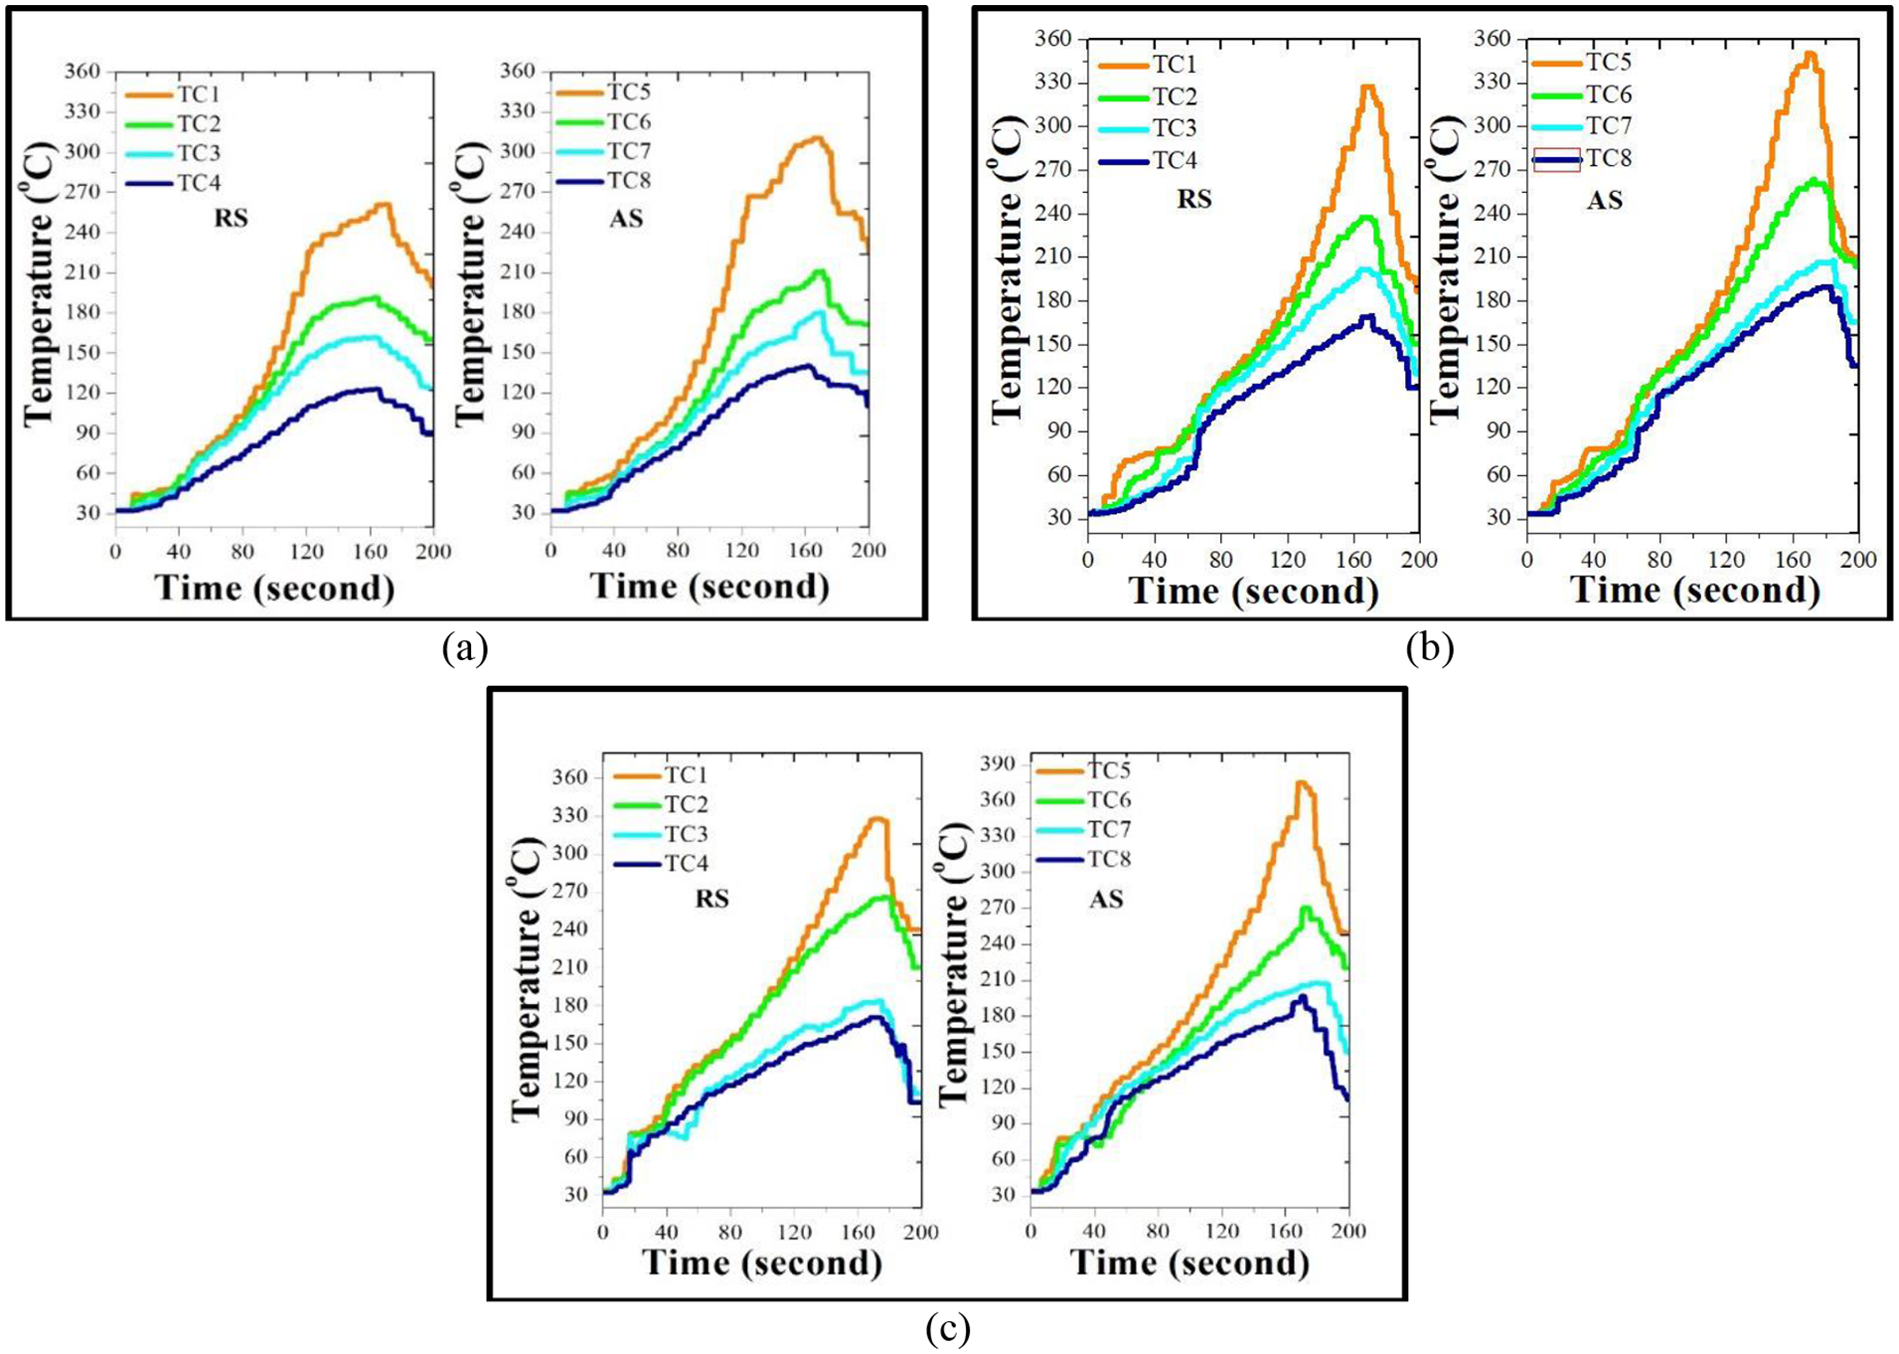
Figures 4–6 depict the effect of process parameters on thermal cycle plots. These thermal cycle plots show the temperature distribution on AS and RS. These thermal cycle plots consist of special features, namely plunge time (PLT), dwell time (DT), process time (PT), and pull out time (POT). It is evident that for the present research, PLT is 15 s and DT is 30 s. Initially, the temperature suddenly rises as the tool pin plunges into the faying surface of aluminum plates. After plunging the pin into faying surfaces, the FSW tool is kept constantly rotating at the initial plunging position without any movement in the longitudinal direction. This time is called DT, that is, 30 s for each experimentation. However, the tool proceeds, and the temperature increases linearly with a temperature gradient depends on the processing time or welding time during the process. During PT, the temperature increases up to the maximum limit and then it starts decreasing during POT. The processing time depends on the welding speed. It rises with a reduction in welding speed. AS temperature is found to be higher than RS for all experimental conditions. It shows non-symmetrical heat generation. This non-symmetry is for material flow from the frontal side of the pin to the backside of the pin during welding. 19 During material flow from AS to RS, the solid material transforms into semi-solid; thus, this semi-solid material is cooled on the RS. Therefore, AS has a higher temperature than RS.
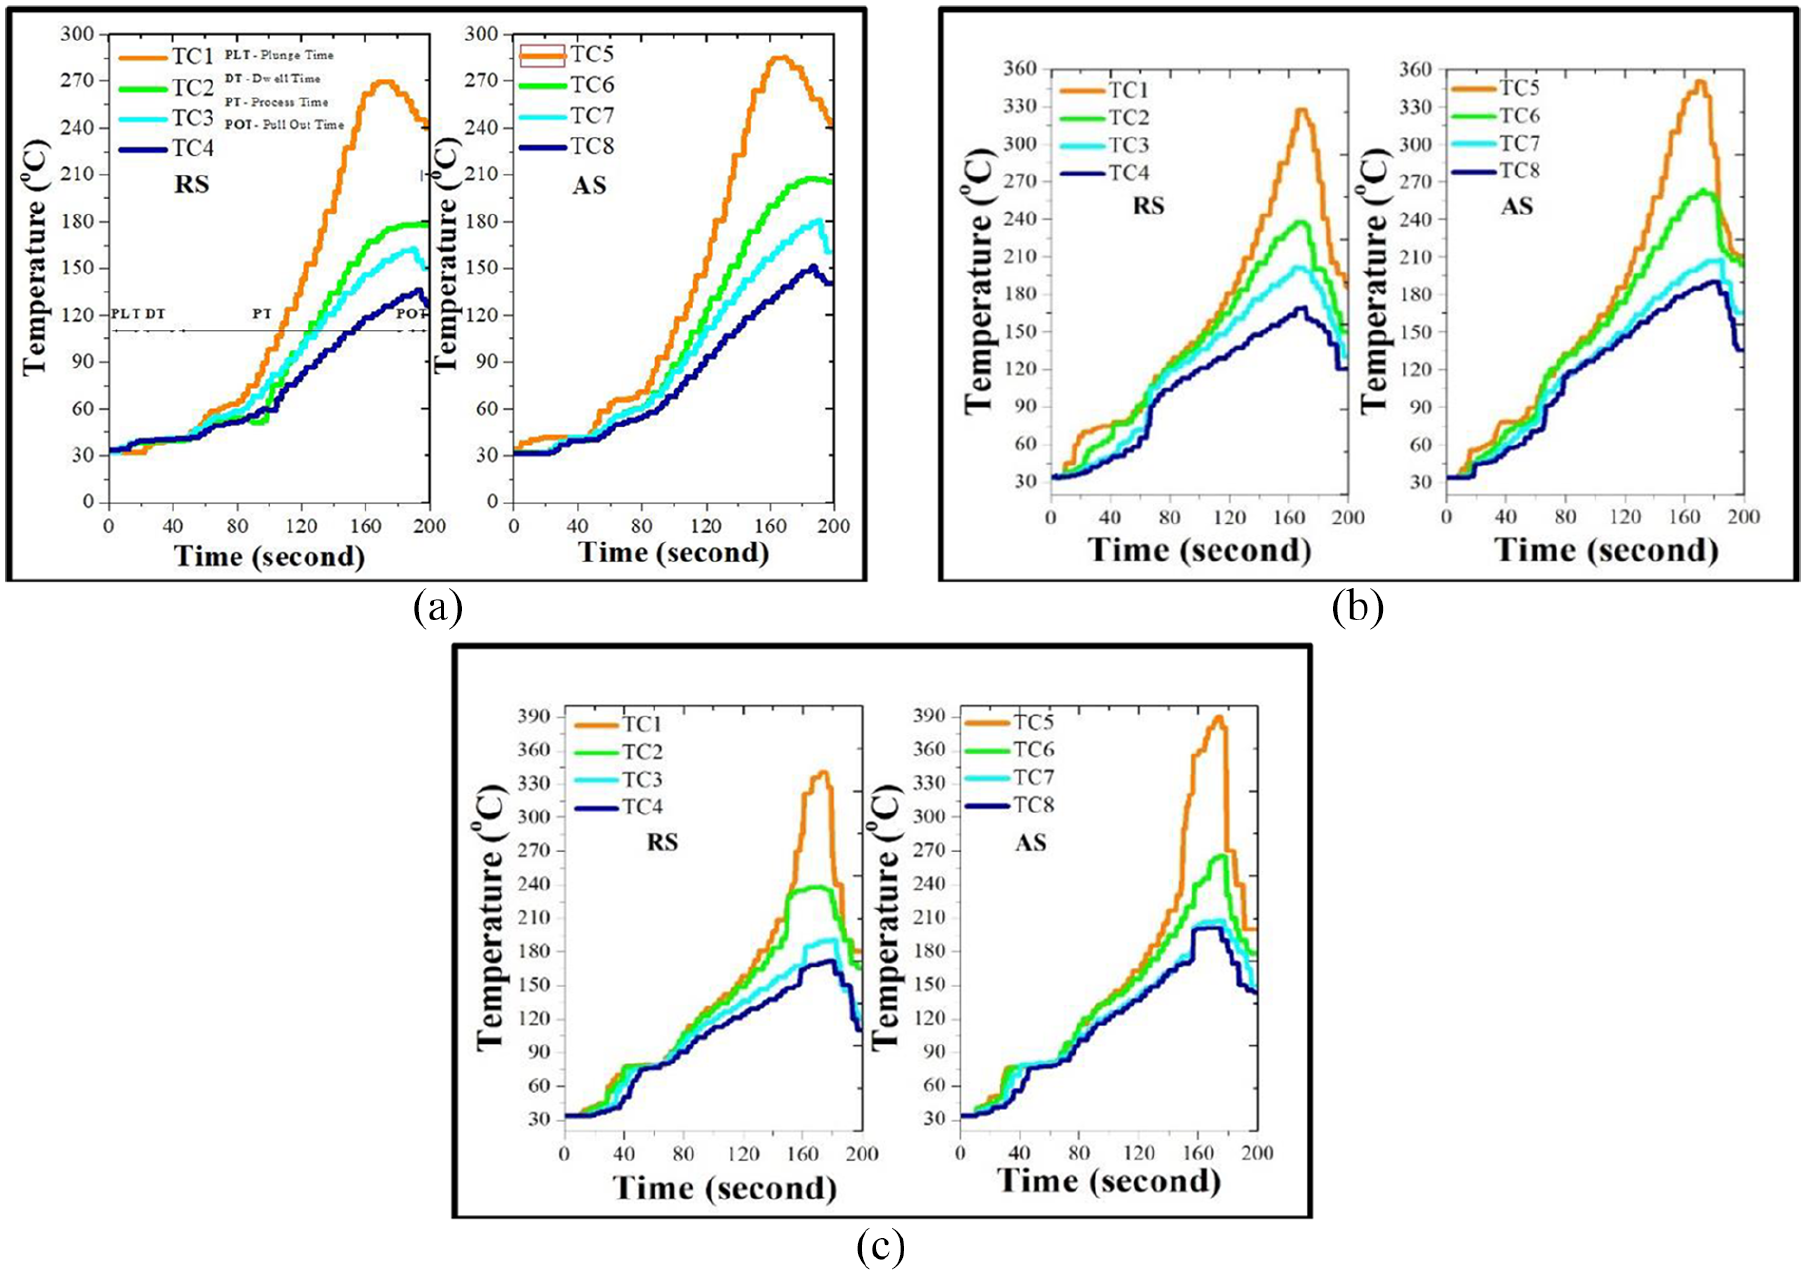
Thermal analysis at constant welding speed of 35 mm/min and tilt angle of 1.65°: (a) rotational speed of 1325 r/min, (b) rotational speed of 1569 r/min, and (c) rotational speed of 1812 r/min.
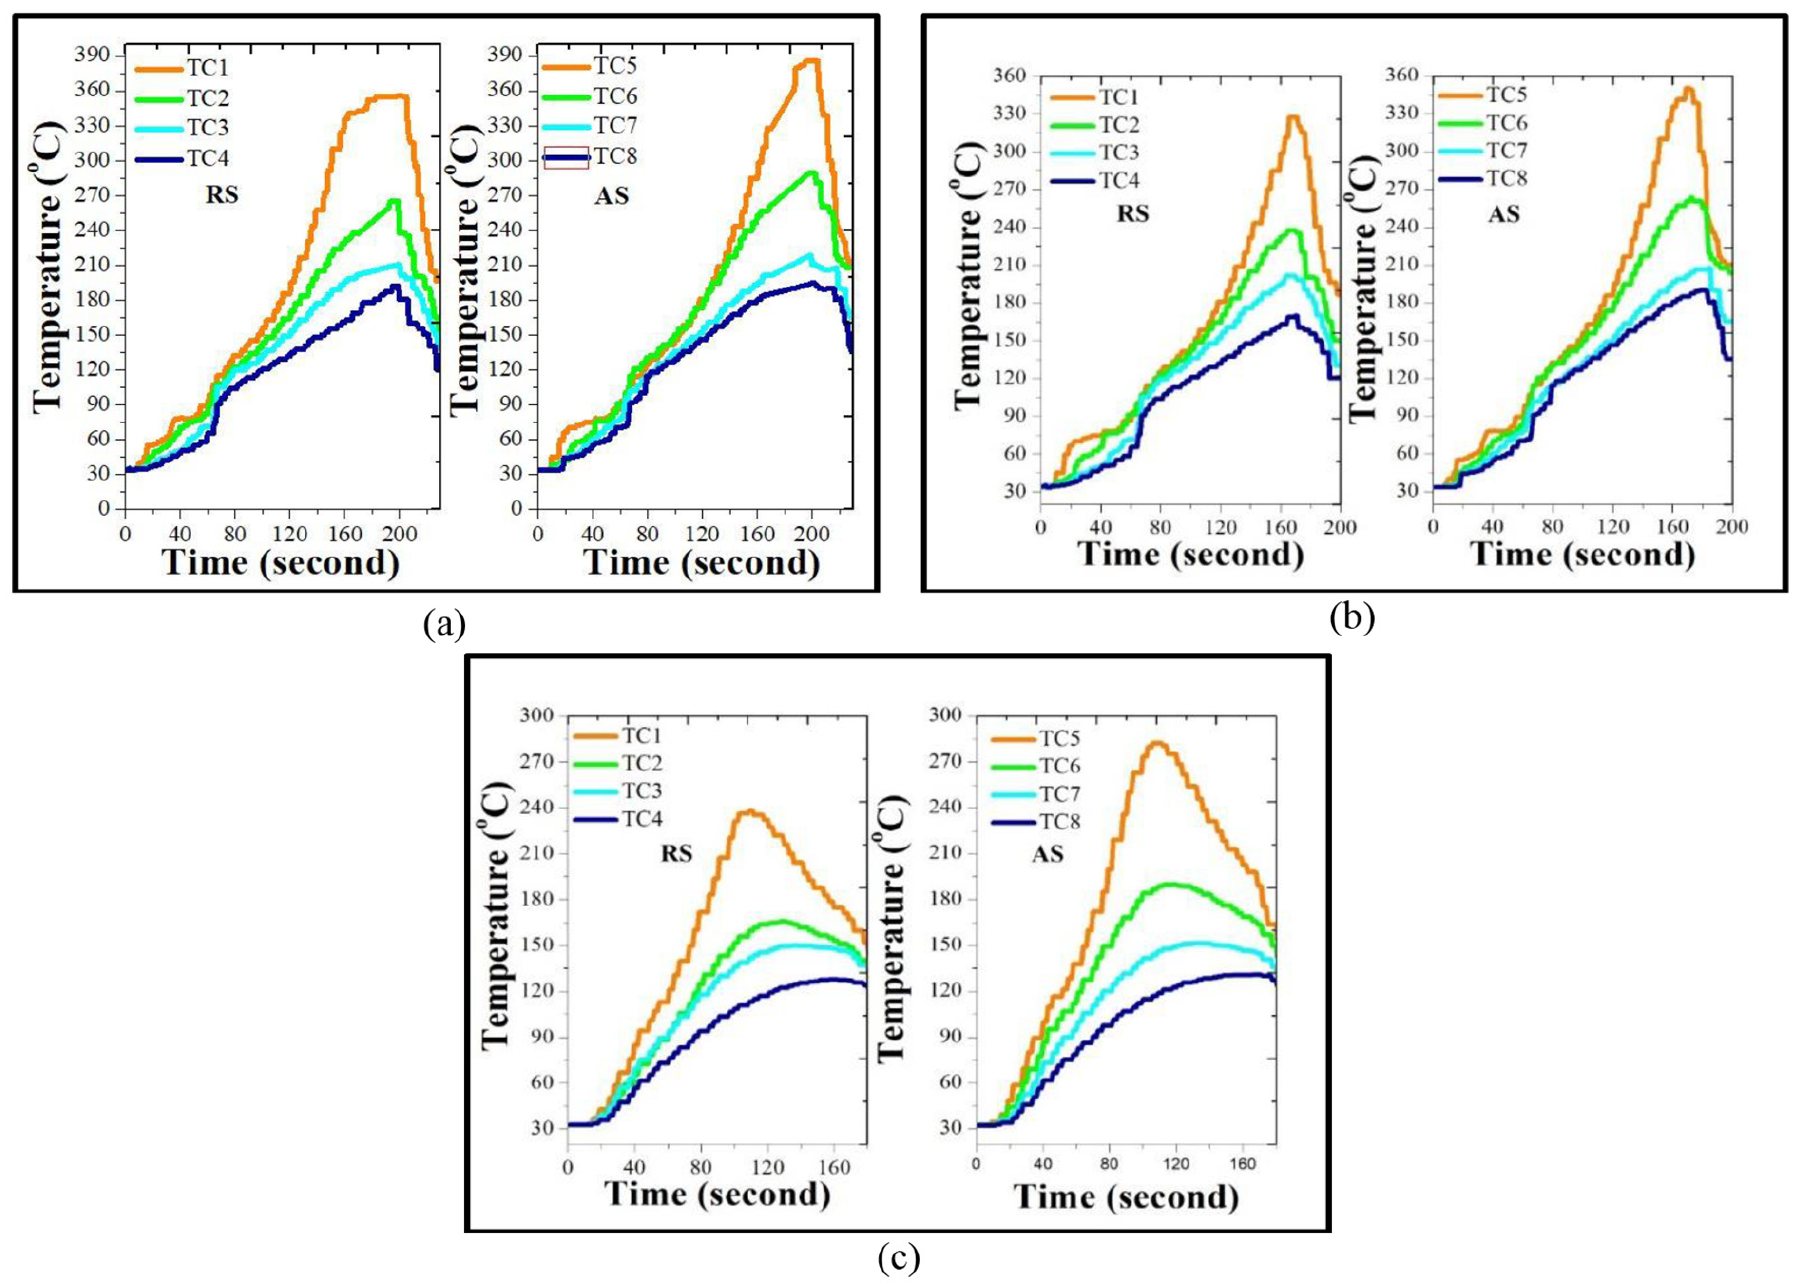
Thermal analysis at constant rotational speed of 1569 r/min and tilt angle of 1.65°: (a) welding speed of 26 mm/min, (b) welding speed of 35 mm/min, and (c) welding speed of 43 mm/min.
Thermal analysis at constant rotational speed of 1569 r/min and welding speed of 35 mm/min: (a) tilt angle of 1.3°, (b) tilt angle of 1.65°, and (c) tilt angle of 2°.
Figure 7 illustrates the schematic representation (phenomenological model) of heat involved during FSW that helps in a better understanding of the above-mentioned trends. This figure also provides information regarding the different positions of the tool during FSW, heat flux, and thermal gradient regions. Heat flux is witnessed changing for movement of the tool in the welding direction. Initially, first thermal gradient region receives a positive heat flux (i.e. Qi) when the tool has come in contact with workpiece plates, a heat flux (i.e. Qo1 (negative)) due to heat loss toward the material along the welding direction and heat flux (i.e. Qo2 (negative)) owing to heat loss to the surrounding of the tool. In addition, other negative heat fluxes are also present due to convection and radiation to the atmosphere as well as conductive heat flux in the direction of the base plate and clamping system of the fixture. As Qi, Qo1, and Qo2 are the heat flux of conductive nature and their values depend on the conductivity of the material, a higher value of thermal conductivity involves higher heat flux. The values of heat flux also depend on the process parameters as shown in Figures 4–6. At the beginning of the process, the temperature of the temperature gradient region is T (°C) (i.e. 33.3 °C). Moreover, the temperature increases suddenly (as shown in Figures 4–6) when the tool pin is plunged into the faying surfaces (position-0). However, as the tool starts to proceed from position-0 to position-1, the temperature further increases because it contacts preheated material leading to the above-mentioned temperature enhancement. In the end, when the tool reaches the exit region, the heat flux (Qo1) reduces by conduction leading to higher heat stored within the temperature gradient region. Then, the temperature goes down during POT.
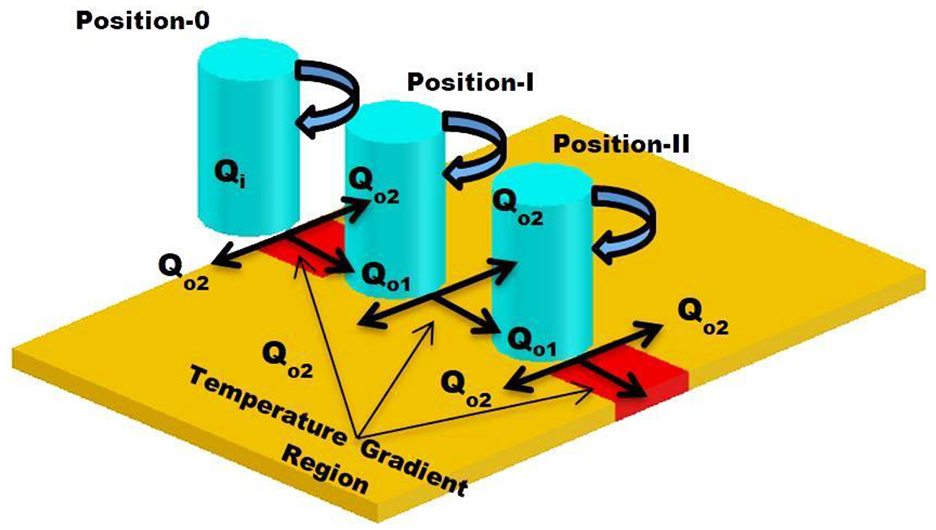
Schematic diagram (phenomenological model) of heat involved during FSW process.
Figure 4 represents the effect of rotational speed at constant welding speed and tilt angle on temperature distribution during FSW. It is evident that the peak temperature increases with an increase in rotational speed from 1325 to 1812 r/min. It is observed that the maximum temperature on the AS, that is, 390 °C is obtained at 1812 r/min, whereas minimum temperature on the AS, that is, 295 °C is obtained at 1325 r/min. This is owing to an increase in friction between tool and workpiece surface with increasing rotational speed resulting in a higher value of Qi.
Figure 5 depicts the effect of welding speed at the constant rotational speed and tilt angle on temperature distribution during the process. It is witnessed that the peak temperature decreases with an increase in welding speed from 26 to 43 mm/min. A maximum temperature of 380 °C and a minimum temperature of 283 °C is obtained on the AS at a welding speed of 26 and 43 mm/min, respectively. As the welding speed increases, the processing time decreases, resulting in low frictional heat input per unit length. It results in lower values of Qi.
The effect of the tilt angle on temperature distribution at constant rotational and welding speed is shown in Figure 6. The peak temperature rises with an increase in tilt angle from 1.3° to 2°. As the tilt angle increases, the depth of the shoulder inside the workpiece increases. It increases the plunge force and, thus, frictional heat input. It is witnessed that a maximum temperature of 360 °C is obtained on AS at a tilt angle of 2°, while the minimum, that is, 300 °C is obtained at 1.3° tilt angle.
Force analysis
In FSW, as the rotating tool touches the faying surfaces of workpiece plates to be joined, different types of forces are produced. These forces play a crucial role in the FSW technique. Generally, vertical (Fz) and transverse forces (Fx) affect weld quality. The heat generation, plastic flow, and homogeneity of metallurgical and mechanical properties are primarily governed by these forces. Figures 8–10 represent the effect of process parameters on force distribution during the process. The force distribution is completed in four stages: PLT, DT, PT, and POT. For the present research, PLT is 15 s and DT is 30 s. The contact surface between the tool and workpiece at the entry and exit of the FSW process also affects the force distribution. At the entry point, when the rotating tool touches the workplates, the forces (Fx and Fz) start developing. In contrast, at exit point after pulling out of tool from faying surfaces, forces nullify owing to lack of physical contact between them. It is witnessed that the Z-direction (Fz) forces are increased during PLT. Then, it drops suddenly during the DT and increases again when the tool proceeds to move. It is also observed that forces in X-direction (Fx) increases very slowly during the DT with the negligible amount. After that, it increases suddenly during welding time due to the movement of the tool in the welding direction. During POT, these forces reach to minimum values owing to less surface contact between the tool and workpiece. Despite the trends described above at the entry and exit regions, the central region shows a monotonic trend for both Fx and Fz. Moreover, it is experienced that Fz (Z-direction) forces are higher in magnitude as compared to Fx (X-direction) forces.
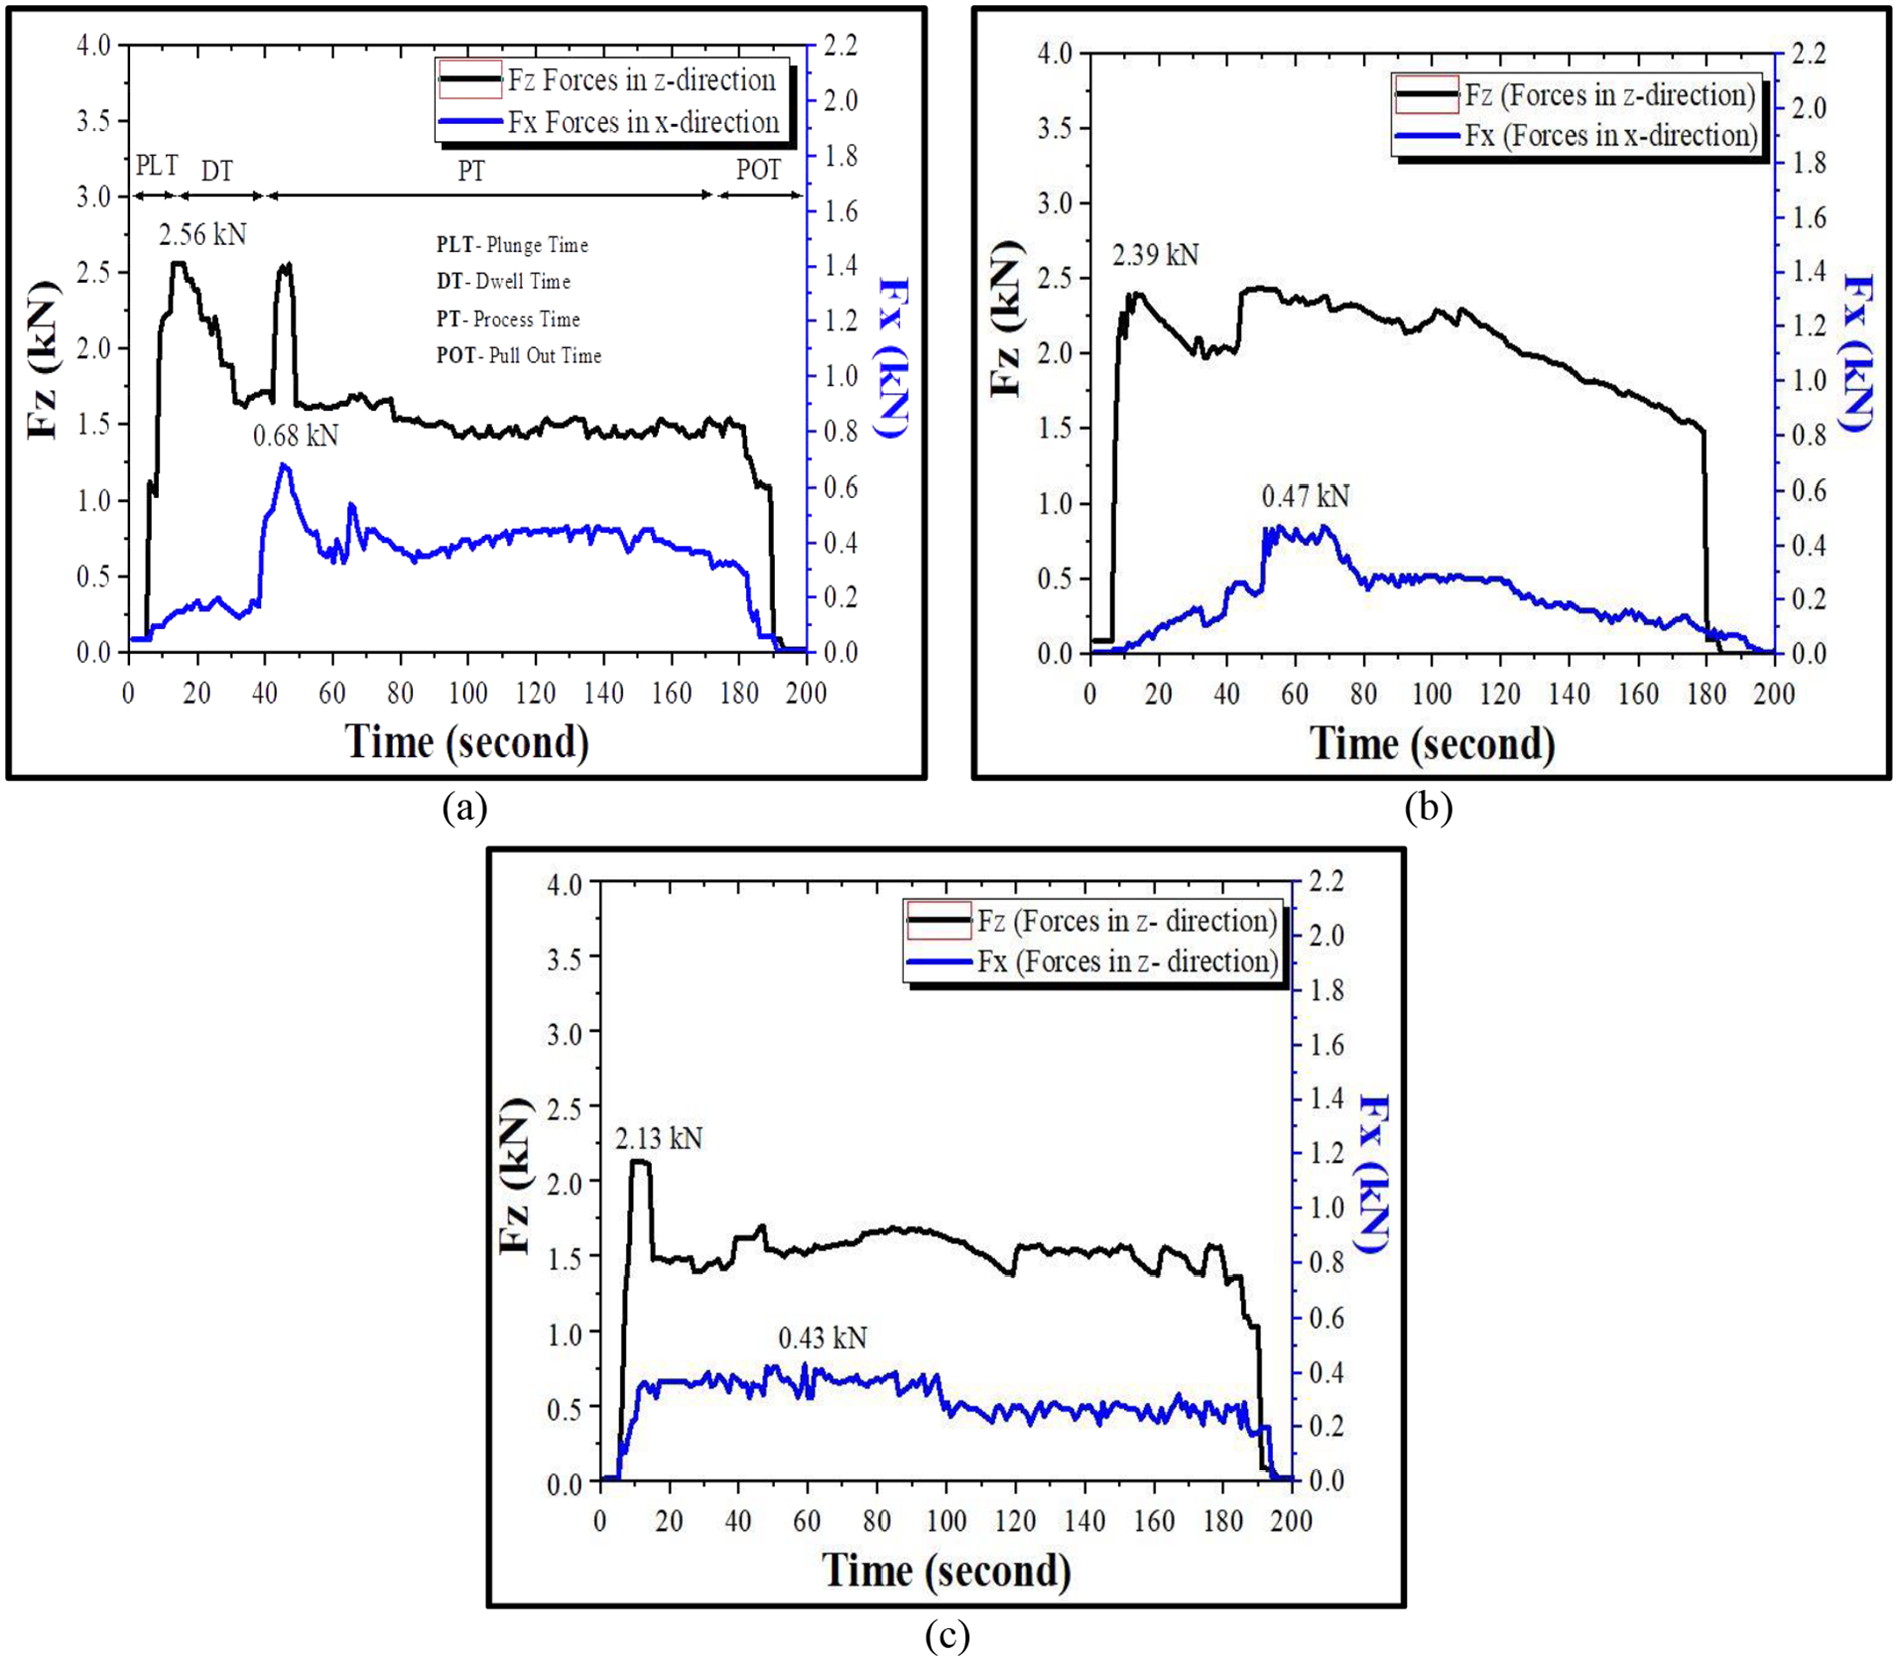
Force analysis at a constant welding speed of 35 mm/min and tilt angle of 1.65°: (a) rotational speed of 1325 r/min, (b) rotational speed of 1569 r/min, and (c) rotational speed of 1812 r/min.
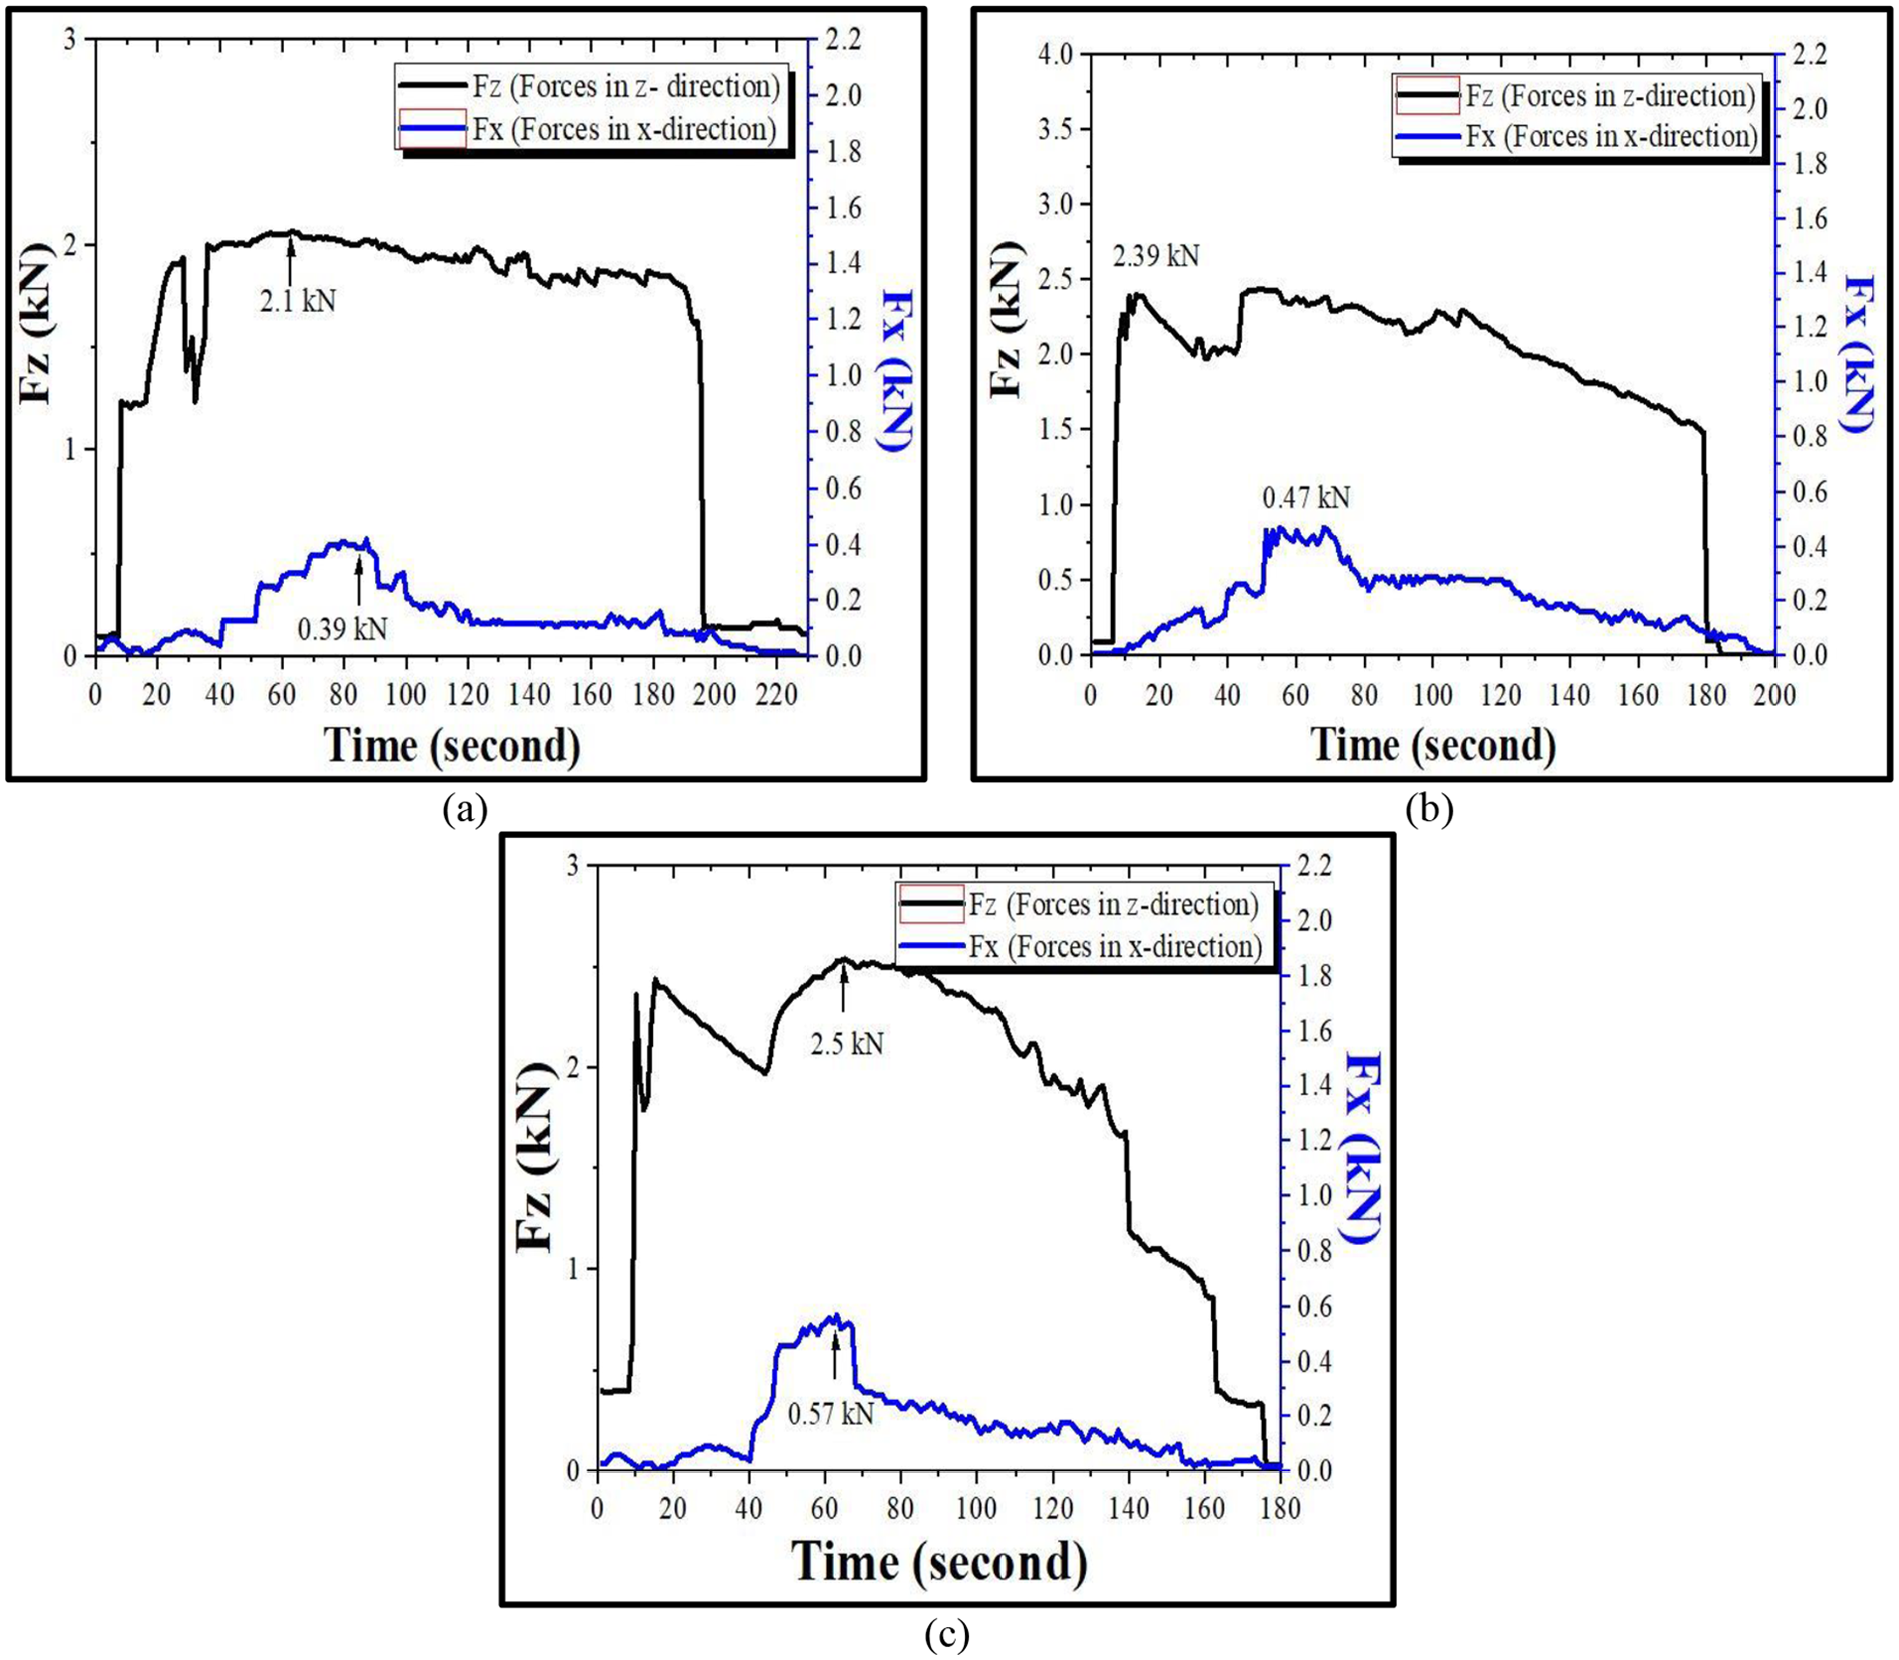
Force analysis at constant rotational speed of 1569 r/min and tilt angle of 1.65°: (a) welding speed of 26 mm/min, (b) welding speed of 35 mm/min, and (c) welding speed of 43 mm/min.

Force analysis at constant rotational speed of 1569 r/min and welding speed of 35 mm/min: (a) tilt angle of 1.3°, (b) tilt angle of 1.65°, and (c) tilt angle of 2°.
Figure 11 depicts the schematic representation (phenomenological model) of force distribution during FSW for a better understanding of the trends described above. When pin plunges between the faying surfaces, two forces Fz and Fx are developed in vertical (Z-axis) and transverse direction (X-axis). The force in X-direction has two components, that is, Fx′ and Fx″. Fx′ opposes the tool motion, as shown in Figure 11. After plunging of the pin into the faying surfaces (up to 4.1 mm), a negative component of force in X-direction, that is, Fx″ is also developed in the reverse direction owing to the flow of material under the tool that partly compensates the component Fx′. It results in a decrement of welding forces in X-direction. This is attributed to a higher magnitude of forces in Z-direction as compared to X-direction.
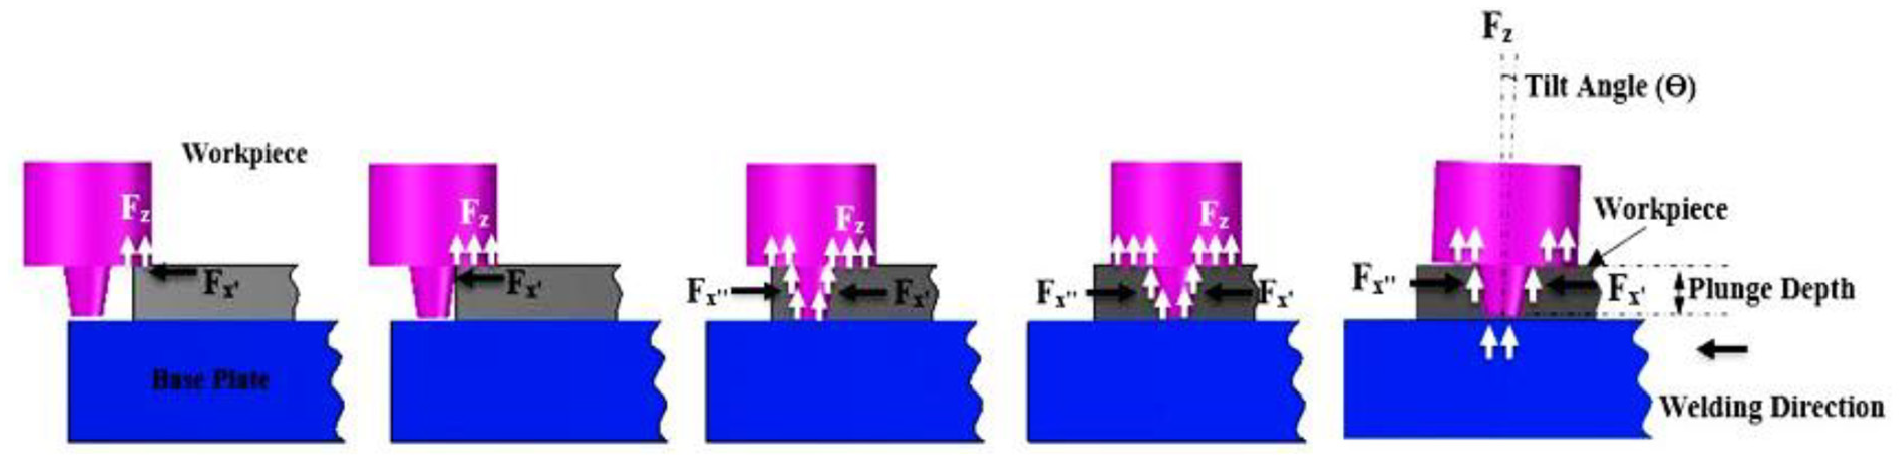
Effect of contact surface on Fz and Fx (phenomenological model).
The effect of rotational speed at the fixed welding speed and tilt angle on force distribution during the process is depicted in Figure 8. It is evident that the Fz decreases with an increase in r/min from 1325 to 1812. The maximum and minimum force of 2.56 and 2.13 kN are obtained in the z-direction, and 0.68 and 0.43 kN are observed in the x-direction at 1325 and 1812 r/min, respectively. This is owing to the reduction in flow stresses with an increase in heat input. These trends are consistent with the findings of Lambiase et al. 20 This reduction in forces with an increase in rotational speed also related to the temperature results discussed above. Higher heat input causes lower force generation owing to the softening of material during the process.
Figure 9 depicts the effect of welding speed at the constant rotational speed and tilt angle on force distribution during the process. It is observed that the forces in the z-direction and x-direction increase with an increase in welding speed from 26 to 43 mm/min. The maximum and minimum force of 2.5 and 2.1 kN are obtained in the z-direction, and 0.67 and 0.39 kN are observed in the x-direction at a welding speed of 43 and 26 mm/min, respectively. It is attributed to the decrease in heat input with increasing welding speed, and thus, increasing forces, as shown in Figure 5.
The effect of tilt angle on force distribution at constant rotational and welding speed is shown in Figure 10. The forces increase with an increase in tilt angle from 1.3° to 2°. As the tilt angle increases, the depth of the shoulder inside the workpiece increases. It results in the formation of flashes. These flashes create hindrances for tool movement as well as increase the forces. The maximum (3.25 kN) and minimum force (2.36 kN) are obtained in the z-direction, and 0.97 and 0.27 kN are observed in the x-direction at a tilt angle of 2° and 1.3°, respectively.
Conclusion
This study helps in a better understanding of mutual influence between temperature and force distribution during FSW of AA7039. During FSW, it involves significant variations in temperature and forces. These variations depend on the input process variables. The following conclusions are drawn:
It is witnessed that frictional temperature significantly rises with an increase in rotational speed and tilt angle and adversely with welding speed. The temperature is found to increase from 295 °C to 390 °C, with an increase in rotational speed from 1812 to 1325 r/min. It owes to an increase in frictional heat at a higher rotational speed. Conversely, the effect is observed for welding speed. It is attributed to the increase in heat input with an increase in PT at minimum welding speed. The maximum temperature of 380 °C is obtained at 26 mm/min of welding speed. It is also observed that the temperature is increased with an increase in tilt angle from 1.3° to 2°. It owes to increase in plunge forces. It results in a higher value of temperature (i.e. 360 °C) at 2° tilt angle and minimum temperature (i.e. 300 °C) at 1.3° tile angle on AS.
It is experienced that both the forces reduce with an increase in rotational speed. It is owing to higher heat input at the high value of rotational speed that softens the materials on faying surfaces. This softening reduces the forces in both directions. The maximum forces in vertical (Fz) and transverse directions (Fx) are obtained as 2.59 and 0.68 kN at the minimum rotational speed of 1325 r/min. Alternatively, it is also observed that higher welding speed results in a higher value of forces. It is attributed to lower heat input at higher welding speed, resulting in higher flow stress. The maximum forces obtained in the vertical and transverse directions are 2.5 and 0.57 kN for welding speed of 43 mm/min. In the case of tilt angle, the forces enhance with an increase in tilt angle from 1.3° to 2°. It occurs due to an increase in shoulder depth into the faying surfaces, and flashes produced during the process create hindrance for tool movement. The maximum vertical force of 3.25 kN and transverse force of 0.97 kN are recorded during FSW at a tilt angle of 2°.
Besides this, forces in the z-direction are higher in magnitude as compared to the x-direction. It is for the developed negative component of forces in the x-direction that reduces the magnitude of forces in the x-direction.
Footnotes
Declaration of conflicting interests
The author(s) declared no potential conflicts of interest with respect to the research, authorship, and/or publication of this article.
Funding
The author(s) disclosed receipt of the following financial support for the research, authorship, and/or publication of this article: This work was supported by University Grant Commission, India (F./2015-16/NFO-2015-17-OBC-HAR-27175/(SA-III/Website)).