
Abstract
Using reasonable cutting parameters of machining process is an effective and convenient means of improving the topography of the machined surfaces. In this study, the methods to find optimised cutting parameters can be obtained by studying the relationship between the cutting parameters and the micro-topography of frequency features in the machined KH2PO4 surfaces. Using the power spectral density and continuous wavelet transform methods, the 2D micro-topographies of frequencies corresponding to different cutting parameters are extracted from the machined KH2PO4 surfaces. The results for the extracted micro-topography are used to analyse the influence of cutting parameters on the spatial frequency feature which consists of the wavelength and amplitude. The middle-frequency feature reflects the variations of depth of cut and spindle speed, and the amplitude of it is directly proportional to depth of cut and spindle speed. The low-frequency feature reflects the variations of the feed rate and decreases to a smaller value when the feed rate increases. The high-frequency feature is mainly affected by the material properties and the vibrations that occur during processing. Comparing the micro-topography of frequencies under different cutting parameters, the depth of cut (3 μm), the spindle speed (400 r/min) and the feed rate (8 μm/r) are the optimised cutting parameters for the machine tools used in this article. In the process of reconstructing the arbitrary frequency topography, the continuous wavelet transform method can compensate for the deficiencies of the power spectral density method for extracting frequencies.
Keywords
Introduction
In machining operations, the processing parameters that are selected to process KH2PO4 (KDP) crystal directly affect the surface quality and component performance. The surface topography of machined KDP crystal needs high precision to improve its optical performance and avoids the sensitive frequency that can seriously impact the optical performance. 1 Requirements for the reliability of optical components are extremely stringent for process system of inertial constraint fusion. 2 A series of negative factors, such as high brittleness and strong anisotropy of crystals, can affect optical surface accuracy of KDP crystal.3–5 Compared to magnetorheological finishing and abrasive cutting, single-point diamond turning (SPDT) is an efficient process that maintains surface consistency.6–9 The processing parameters of SPDT, such as cutting parameters, spindle vibrations, tool shape and cutting force fluctuations, could affect the machined surface quality and component performance. The effect of cutting parameters on the surface topography is mainly reflected in the frequency features. 10 In this article, the relationship between the cutting parameters and the actual frequency features can be obtained. The actual frequencies are analysed to find the relation between the cutting parameters and the machined surface topography.
Machined surface topography has the influences on the performances of components, and the cutting parameters are the main determining factors for surface topography. Many studies have been performed to determine the effect of cutting parameters on the surface quality and topography during processing. In the processing of KDP crystal, the cutting parameters were optimised to forecast and improve the surface quality and topography through the analyses of cutting simulation or experiment.11–14 Modelling and simulating of cutting process were also used to analyse and evaluate the machined surface topography of other materials.15,16 Cao et al. 17 proposed a more reasonable selection method of cutting parameters based on surface roughness of workpiece. Fu et al. 18 demonstrated that the heat deformation of ultra-precision fly cutting tools has slightly influence on the roughness and waviness of KDP crystal surfaces and increases their surface slope through the simulation of cutting surface. Zhou and Cheng 19 used power spectral density (PSD) to analyse the influence of the process factors, including cutting parameters, tool wear, environmental vibration, etc., on surface topography and texture formation. Zhao et al. 20 discussed the variation regularities of cutting forces and roughness on different KDP crystal planes. Tian et al. 21 found that the vibration of the diamond tools used in the SPDT process has a considerable effect on the surface topography, and a theoretical model was developed to describe the effect of vibrations on the machined surface quality.
Researchers understand that the surface topography may be determined by the disordered superposition of frequency features. Wang et al. 22 used the wavelet analysis method to reconstruct the surface profile in the direction of tool feed, and the predicted surface roughness is close to the actual surfaces. Danesh and Khalili 23 decomposed the textural features from the surface image of the workpiece by undecimated wavelet transform to analysing tool wear in the turning process. Gadelmawla et al.24,25 calculated the surface roughness and the machining time through analysing the texture features of machined parts images. Lu et al. 26 proposed a frequency analysis method for machined KDP surface and identified the middle spatial frequencies of the cutting and feeding processes. Liu et al. 27 proposed a comprehensive model incorporating the principles of multi-scale surface analysis, mechanics, and optics to investigate the mechanical performances of KDP crystal.
In this study, the KDP surfaces machined by SPDT are analysed by PSD and continuous wavelet transform (CWT) methods. Distinguished with other researches, the actual frequency features which are not the ideal sine or cosine waveform are extracted and reconstructed by CWT method in this article. The influence of the cutting parameters on the micro-topography consisting of the frequency features is investigated.
Methods and experiments
PSD method
PSD method is usually used to analyse the spatial frequency information of an input signal. The PSD contains information on the vertical height of a machined surface as well as important information on the horizontal spatial frequency distribution. 28 It is an effective method to evaluate the surface topography. The frequency distribution for surface topography is obtained by the 1D PSD, which can be defined as
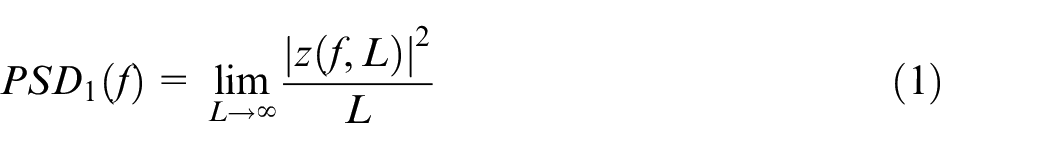
where L is the sampling length, f is the spatial frequency, and z (f, L) is the Fourier transform of the surface topography. The formula for z (f, L) is given as
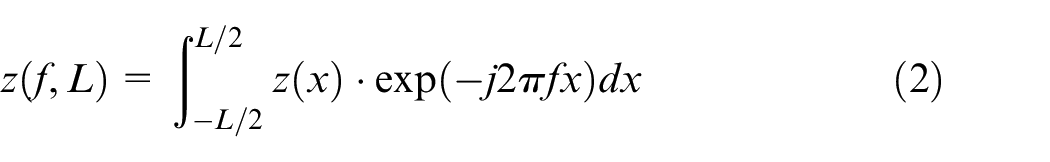
where z(x) is the height of surface topography.
Continuous wavelet method
In the spatial domain, the wavelet transform is defined in terms of a series of functions for constructing the original signal f(x), which are called the wavelet basis functions ψ(x). ψa, b(x) is the set of wavelet basis functions ψ(x) with a scale factor a and a position factor b. The CWT is a multi-scale transformation and can be used to analyse the frequency feature in the machined surface. 29 The CWT can be defined as
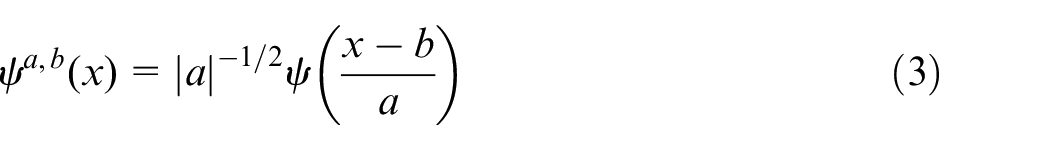
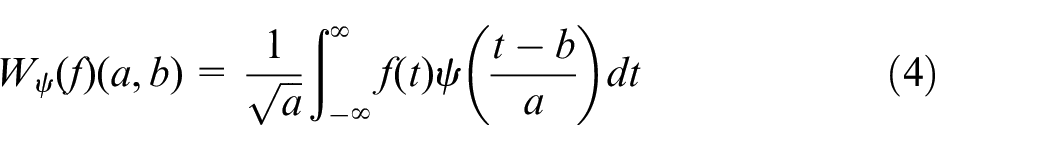
where Wψ is a continuous wavelet coefficient that is determined by ψ(x) (which is taken as the Mexican wavelet basis in this article), with the scale factor a and the position factor b (where b is 0 in the article).
The scale factor a is expressed in terms of the frequency information of the surface topography and the wavelet basis transformation. The relationship between the frequency feature and the scale factor a is given below
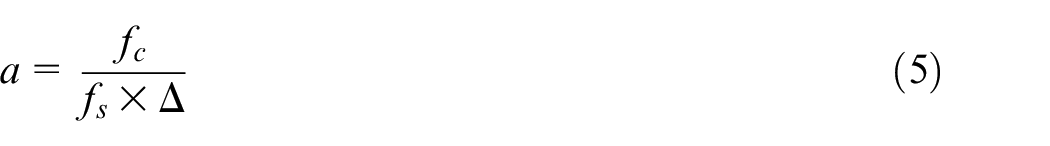
Thus the scale factor a is expressed in terms of the correspondence between fs and fc, where fc is the centre frequency of the Mexican wavelet basis (fc = 0.25), Δ is the sampling period measured using a white light interferometer, and fs is the centre frequency of the actual waviness that is extracted from the machined surface. The equation for fs is
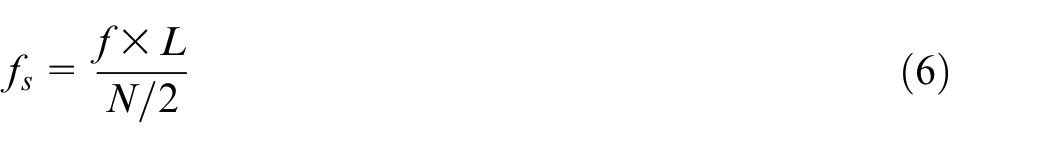
where f is the frequency of the actual waviness of the machined surfaces, L is the sampling length, and N is the number of sampling points over the sampling length.
The continuous wavelet coefficient Wψ in equation (4) expresses the degree to which the original signal is similar to the wavelet basis. This coefficient is not significantly related to the frequency features of the surface topography and has to be reconstructed using an inverse relationship as follows
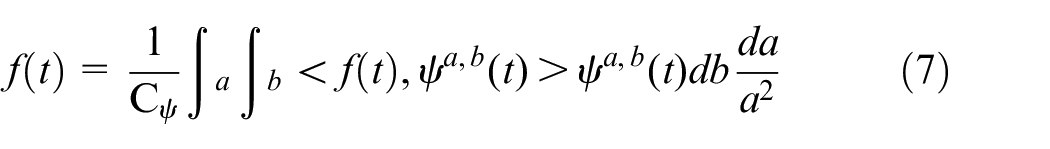
where f(t) is the actual frequency features that is obtained by reconstructing the wavelet coefficient. Combination with PSD and CWT, the flow chart of reconstructing actual frequency is shown in Figure 1.
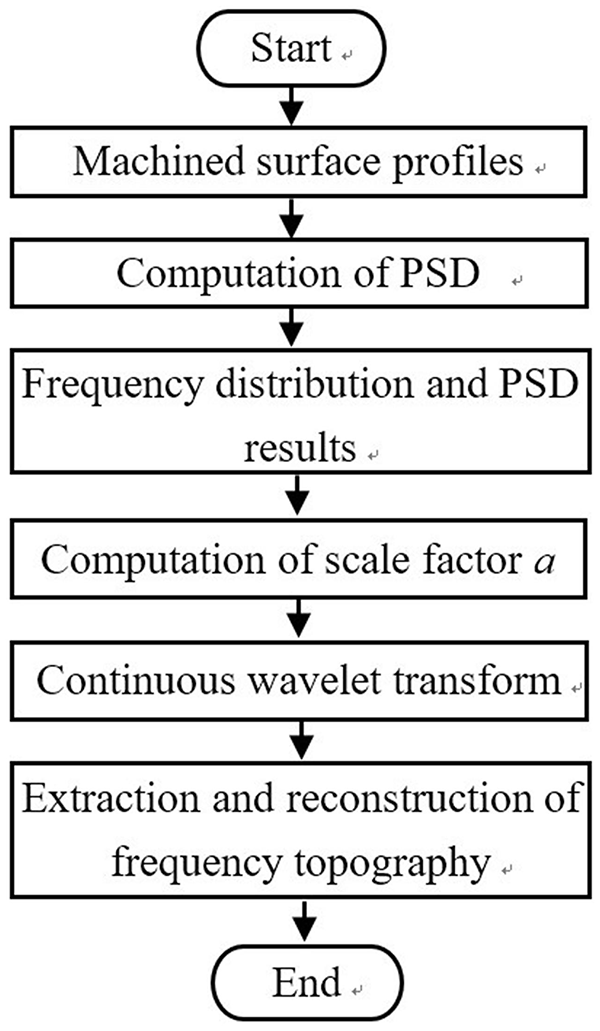
Flow chart of reconstructing actual frequency.
Experiments
In this article, the (001) surface of KDP crystal is machined by SPDT method, and the machine tool is shown in Figure 2(a). The machined KDP crystal is measured by Talysurf CCI white light interferometer which is shown in Figure 2(b). The selected tool parameters in the cutting experiments are shown in Table 1, and the turning method is facing cut. The cutting parameters, which are shown in Table 2, are the common parameters based on the SPDT machine tool which is single purpose to manufacture the KDP crystal.
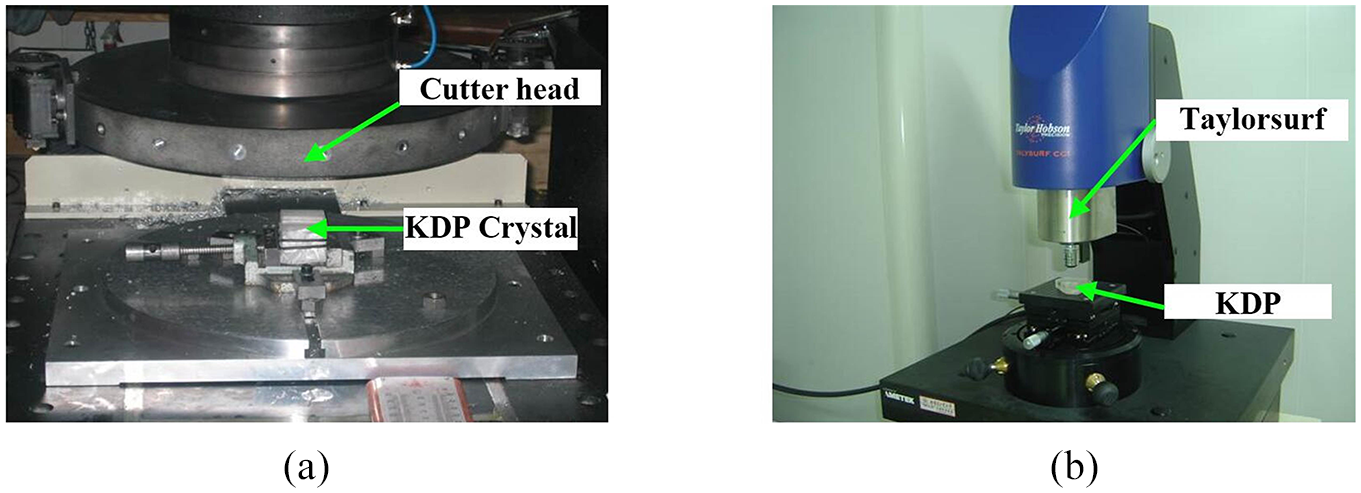
The KDP single crystal turning experiments and the measurements. (a) The turning experiments of the KDP crystal. (b) The KDP measured by a Talysurf CCI.
Diamond turning tool parameters.
Cutting parameters and Rq of contour.
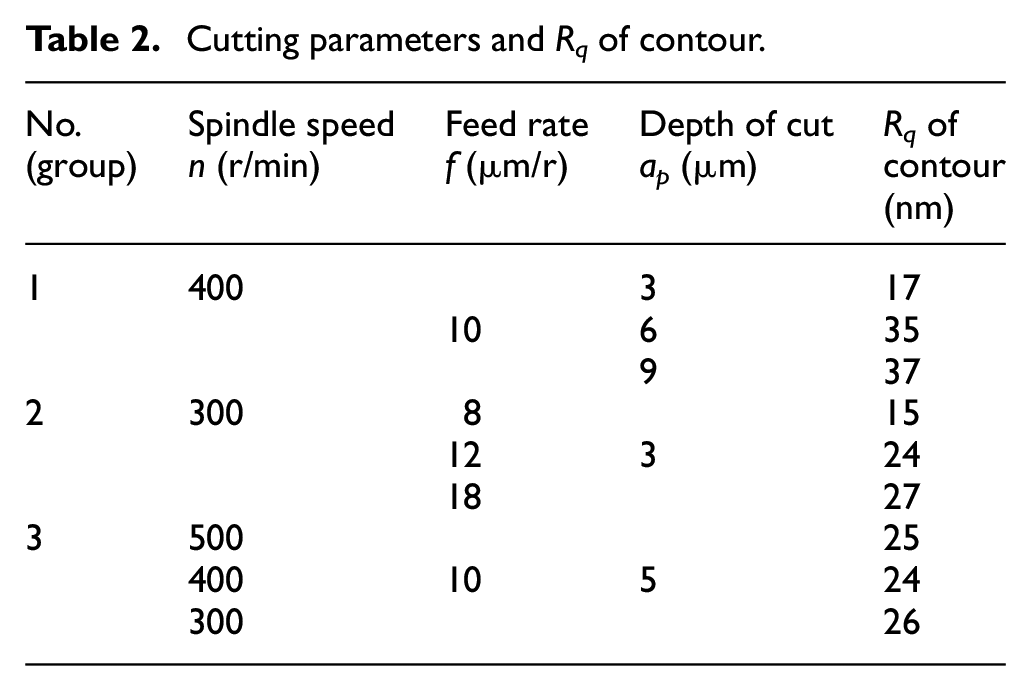
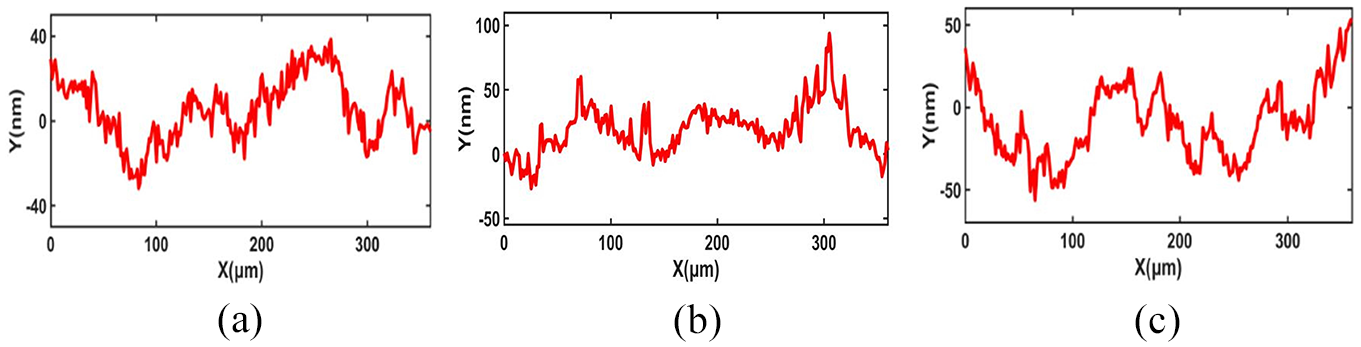
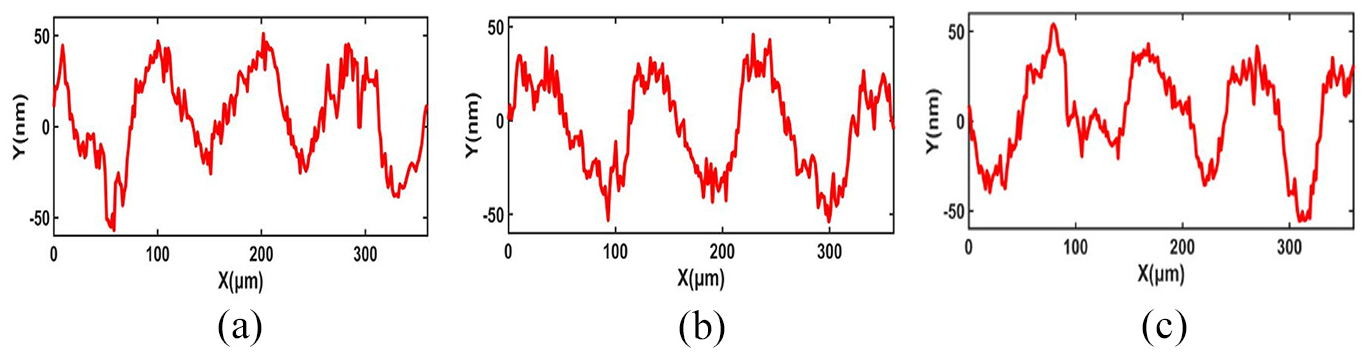
In the measuring of machined KDP crystal, the sampling length is 360 μm. The number of sampling points is 256 × 256. The minimum sampling period is 1.412 μm/pixel (360 μm/255 pixels). The vertical heights for the surface profiles under the different cutting parameters are measured using the interferometer, as shown in Figures 3–5, and the root mean square (Rq) of contours is calculated, as shown in Table 2.
Machined surface profiles at depths of cut measured by a white light interferometer. (a) ap = 3 μm. (b) ap = 6 μm. (c) ap = 9 μm.
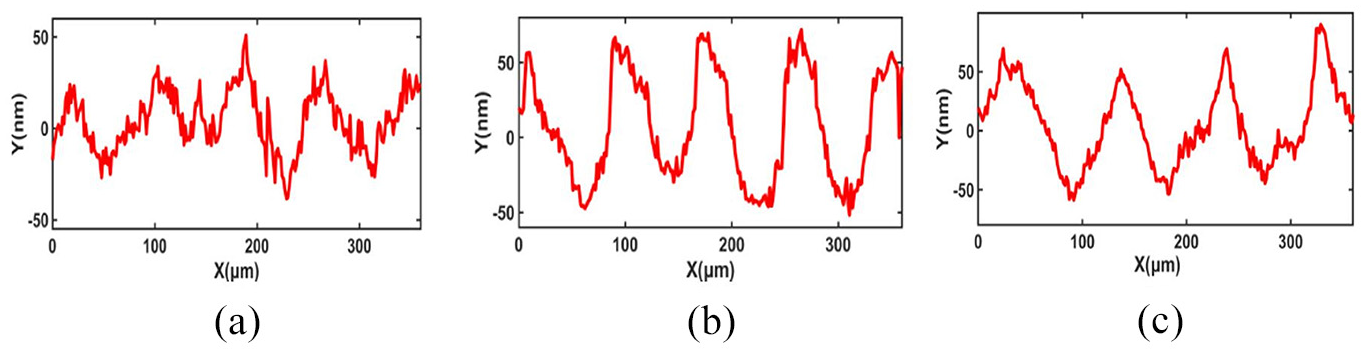
Machined surface profiles at feed rates measured by a white light interferometer. (a) f = 8 μm/r. (b) f = 12 μm/r. (c) f = 18 μm/r.
Machined surface profiles at spindle speeds measured by a white light interferometer. (a) n = 500 r/min. (b) n = 400 r/min. (c) n = 300 r/min.
Analysis
PSD analysis
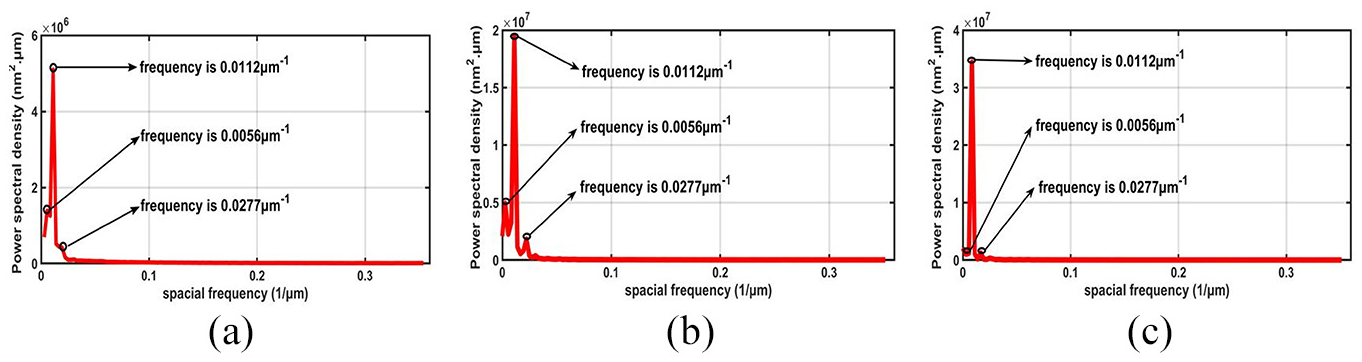
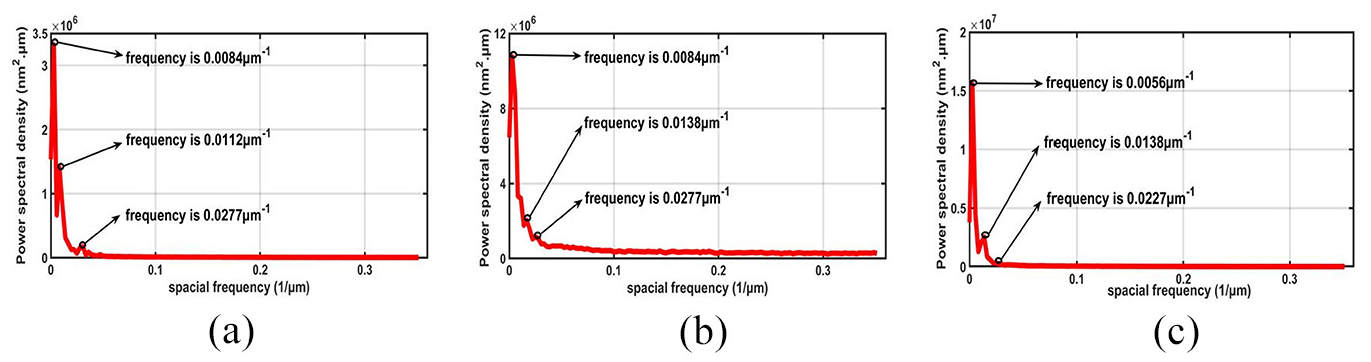
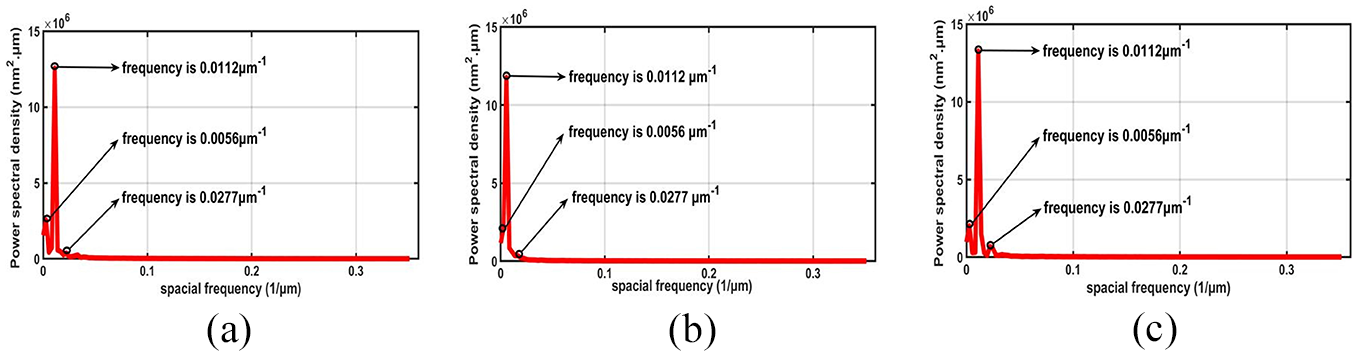
According to the measurement parameters of the white light interferometer, the ranges of sampling period and frequency are 2.824–360 μm and 0.0028–0.354 μm−1 respectively, and the minimum frequency interval is 0.0028 μm−1. PSD can only reflect the frequency features which are the integral multiple of the minimum sampling period. In this article, the minimum sampling period of the white light interferometer is 1.412 μm/pixel, therefore the results of PSD can only reflect the frequency features whose wavelength are the integral multiple of 1.412 μm. Using CWT to restructure the frequency features, the extracted frequency can reflect accurately the information of actual frequency according to the original profiles and the results of PSD analysis. The frequency value obtained by CWT is not the integral multiple of sampling frequency but the approximation of it. The PSD of the machined surface profile can be calculated using equations (1) and (2), as shown in Figures 6–8.
PSD results at depths of cut. (a) ap = 3 μm. (b) ap = 6 μm. (c) ap = 9 μm.
PSD results at feed rates. (a) f = 8 μm/r. (b) f = 12 μm/r. (c) f = 18 μm/r.
PSD results at spindle speeds. (a) n = 500 r/min. (b) n = 400 r/min. (c) n = 300 r/min.
Figure 6 shows the PSD results for a spindle speed n = 400 r/min, a feed rate f = 10 μm/r, and depths of cut ap = 3, 6, and 9 μm. The results of PSD have a maximum peak at the frequency of 0.0112 μm−1, which corresponds to the main frequency that determines the surface profile. When the depth of cut is gradually increased (as shown in Figure 6(a)–(c)), the PSD at 0.0112 μm−1 also increases. The frequencies of 0.0056 and 0.0277 μm−1 have low PSD and are considered to be secondary frequencies for the machined surface.
Figure 7 shows the PSD results at a spindle speed n = 300 r/min, a depth of cut ap = 3 μm, and feed rate f = 8, 12, and 18 μm/r, where the frequency can be considered to change with the increasing in feed rate. The main frequency is 0.0084 μm−1 at feed rates f = 8 and 12 μm/r, and 0.0056 μm−1 at a feed rate f = 18 μm/r. These results show that the wavelength of main frequency increased with the increasing in the feed rate. Figure 7(a) and (b) show that the middle frequency (0.0112 and 0.0138 μm−1) has a tendency to decrease with the decreasing in feed rate. From the PSD results, the low-frequency feature will become the main frequency with the increasing in the feed rate.
The PSD results at the depth of cut ap = 5 μm, feed rate f = 10 μm/r, and spindle speeds n = 500, 400, and 300 r/min are shown in Figure 8. The frequency 0.0112 μm−1 is the main frequency affecting the surface profile. The same frequency distributions presented in Figure 8(a)–(c) show that the spindle speed does not change the value of the frequency and only affect the results of PSD, such that three surface profiles with the same frequency can be reconstructed to be similar waveforms.
Frequency features extraction and reconstruction
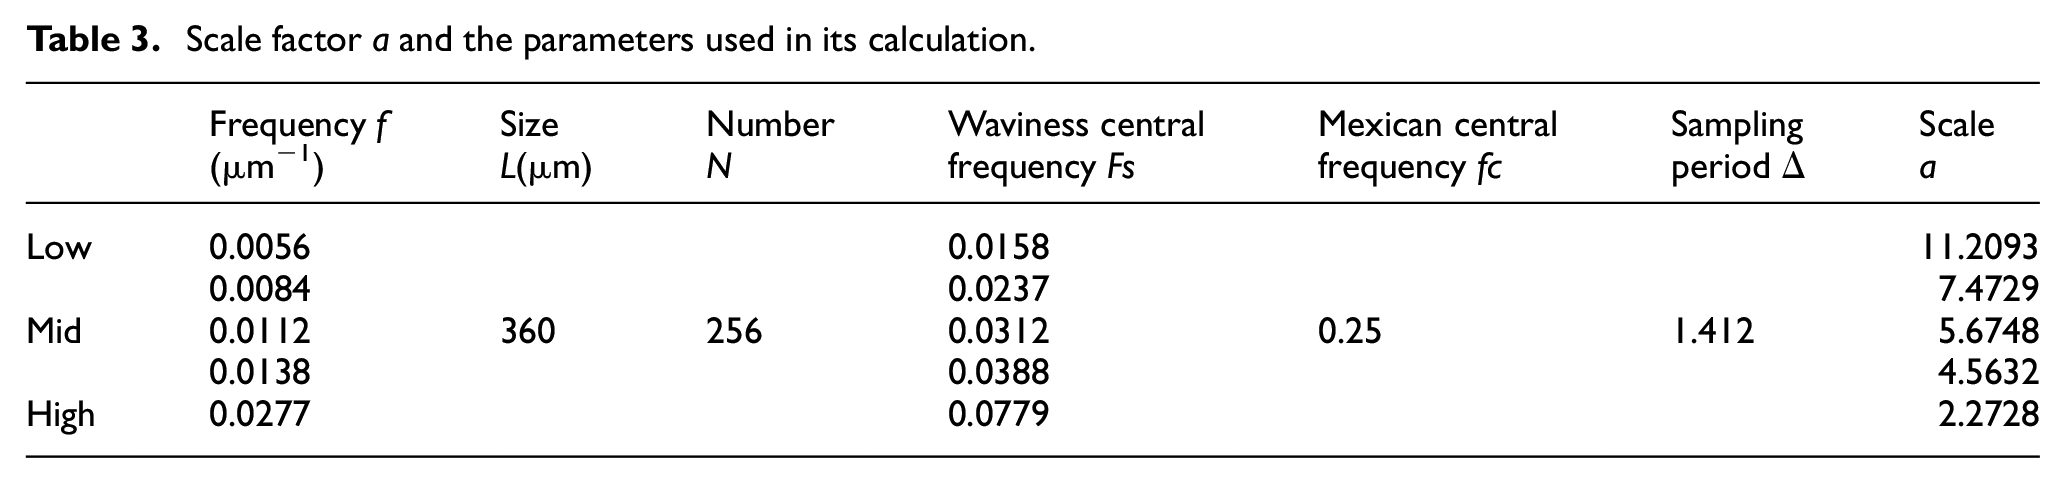
Surface topography can be regarded as a disordered superposition of multi-scale waves. According to the original profile and the results of PSD analysis, the actual frequency features are extracted and reconstructed by CWT. The frequencies of 0.0056, 0.0112, and 0.0277 μm−1 are extracted to analyse the influence of the depth of cut and spindle speed on the frequency features. The frequency values under varying feed rates are chosen to be 0.0056, 0.0084, 0.0112, 0.0138, and 0.0277 μm−1 to reconstruct the actual frequency features. Table 3 shows the wavelet parameters and the values of the scale factor a that are calculated using equations (5) and (6).
Scale factor a and the parameters used in its calculation.
The result of the wavelet transform is the wavelet coefficient, but the wavelet coefficients that are obtained using equations (3) and (4) are irrelevant to the surface profile. To obtain the actual frequency features, the wavelet coefficients need to be reconstructed inversely using equation (7). Cutting parameters are the main factors to affect the changes of the surface topography, which also affect the variation of the frequency feature. It is necessary to study the influence of cutting parameters on frequency features extracted from the surface topography.
Influence of cutting parameters on frequency features
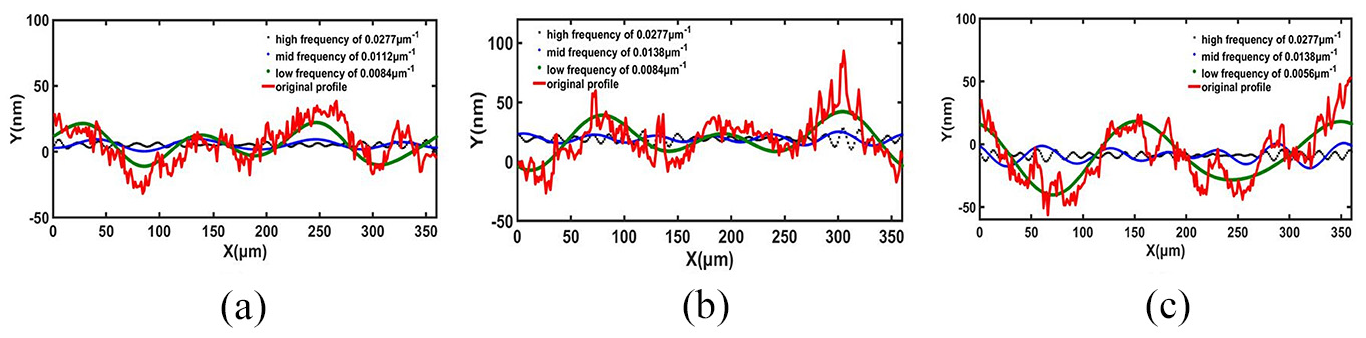
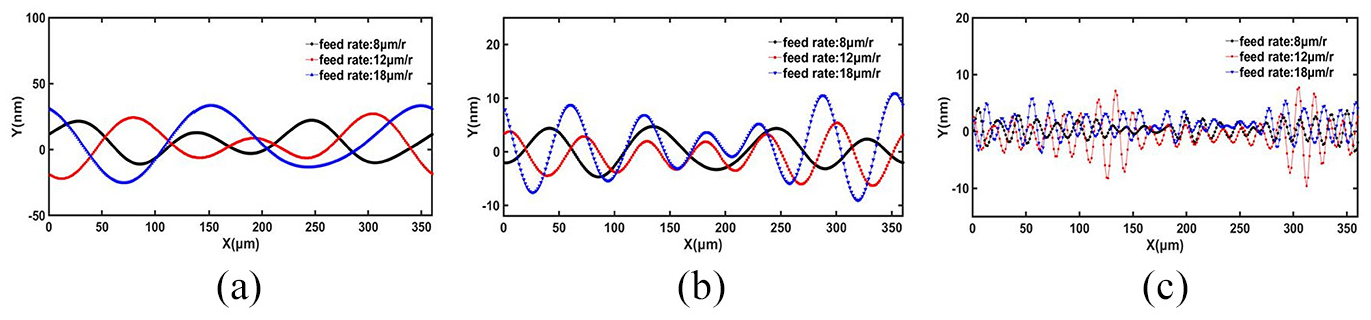
The influence of the cutting parameters on the surface profile is mainly reflected in the actual frequency features, which are consisted of the wavelength and amplitude. The surface profiles and actual frequency features are shown in Figure 9 for changing the depths of cut during processing. The waveform at 0.0112 μm−1 is closest to the original profile, and the frequencies of 0.0056 and 0.0277 μm−1 have little effect upon the original profiles, which is consistent with the results of PSD analysis. The original profiles presented in Figure 9(a)–(c) show the changes in the period and amplitude of the original profiles with the variable depths of cut. Increasing the depth of cut enlarges the period and the amplitude. This result is consistent with the waveform at the middle frequency of 0.0112 μm−1. The depth of cut has little effect on the high- and low-frequency features and produces insignificant changes in the amplitude and wavelength. Comparing the low- and middle-frequency features are shown in Figure 10(a) and (b); the depth of cut (3 μm) has the smallest amplitude and the smoothest profile, which is considered as the optimal cutting parameters in this article. The high-frequency features that are shown in Figure 10(c) provide some details about the surface topography at different depths of cut.
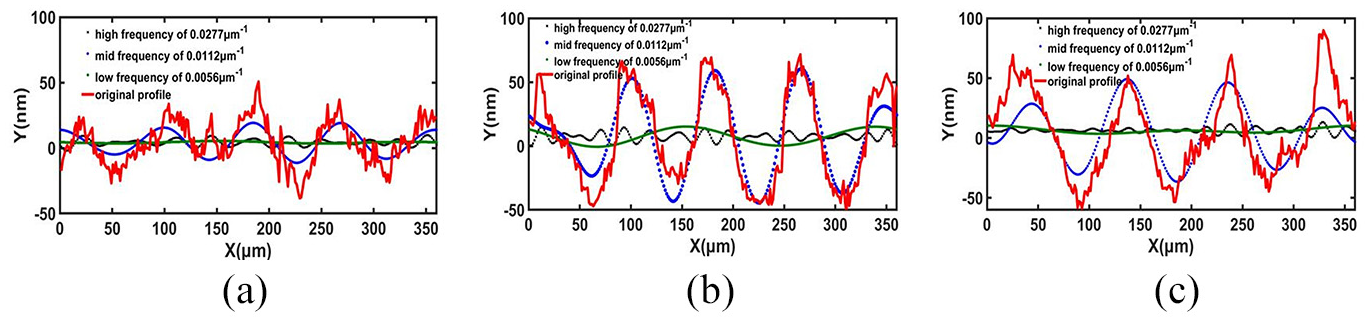
Comparison of original profiles and actual frequency features at depths of cut. (a) ap = 3 μm. (b) ap = 6 μm. (c) ap = 9 μm.
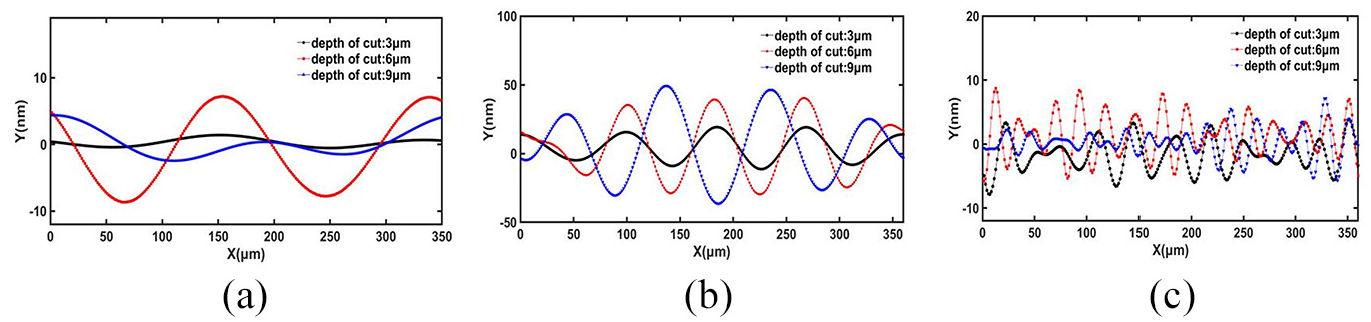
Comparison of actual frequency features for different depths of cut. (a) Low-frequency features. (b) Middle-frequency features. (c) High-frequency features.
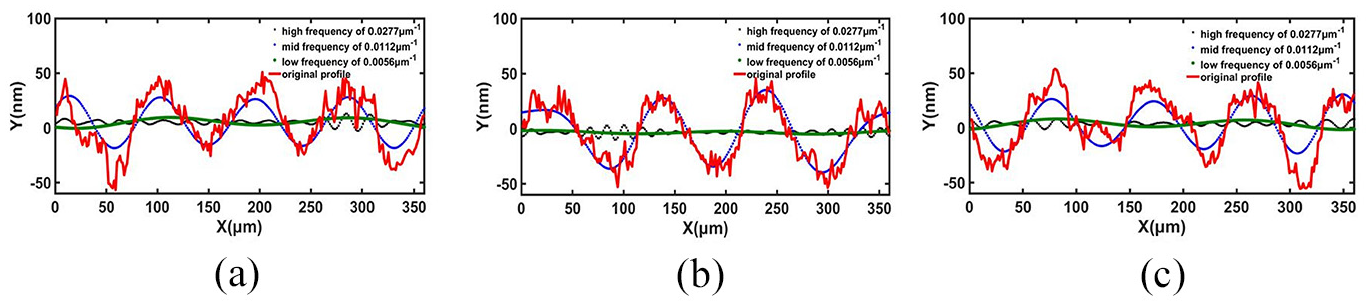
Figure 11 shows the original profiles and actual frequency features when the feed rate is changed during processing. The features at 0.0084 and 0.0056 μm−1 are regarded as the main frequencies that are closest to the original profiles. Compared with the low-frequency features from Figure 11(b) and (c), the value of the main frequency decreases when the feed rate increases. The frequency of the machined surface is affected by changing the feed rate during the processing and tends to a smaller frequency value with larger amplitude when the feed rate increases. Figure 12(a) and (b) shows that the smoothest frequency feature occurs at 8 μm/r with the smallest amplitude and can be considered to be the optimal cutting parameter when only the feed rate is changed. Figure 12(c) shows some high-frequency waves in the surface profile and its features that appear to be unsystematic. It may be related to the vibration in the process and the material properties.
Comparison of original profiles and actual frequency features at feed rates. (a) f = 8 μm/r. (b) f = 12 μm/r. (c) f = 18 μm/r.
Comparison of actual frequency features for different feed rates. (a) Low-frequency features. (b) Middle-frequency features. (c) High-frequency features.
Comparing with the original profiles and frequency features at varying spindle speeds are shown in Figure 13. In changing of the spindle speed, the frequency of 0.0112 μm−1 is the main frequency and consistent with the original profile. The high-frequency feature of 0.0277 μm−1 reflects detailed changes in surface profile, which are related to vibrations during processing and material properties. Changing the spindle speed has no obvious effect on the low-frequency feature. The actual frequency features for changing spindle speeds are shown in Figure 14. It presents that varying the spindle speed has little effect on the wavelength of the main frequency as shown in Figure 14(b), but the amplitude is slightly changed. The frequency feature at 400 r/min, as shown in Figure 14(a) and (b), is relatively flat, which is the optimal spindle speeds in the article. Figure 14(c) shows the surface high-frequency details of the material properties and vibration at spindle speeds, which have no relation with cutting parameters.
Comparison of original profiles and actual frequency features at spindle speeds. (a) n = 500 r/min. (b) n = 400 r/min. (c) n = 300 r/min.
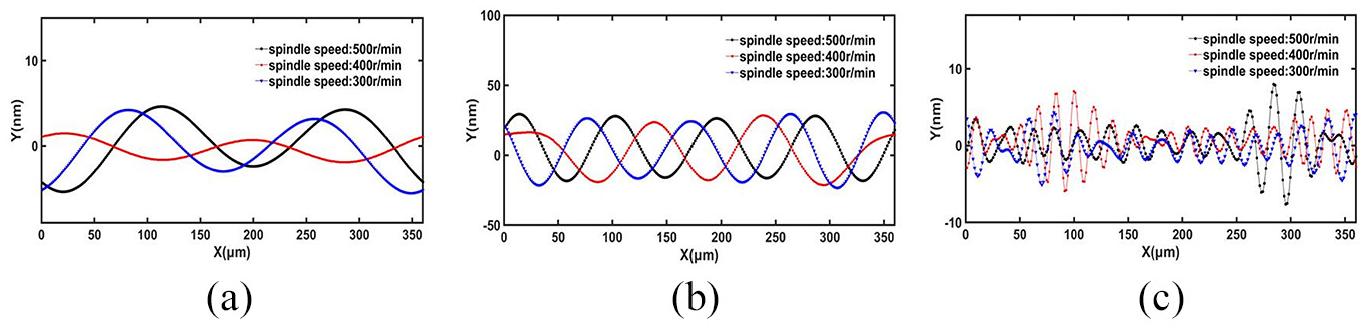
Comparison of actual frequency features for different spindle speeds. (a) Low-frequency features. (b) Mid-frequency features. (c) High-frequency features.
In this article, the PSD and the CWT methods are used to extract and reconstruct the actual frequency features for the machined KDP surface, and the influence of the cutting parameters on the actual frequency features is analysed. The depth of cut and the spindle speed have clear effects on the surface profile. Increasing the depth of cut and the spindle speed enlarge the wavelength and the amplitude of the middle-frequency feature. The feed rate is reflected in a change in the low-frequency value of the surface topography. Increasing the feed rate results in small frequency values and corresponds to a larger wavelength and amplitude. The high-frequency features are affected by the vibrations during processing and the material properties because the high frequencies which are extracted from the different machined KDP surfaces have the identical wavelength. The future work is to study the influences of frequency features on the optical performance of KDP components and find the appropriate cutting parameters to reduce or avoid the frequency which could impact the optical performances.
Conclusion
The results of the analysis lead to the following conclusions:
The effects of the cutting parameters on the micro-topography of frequency features in the machined KDP surfaces can be obtained. The middle-frequency feature provides information about the depth of cut and the spindle speed. The low-frequency feature provides the information on the feed rate. Comparing with the different frequency features, the depth of cut (3 μm), feed rate (8 μm/r), and spindle speed (400 r/min) are the optimal cutting parameters of machine tool used in this article.
The PSD method can only be used to identify the frequency which is the integral multiple of the minimum sampling interval, whereas the spatial frequency is continuously distributed in the machined surface. The continuous wavelet method can be used to compensate for this deficiency of the PSD and extract more realistic and reliable frequency features from the machined surface.
With the actual frequency extracted from the machined KDP surfaces, the influence of surface topography on the optical performance of components can be calculated and analysed more accurately. Changing the cutting parameters can affect the micro-topography of the frequency features in the machined surface. Therefore, adjusting the cutting parameters to reduce or avoid the frequency which could seriously impact the optical performances is significant to improve the machining process of KDP crystal.
Footnotes
Appendix 1
Declaration of conflicting interests
The author(s) declared no potential conflicts of interest with respect to the research, authorship, and/or publication of this article.
Funding
The author(s) disclosed receipt of the following financial support for the research, authorship, and/or publication of this article: The research reported in this article was supported by the Project of Jiangsu Science and New Agricultural Engineering (NJ2014-11), and the Project of Jiangsu Science and Technology Support Plan (BE201283).