
Abstract
This article presents an extraction and reconstruction method for arbitrary two-dimensional and three-dimensional frequency features in precision machined surfaces. A combination of power spectrum density and continuous wavelet transform is used to analyze the potassium dihydrogen phosphate crystal surface topography. All frequencies involved in sampling area of measuring instrument are distinguished by power spectrum density method. Compared to discrete wavelet transform used to decompose frequency features, continuous wavelet transform method can extract and reconstruct two-dimensional profile and three-dimensional topography of arbitrary frequency features from original precision machined surfaces. Analysis results show that amplitude and distribution of different frequency features in two-dimensional profile or three-dimensional surface topography are fully restored by continuous wavelet transform. The effects of different factors in machining process on precision machined surface topography may be discovered. Furthermore, the extraction and reconstruction method is generally applicable for the analysis of all precision machined surfaces.
Keywords
Introduction
It is considered that the precision machined surface is formed by overlapping the motions of cutting tools on the material surfaces. Various factors in machining process, such as cutting parameters, tool angles, and vibrations, can affect the three-dimensional (3D) topography of machined surfaces. Thus, it can determine the performances of components including friction, fatigue, and lubrication. Generally, frequency features with specific wavelength may severely affect the performance of optic components. For example, micro-waviness in machined potassium dihydrogen phosphate (KDP) surface will induce the periodic disturbance of transmission wavefront and dispersion of KDP components. 1 To obtain the impact of actual frequency features on component performance, their topography should be entirely extracted or exhibited from precision machined surfaces.
The effects of factors in machining process on surface topography and performance have already been studied by many researchers. Okokpujie and Okonkwo 2 analyzed the effects of cutting parameters on surface roughness under the condition of minimum quantity lubrication and compared the effects of different milling environments on surface roughness. 3 Gupta et al. 4 analyzed the effect of cutting fluid on surface finish and optimized parameters of machining process through two evolutionary techniques. Sharma et al.5–7 found that the performance of Al2O3 nano-fluid in terms of surface roughness, tool wear, cutting force, and chip topography is better than other cutting fluid in different machining environments by experimental studies.
Wavelet and power spectrum density (PSD) methods have been widely used to analyze and evaluate frequency information of machined surfaces and machining process in recent years. With PSD method, all frequencies in the sampling area or period could be presented from machined surfaces or processing. Chen et al. 8 analyzed the spatial frequency spectrum in different direction of machined surfaces to obtain dynamic error in turning process with PSD method. Yu et al. 9 used PSD to carry out spectral analysis of single-point diamond machined surfaces and analyzed surface roughness with the PSD results. Wang et al. 10 analyzed high-frequency characteristics of tool-tip vibration and its influence on surface topography in single-point diamond turning with PSD method. Zhang et al. 11 calculated PSD of machined surface topography to analyze the relation between it and aerostatic bearing spindle vibration in turning process. Vepsäläinen et al.12,13 analyzed multiscale structure of textured surfaces with one-dimensional (1D) PSD method. Zhou and Cheng 14 used PSD to analyze the influence of the cutting process factors on surface topography. Wavelet method could quickly calculate the localization of frequency in both frequency and space domains. With the multi-scale decomposition method, discrete wavelet transform (DWT) could analyze the decomposition of machined surfaces and obtain the topographies of frequencies with different scale level from any measured surfaces. Many researchers employed filter characteristics of DWT method to estimate the surface roughness and obtained waviness topography in different decomposition level from variously machined surfaces.15–18 Wang et al. 19 decomposed and reconstructed the two-dimensional (2D) frequency profiles in the cutting direction with multi-level decomposition of 1D DWT. Wavelet method was also suitable to analyze various time series signal in machining process. Huang et al., 20 Zhu et al., 21 and Cao et al.22,23 analyzed chatter identification or vibration of cutting force in machining process with 1D DWT used to denoise the measured signals.
By now, the researchers still use DWT method to decompose frequency features from original surfaces, but inherent algorithm of DWT determines that it cannot reflect and extract arbitrary frequencies involved in originally machined surfaces. To fully analyze the impact of machining process on surface topography and performance of component, the topography of arbitrary frequency should be entirely extracted from originally machined surfaces. With the extraction and reconstruction methods presented in this article, the relationship between arbitrary frequency topography and machining process can be revealed, and the connection between machining process and performance of components can also be achieved. The meaning of the extraction and reconstruction of arbitrary frequency topography is to study the effects of various factors in machining process on 3D precision machined surface topography and provide the solution of optimizing machining process and enhancing component performance.
Methods
PSD method
PSD method is usually applied to analyze the frequency contents of 2D profile and 3D surface, and it can also analyze the spectral contents of an input signal.24–26 PSD can define how power quantity of machined 2D profiles and 3D surfaces is distributed by frequency (1 per spatial period). The PSD of surface topography is calculated from the originally measured profile or surface data. 1D PSD can be defined by
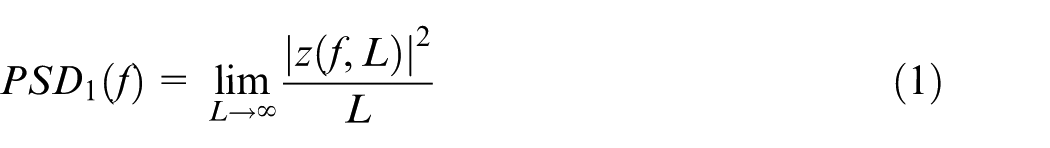
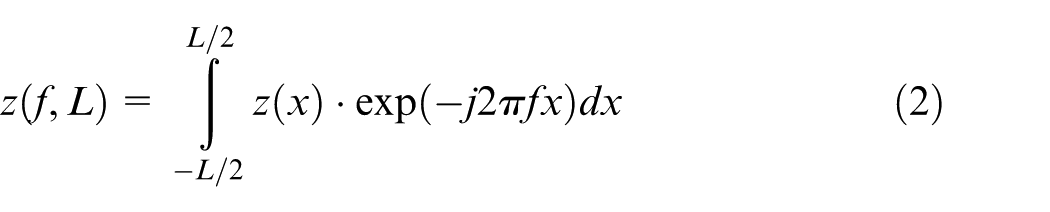
where L is the sampling length, f is the spatial frequency, and z(f, L) is the Fourier transform of 2D surface profile. The formula of z(f, L) is shown as
From equation (1), 2D PSD of 3D machined surfaces can be obtained by calculating 1D PSD in orthogonal X and Y directions, respectively, and shown as
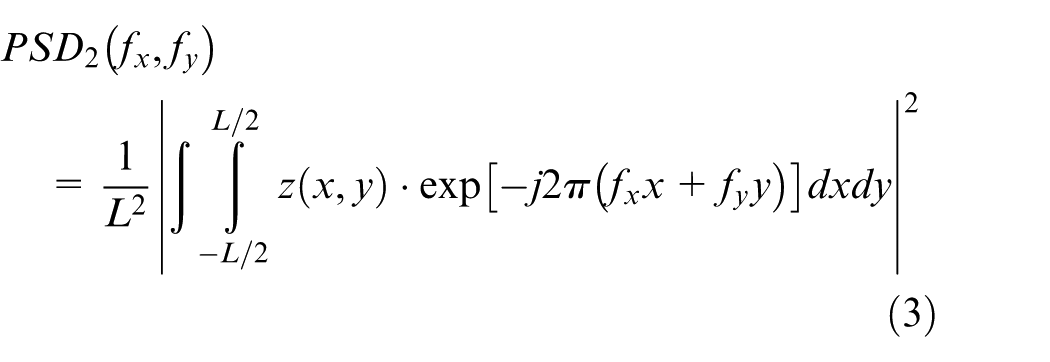
Through 2D PSD method, all 3D frequencies involved in the sampling area could be obtained, and distribution of spatial frequency in machined surface could also be presented.
Wavelet method
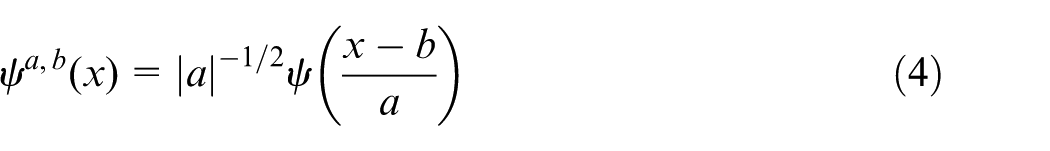
Wavelet method involves using a series of functions to analyze original signals in the scaling and space fields.27,28 Wavelet method is defined by function ψ(x), sometimes called as “wavelet basis.” From wavelet basis, the derived wavelet function ψa,b(x) is formed by the scale parameter a and position parameter b. Wavelet transform (WT) is divided into continuous wavelet transform (CWT) and DWT. 1D CWT can be described as 29
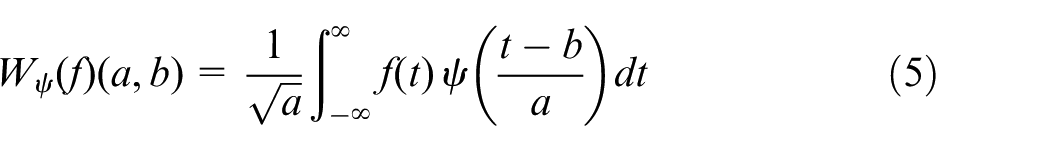
CWT uses inner products to measure the similarity between a signal and a wavelet basis function. The result of CWT is wavelet coefficients Wψ depending on the position parameter b, scale parameter a, and wavelet basis function ψ(x). 1D DWT can be expressed as

DWT handles an original signal C0 by applying wavelet basis function to divide it into two parts which are the high-frequency
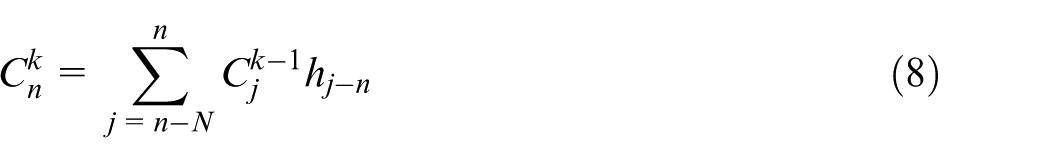
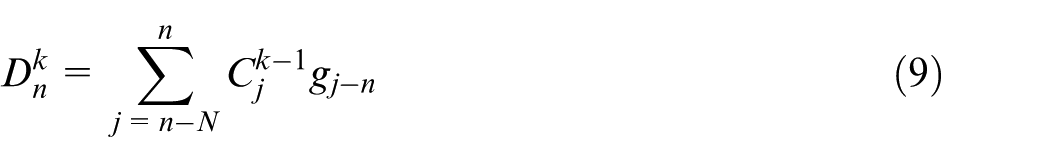
where N is the sampling number, h is the low-pass filter, and g is the high-pass filter. h and g in equations (8) and (9) can be defined as
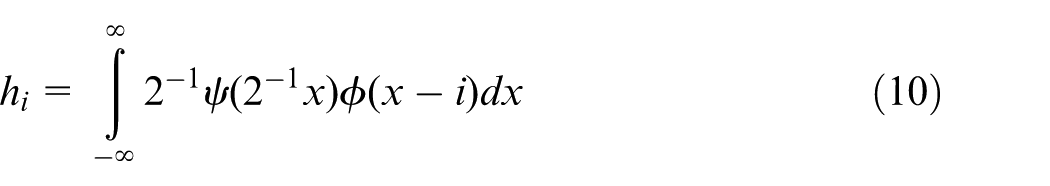
where ϕ is the scaling function of wavelet basis. From the definition of CWT and DWT, the difference between CWT and DWT is in how they discretize the scale parameter. In DWT method, the scale parameter is always discretized to integer powers of 2. The scale of DWT is correlated with the level of decomposition, and the relation between them is shown as

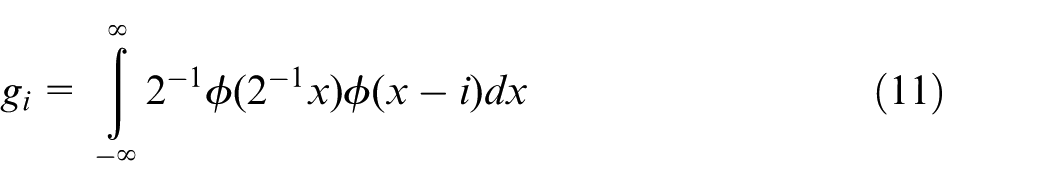
where l is the level of decomposition (l = 1, 2, 3, …). Because scale a of DWT is a geometric sequence with ratio 2, DWT method is imperfect to extract interested frequency with arbitrary scale from original surfaces. Because the scale of CWT is continuous, CWT can be used to analyze the frequencies with arbitrary scale in machined surface. Therefore, CWT method is used to extract frequency features in this article. 1D and 2D CWTs are used to analyze 2D profiles and 3D surfaces, respectively. 2D-CWT can be computed as
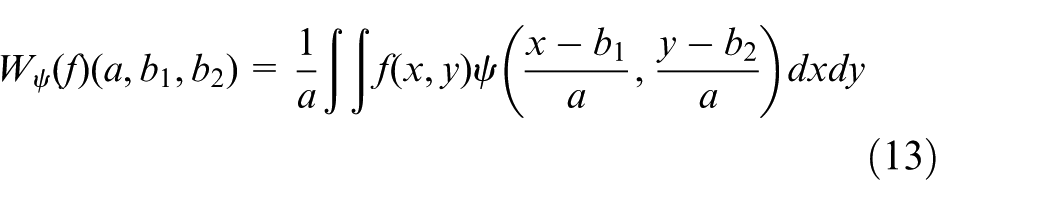
where b1 and b2 are the position parameters in the X and Y directions, respectively, and b1 is equal to b2 in this article. Mexihat wavelet is an isotropic wavelet and suitable for pointwise analysis of machined surfaces, which is shown in Figure 1. The wavelet defines a family of non-orthogonal wavelets. Mexihat function is adopted as wavelet basis function of CWT in order to avoid disturbing directional features of frequency topography.
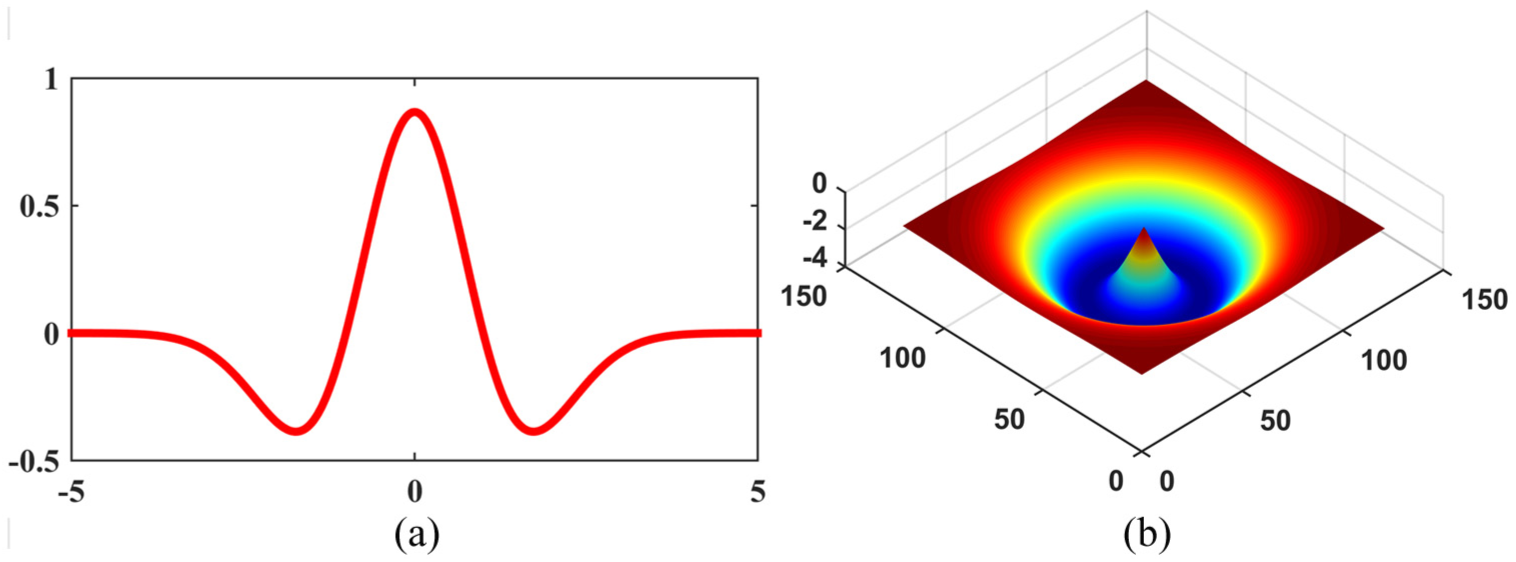
Waveform of Mexihat function in time domain: (a) 1D Mexihat and (b) 2D Mexihat.
Method of frequency extraction and reconstruction
Before using CWT method to extract specific frequency topography, corresponding scale between specific frequency and wavelet basis should be calculated as
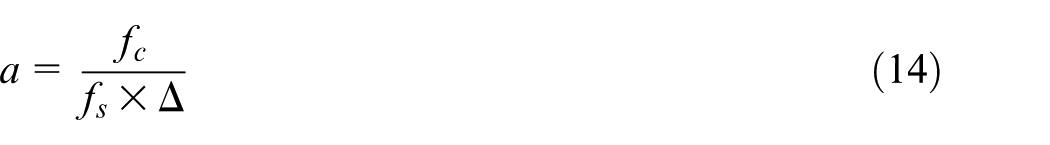
where fc is the adopted central frequency of Mexihat wavelet basis (fc for Mexihat wavelet basis function is 0.25), Δ is the sampling period of measuring instruments, a is the corresponding scale of fs and fc, and fs is the central frequency of actual waviness which needs to be extracted from machined surface and it can be calculated as
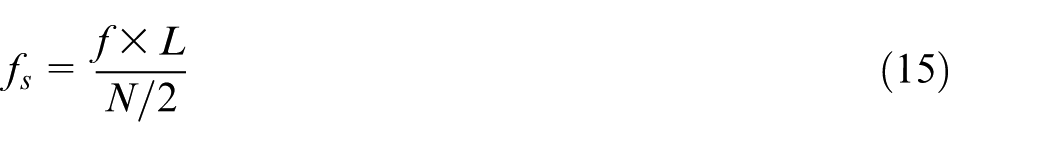
where f is the frequency of actual waviness in machined surfaces, L is the length of sampling area, and N is the number of sampling points in the direction of sampling length.
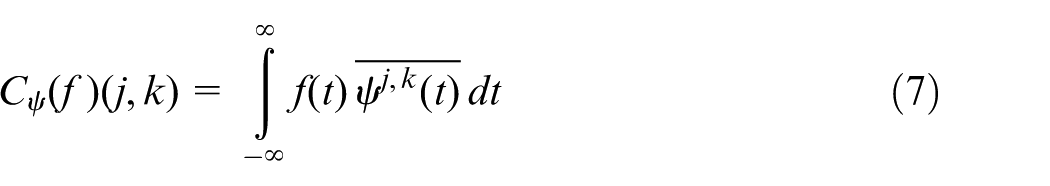
The results of CWT analysis are wavelet coefficients, and they are dimensionless and irrelevant to actual amplitude of extracted frequency topography. CWT coefficients can only represent shape information of different frequencies. By summing the scaled 1D-CWT coefficients from selected scales, approximate amplitude of extracted frequency can be reconstructed and shown as
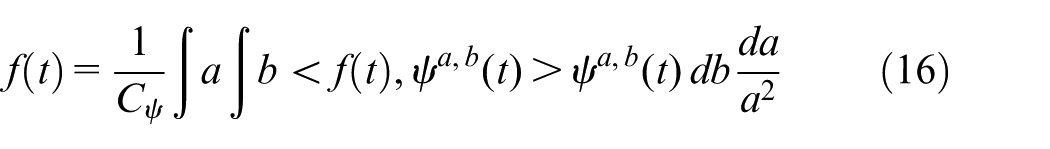
where f(t) is the reconstructed frequency features. 2D-CWT wavelet coefficients can be reconstructed by equation (16) on the x-coordinate followed by equation (16) on the y-coordinate.
Experiments and results
Single-point diamond turning experiment
Precision machined KDP surface is analyzed by PSD and wavelet methods in this article. It is the (001) surface of KDP single crystal machined by single-point diamond turning method. The parameters adopted in the machining process are shown in Table 1.
Parameters in the machining process.
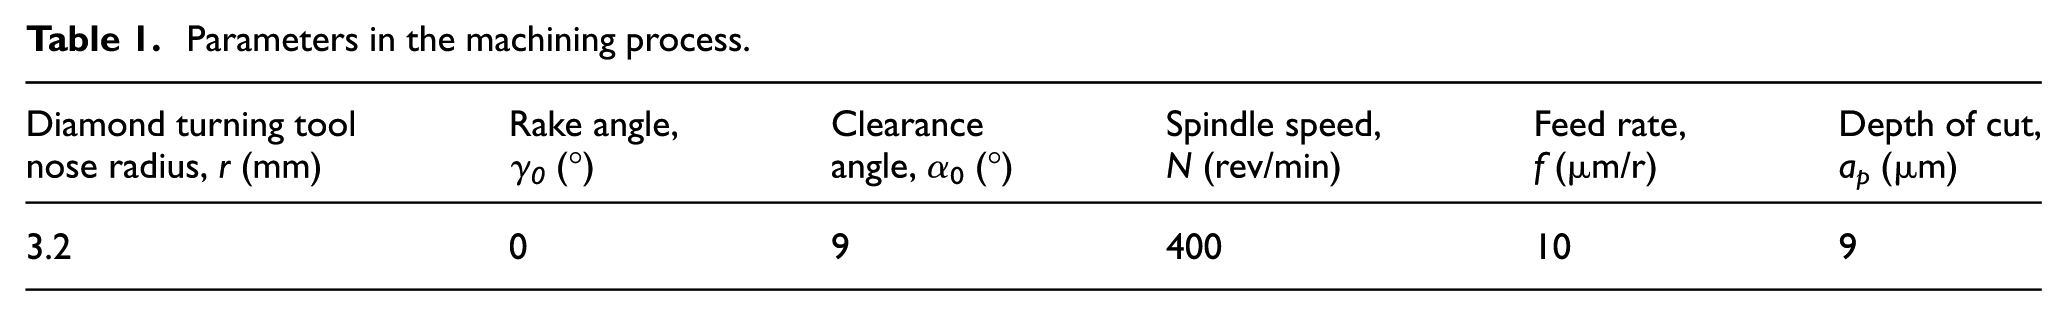
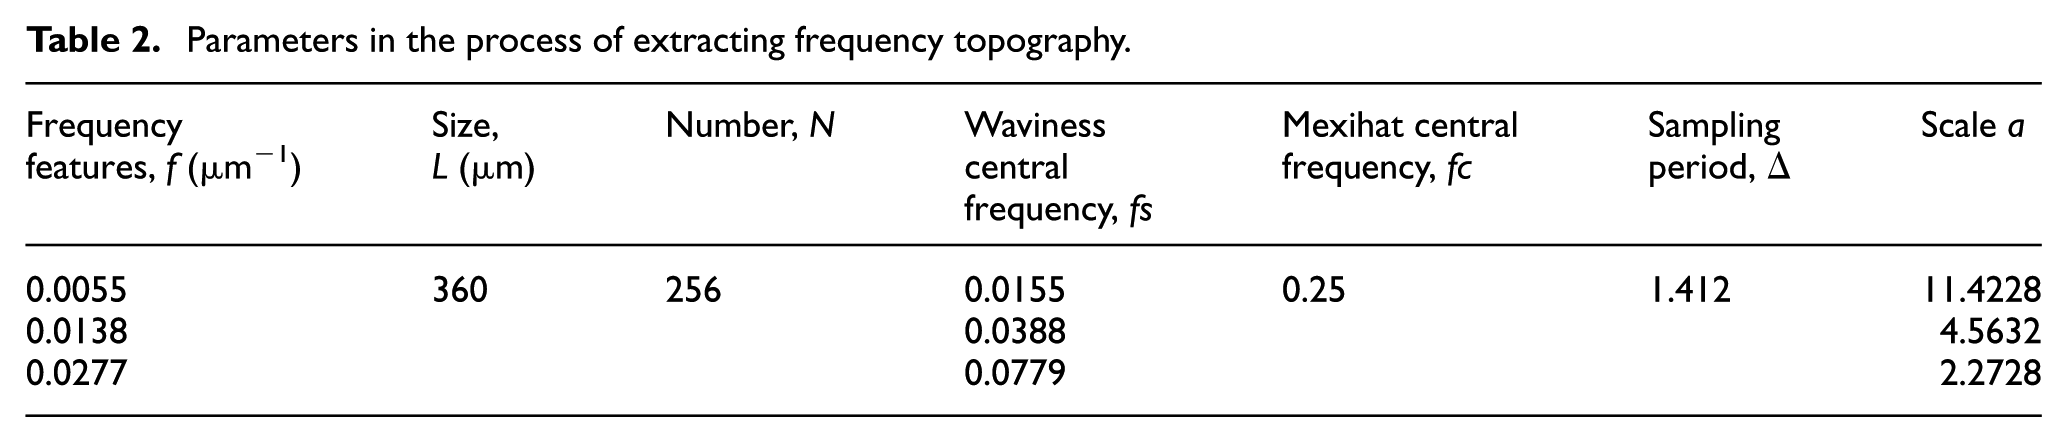
Then, the machined 2D profile and 3D surface topography are measured by Talysurf CCI 2000 White-Light Interferometer, as shown in Figure 2. The root-mean-square (RMS) deviation Sq of 3D surface topography is 36.9 nm. The sampling area is 360 μm × 360 μm, the sampling number is 256 × 256, and the minimum sampling period is calculated as 1.412 μm/pixel (360 μm/255pixels). With the measurement result, parameters of equation (14) and (15) can be determined and shown in Table 2.
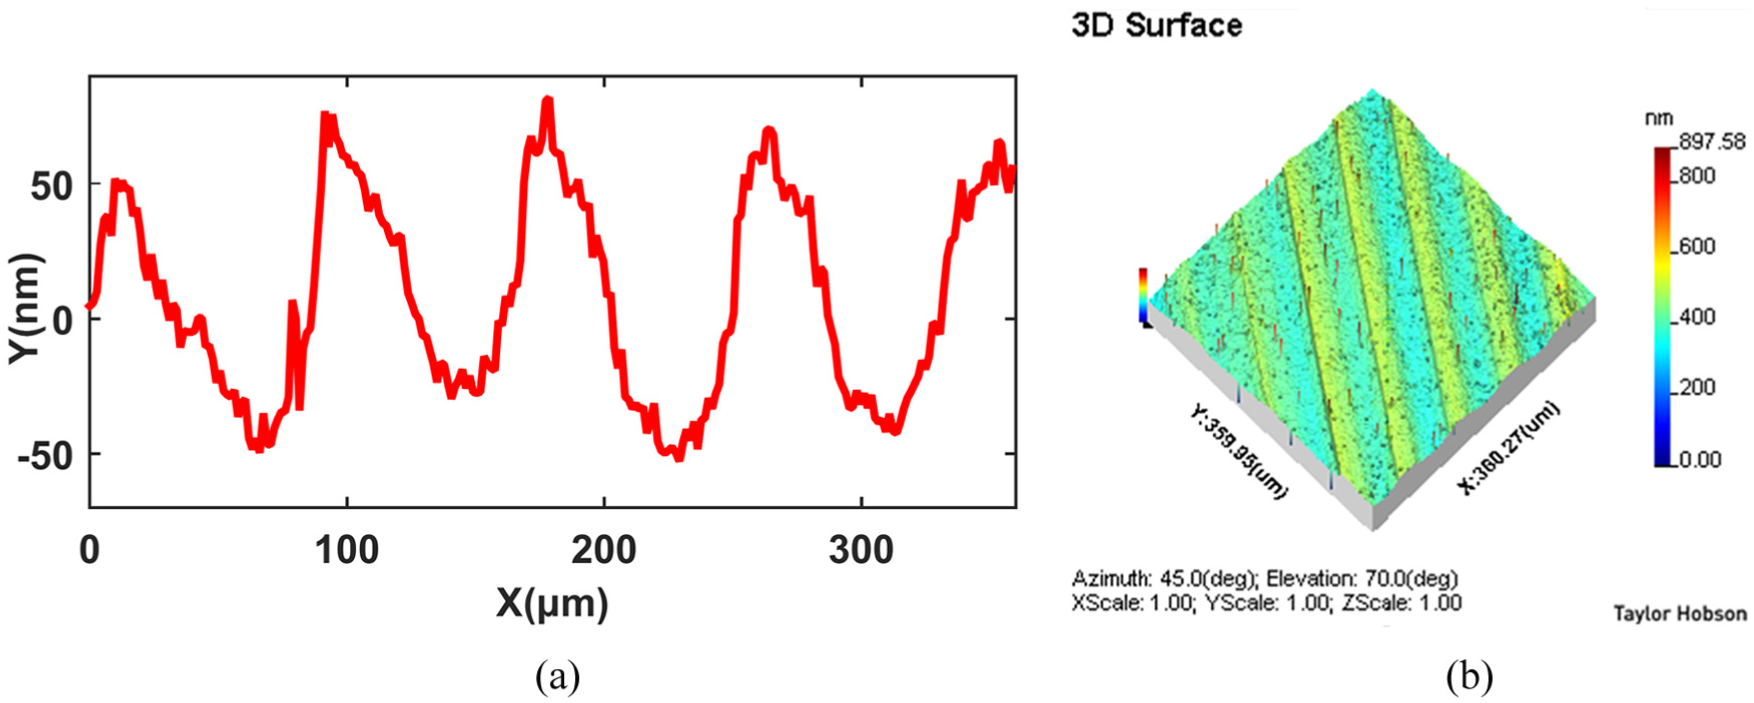
Machined profile and surface of KDP crystal measured by White-Light Interferometer: (a) original profile and (b) 3D machined surface.
Parameters in the process of extracting frequency topography.
Extraction and reconstruction of frequency features
The precision machined surface is composed of different waves. Some waves belonging to low and intermediate frequencies are produced by the processing parameters and vibrations in the machining process. The other high-frequency waves are formed by material properties of work piece. Because KDP crystal is mainly used in the optic field, the frequency with specific wavelength on its surface may disturb the properties of laser beam. 30 So, it is necessary to extract arbitrary 2D or 3D frequency topographies from precision machined surfaces for further analysis.
PSD analysis
The purpose of PSD analysis is to find the actual frequency features involved in precision machined surface. Frequency range within sampling area is from 0.0028 to 0.354 μm−1, and minimum frequency interval in different directions is 0.0028 μm−1. Figure 3 shows the PSD results of machined 2D profile and 3D surface.
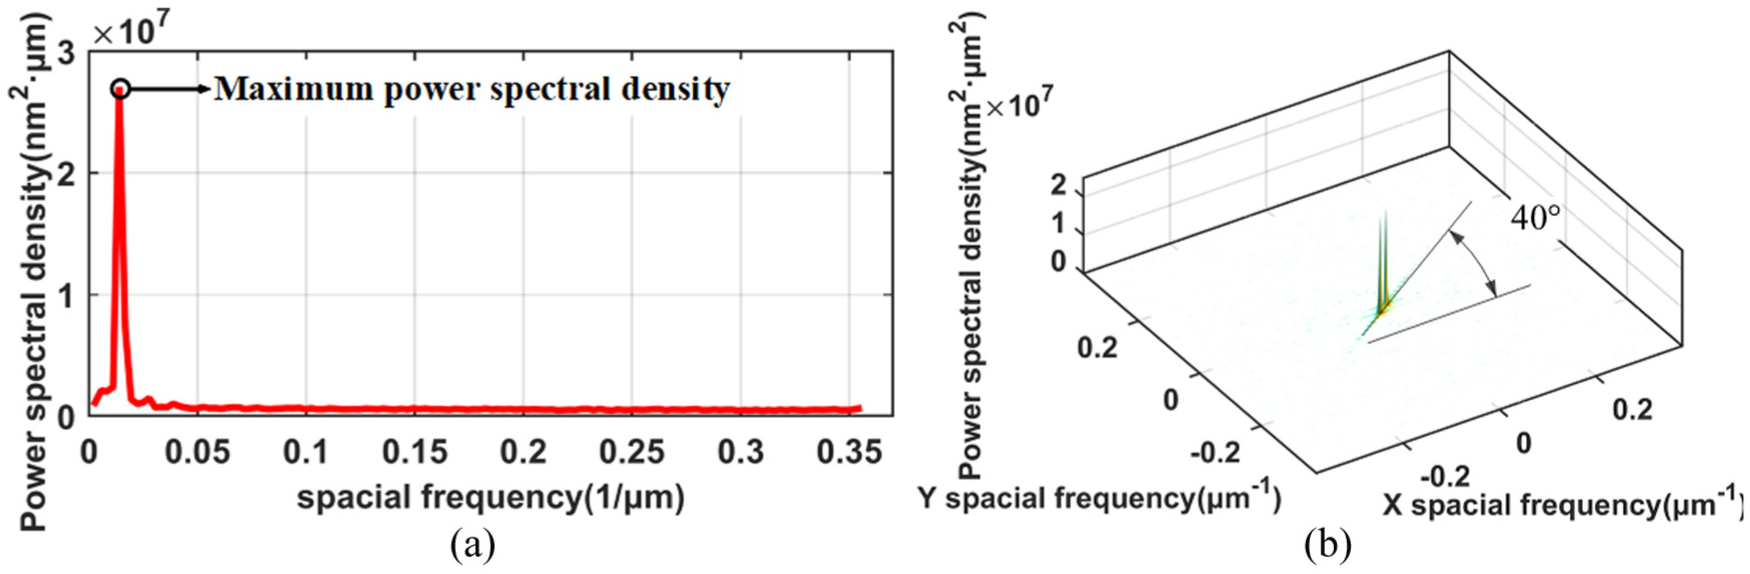
Results of (a) 1D PSD and (b) 2D PSD.
Frequency of maximum power spectral density is about 0.0138 μm−1 in Figure 3(a), which is the main influence factor on the topography and roughness of machined surface. From Figure 3(b), spatial frequency is mainly distributed along a 40° direction of the X-axis. The angle reflects the relation between the tool path during machining process and the direction of sampling. It also reflects the anisotropy of surface topography.
CWT results
Three more obvious frequency features in precision machined surface will be extracted and restructured by wavelet method. These frequencies are actual waviness in precision machined surface. Figure 4 shows the value f of three frequency features: 0.0055, 0.0138, and 0.0277 μm−1. The frequency of 0.01388 μm−1 has maximum power spectral density and is more remarkable than the other two frequencies. According to equation (15), central frequency fs of original signal f is calculated as 0.0155, 0.0388, and 0.0779. Thus, corresponding scale a between three extracted frequencies and central frequency of Mexihat wavelet can be calculated by equation (14) and is shown in Table 2.
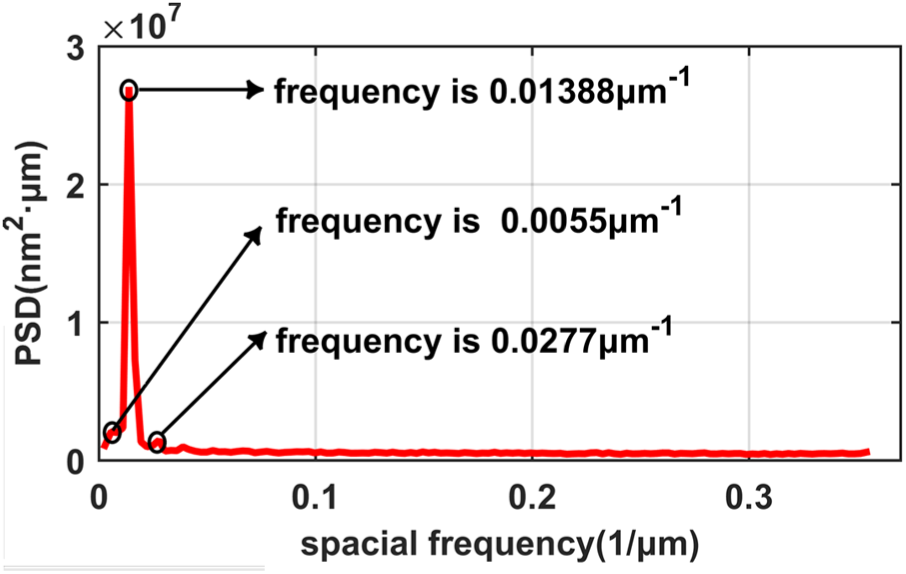
Spatial frequencies being extracted from the measured surface.
By calculating the value of a, wavelet coefficients corresponding to different scales can be obtained by equation (5) and shown in Figure 5. Compared to original profile in Figure 5, wavelet coefficients of different frequency could only represent shape information, and they cannot reflect amplitude information of extracted frequency, because wavelet coefficients belonging to dimensionless unit have no essential relationship with the surface contour.
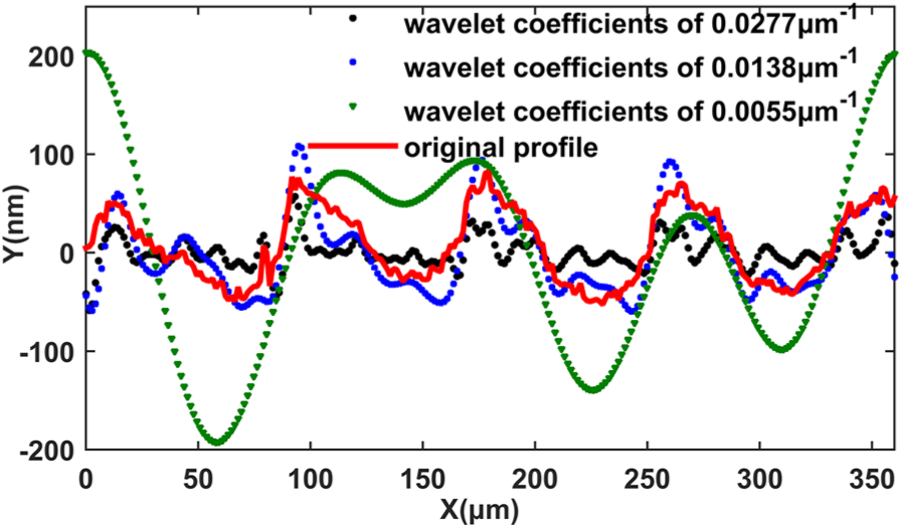
Comparison of wavelet coefficients with different scale.
To obtain actual frequency topography, wavelet coefficients should be transformed to amplitude information of extracted frequency feature. The amplitude of different frequencies can be reconstructed by equation (16). Figure 6 shows that amplitude difference between wavelet coefficients and actual frequency is enlarging with the increase in scale a.
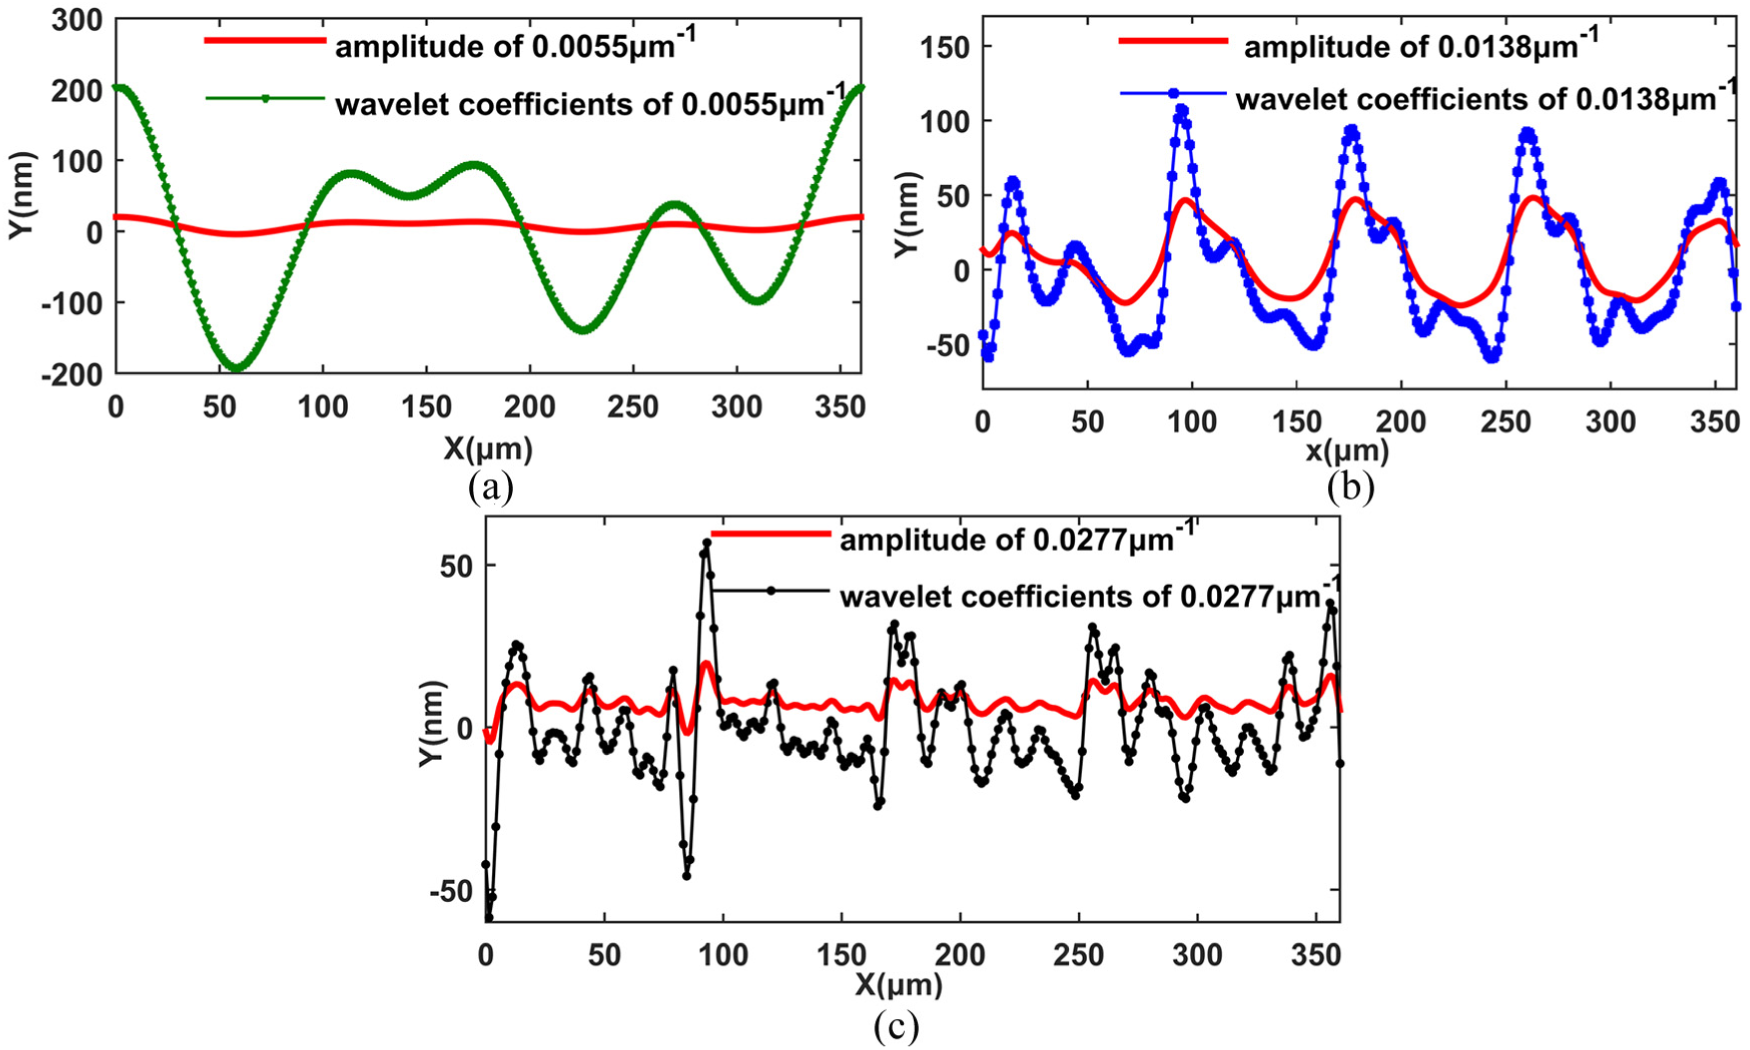
Comparison between amplitude and wavelet coefficients of extracted frequencies: (a) frequency is 0.0055 μm−1, (b) frequency is 0.0138 μm−1, and (c) frequency is 0.0277 μm−1.
Figure 7 shows the comparison between extracted frequency topographies and original profile. The topography of intermediate frequency 0.0138 μm−1 is similar to original profile. Obviously, the frequency of 0.0138 μm−1 has the largest amplitude in three frequency contents, and it is considered as the main frequency features in sampling surface. On the contrary, the other actual frequency topographies have lesser contour information. Thus, analysis results reconstructed by the CWT method are coincident with that of 1D PSD.
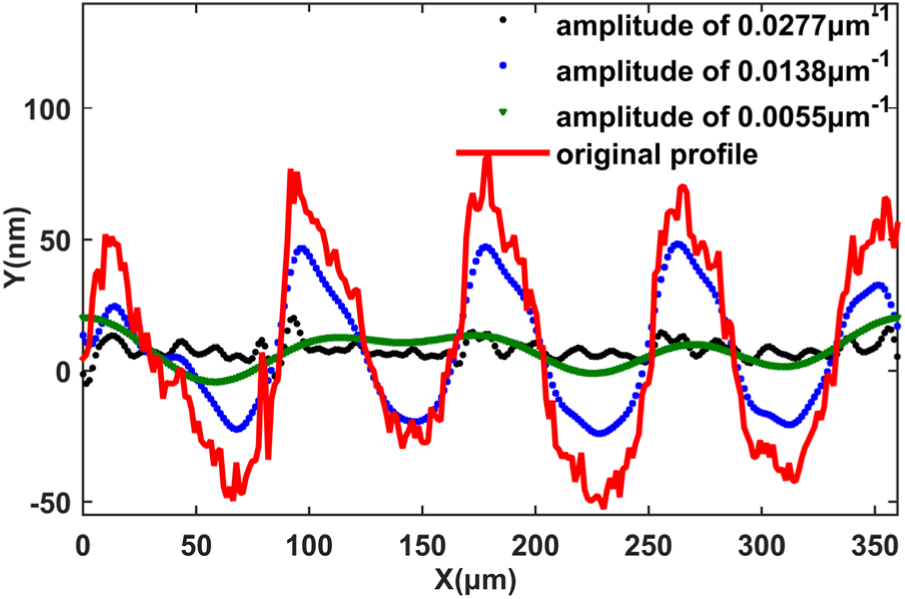
Comparison between actual frequencies and original profile.
2D-CWT wavelet coefficients corresponding to different frequencies can be extracted by substituting scale a into equation (13) and reconstructed results of 3D frequency topography which could be seen to consist of the most obvious low, intermediate, and high-frequency features in precision machined surface are shown in Figure 8.
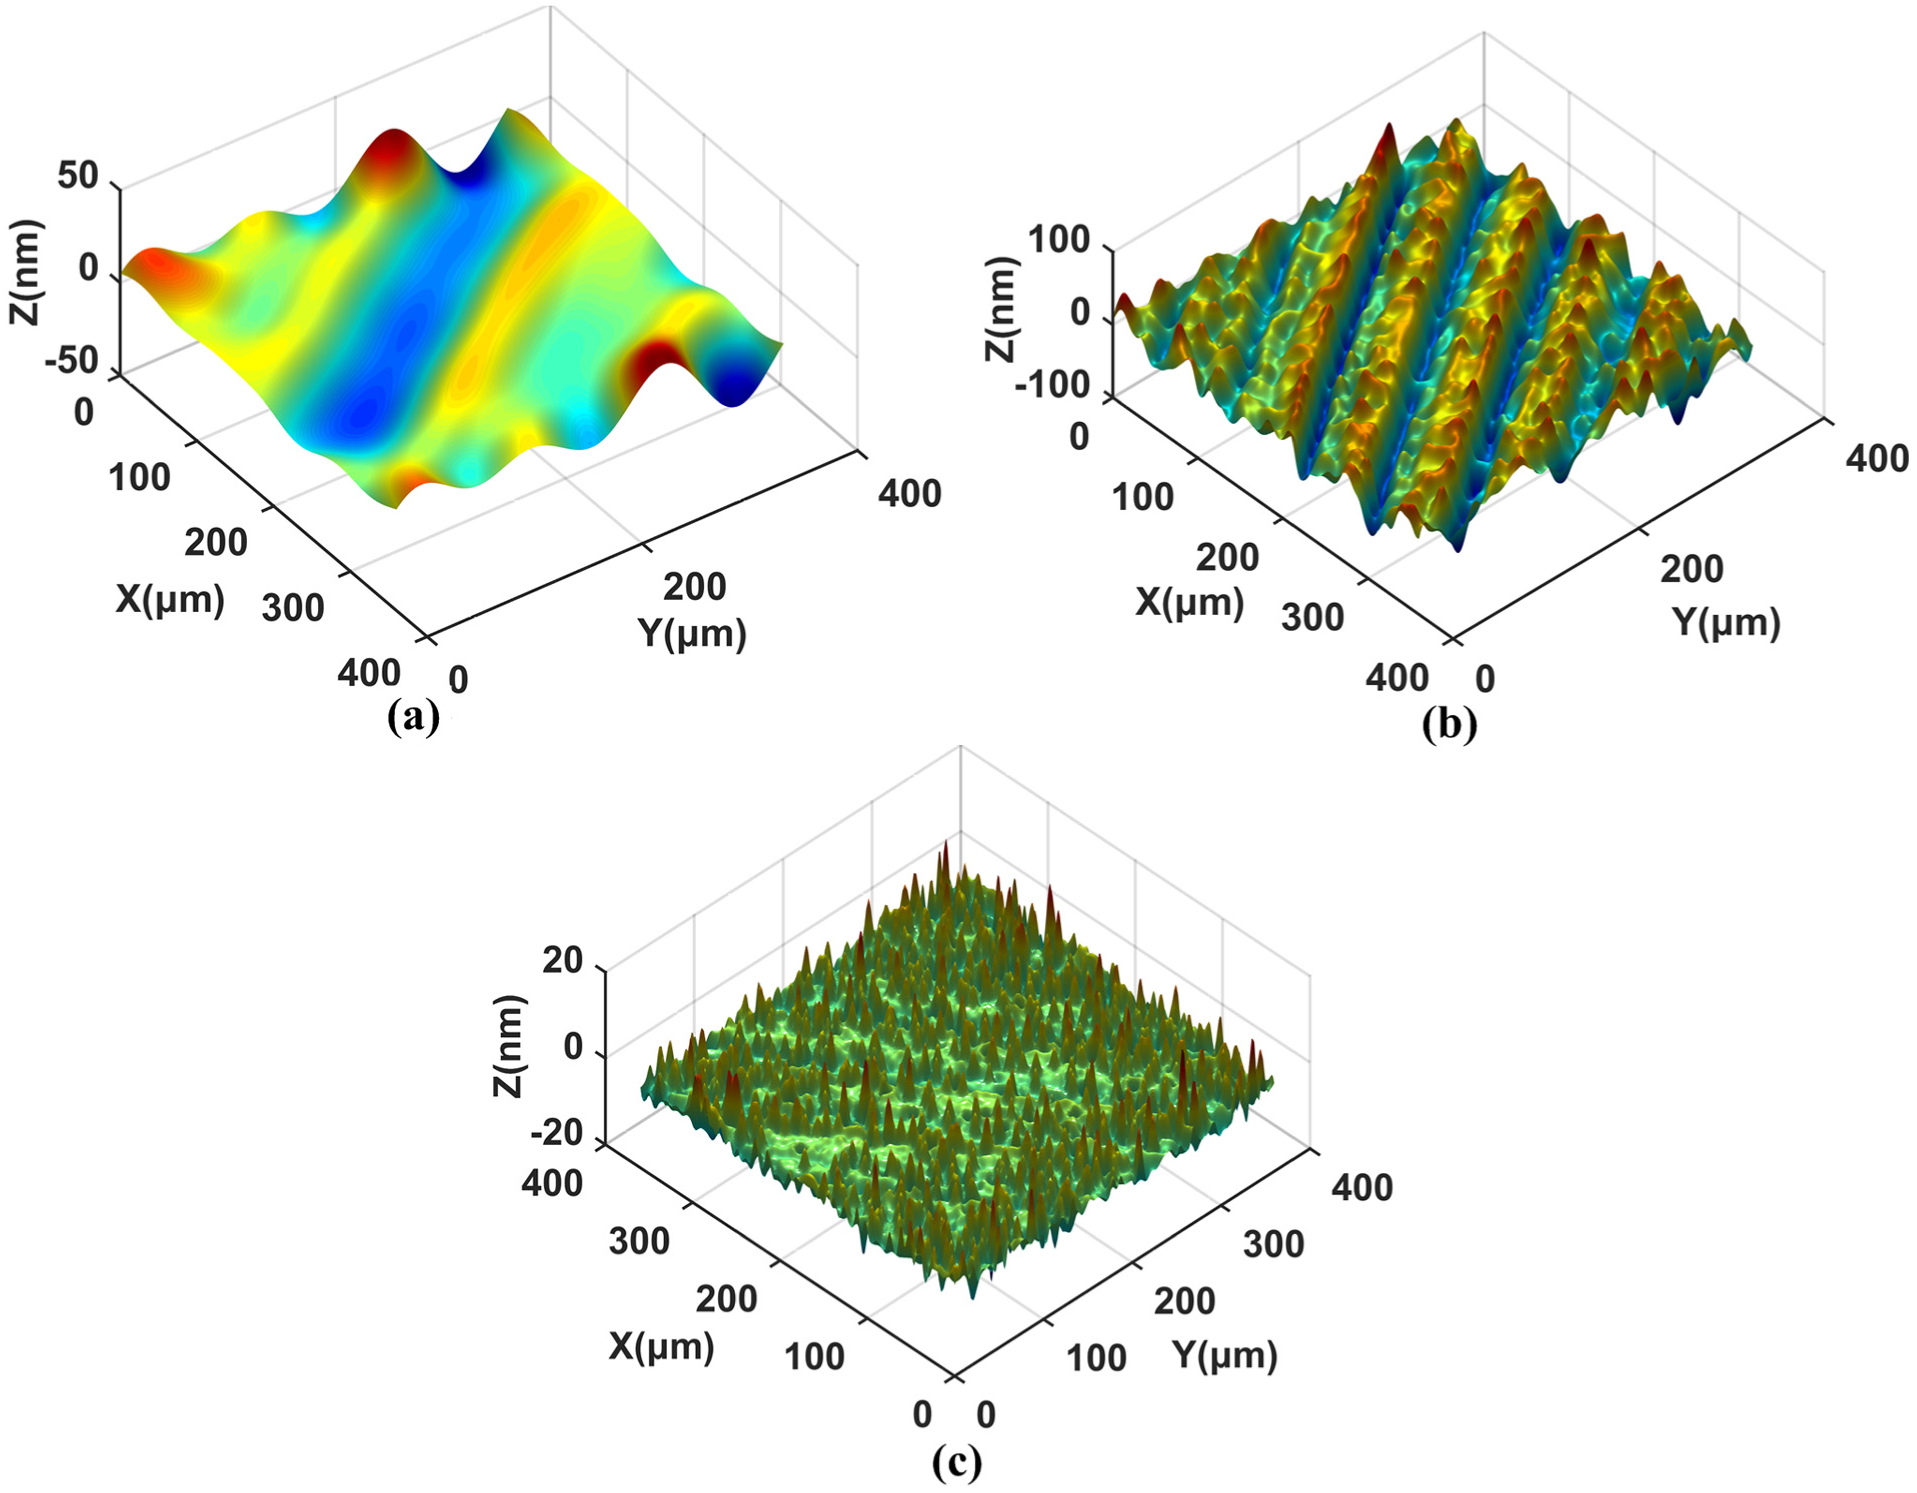
Extracted 3D topography of different frequencies: (a) frequency is 0.0055 μm−1, (b) frequency is 0.0138 μm−1, and (c) frequency is 0.0277 μm−1.
As shown in Figure 8(a) and (b), 3D topographies of 0.0138 and 0.0055 μm−1 are anisotropic, and their distribution directions along a certain angle in precision machined surface are coincident with the result of 2D PSD. It can be speculated that 3D topography of 0.0138 μm−1 belonging to the intermediate frequency feature and 0.0055 μm−1 belonging to the low-frequency feature are mainly produced by tool motion in the machining process. Because the high-frequency component of 0.0227 μm−1 is mainly affected by material properties, its topography has the minimum amplitude and is unchanged in the machining process in Figure 8(c).
Obviously, each actual frequency topography in precision machined surface is not ideal waveform as sine or cosine curve. Extraction and reconstruction of actual frequency are useful for building the relations between frequency topography and various factors in cutting process. With the known machining processing parameters, the wavelength of various frequencies can be calculated by PSD and CWT methods. Therefore, the optimized processing parameters will be chosen in return. Furthermore, the waves with special frequency wavelength, which may seriously disrupt the optical properties of precision machined KDP crystal, can be extracted and reconstructed from measured surface through CWT method.
Conclusion
From the results of analysis, the following conclusions can be obtained:
It is effective and comprehensive to use the combination of CWT and PSD methods to analyze and evaluate frequency features of precision machined surfaces. The method is suitable to extract and reconstruct arbitrary frequency topography from any measured surfaces or time series signals in the machining process.
Compared to the crude dichotomy of DWT, CWT method is more suitable and accurate to analyze arbitrary frequency features involved in precision machined surfaces. Adopting Mexihat wavelet basis to extract frequency features can retain the anisotropy property of surface topography. CWT can replace DWT in most instances of surface topography analysis.
Further analyzing the extracted frequency topography, it can be calculated that the frequencies in precision machined surfaces have different impacts on the performances of components such as friction, fatigue, optics, and lubrication.
Footnotes
Appendix 1
Declaration of conflicting interests
The author(s) declared no potential conflicts of interest with respect to the research, authorship, and/or publication of this article.
Funding
The author(s) disclosed receipt of the following financial support for the research, authorship, and publication of this article: The research reported in this article was supported by the Project of Jiangsu Science and New Agricultural Engineering (NJ2014-11) and the Project of Jiangsu Science and Technology Support Plan (BE201283).