
Abstract
Advanced manufacturing techniques such as die-sinking electro-discharge machining have been introduced in different industries such as the naval, automotive and product manufacturing. The surface finish of the parts subjected to these processes is influenced by diverse factors related to geometrical parameters, electric circuit, lubrication system and materials. For that reason, this work is focused on the analysis of the surface morphology of machined part that can be achieved by electro-discharge machining, as a function of some of the main process parameters such as the current intensity and penetration depth. In this work, three different methods for experimental analysis of surface quality, based on the measuring of surface roughness, material profile ratio and crater diameter, were applied and compared. The experimental phase included tests with copper tools on AISI 316 stainless steel workpieces. The surface roughness and accumulated material profile were recorded using measurements made with a profilometer, and for the purpose of measuring the diameter of the craters, scanning electron microscopy technology was used. According to the results, crater diameter can be adopted as a better indicator to characterize the surface quality in electro-discharge machining, because it exhibits a clearer tendency as a function of current intensity and penetration depth.
Keywords
Introduction
Due to the ability to work with high hardness materials, as well as the wide range of geometries capable of machining, electro-discharge machining (EDM) has become a technique widely used in different sectors of industry, such as the aerospace, automotive, product manufacturing and naval sectors. 1 In the naval industry and other different industrial sectors, there are diverse mechanical components that can be processed by this manufacturing technique. The optimization of the process to materials and geometries of some industries is one of the branches of research that are being developed, with the aim that the EDM process is best adapted to each business sector. 2 These components are typically machined using less advanced techniques, which makes necessary to spend more time and resources to obtain the final products, and usually avoids the quality levels that can be achieved by EDM. 3 EDM machining can be recommendable for some applications such as high precision drilling. 4 A trend in research on non-conventional machining systems is identified, with the aim of expanding their use in different industries, using hybrid machining processes, 5 for example, using a combination of EDM and electro-chemical machining, 6 as well as the use of ultrasound and suspended powder particles to improve the characteristics of the pulse generated between part and tool is also identified. 7
During the past years, diverse authors carried out their research works about the influence of the dielectric fluid 8 and the main parameters of EDM. 9 Other recent works were focused on different topics such as the distribution of energy applied to the workpiece surface during the discharges and craters originated during the cutting process, 10 the conditions of the plasma channel, 11 the effects caused by the particles in suspension and surface bubbles, 12 the influence of gap between the part and electrode, 13 the tool wear associated with these processes, 14 or the development of new techniques for improving the control of EDM process. 15 Not only the classic applications of EDM, but also EDM drilling, 16 wire EDM, 17 micro-EDM, 18 or hybrid processes were analysed during the recent years. 19 In some of these works, mathematical models for simulation of EDM were developed, with the purpose of discovering the appropriate parameters for different applications. 20
Shabgard et al. 21 introduce a fuzzy-based algorithm for prediction of material removal rate (MRR), tool wear ratio (TWR) and surface roughness (Rz, Rk) in the EDM and ultrasonic-assisted electro-discharge machining (US/EDM) processes. By means of this technique, they are able to carry out simulations with a high degree of reliability, over 90%, thus being able to configure the process input parameters in the most optimal way, adapting better to the geometries and materials to be machined. Gil et al. 22 focus their studies on the modelling of the ‘recast layer’ as well as on the final finish of the workpiece, aimed at the machining of micro-tools, using the inverse slab electrical discharge milling process.
In this sense, Markopoulos and Davim 23 studied the partial or complete numerical modelling of the machining processes by EDM together with other non-conventional techniques, which achieves the best prediction of the expected results during the process, being able to define the best technique for each piece to be produced. Similarly, the aim was to improve the work areas, by means of the technologies offered by industry 4.0 and the possibility of digitizing all systems, including EDM processes, thus reducing machine maintenance times and movements in the workshops, and therefore the total production time of the components. 24 Navaei and ElMaraghy’s 25 studies focus on the optimization of the sequence of operations, which together with the reduction of maintenance and waiting times, and the optimization of process parameters as proposed in this research, makes the electro erosion machining process even more competitive in today’s industry.
Several works were focused on the study of EDM parameters such as electrode wear, MRR, machining productivity and micro-hole quality. About these aspects, Li et al. 26 investigated the removal efficiency, surface roughness, surface alloying and microhardness during the wire EDM of Inconel 718 nickel-based alloys. Three different trim cut (TC) modes were examined, and the preferable TC modes about surface finish, absence of microcracks and microhardness were deduced. Zhang et al. 18 developed a new method that provides a better prediction of the cone angle in EDM with conic tools. This work is based on the geometric prediction of conic tool in micro-EDM milling processes. Through the optimization of the process parameters, it is possible to reduce the costs associated with the materials used in the tools, allowing this technique to be used in more industrial fields. 27 Kumar et al. 28 applied different tool movement strategies to enhance EDM performance for boring operations. The proposed movement strategies include die-sinking, helical and radial, and they were evaluated in terms of wear ratio, overcut, surface roughness and circularity error. Puthumana et al. 14 also studied the electrode wear in EDM and carried out the modelling of electrode wear to correct the depth of penetration in drilling operations. The work developed by Dong et al. 29 was focused on reducing the corrosion effects of the electrodes, which provokes worse surface integrity in the machined parts.
Shen et al. 30 proposed a novel method of high-speed dry EDM. This new technique allows that the workpiece material is rapidly melted and flushed out by the high-pressure and high-speed air flow and serves to increase two or three orders of magnitude the MRR. Kitamura and Kunieda 10 studied the diameter of heat source by single discharge EDM processes, using transparent electrodes constituted by single crystals of SiC and Ga2O3. The measured diameter of heat source was smaller than the diameter of plasma channel, but it was still larger than the diameter of craters generated on copper electrodes.
The studies performed by Kitamura et al. 12 were focused on the analysis of bubbles on the gap between the workpiece and cutting tool. Transparent electrodes were used to visualize the gap, and it was verified that the bubbles created by each spark covered more than the 70% of working surface. Li and Bai 13 proposed a novel method to control the impulses produced in micro-EDM processes, in order to visualize the gap and to study its influence on the plasma channel generated.
Despite the previous works, additional research efforts are needed in order to clarify the influence of the distinct factors involved in EDM. The main objective of this study is to deduce the relationship between the surface morphology of machined parts and some of the main process parameters of die-sinking EDM, such as the current intensity and penetration depth. The surface integrity will be evaluated by means of three different methodologies based on surface roughness, material profile slope and crater diameter, and the results obtained by these different procedures will be compared.
Experimental procedure
This research work is focused on the study of two of the main parameters of die-sinking EDM, such as the current intensity and penetration depth. According to the literature, the current intensity has a clear influence on the surface finish of the machined part. Meanwhile, the penetration depth is expected to show a linear relation with the machining time. The aim of this work consists of clarifying the effect on the surface finish of machined parts that have the parameters of the study, including the influence of electrode wear through the different values of penetration depth.
Distinct series of machining tests were performed, varying the current intensity in the range from 6 up to 14 A and penetration depth in the range from 3 up to 7 mm. The rest of process parameters were kept constant during the totality of EDM experiments, assuming a burning voltage of +200 V, pulse time of 100 µs and pause time of 25 µs.
The workpiece material considered in this work is stainless steel AISI 316, since it is very frequently used in the naval industry and other different sectors. The workpiece samples were constituted by stainless steel plates of 40 mm × 40 mm × 10 mm, to allow the execution of an EDM test in each sample corner (Figure 1(a)). To identify and control the pieces and electrodes used in the different tests, a unique code was assigned to each one of them, denoting as series D all the tests carried out with a penetration depth of 3 mm, series E for a depth of 5 mm and series F for 7 mm. A numerical sequence identifies the executed test within each series, whereas other parameters such as current intensity have been varied. For example, as shown in Figure 1, it is possible to appreciate the identification codes written in a neutral zone of the piece and the electrode.
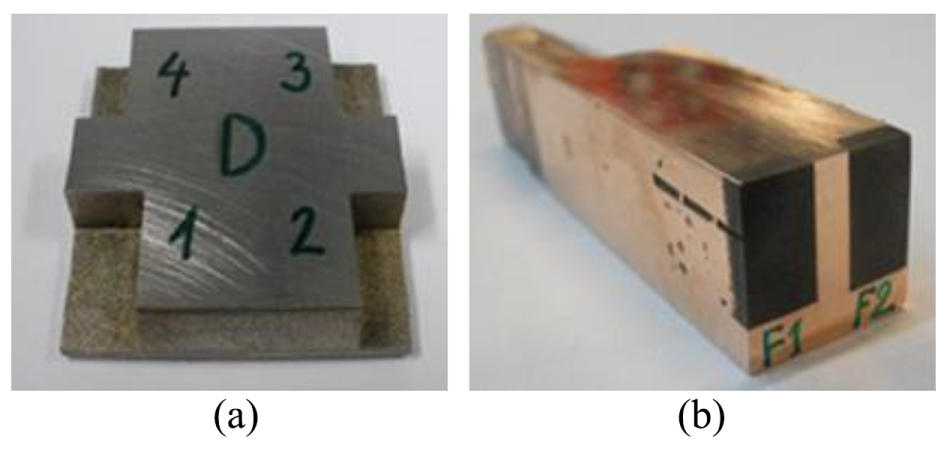
Example of workpiece and electrode for the EDM experiments: (a) AISI 316 workpiece sample and (b) cooper electrode for die-sinking EDM.
Auxiliary elements were used for correct positioning of workpiece on the machine working table, assuring the same position with respect to the electrode. To carry out all the proposed tests, an EDM machine of the ONA DATIC D2030 model was used.
The shape of copper electrodes used in the die-sinking EDM tests can be observed in Figure 1(b). The electrode extremity was extracted after each machining experiment, in order to enable the analysis of the electrode surface and provide a fresh tool for the following tests. A polishing treatment is applied on the electrode extremity before each new experiment, with the purpose of guaranteeing the same initial conditions on the cutting tool active surface.
After each EDM experiment, the machined surface was evaluated using a profilometer Hommelwerke T1000, and so the surface roughness and the Abbott–Firestone curves that identify the accumulated material were deduced. In addition, a scanning electron microscope Hitachi S-3500N was applied in order to identify the surface morphology and surface defects of the resultant parts. The scanning electron microscopy (SEM) images also serve to measure the diameter of craters and verify the results obtained by the profilometer.
Results
In this research work, the surface integrity of the parts subjected to die-sinking EDM was evaluated. The effect of some of the main process parameters such as the current intensity and penetration depth was studied. In order to avoid erroneous results, the samples were measured in the central area of the machined surface.
The surface roughness of machined parts was analysed by the arithmetic average roughness (Ra), maximum height of the profile (Rt) and root-mean-square roughness (Rq). The Abbott–Firestone curves were used to determine the slope of the accumulated material profile under the different machining conditions, for a better understanding of the surface morphology. In addition, SEM was applied to probe the surface quality and to evaluate the shape and size of the craters formed on the workpiece front face.
Characterization of surface integrity by surface roughness
The effect of current intensity on the surface finish for the cutting conditions considered in this work is illustrated in Figure 2. The results that correspond to different values of penetration depth, between 3 and 7 mm, are illustrated in Figure 2(a)–(c), respectively. The graphs that are depicted on the left-hand side of Figure 2 represent the results obtained for the maximum height of the profile (Rt), while the curves that correspond to the arithmetic average roughness and root-mean-square roughness (Ra and Rq) can be seen on the right-hand side of Figure 2.
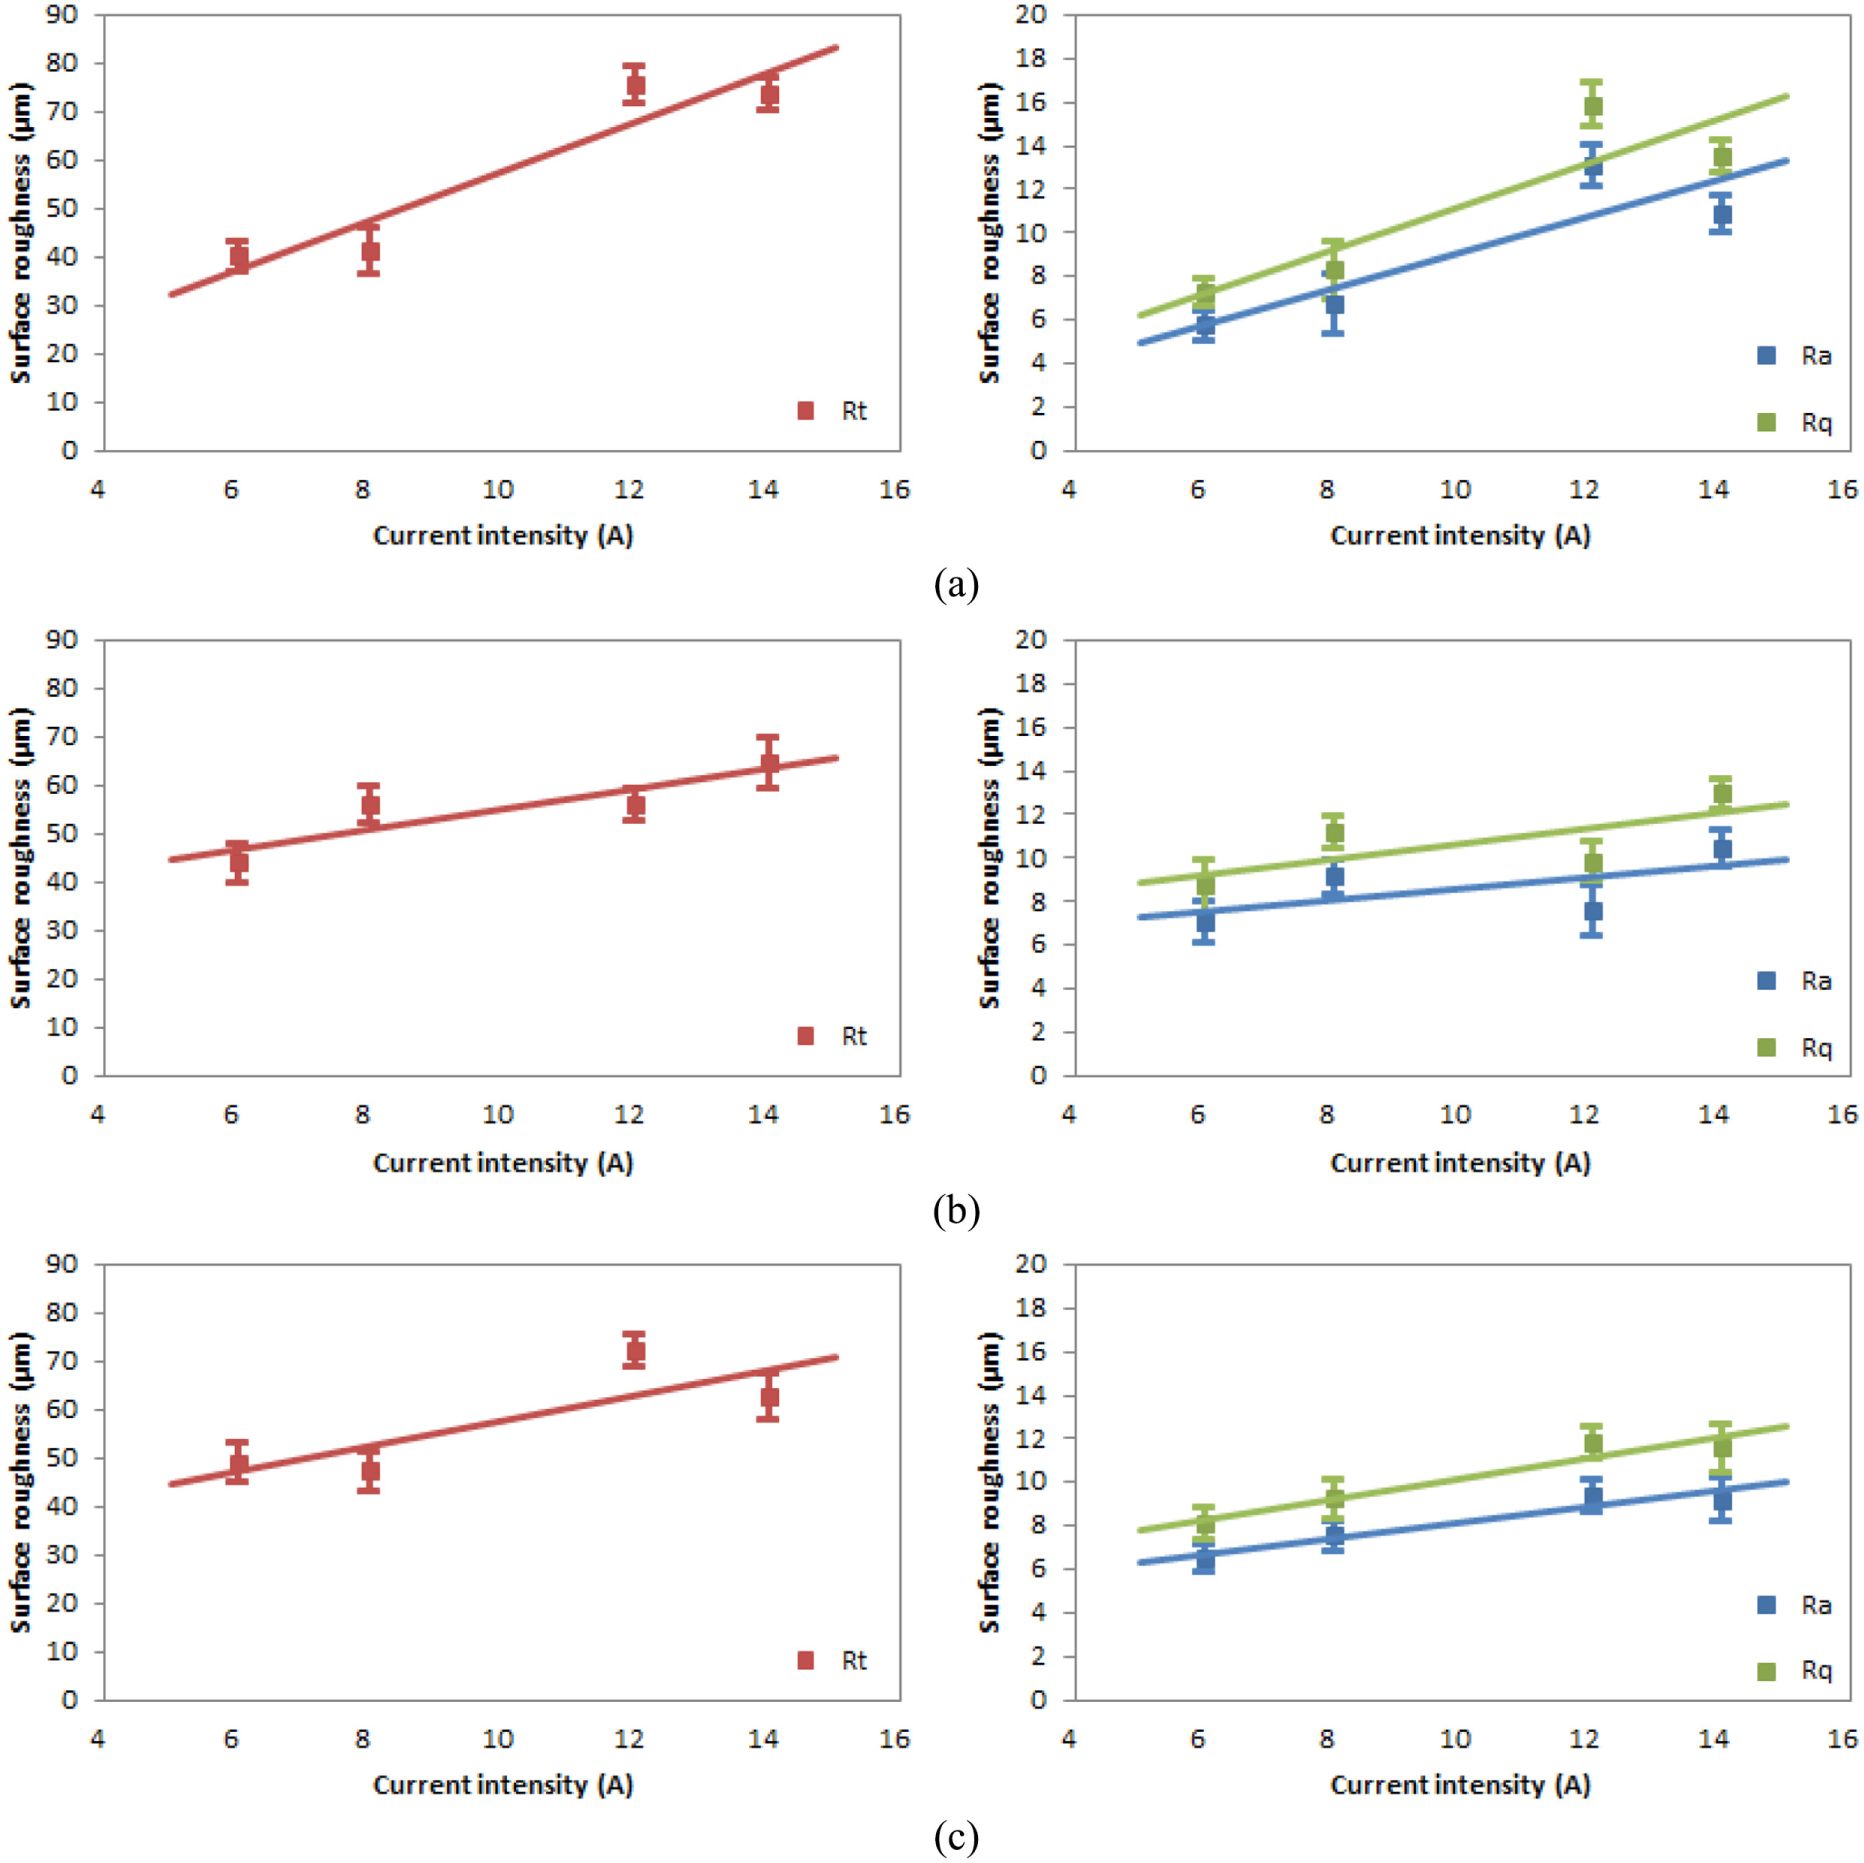
Surface finish as a function of current intensity during die-sinking EDM with different levels of penetration depth: (a) 3 mm, (b) 5 mm and (c) 7 mm.
A similar tendency was found in the curves for these three roughness parameters (Rt, Ra and Rq) from each set of process parameters. In all these cases, a linear relationship between the surface roughness and current intensity can be deduced, with a lower surface quality as the current intensity is increased.
The results and trends shown in these graphs allow to validate the experiments performed; as it is known, the increase in current intensity results in an increase in roughness values, which is shown in the graphs shown in Figure 2. Validating the goodness of the tests carried out, it will allow to execute the rest of the measurements, starting from the fact that the system behaves as expected.
There is a clear influence of current intensity on the roughness parameters, but due to the influence of tool degradation within the overall process, this influence is diminished as the penetration depth increases. 31 These results are consistent, since the increase in penetration depth causes an increment in machining times, and therefore electrode exposure, and at the same time complicates the cleaning of the slag produced in the deepest part of the hole.
Figure 3 illustrates the variation of surface roughness with penetration depth, for different levels of current intensity. In this case, different tendencies can be observed for each set of cutting conditions. A clear increasing tendency of surface roughness as a function of depth of penetration is evidenced for a low current intensity (6 A), while the surface roughness decreases for a high current intensity (14 A) and a certain tendency cannot be identified for intermediate values of current intensity (8 and 12 A).
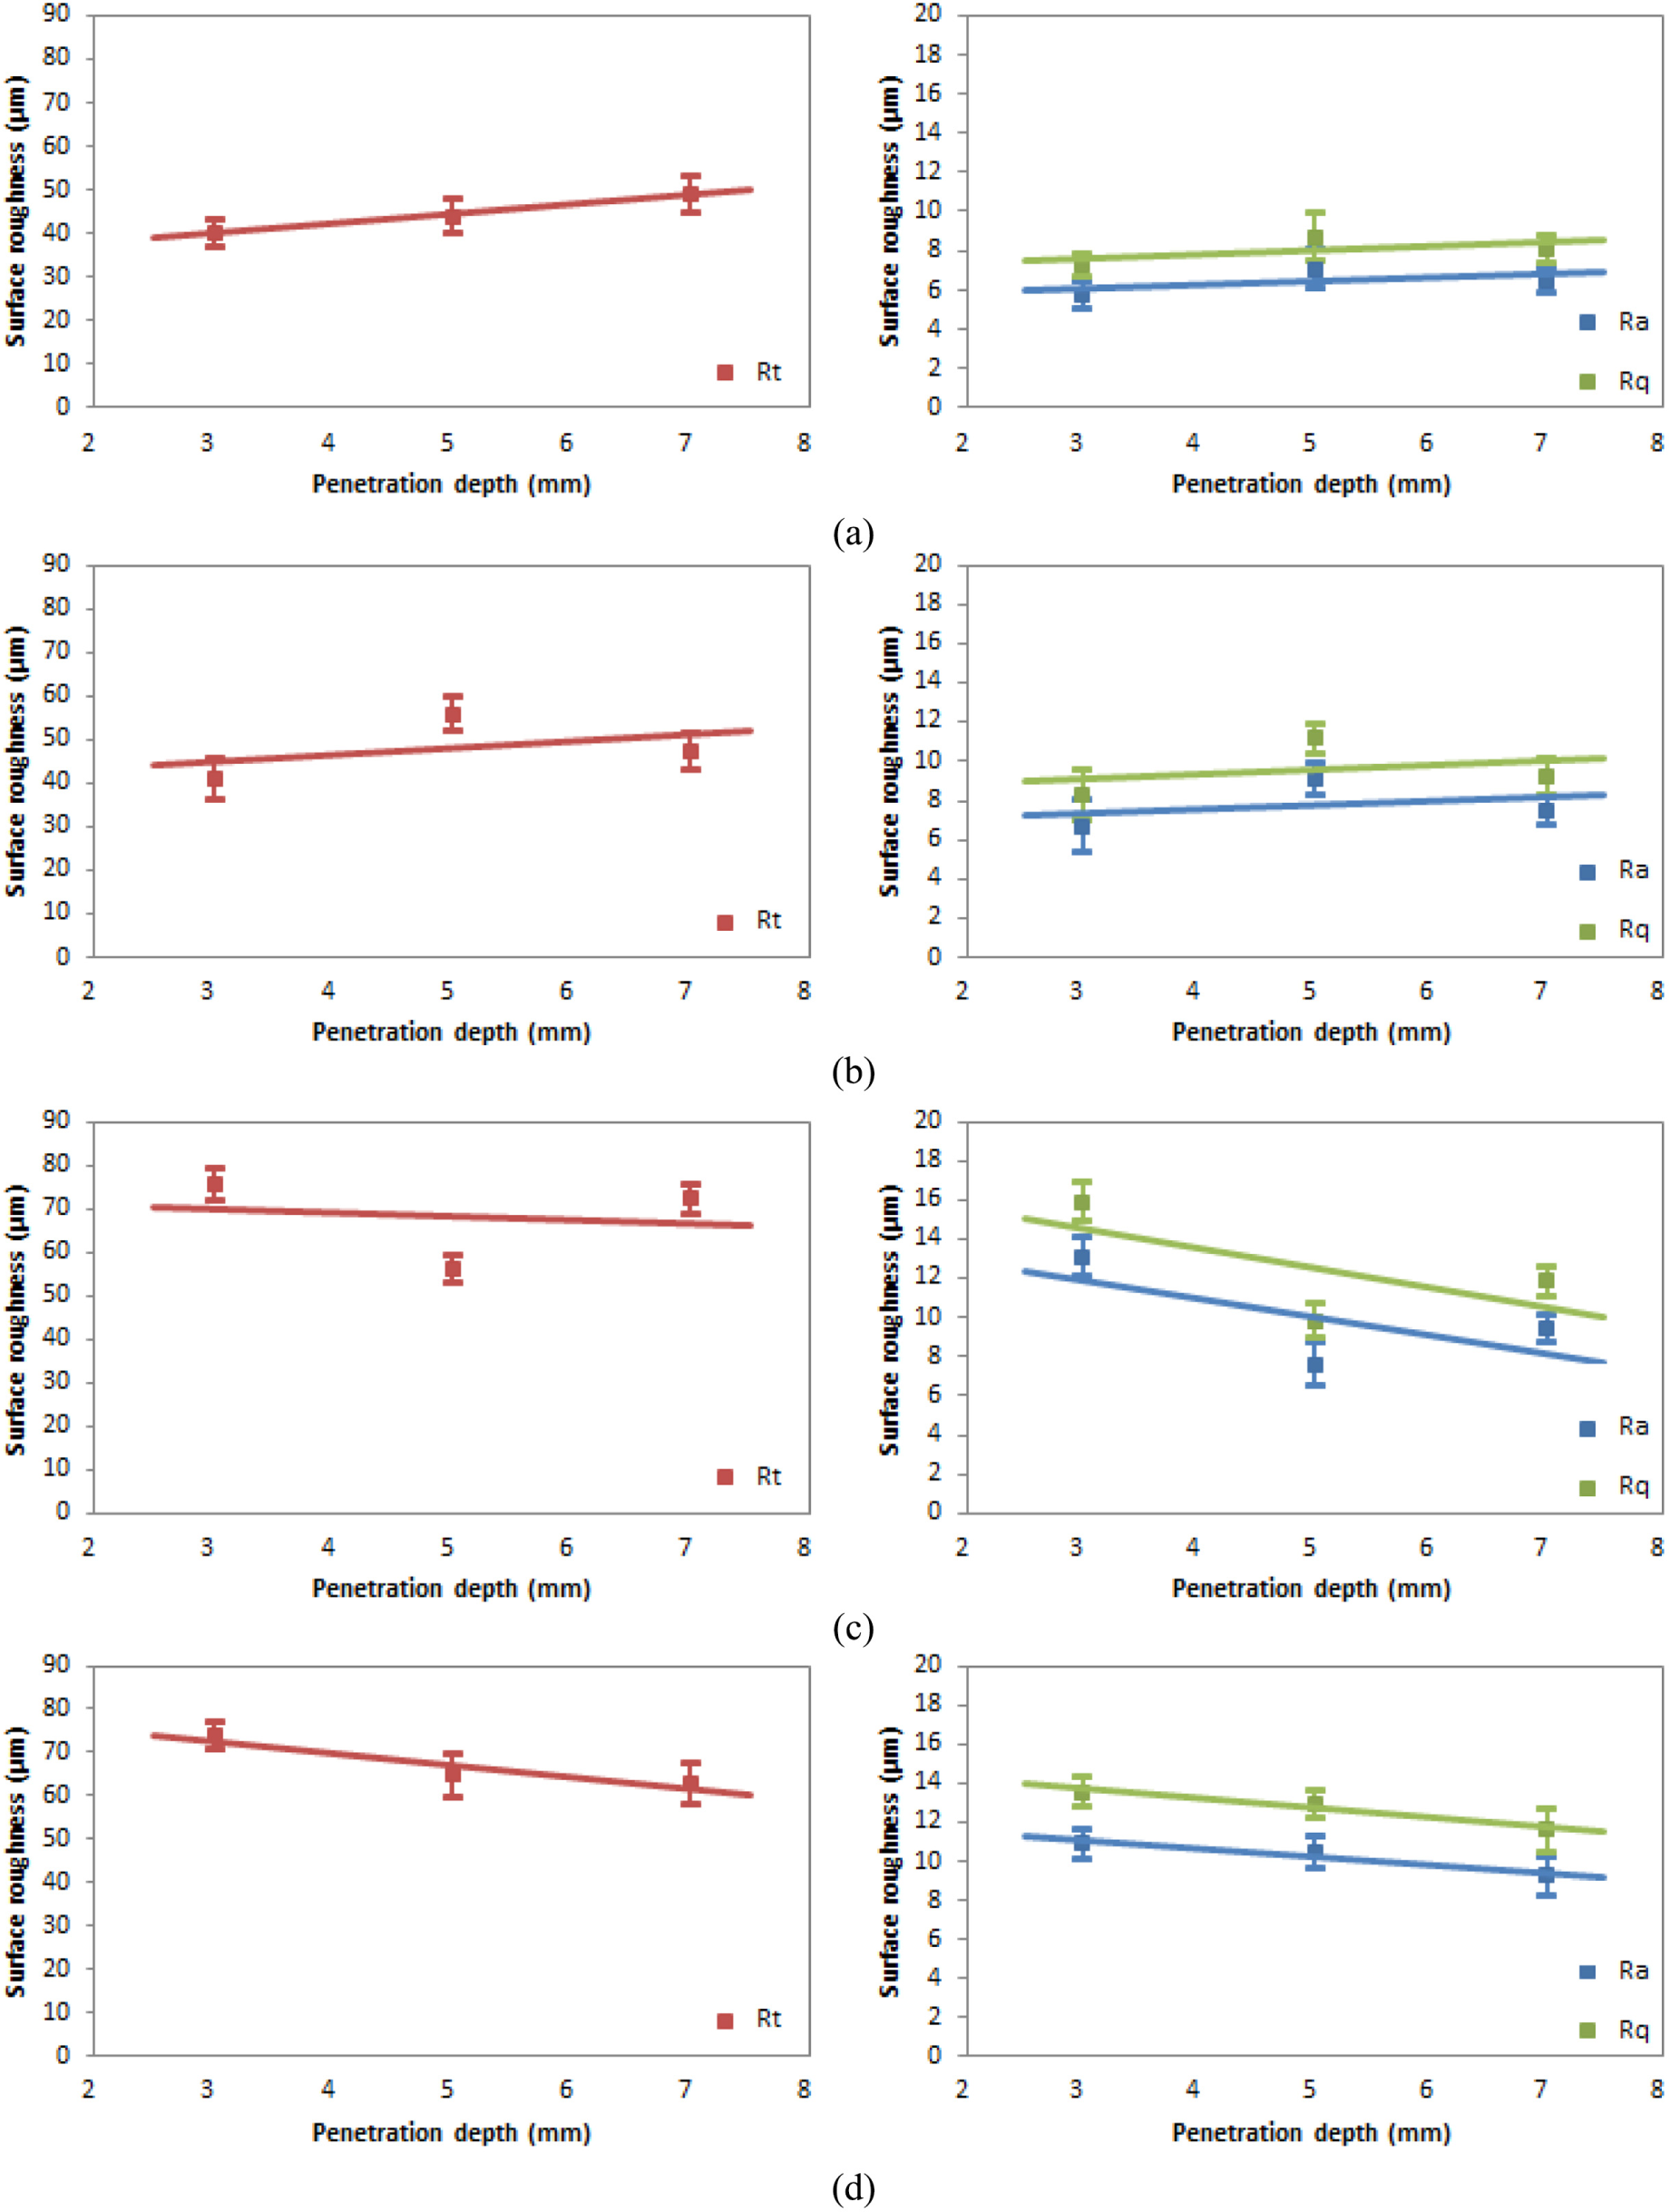
Surface finish as a function of penetration depth during die-sinking EDM with different levels of current intensity: (a) 6 A, (b) 8 A, (c) 12 A and (d) 14 A.
Therefore, a clear tendency cannot be concluded for the variation of surface roughness as a function of penetration depth. As previously stated, this lack of relationship is due to the wear experimented on the tool during the EDM process.
Characterization of surface integrity by material profile slope
For a further analysis of the surface morphology of machined part, the Abbott–Firestone curves were measured (Figure 4). The most relevant information of the Abbott–Firestone curves, about the EDM process, consists of the average slope of these curves, as shown below.
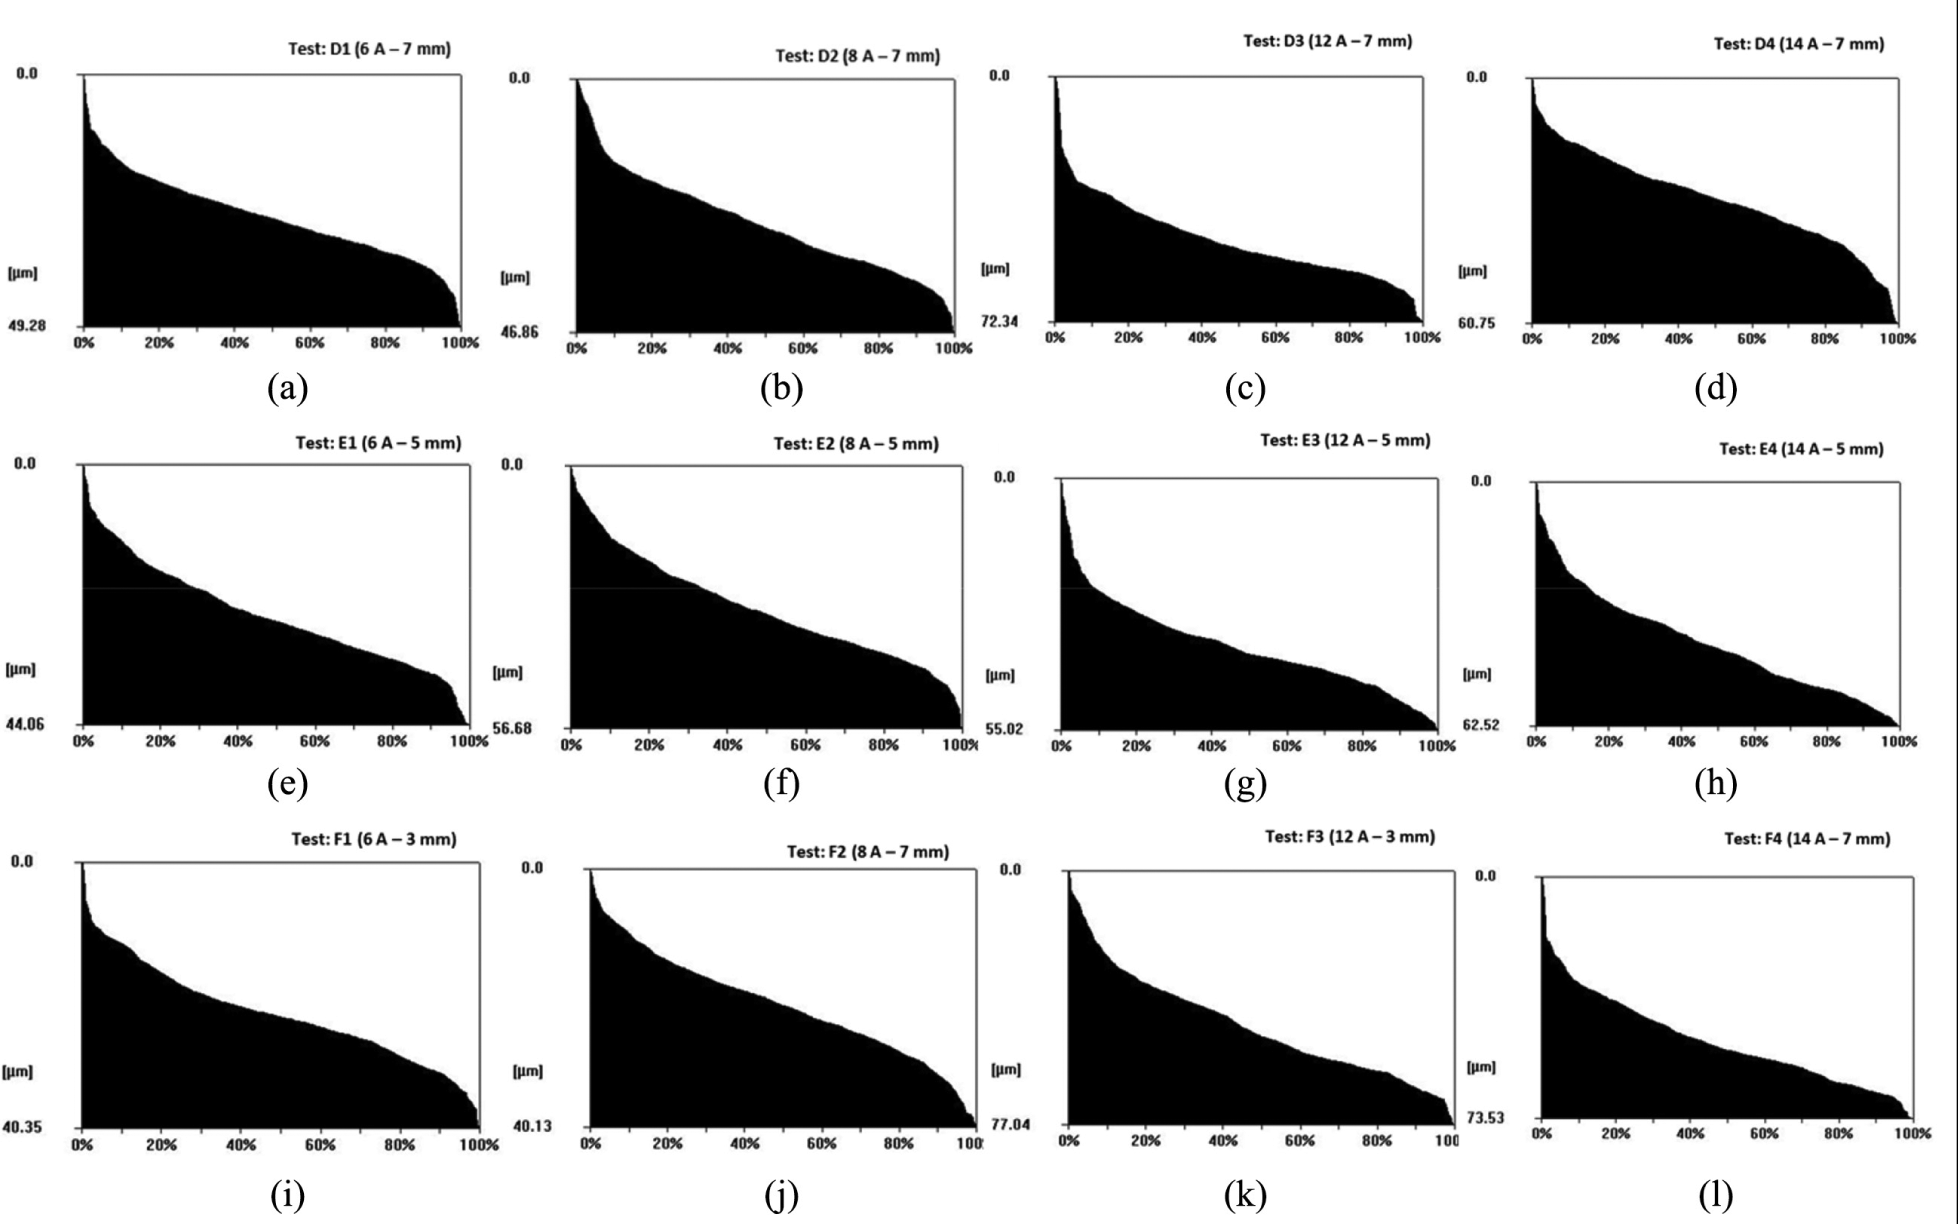
Accumulated material profiles for different cutting conditions during die-sinking EDM. (a) 6 A - 7 mm, (b) 8 A - 7 mm, (c) 12 A - 7 mm, (d) 14 A - 7 mm, (e) 6 A - 5 mm, (f) 8 A - 5 mm, (g) 12 A - 5 mm, (h) 14 A - 5 mm, (i) 6 A - 3 mm, (j) 8 A - 3 mm, (k) 12 A - 3 mm and (l) 14 A - 3 mm.
In the graph shown in Figure 4, the maximum values of the peaks of the Abbott–Firestone curves increase as the intensity increases and sometimes decrease. This effect of decreasing is due to the fact that the extreme value of the curves should not be considered, as it may be due to a specific imperfection in the surface of the workpiece. In this context, Figure 5 shows the procedure that was established in this work to deduce the material profile slope from the Abbott–Firestone curves. This parameter was calculated by joining the points that correspond to the limits of the accumulated material profile between 10% and 80%. This criterion was adopted to avoid the sporadic deviations that can appear at the extreme values of these graphs. 32
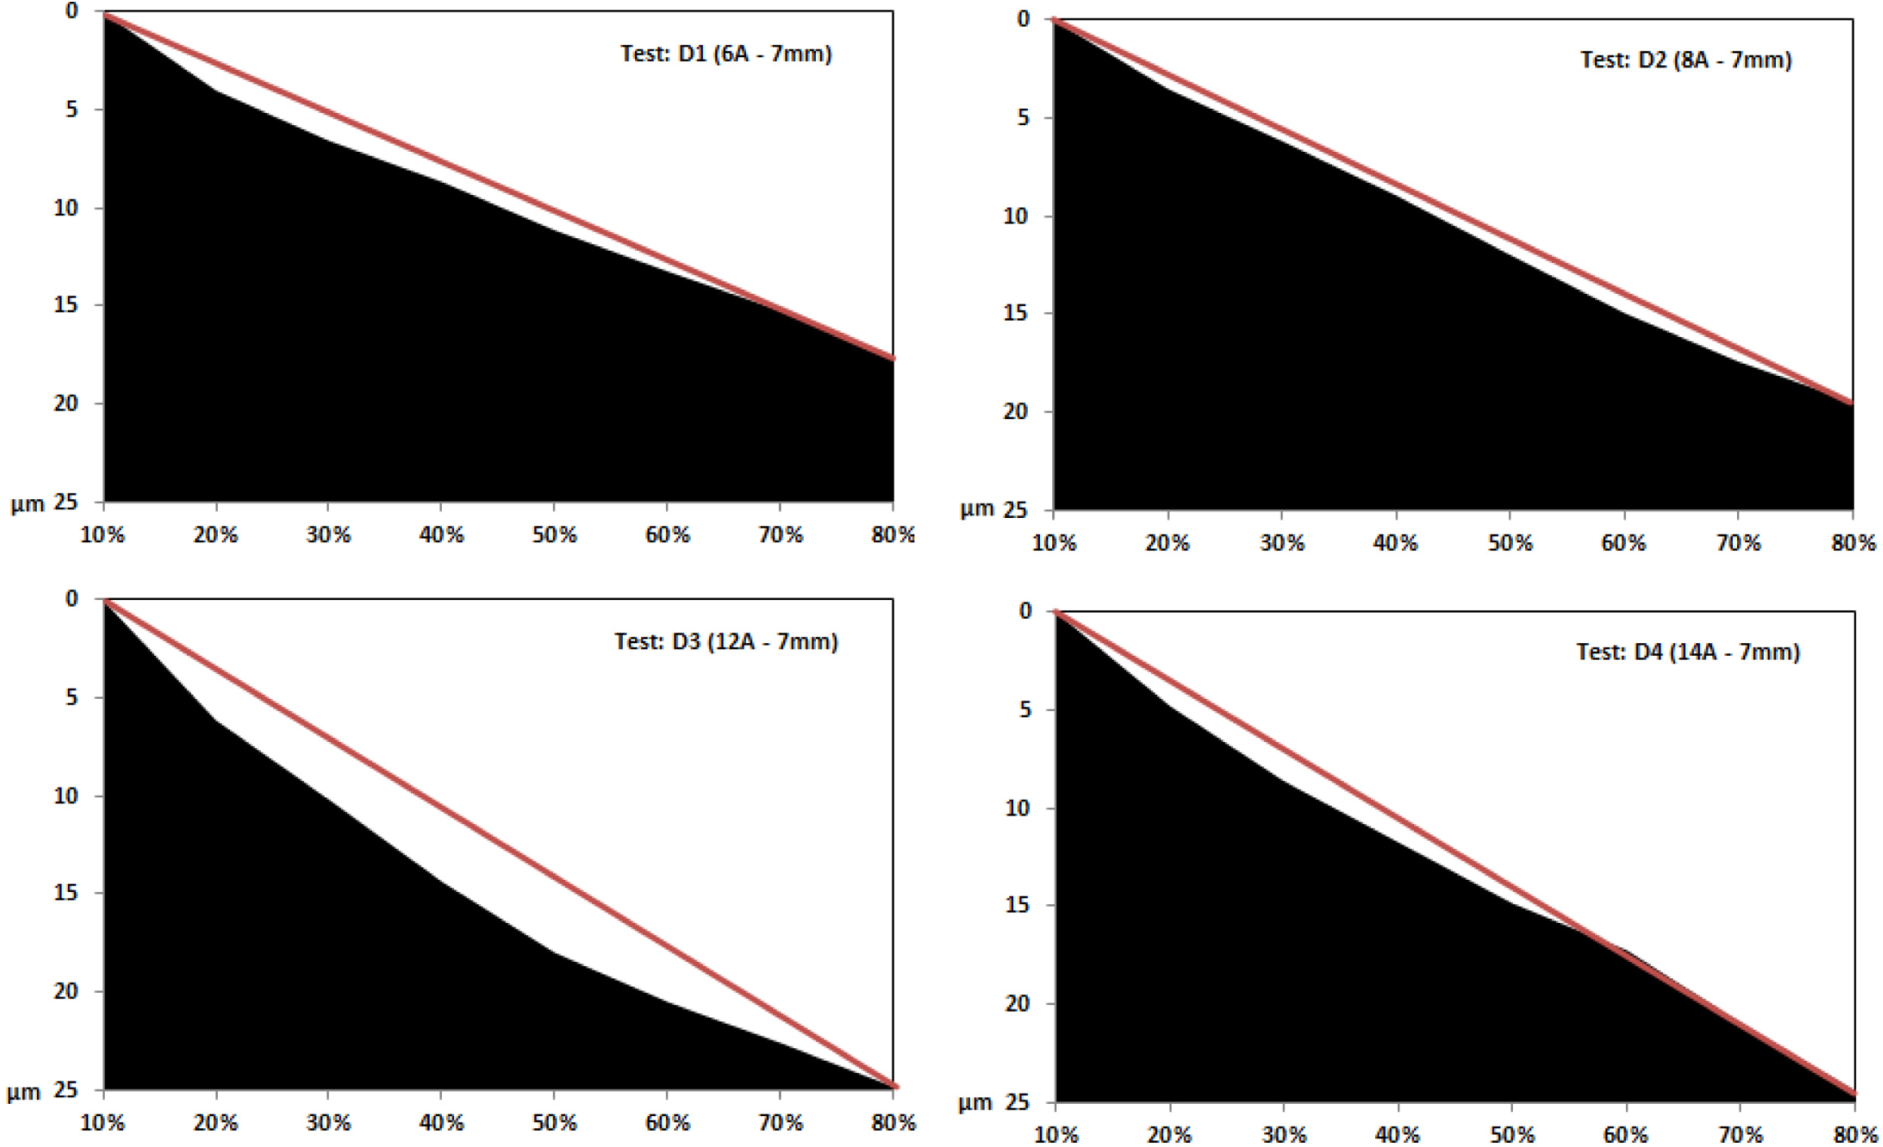
Example of procedure for calculation of material profile slope (D series experiments—7 mm).
The values of material profile slope that were obtained according to this procedure are shown in Figure 6. The curve with the material profile slope as a function of current intensity can be observed in Figure 6(a), while Figure 6(b) illustrates the curve obtained as a function of penetration depth. A clear increasing tendency can be evidenced as a function of current intensity. These results are consistent with the curves obtained for surface roughness as a function of current intensity. This increment in the material profile slope can be explained by a greater depth and diameter of the craters originated on the machined surface as the current intensity is increased.
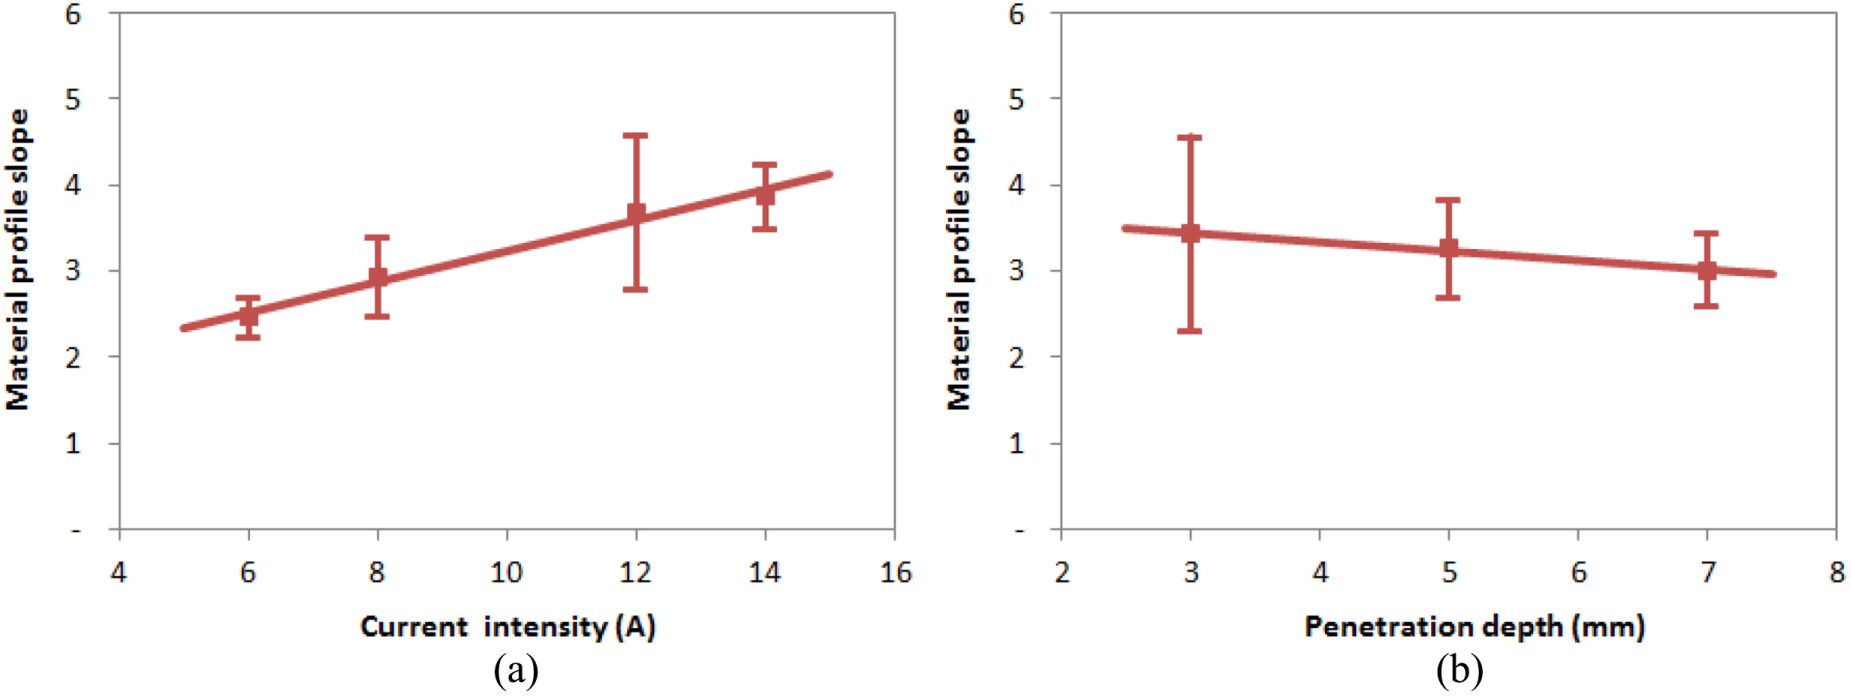
Material profile slope as a function of EDM process parameters: (a) current intensity and (b) penetration depth.
Meanwhile, according to Figure 6(b), a slight decrease in the material profile slope is produced according to the increase in the penetration depth of the electrode into the workpiece. These results are consistent with the conclusions that were obtained before about the relationship of surface roughness with this process parameter.
Characterization of surface integrity by crater diameter
As a third methodology for the experimental evaluation of surface finish in EDM processes, in this section, the analysis of crater diameter will be considered and compared to the previously applied procedures. For this purpose, SEM will be applied to obtain detailed images about the irregularities originated on the machine surface in the form of craters.
From the SEM images, the shape and size of the craters formed on the machined surface can be evaluated. To calculate the average diameter of the crater, an exhaustive experimental analysis procedure was followed, selecting 10 craters from the images taken on the surface of each test carried out, and 10 measurements of the diameter from different angles were made on each of the craters, taking the average value of the measurements as the result of the average diameter of the crater. With this procedure, it is possible to obtain a sufficiently large sample of craters to validate the data used for the analysis of the results. For example, Figure 7 shows some of the images obtained by SEM. The E series tests have been chosen as an example to show in Figure 7, which were carried out with a penetration depth of 5 mm and a current intensity range from 6 up to 14 A.
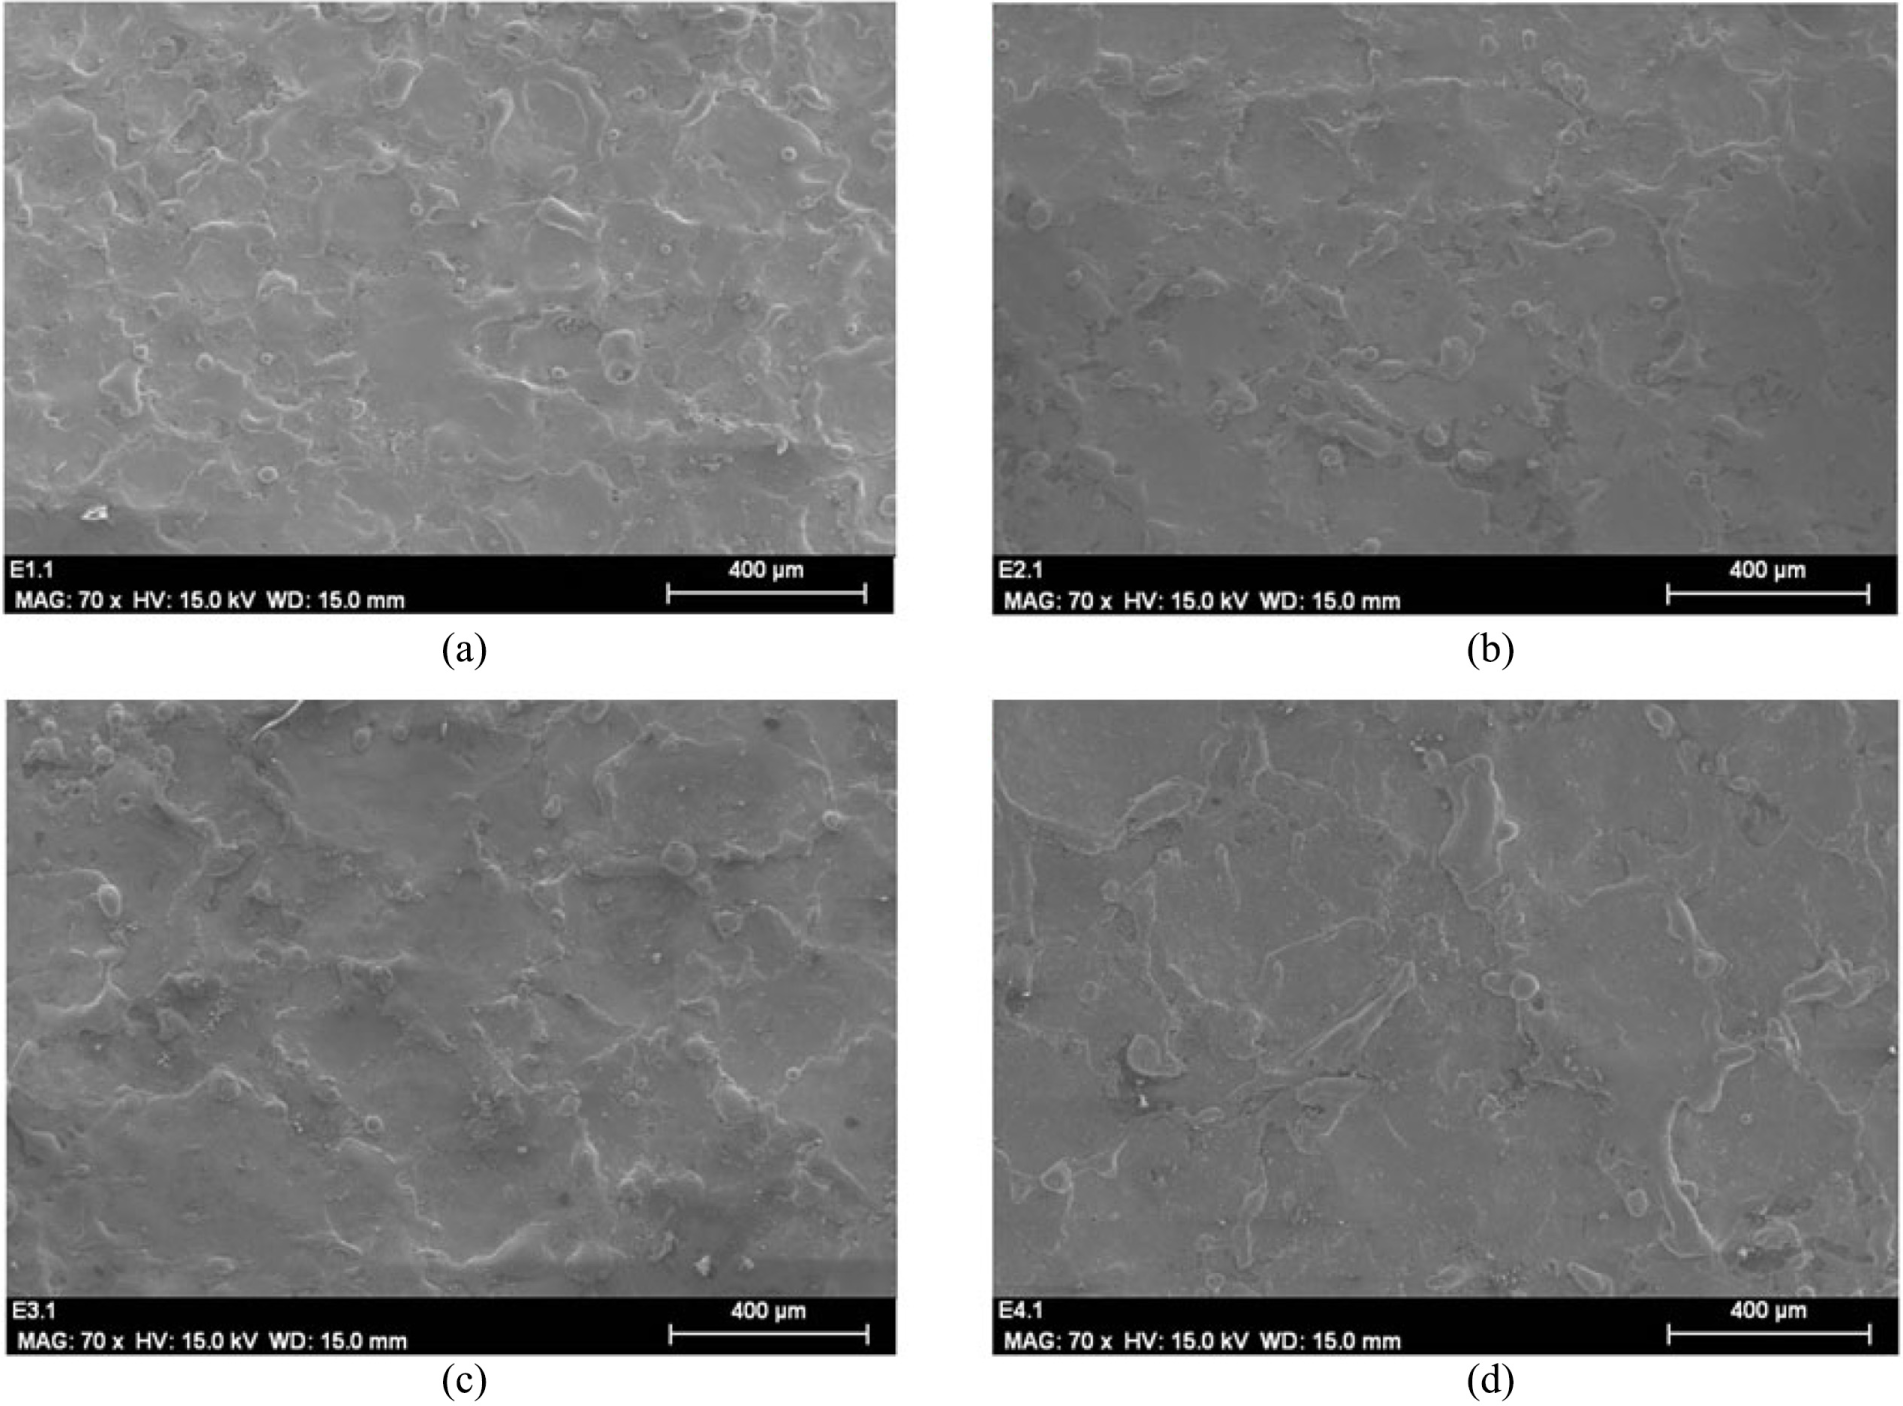
SEM images of machined surface for current intensity of 6, 8, 12 and 14 A and penetration depth of 5 mm. (a) 6 A - 5 mm, (b) 8 A - 5 mm, (c) 12 A - 5 mm and (d) 14 A - 5 mm.
According to Figure 7, the existence of an increment in the size of craters as the current intensity is increased can be evidenced. It can be explained because the craters are caused by the sparks produced during the EDM, and therefore by the heat input transmitted by the plasma channel. This input energy is directly related to the current intensity selected in the electric circuit of the EDM machine tool, and therefore, it is in accordance with the increment in the crater diameter that was seen in this figure.
But, on the other hand, this increase in the size of craters will usually imply a higher depth in these surface irregularities, and as a consequence, it could provoke a worse surface roughness and a higher material profile slope. Indeed, an increasing tendency was registered in the roughness parameters Ra, Rt and Rq and in the material profile slope as a function of current intensity in previous sections, and then a good agreement was found between the three experimental methods that have been evaluated in this work.
By graphical measuring of the SEM images obtained in this work, the shape and size of craters can be evaluated. The crater diameters deduced from these images are represented in Figure 8. A strong increasing linear tendency is revealed in the variation of crater diameter with current intensity (Figure 8(a)), which is in agreement with the raise of roughness parameters and material profile slope as a function of this process parameter.
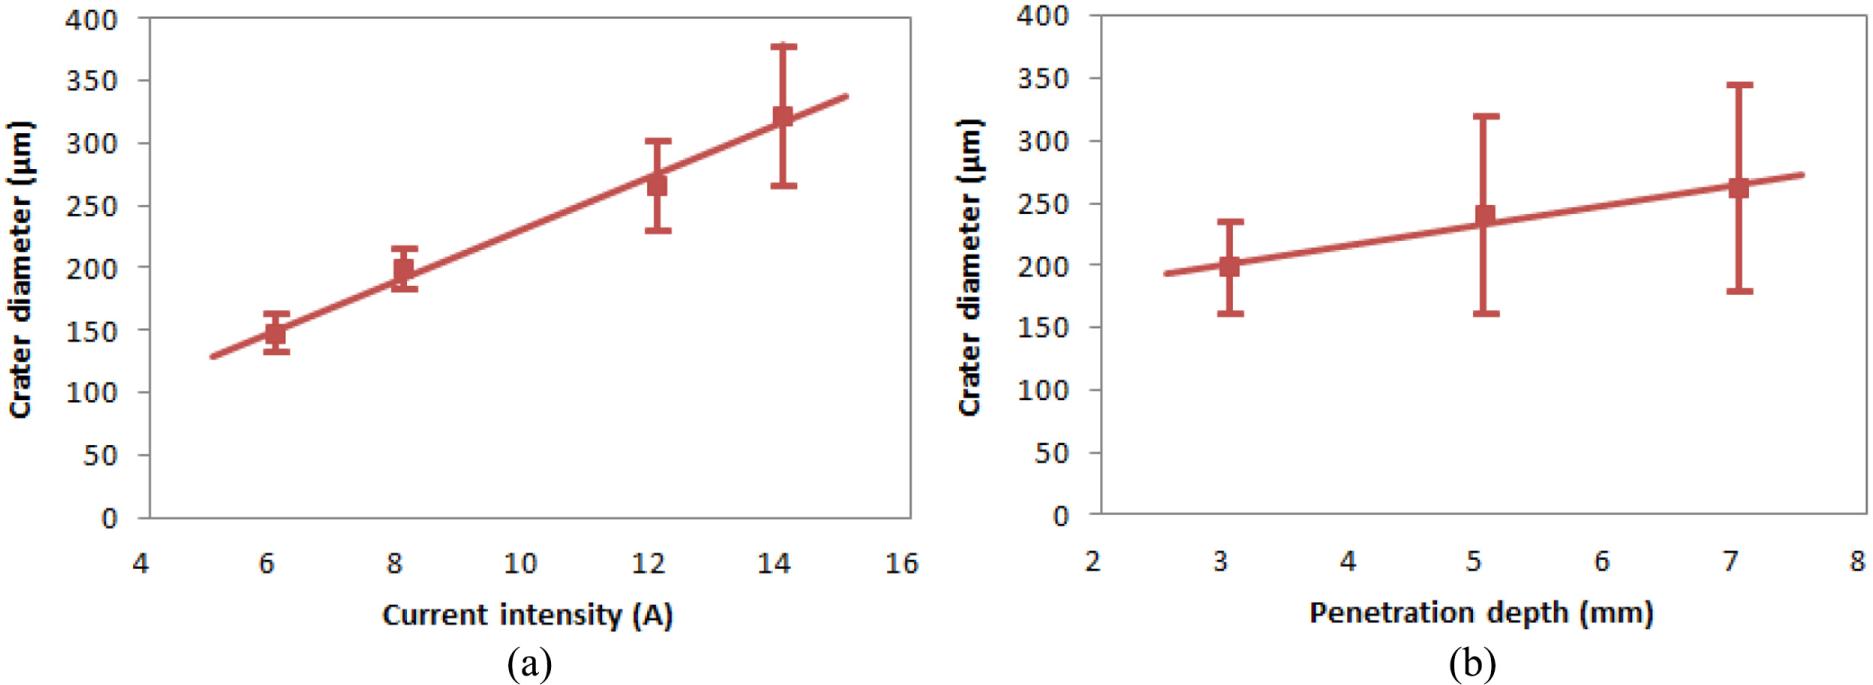
Crater diameter as a function of EDM process parameters: (a) current intensity and (b) penetration depth.
However, a slight linear increment was identified in crater diameter as a function of penetration depth, although it cannot be conclusive due to the great variability that is shown in this curve. It is also consistent with the conclusions obtained previously by the characterization of surface integrity based on roughness parameters or material profile slope. As indicated in the previous sections, it can be remarked that this relationship between the crater diameter and penetration depth is not so clear because it depends on other factors such as the degradation of cutting tool during the EDM process. Nevertheless, the tendency followed by the crater diameter as a function of penetration depth presents a greater physical meaning if compared to the variations determined in terms of surface roughness and material profile slope, since it is very reasonable that the additional cutting time associated with the increase in the penetration depth would provide a higher size of craters and so a worse surface quality.
As a consequence, the crater diameter can be adopted as a more reliable indicator of the surface morphology of machined part from the action of sparks during the die-sinking EDM. During the determination of the diameter of the craters, the peaks produced at the ends of the craters have not been considered, which is the cause of the discrepancies between the curves representing the size of craters and the graphs corresponding to the slope of the material profile or the roughness of the surface. Despite that, the crater diameter can be considered as a better indicator to characterize the surface quality in EDM processes, being also notable for this process, due to the fact that the surface finish of parts machined by EDM is characterized by craters on the surface. Therefore, the study of the size of these surface imperfections is identified as a key parameter of the process, being representative of it.
Conclusion
Non-conventional machining technologies, such as EDM, are frequently applied in different sectors including naval, aerospace, automotive or product manufacturing industries. For this reason, this work is dedicated to the analysis of surface integrity in die-sinking EDM as a function of some of the main process parameters, and three different methods that can serve to describe the surface quality are compared.
The correlations between the surface morphology achieved by the process and two of the most relevant parameters of the process, such as current intensity and penetration depth, have been discussed. A linear increase in the surface roughness, material profile slope and crater diameter as a function of current intensity was encountered, with good accordance between these three methods available for characterization of surface integrity in EDM processes.
The surface roughness exhibits a lower dependency on the current intensity when elevated values of penetration depth are assumed, but this problem does not affect the methodologies based on the material profile slope or crater diameter. The three methodologies that were considered in this work shown certain limitations to adopt conclusions about the tendency of surface finish as a function of penetration depth, although the crater diameter is the unique indicator that allows to predict a slight increment of surface irregularities as these process parameters are increased.
According to the results discussed in this work, the crater diameter can be assumed as a better indicator to characterize the surface morphology of parts subjected to die-sinking EDM, because it is able to describe the effect of the action of sparks during the material removal on the resultant surface quality.
Footnotes
Declaration of conflicting interests
The author(s) declared no potential conflicts of interest with respect to the research, authorship and/or publication of this article.
Funding
The author(s) received no financial support for the research, authorship and/or publication of this article.