
Abstract
Thermal contact resistance (TCR) is a key factor in thermal engineering which affects the thermal-structural design of precision instruments. To reveal the influence of turning morphology on the TCR between potassium dihydrogen phosphate (KDP) crystal and aluminum alloy, a novel simplified model considering two parameters of wavelength and slope is proposed. Meanwhile, the TCR of KDP crystal and aluminum alloy are experimentally investigated to validate this two-parameter model, where the effects of different wavelengths and slopes on Mises stress distribution, temperature distribution, heat flux and TCR can be analyzed. By incorporating the theory of plane turning, the TCR can be reduced by controlling the feed rate and cutting thickness under a certain roughness. This research provides a theoretical basis for the thermal-structural design of crystal modules and the turning of aluminum alloy.
Introduction
Potassium dihydrogen phosphate (KDP) crystal is a crucial component in optical systems and acts as a key tool of frequency conversion. 1 In the recent development of frequency conversion technology, KDP crystals with a large aperture and high uniformity of temperature distribution are required. For example, in inertial confinement fusion (ICF) devices, the dimensions of the crystal can reach 200 × 200 × 20 mm3; 2 however, the overall temperature difference of the crystal should be less than 0.1°C. 3 Crystal and metal materials are usually clamped together in optical devices, and the crystal temperature sensors controlled by the heating source is installed on the metal. 4 Therefore, the thermal contact resistance (TCR) between the KDP crystal and metal material directly determines the temperature distribution in the crystal and the thermal-structural design of precision instruments.
Many factors influence TCR, including contact pressure, 5 surface roughness, 6 interface temperature, 7 heat flow direction, 8 material properties 9 and load cycling. 10 Dai et al. 11 studied the TCR between Ti-6Al-4V and Ti-6Al-4V, and the results showed that TCR decreases with increasing loading stress and heating temperature. The TCR of Hastelloy C-267/Hastelloy C-267 and Hastelloy C-267/SS302 pairs was measured using a self-developed experimental device. 12 The results demonstrated that TCR decreases with the increasing contact pressure and interface temperature. Zheng et al. 13 investigated the TCR of SS304/SS304 and found that contact pressure was the most important factor affecting TCR. This conclusion was consistent with Tang’s et al. 14 work on the TCR of TC4/30CrMnSi. In addition to the above factors, the effects of vacuum 15 and atmospheric conditions, 16 and high 17 and low temperatures 18 on TCR have been extensively investigated.
Surface roughness and surface morphology are the main factors influencing the performance of TCR which have received close attention. Cui 6 established a mathematical model of surface morphology in lathe turning and end milling using multi-scale analysis. The results showed that, in addition to reducing surface roughness, ensuring surface smoothness during processing is an effective method to reduce TCR between two rough surfaces. Zhang et al. 19 investigated the TCR of five types of aluminum alloy materials through experimental measurement and detailed analysis, and the results indicated that due to the different morphology and contact randomness of the two surfaces during contact, TCR was not directly related to surface roughness. Murashov and Panin 20 adopted a fractal surface model with two-level roughness to simulate the contact heat transfer of a work hardening rough surface. Ren et al. 21 reconstructed the rough contact surface based on the measured morphology data of an actual rough surface, and simulated the TCR of 3D C/C-SiC needle composites.
The aforementioned studies mainly focused on metal/metal contact or metal/non-metal contact, while there are few publications on TCR between crystal/metal contacts. To fill this research gap in the effect of turning morphology on the TCR of KDP crystal/aluminum alloy (5A06) is explored. Firstly, a new two-parameter model is established considering the characteristics of turning morphology. Then, the TCR of KDP crystal and aluminum alloy processed by rough turning and finish turning are investigated experimentally to validate the model. Based on this two-parameter model, the Mises stress distribution, temperature distribution, heat flux and TCR under different wavelengths lw and slopes ks are analyzed. Finally, a specific method to reduce TCR by controlling feed rate and cutting thickness under a certain roughness is proposed.
Establishment and analysis of the two-parameter model
Establishment of the two-parameter model
KDP crystal is widely used in laser equipment, and the temperature distribution directly affects the frequency conversion efficiency when the non-critical phase matching method is used for laser frequency conversion. In the crystal module described in detail elsewhere, 22 the crystal is installed on the crystal frame (usually an aluminum alloy material) by a clamping device. The heating source is installed on the crystal frame, and the heat is transferred from the crystal frame to the crystal. Therefore, the TCR between the crystal and the crystal frame will directly affect the temperature values and distribution of the crystal.
The processing method of the crystal module will directly affect the TCR between crystal and metal. In Final Optical Assembly, aluminum alloy (5A06) with turning surface is generally selected as the crystal frame material, and KDP crystal whose surface is machined by the flying cutting method is chosen as the crystal material. The surface roughness of turning aluminum alloy is micron, while the surface roughness of crystal is less than 10 nm. It can be seen that the roughness of the KDP crystal is much less than that of the metal. Therefore, the roughness of the KDP crystal can be ignored and can be simplified as a plane in TCR analysis. The metal roughness plays a leading role in the interface of KDP and aluminum alloy, and needs to be carefully analyzed. The surface morphologies are measured using a Mitutoyo roughness measuring instrument (SV-3200 series, with measurement range/resolution: 800 μm/0.01 μm). The straight lines of the instrument in the test pass through the turning center of the turning surface. The surface roughness of aluminum alloy (5A06) are shown in Figure 1. The wavelength (lw) and slope (ks) of a relatively complete part of all are measured.
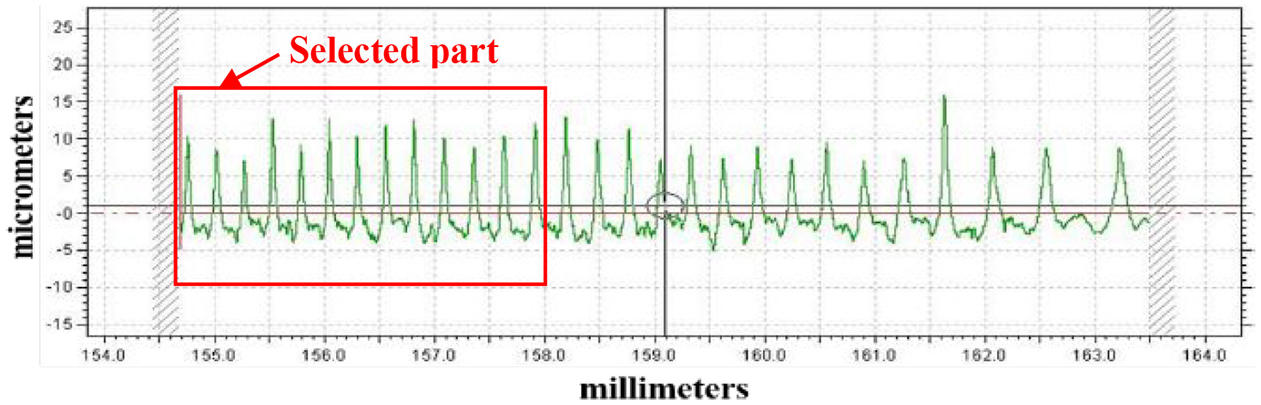
Surface morphology of aluminum alloy.
In the characterization of surface morphology, several surface parameters were proposed based on the surface profiles.23,24 The black solid line in Figure 2(a) is the actual profile of the turning surface. Among the factors that play a decisive role are: lw, ks, and element height (Zt), which is the sum of peak height and valley height.
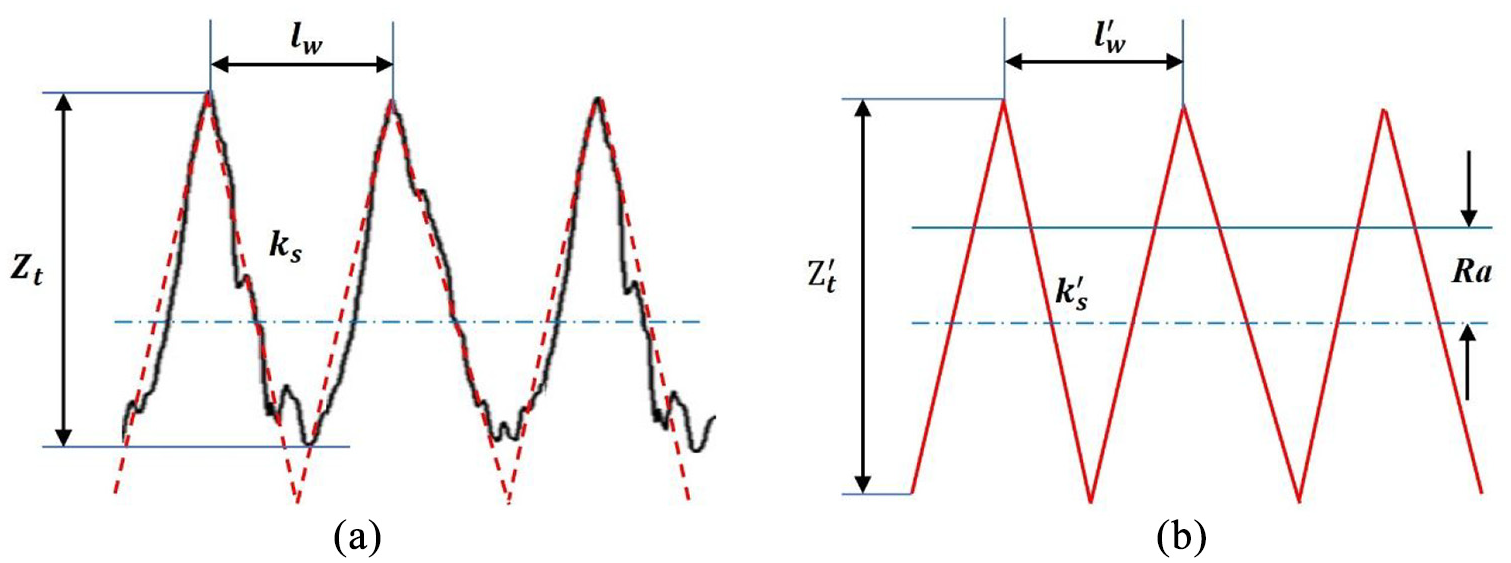
Profile simplification of surface roughness: (a) actual profile and (b) simplified profile.
The stress load in the KDP crystal module is usually less than 1.0 MPa. 4 Therefore, when the aluminum alloy with turning surface comes into contact with the KDP crystal, the peak of the aluminum alloy profile will contact the crystal surface, while the valley of the profile hardly contacts the crystal. On this basis, the model is simplified as shown in Figure 2(b) with the following assumptions:
the slopes on both sides of the peak are the same, that is to say, the simplified model satisfies the formula
the wavelengths before and after simplification are the same; that is,
the oblique lines on both sides of the peak intersect at a point, and the intersection point is the valley.
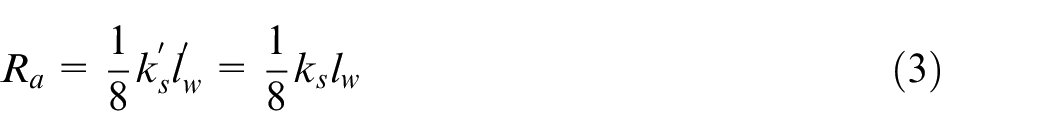
Due to the periodic performance of surface profiles, a greater linear relationship between

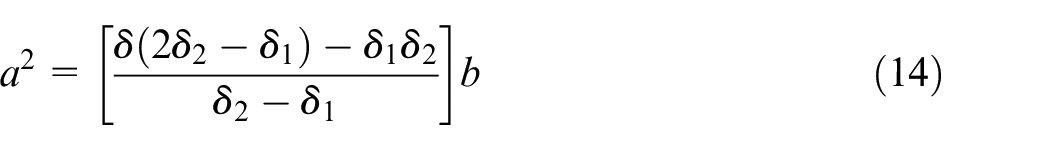
The simplified profile parameters satisfy equation (2):
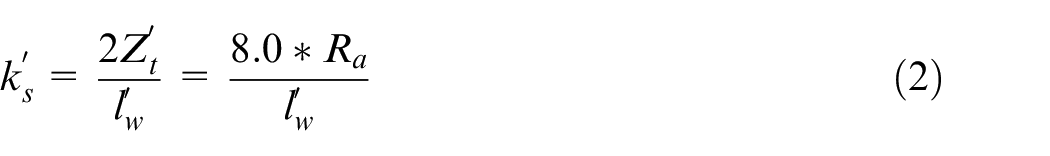
That is,
The two-parameter heat transfer model of TCR is shown in Figure 3, in which heat is transferred from aluminum alloy to KDP crystal, and Th is set as the heat source temperature, Tc is set as the cold source temperature, and P is labelled the applied pressure. At the interface, the KDP crystal is assumed to be planar. The aluminum alloy sample is machined by turning, and the machined morphology is characterized by
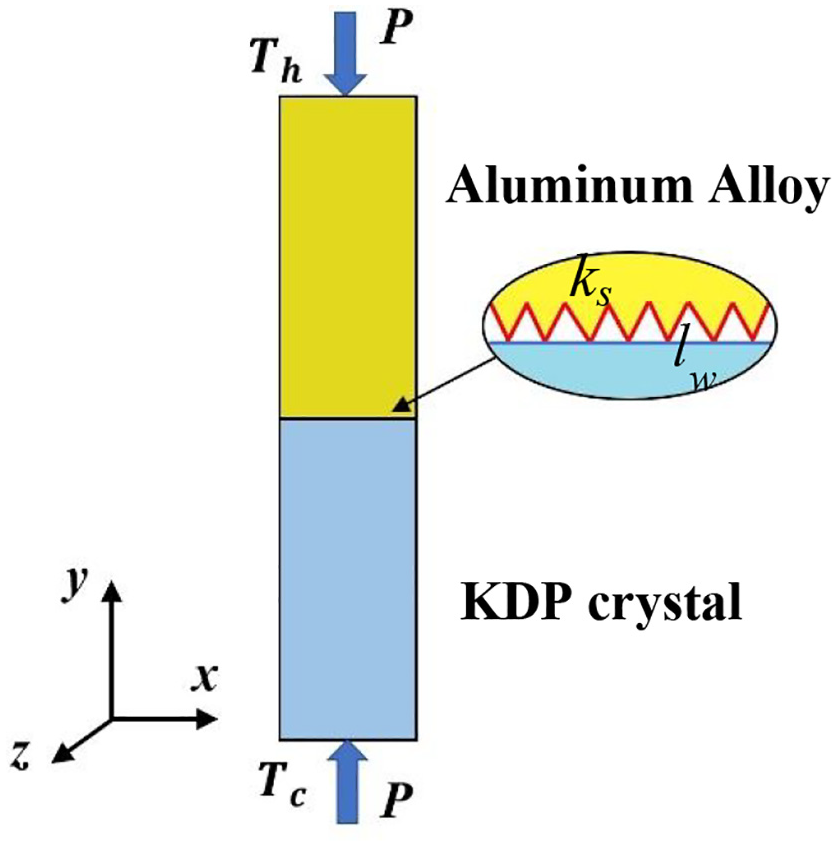
Two-parameter heat transfer model of TCR.
Stress-strain analysis
The crystal is soft and will deform under pressure P. In the heat transfer model, the deformation and stress of the KDP crystal can be solved according to elastic-plastic mechanics. The stress-strain relationship is shown in equation 4:
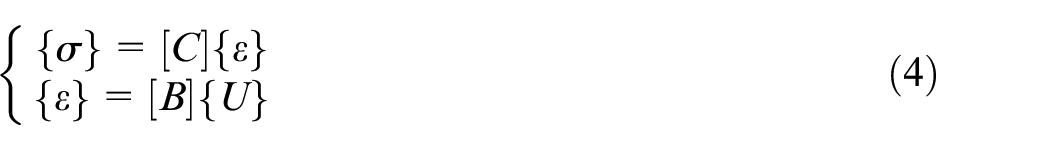
where
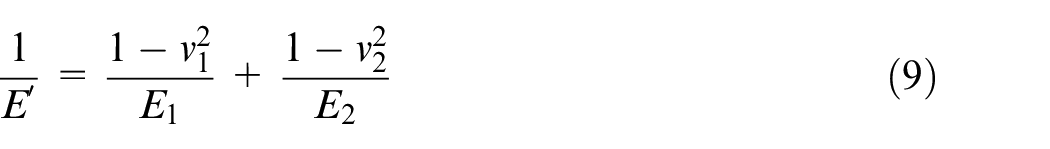
According to Hooke’s law, the stress-strain relationship of KDP crystal 4 is shown in formula 5:
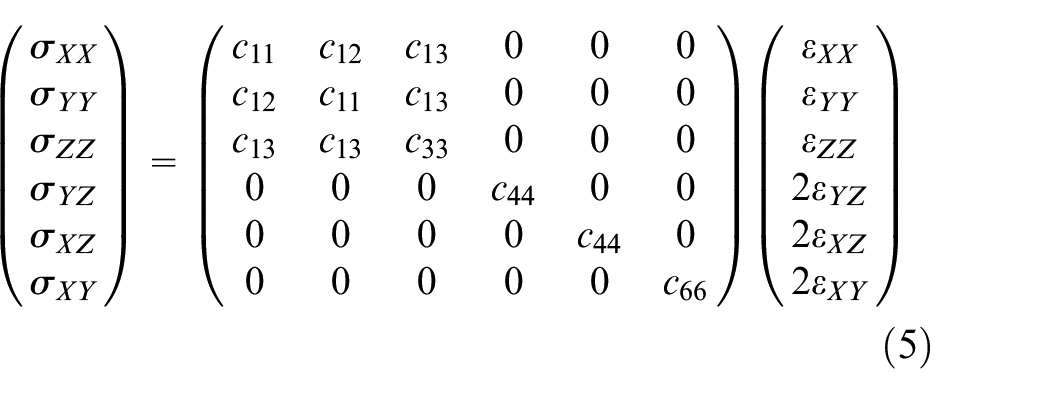
where the elastic strength is:
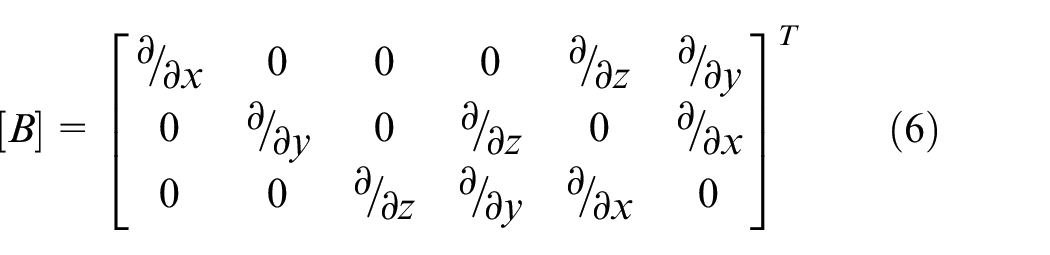
[B] is a geometric matrix, as shown in formula 6:
According to elastic-plastic theory, there are a maximum elastic deformation
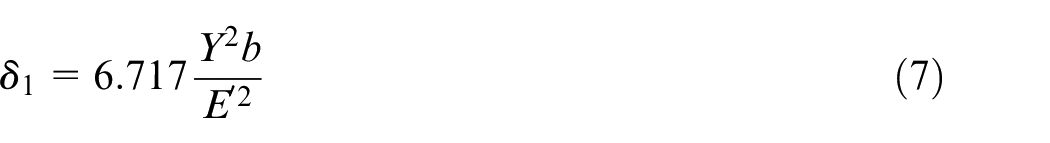
According to Hertz’s elastic theory, when the deformation is less than

where Y is the yield strength of the material (Pa),
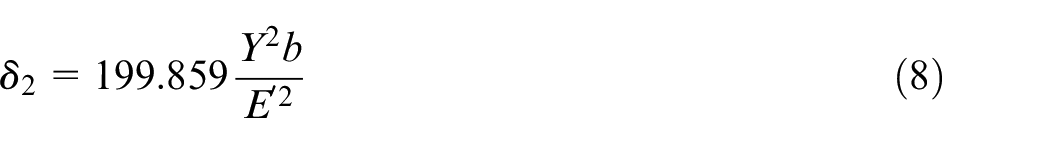
When the strain δ is larger than


where H is the microhardness of the KDP material (Pa).
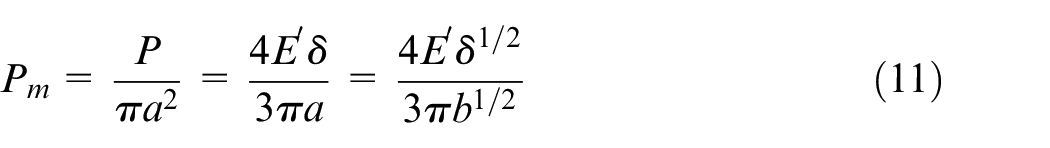
When the deformation δ1 < δ < δ2, elastic-plastic deformation occurs:
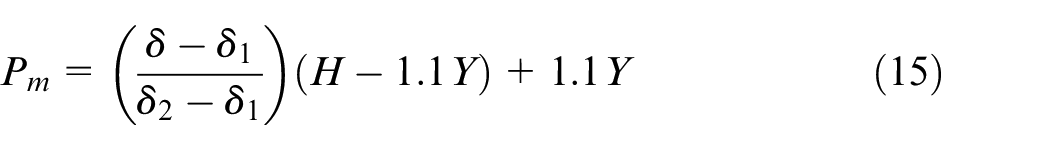
The contact state of the KDP crystal can be obtained by the above formula.
Thermal analysis
The heat flux of KDP crystal is different from that of aluminum alloy under different deformation conditions. The three-dimensional heat conduction differential equation is as follows:
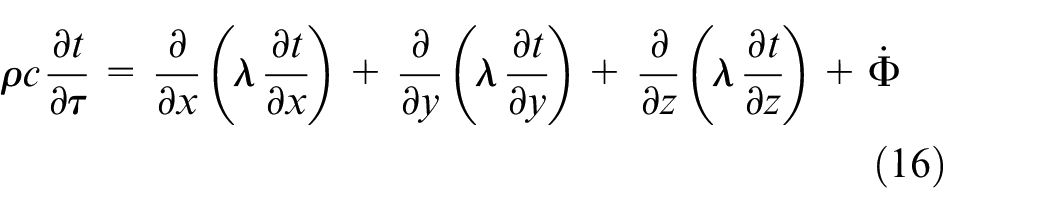
where
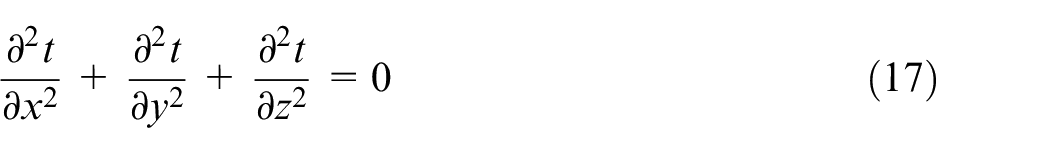
In the aluminum alloy (5A06), three-dimensional steady-state heat transfer occurs, and λ is the isotropic thermal conductivity. Therefore, the heat transfer equation is as follows:
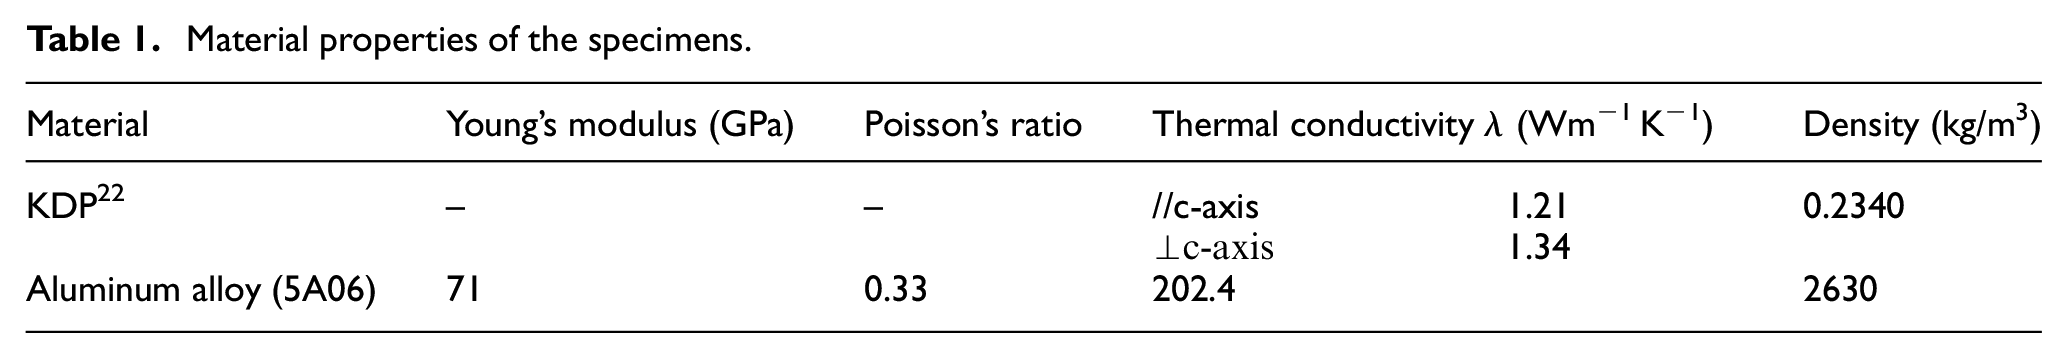
The anisotropy of the thermal conductivity of the KDP crystal is shown in Table 1, and so the heat transfer equation satisfies formula 18:
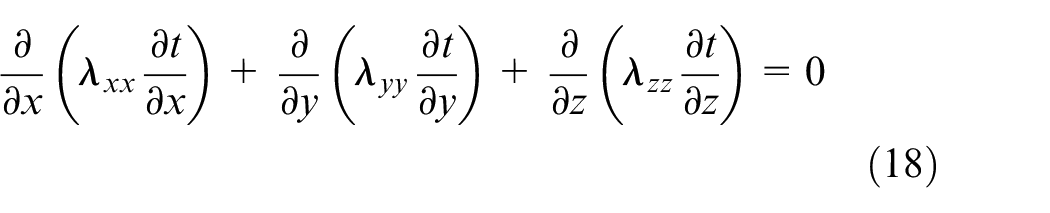
where
Material properties of the specimens.
The stress, deformation and temperature distribution at the interface can be obtained using formulae 1–18. However, calculation using the numerical calculation method is difficult. Instead, ANSYS software is used in this paper to simulate the crystal deformation and temperature distribution.
Numerical simulation and TCR calculation
A three-dimensional model is established using ANSYS software to analyze the TCR between the KDP crystal and aluminum alloy (5A06). In order to ensure that the simulated profile of the interface in the model is the same as the actual machining profile, the metal surface profile is established according to the actual measurement parameters (lw, ks). The actual size of the sample is 60 × 10 × 10 mm3, and the micro-morphology size of the end face of the sample at micron scale, which will cause difficulties in calculation. Therefore, a size of 2.2 × 2.2 × 3 mm3 is selected to reconstruct the rough surface, as shown in Figure 4. The roughness of the crystal on the contact surface is small (at nanometre scale) and can be ignored. Therefore, it is assumed that the lower surface of the KDP crystal is flat, as shown in Figure 4(a). According to the actual measurement parameters (lw, ks), the annular profile is set on the contact surface of aluminum alloy (5A06), as shown in Figure 4(b). During the turning process, the peak of the turning surface profile at the middle position of the ring is lower than that at other positions, due to the details of the machining, 25 as shown in point A of Figure 4(c). Hence, the peak of point A is half of other peaks in the process of model establishment. After the model is established, the two samples are moved to ensure that the lower surface of the crystal is in contact with the peak of the upper surface profile of the aluminum alloy, as shown in Figure 4(d). There is no air in the gap between the KDP crystal and aluminum alloy. Tetrahedrons are used to divide the model, as shown in Figure 4(e). In order to ensure the accuracy of calculations, the contact surface is divided by a refined mesh, as shown in Figure 4(f), and the correlation of the contact part is set to 100. Before the simulation, the mesh independence should be verified.
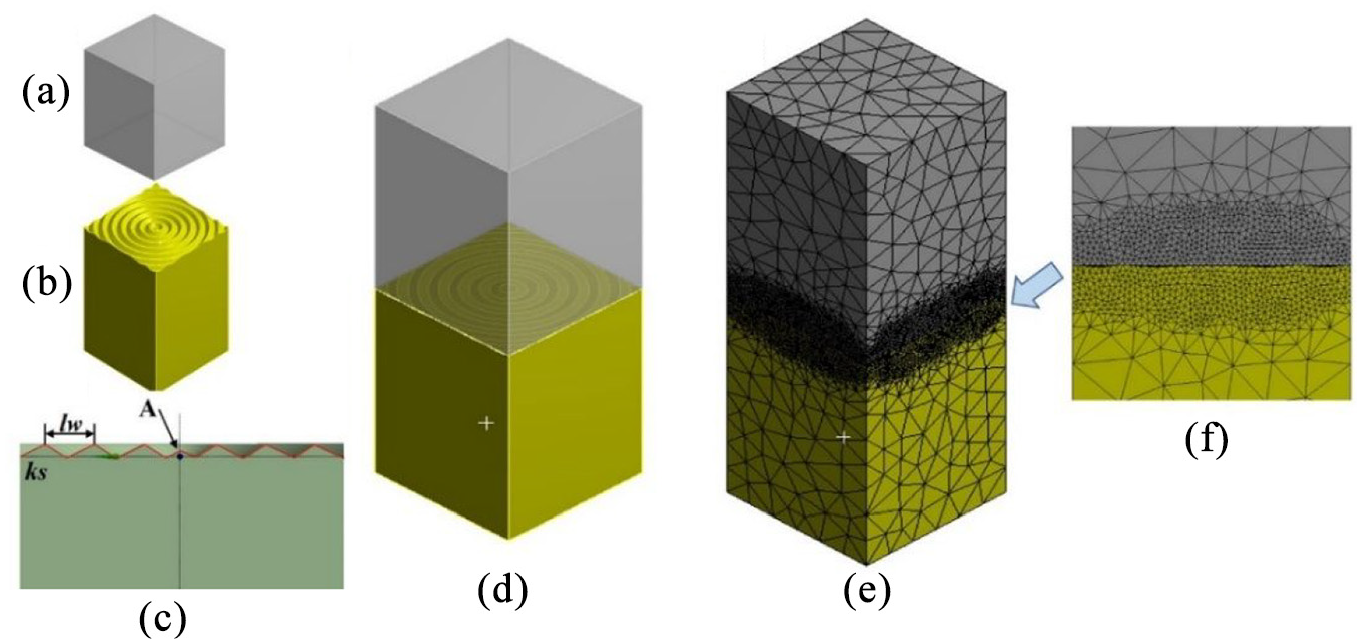
Establishment of finite element model: (a) KDP crystal, (b) aluminum alloy, (c) profile model, (d) contact model, (e) grid model, and (f) grid distribution at contact interface.
Boundary conditions: In terms of force and displacement boundary conditions, the loading stress has a great influence on the TCR. The upper surface of the crystal is fixed and the stress is applied on the lower surface of the metal. The direction of the stress is from the aluminum alloy to the KDP crystal along the axis direction. Regarding thermal boundary conditions, the heat source temperature Th is applied to the lower surface of the aluminum alloy, and the cold source Tc is applied to the upper surface of the crystal. In this paper, the influence of turning morphology on the TCR is mainly considered. Therefore, the temperatures of the heat source and cold source are unified. The cold source temperature is set at 20°C and the heat source temperature at 80°C. Since the thermal analysis is based on one-dimensional steady-state heat transfer, the lateral walls of the aluminum alloy and KDP crystal should be adiabatic; that is, q = 0. The parameters of the crystal and aluminum alloy are shown in Table 1.
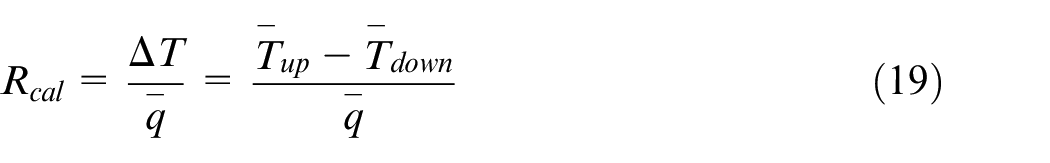
The average temperature (
Experimental verification method of the two-parameter model
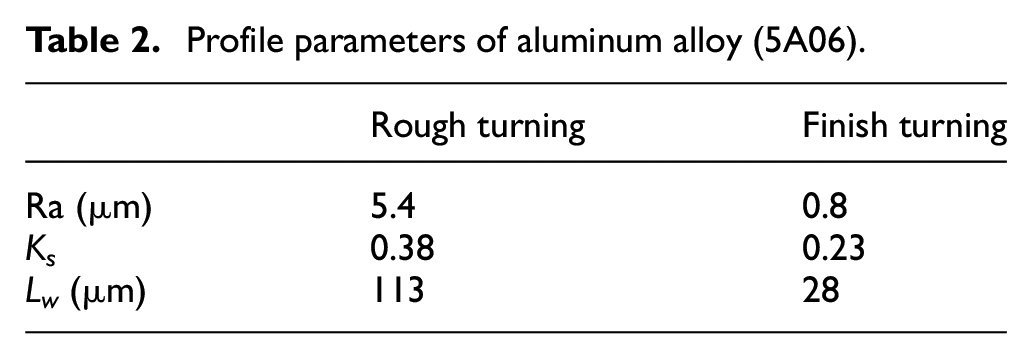
In order to verify the correctness of the simulation results for TCR based on this two-parameter model, a TCR experimental device is built, which is carried out in vacuum. In this experiment, the dimensions of the KDP crystal and aluminum alloy (5A06) samples are all 60 × 10 × 10 mm3 cubes, as shown in Figure 5. The axis direction of the KDP crystal is parallel to the c-axis, the end face is processed by flying cutting, and the roughness is less than 10 nm. Rough turning and finish turning are applied to the end turning of the aluminum alloy specimens. The surface morphologies are measured using a Mitutoyo roughness measuring instrument. The wavelength and slope are calculated from the test results. The measured surface profile parameters are shown in Table 2.
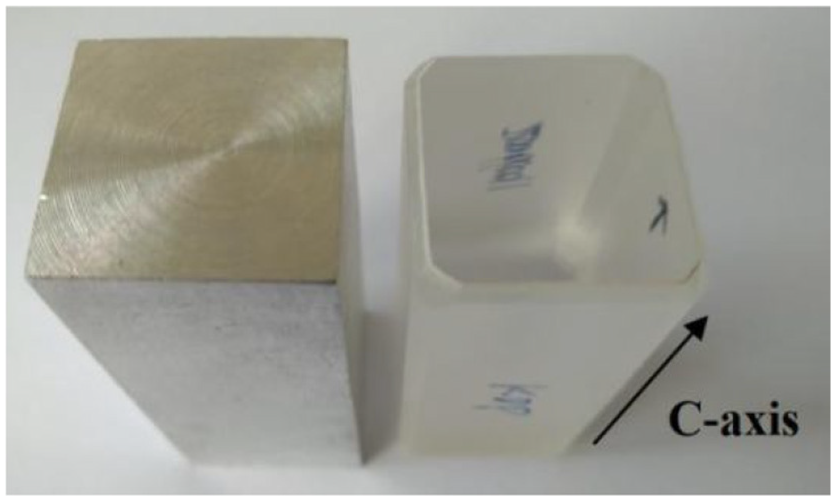
Experimental specimens: (left) aluminum alloy; (right) KDP crystal.
Profile parameters of aluminum alloy (5A06).
In order to accurately measure the TCR between the interfaces and to avoid the influence of convection heat dissipation on the experimental results, TCR experiments are carried out in a vacuum chamber. In the experiment, the spring module and pressure sensor are used to control the stress, and the temperature loading module is used to control the temperature of the cold and heat sources.
A schematic diagram of the TCR experiment is shown in Figure 6. The TCR experimental device consists of a sealed chamber, compression plate, cold source module, spring module, heating module, temperature and pressure sensor, activity board, controller, driving device, fixed plate, heat source module, and experimental sample. The vacuum chamber is welded with aluminum alloy plate, and a vacuum suction port is designed on the cavity, which is connected to the vacuum machine during operation. Three vacuum plugs are installed on the other side of the cavity, which are mainly used to connect the power supply and sensor and to prevent air leakage. The experimental sample is placed horizontally on the adiabatic bench. The cold source module and heat source module are installed on both sides of the experimental sample, and proportional-integral-derivative (PID) control is adopted. A clamping plate is arranged on the left-hand side of the cold source module. The clamping plate is connected to the movable plate through the spring module, and a guide rod is arranged on the clamping plate to connect to the movable plate. During the experiment, the control system controls the rotation of the lead screw to drive the movable plate, and then applies the force load through the elongation of the spring. The pressure sensor between the heat source module and the fixed plate is fed back to the controller for the accurate control of the pressure. During operation, the air pressure in the TCR device is kept below 10−2 Pa. Both the cold source and heat source modules adopt PID control, and the temperature fluctuation range of the heat source is less than 0.1°C. In this experiment, STT-F series temperature sensors are uniformly distributed on the aluminum alloy and KDP crystal specimen to collect temperature data. The STT-F series temperature sensors are all PT100, and the resistance change rate is 0.3851 Ω/°C. The multi-channel temperature detector is used to collect temperature measurements, and the results are recorded every 5 min. When the temperature remains unchanged for 10 min, the system is considered to be stable with respect to heat transfer.
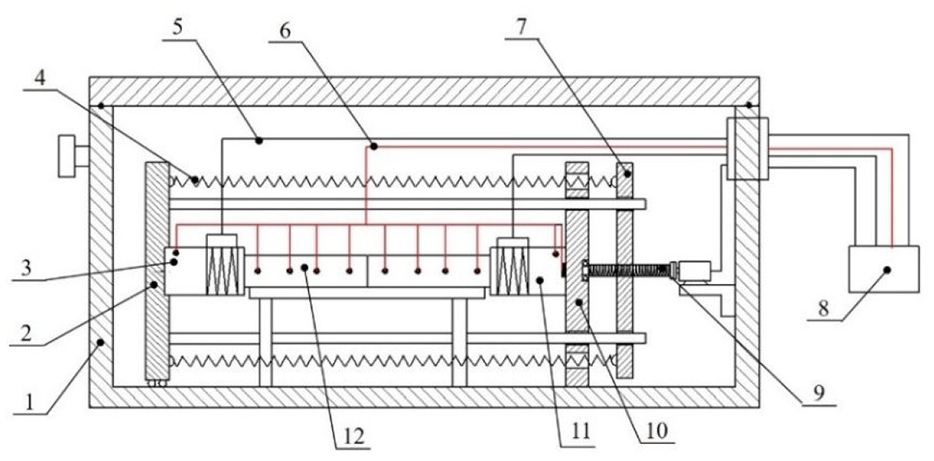
TCR experimental device diagram: 1. sealed chamber, 2. compression plate, 3. cold source module, 4. spring module, 5. heating module, 6. temperature and pressure sensor, 7. activity board, 8. controller, 9. driving device, 10. fixed plate, 11. heat source module, and 12. experimental sample.
During the experiment, four temperature sensors were arranged on each experimental sample, as shown in Figure 7. The distance between the sensors is m, and the distance between sensors 4 and 5 is denoted as n, and the temperature value is recorded by the patch temperature sensor.
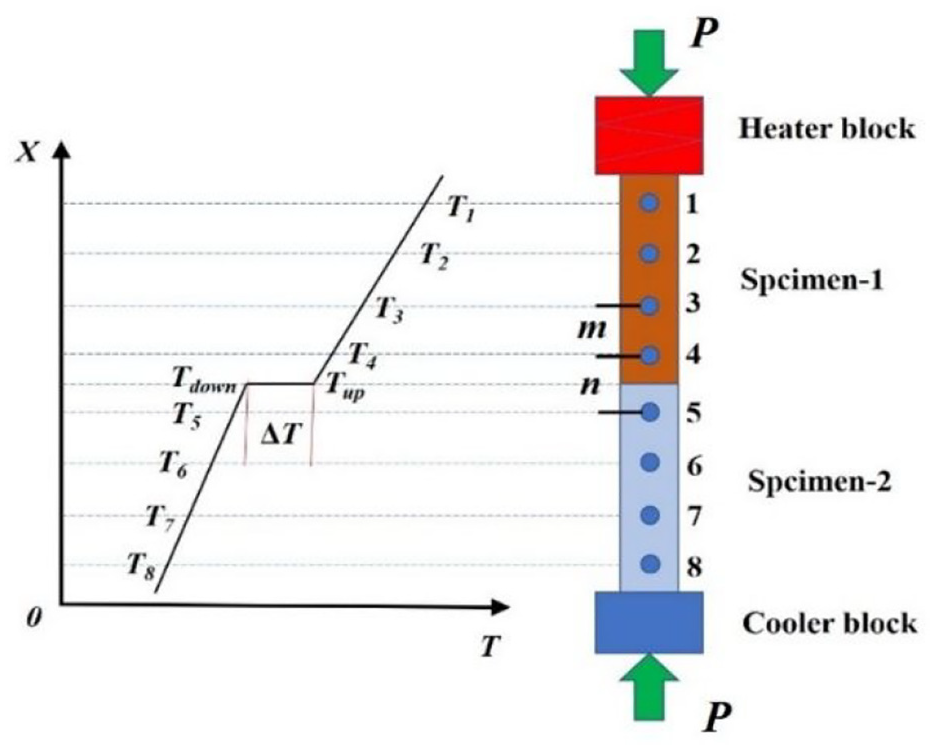
Measurement schematic diagram.
The TCR obtained in the experiment
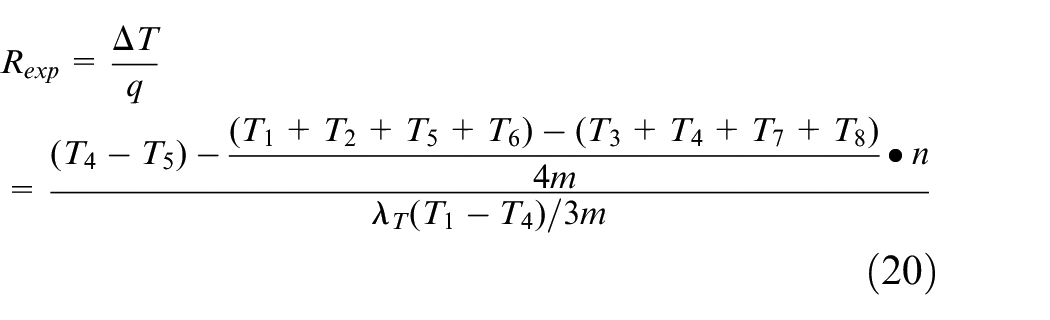
in which, λT is the thermal conductivity of the aluminum alloy (5A06).
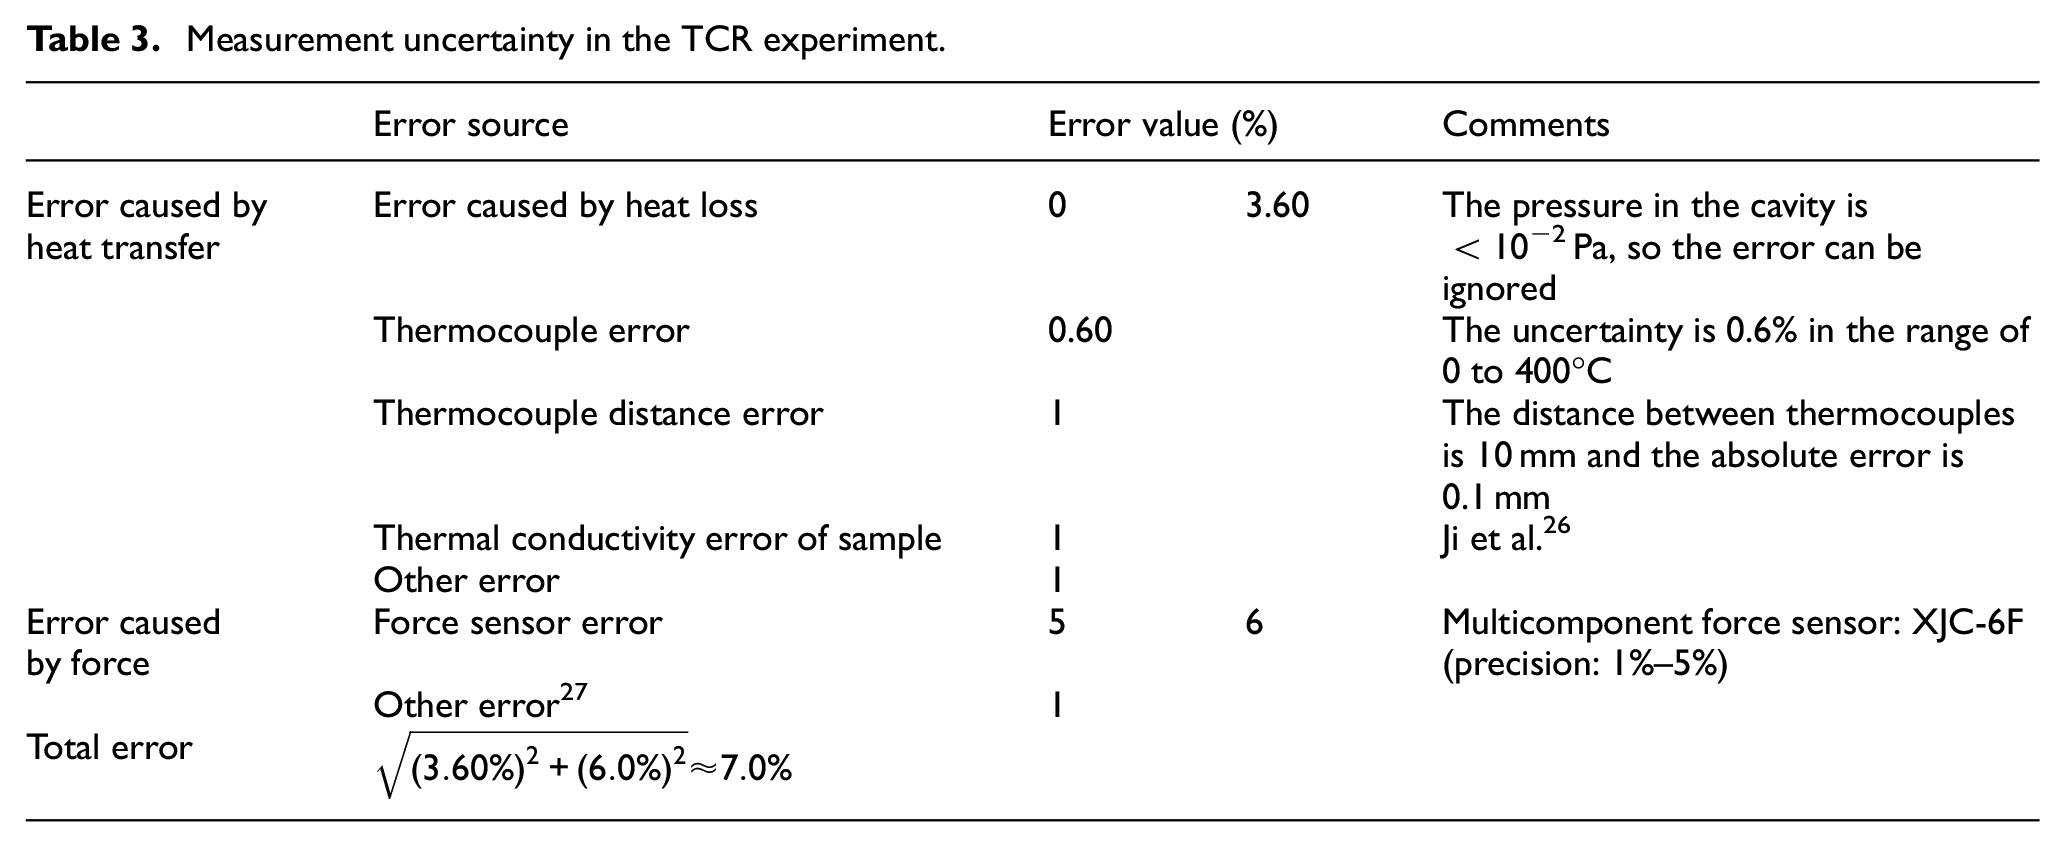
According to the law of error propagation, error in TCR measurements generally stems from radial heat flow, contact resistance with source and sink, measurement deviation and heat loss caused by steady state failure. The effect of heat loss on TCR is negligible, since the KDP crystal and aluminum alloy (5A06) usually work in a sealed cavity, and the gas pressure in the cavity is less than 10−2 Pa. Therefore, the uncertainty of the measurement system is mainly determined by the accuracy of the thermocouple, the distance from the specimen and the magnitude of contact pressure. After calculation, uncertainty in this TCR experiment is about 7.0%, with details shown in Table 3.
Measurement uncertainty in the TCR experiment.
Results and discussions
In this paper, the influence of the wavelength and slope of turning parameters on TCR are the main focus, without consideration given to other factors. Therefore, Th, Tc, and P are set as uniform values at 80°C, 20°C and 1.0 MPa respectively. The heat flow direction is uniformly set to transfer from the aluminum alloy to KDP crystal. The model is verified to be grid-independent before TCR simulation, because the grid density has a great influence on the simulation results, which are meaningful only when the influence of the increase in grid number slightly increases. The specific method is to refine the grid at the contact surface by different degrees, and to compare the simulation results after refinement. It is considered that the calculation results are grid independent only when the relative deviation of the final simulation results is less than 5%.
Section 4.1 compares the simulation results with the experimental measurements to verify the correctness of the simplified model; section 4.2 shows the influence of lw on TCR under the same roughness Ra; section 4.3 analyzes the effect of different values of ks on TCR under the same lw.
Validation of the two-parameter model
In order to verify the correctness of the two-parameter model, TCR experiments are carried out on aluminum alloy samples under rough turning and finish turning, and the results are compared with simulation data. The sample parameters are shown in Table 2. In the experiment and simulation, 0.25, 0.5, 0.75, and 1.0 MPa are applied to the sample.
At the end of the experiment, the surface roughness of the aluminum alloy (5A06) and KDP crystal sample are tested. Because the crystal material is soft, the surface morphology of the crystal changes obviously after contact. However, there is no obvious change in the metal material. It is found that the roughness change is 0 μm through the roughness detection. The micro surface morphologies of the KDP crystal under different loads are shown in Figure 8, which are measured by the White light interferometer. Figure 8(a) shows the morphology of the crystal surface in the initial state, where the peak and valley are both less than 10 nm and evenly distributed. Figure 8(b) shows the micro-surface morphology of the crystal at a pressure of 0.25 MPa, in which wave peaks and valleys are shown, and the maximum peak value increases to 60 nm. Figure 8(c) shows the micro-morphology of the KDP crystal when the pressure increases to 1.0 MPa. Obvious indentation distribution can be seen in the figure, which is mainly due to the plastic deformation of the KDP crystal after pressure unloading.
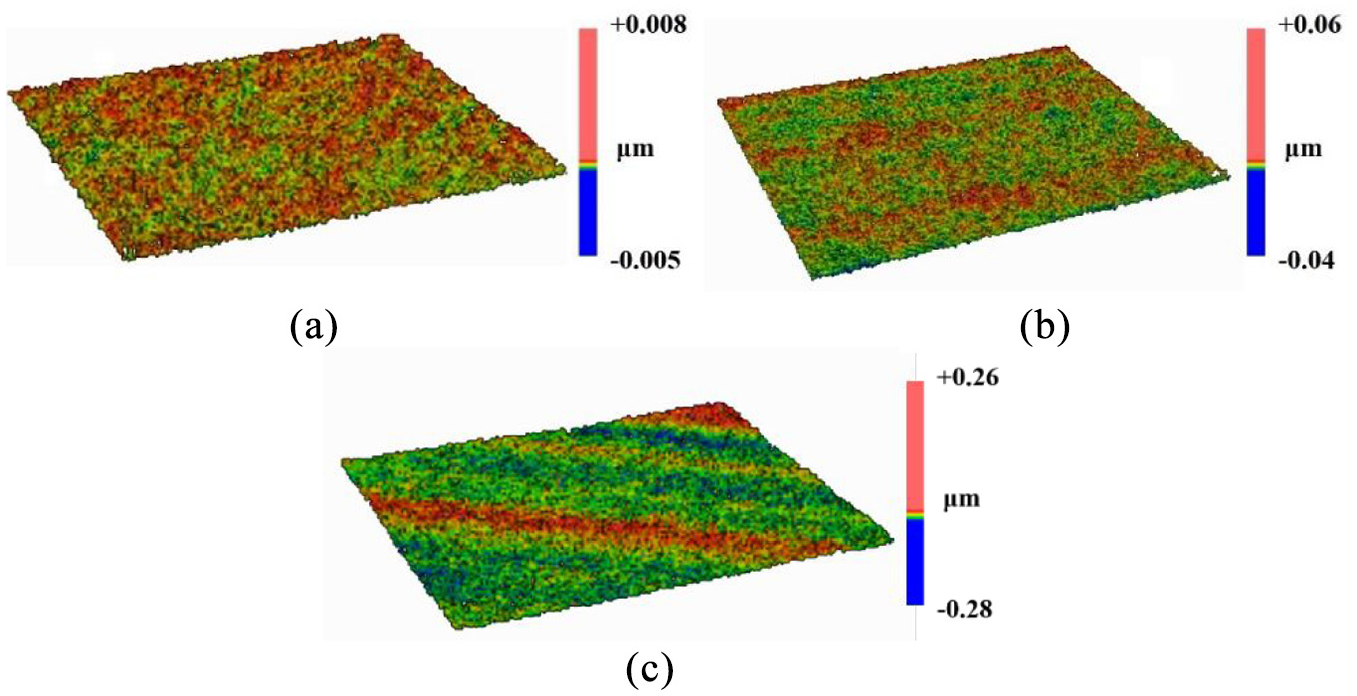
Morphology of KDP crystal under different pressures: (a) initial state, (b) after p = 0.25 MPa, and (c) after p = 1.0 MPa.
The comparison between the experimental data and simulation data of TCR is shown in Figure 9. Figure 9(a) indicates the relationship between TCR and contact pressure between the KDP crystal and aluminum alloy (5A06) when rough turning is adopted. Hence, the TCR decreases with increasing pressure, and the change trends in the experimental and simulation data are the same. When the pressure increases from 0.25 to 1.0 MPa, the experimental data decreased from 6.78 × 10⁻⁵ Km2 W−1 to 3.98 × 10⁻⁵ Km2 W−1, and the theoretical data decreased from 6.22 × 10⁻⁵ Km2 W−1 to 3.82 × 10⁻⁵ Km2 W−1. Figure 9(b) shows the relationship between TCR and pressure between the KDP crystal and aluminum alloy (5A06) when the aluminum alloy is processed by finish turning. This figure shows that, when the pressure increases from 0.25 to 1.0 MPa, the experimental data decreases from 10.40 × 10⁻⁷ Km2 W−1 to 2.90 × 10⁻⁷ Km2 W−1, and the theoretical data decreases from 10.13 × 10⁻⁷ Km2 W−1 to 2.65 × 10⁻⁷ Km2 W−1. Figure 9 shows that the experimental and theoretical data are in the same order of magnitude, and the relative errors are 6.60% and 6.04%.
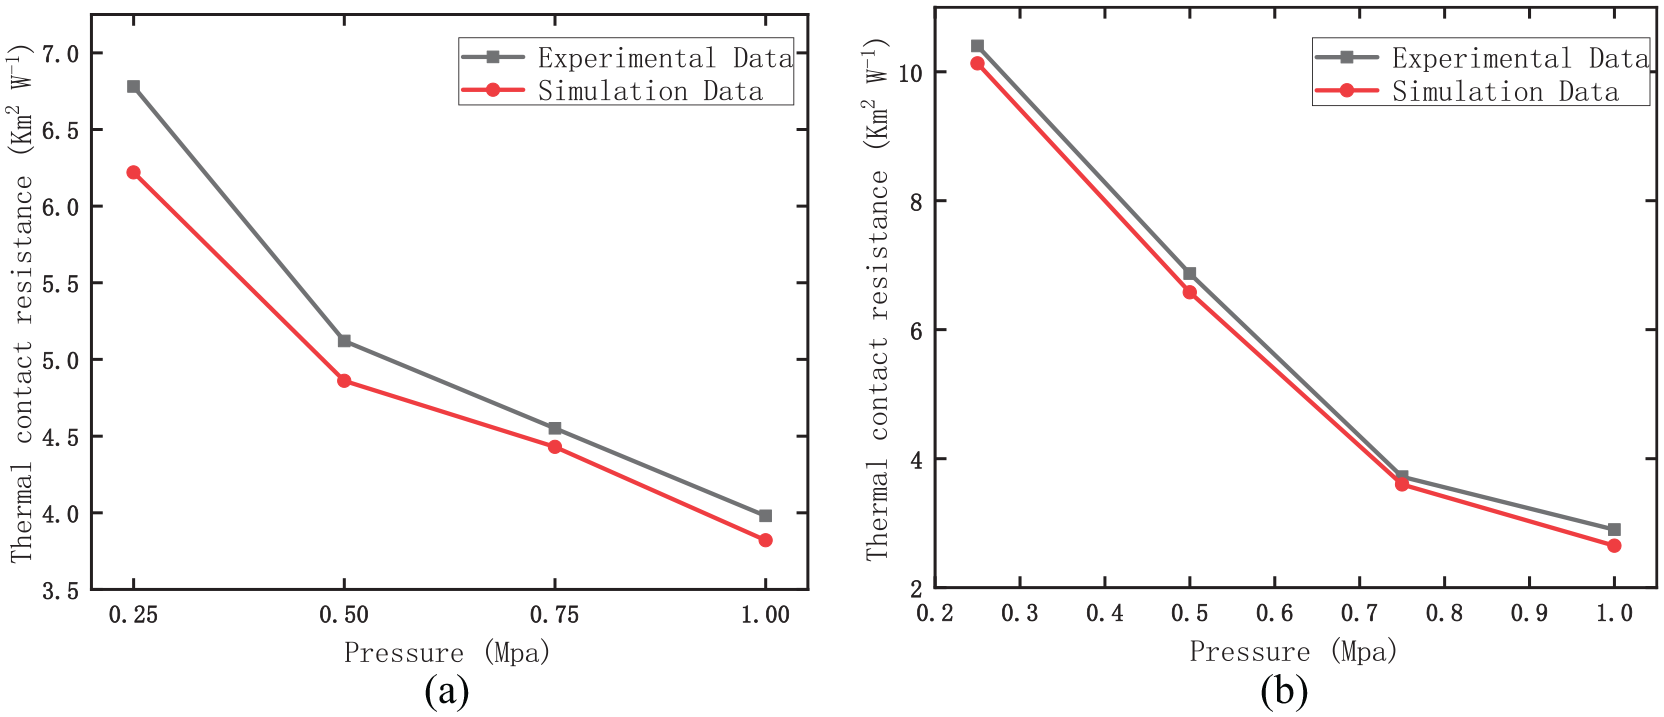
Comparison between experimental and simulation data for TCR: (a) rough turning (ks = 0.38, Ra = 5.4) and (b) finish turning (ks = 0.23, Ra = 0.8).
Figure 9 shows that the error between the simulation and experimental data is very small, which is mainly caused by model simplification error and measurement error. Through the above theoretical simulation and experimental verification, it is concluded that the two parameters lw and ks can be used to simplify the model when the stress load is very small, and accurate calculation results can be obtained.
TCR at different wavelengths of turning profile
In order to reveal the influence of wavelength on the TCR between the KDP crystal and aluminum alloy (5A06) using this two-parameter model, the turning surfaces with Ra values of 0.4 and 4.0 μm are simulated and analyzed. Four different wavelengths (280, 240, 200, and 160 μm) are selected for each Ra, and the Mises stress, temperature distribution, average heat flux and TCR are analyzed respectively.
Mises stress distribution
Mises stress distribution is that when the equivalent stress and strain at a certain point of the stress-strain state reach a certain value related to the stress-strain state, the material yields; in other words, when the material is in the plastic state, the equivalent stress is always a fixed value. Figure 10 shows the Mises stress distribution of the turning surface with values of roughness, Ra, of 0.4 and 4.0 μm and wavelength, lw, of 280 and 160 μm, where the left-hand side of each picture shows the stress distribution of the KDP crystal and the right-hand side that of the aluminum alloy (5A06). Figure 10 clearly shows that when the wave length is the same, the stress distribution of Ra at 0.4 μm is more uniform than that of Ra at 4.0 μm, and the average stress value is also smaller. When Ra is 0.4 μm, the lowest stress point of KDP crystal is located at the edge of the crystal, while the stress distribution of metal is more uniform. When lw is 280 μm, the stress difference in the whole contact surface between aluminum alloy and KDP crystal is 1.2 × 10⁵ Pa. when lw is 160 μm, the stress difference is 1.5 × 10⁵ Pa. According to the formula 3, the ks value at the same wavelength decreases with decreasing Ra, which will directly lead to an increase the actual contact area and more uniform stress. Compared with Figure 10(c) and (d), the stress distribution of the KDP crystal and aluminum alloy (5A06) is circular, and the maximum contact stress is located at the contact point between the crystal surface and aluminum alloy peak, and the stress in the non-contact area is small. For the same value of roughness, Ra, the longer the wavelength lw, the larger the contact area, and the greater the stress difference. For the same roughness, Ra, the stress difference increases with increasing wavelength lw.
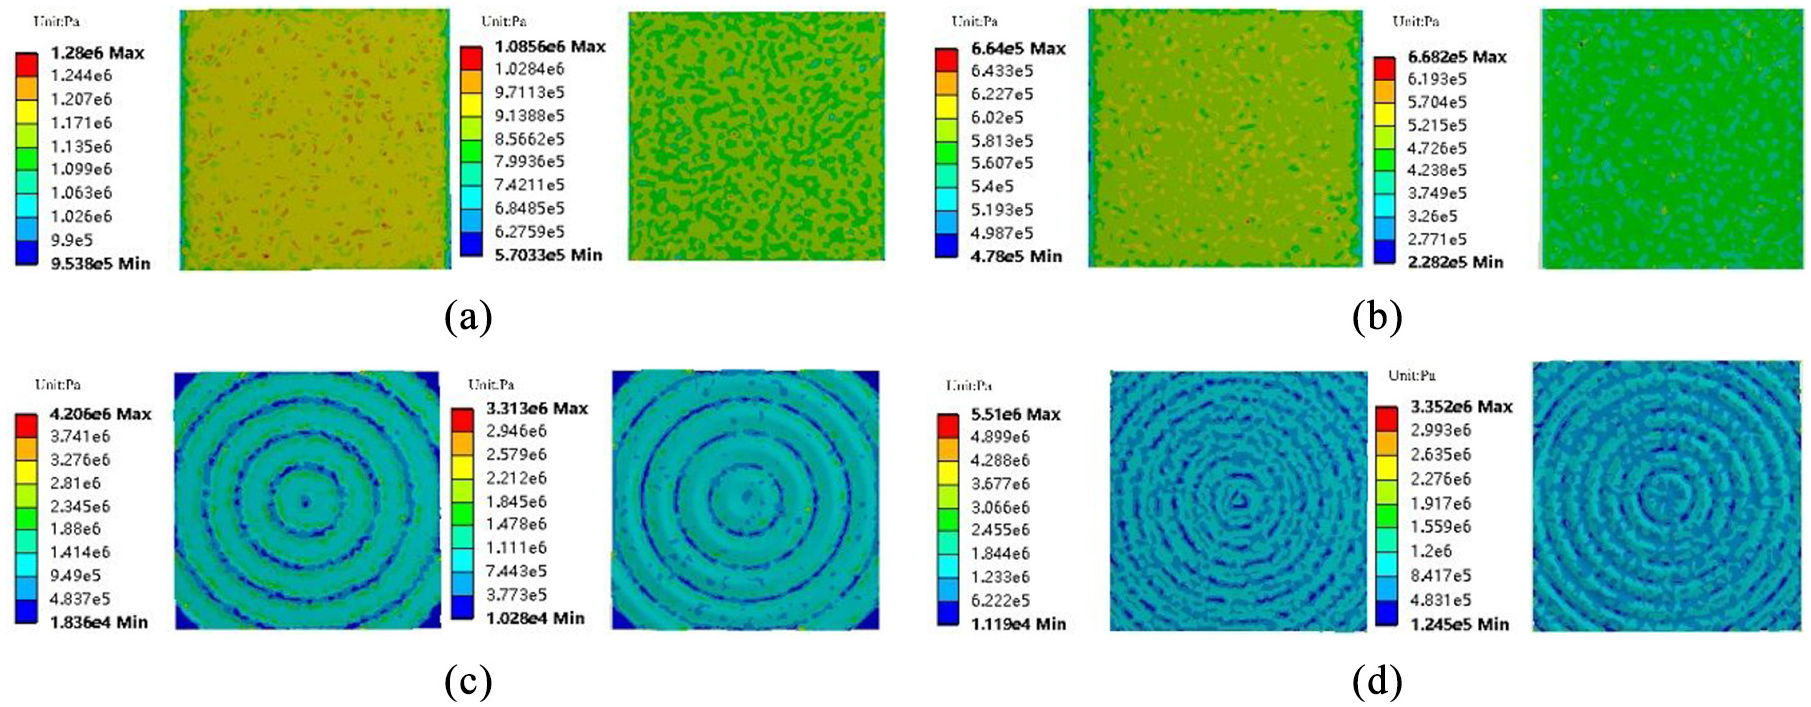
Mises stress distribution (left: KDP; right: aluminum alloy): (a) Ra = 0.4 μm, lw = 280 μm, (b) Ra = 0.4 μm, lw = 160 μm, (c) Ra = 4.0 μm, lw = 280 μm, and (d) Ra = 4.0 μm, lw = 160 μm.
Temperature distribution of the contact interfaces
There is a direct relationship between the TCR and KDP/Al alloy interface temperature difference. Figure 11 shows the effect of wavelength lw on the temperature distribution of the KDP crystal and aluminum alloy. The conclusions are shown as follows:
The temperature distributions of the samples are all circular. In the KDP crystal, the temperature at the contact position with the aluminum alloy peak is higher than that in the non-contact area. On the other hand, the temperature of the contact position of the aluminum alloy is lower than that of the non-contact position. This is because heat transfer is carried out under vacuum conditions, and heat conduction is the main mode of heat transfer. Heat is transferred by heat conduction in the contact area, but no heat transfer occurs in the non-contact area.
At the same roughness, the average temperature of the KDP crystal increases as the wavelength lw decreases. This is because with a smaller wavelength lw, there are more peaks per unit area. As a result, the actual contact area, heat flux density and average temperature increase.
As shown in Figure 11(e) to (h), due to heat conduction the highest temperature is located at the valley of the sample edge and the lowest temperature is at the peak. In KDP crystals, the lowest temperature point is located at the non-contact position of the sample edge, and the highest temperature point is located in the contact position with the peak of the aluminum alloy.
Figure 11 also shows that the temperature of the KDP crystal increases with the increasing roughness at the same wavelength, and the surface temperature difference between the KDP crystal and aluminum alloy with a roughness of 0.4 μm is far less than that at 4.0 μm. This is mainly because the actual contact area increases with decreasing roughness under the same stress.
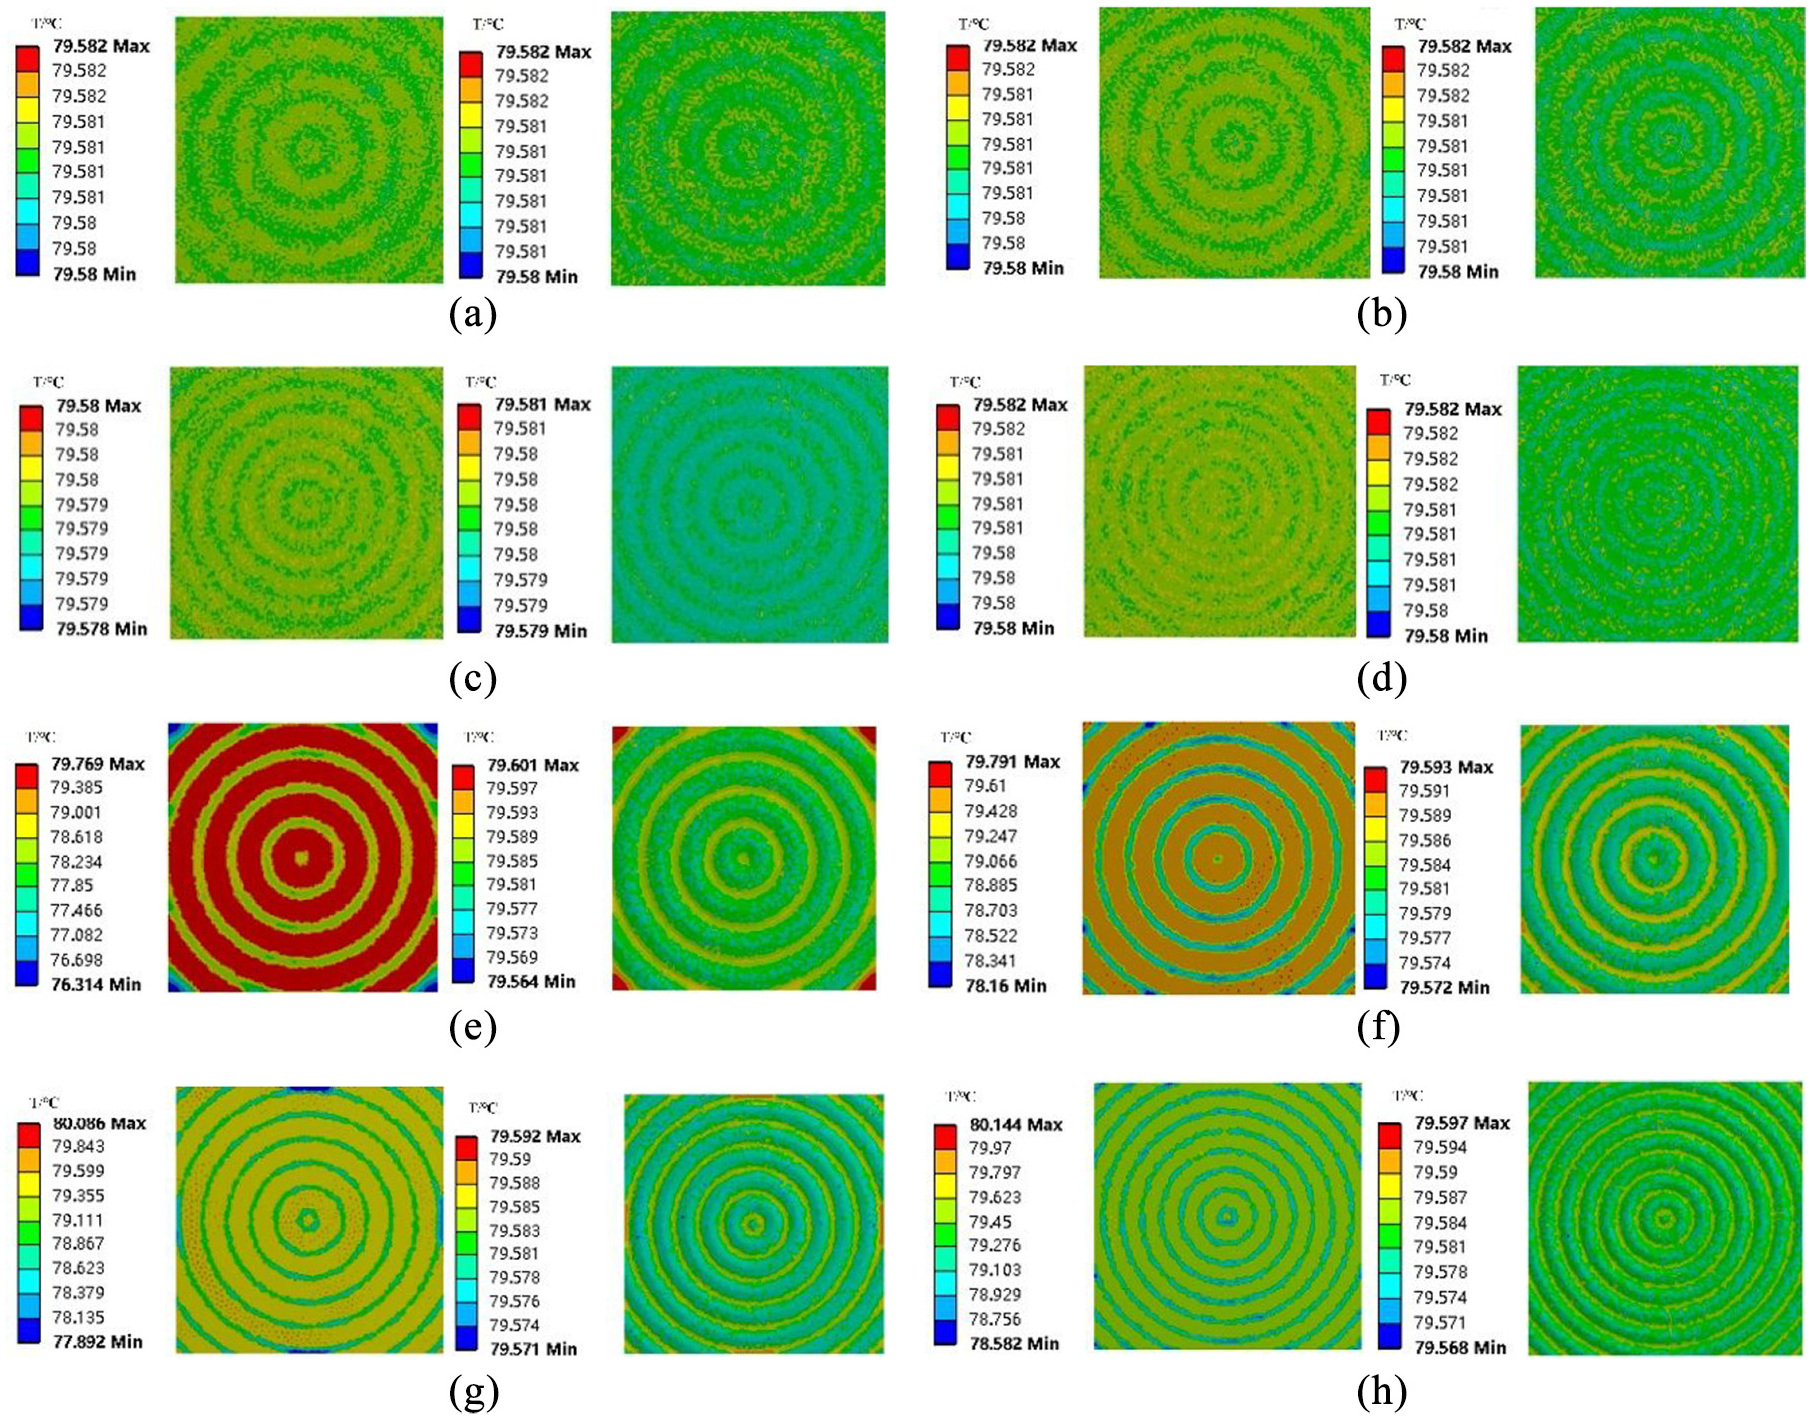
Temperature distribution of KDP crystal (left) and aluminum alloy (right): (a) Ra = 0.4 μm, lw = 280 μm, (b) Ra = 0.4 μm, lw = 240 μm, (c) Ra = 0.4 μm, lw = 200 μm, (d) Ra = 0.4 μm, lw = 160 μm, (e) Ra = 4.0 μm, lw = 280 μm, (f) Ra = 4.0 μm, lw = 240 μm, (g) Ra = 4.0 μm, lw = 200 μm, and (h) Ra = 4.0 μm, lw = 160 μm.
Heat flux and TCR
Figure 12(a) shows the heat flux along the Y-axis at different wavelengths with values of surface roughness of 0.4 and 4.0 μm. Obviously, the heat flux decreases with increasing wavelength under the same Ra. When Ra is 0.4 μm, the heat flux at wavelength of 160 μm is 22.442 kw/m2, and the heat flux at wavelength of 280 μm changes to 22.440 kw/m2, from which it is concluded that the rate of change in heat flux with wavelength is slight. When Ra is 4.0 μm, the heat flux decreases from 22.395 to 22.310 kw/m2 as the wavelength increases from 160 to 280 μm, because the heat flow is directly related to the size of the actual contact area. As the wavelength increases, the actual contact area decreases leadings to the decrease in heat flux.
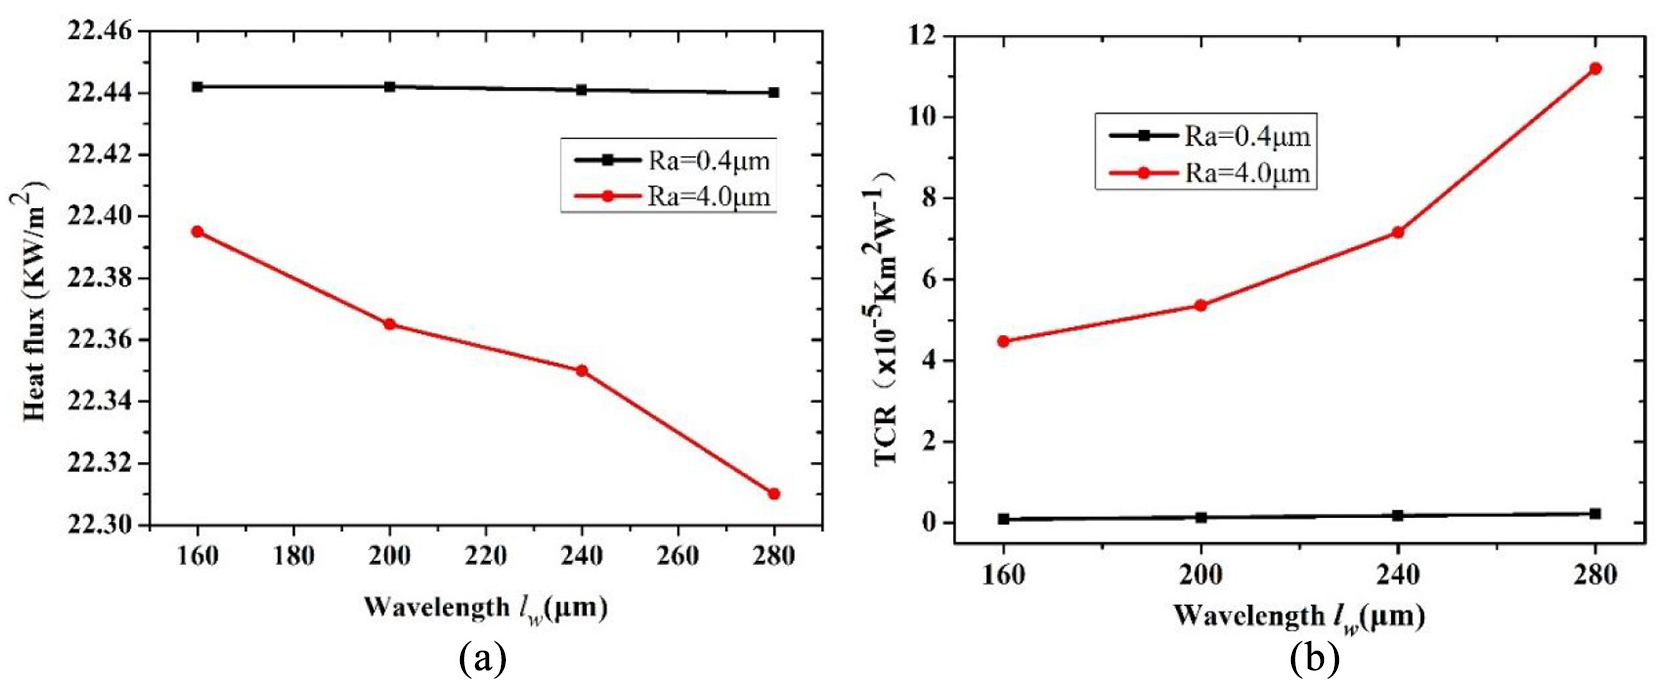
Variation at different wavelengths in: (a) heat flux and (b) TCR.
Figure 12(b) shows the relationship between wavelength and the TCR of KDP crystal/aluminum alloy (5A06) with values of roughness, Ra, of 0.4 and 4.0 μm. When Ra is 0.4 μm and the wavelength increases from 160 to 280 μm, the TCR increases from 0.0891 × 10⁻⁵ Km2 W−1 to 0.223 × 10⁻⁵ Km2 W−1, and TCR increases from 4.47 × 10⁻⁵ Km2 W−1 to 1.12 × 10⁻⁴ Km2 W−1 when Ra is 4.0 μm. These results show that, at the same wavelength, the TCR increases with the increase in roughness; the TCR at the same roughness increases with wavelength; and the greater the roughness, the greater the amplitude of the TCR increase. When Ra is 0.4 μm, the change in wavelength lw has little effect on TCR.
TCR of different values of ks at the same wavelength
In addition to the wavelength lw, the slope ks also affects the TCR. In this part, two wavelengths, lw, of 240 and 120 μm, and four different slopes, ks, of 0.1, 0.2, 0.3, and 0.4 are selected for simulation analysis.
Mises stress distribution
Figure 13 shows the Mises stress distribution at different values of slope ks when the wavelength is 240 μm, where the maximum stress is located at the peak of the aluminum alloy, and the minimum stress is located at the valley. Comparing the stress distribution at different values of ks, it can be concluded that at smaller ks the stress distribution is more uniform. At the same time, the stress value of the KDP crystal increases with ks. Figure 13(a) shows that, when the slope is 0.1, the stress difference of the KDP crystal surface (left) is 0.1 MPa, and this increases to 2.0 MPa when the slope is 0.4, so that it can be seen that the greater the ks, the greater the surface stress difference.
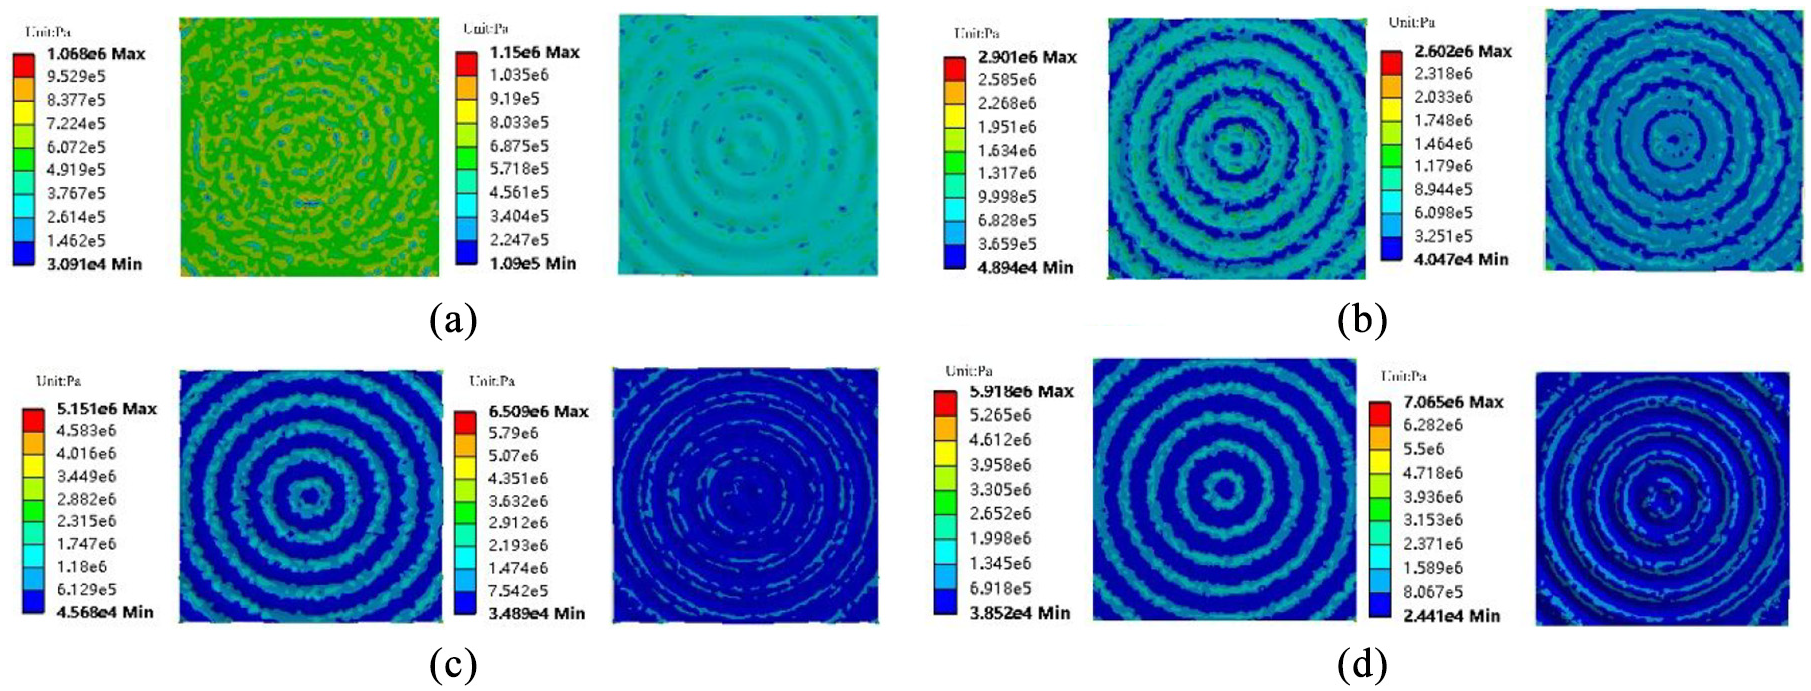
Mises stress distribution when lw = 240 μm: (left) KDP; (right) aluminum alloy: (a) ks = 0.1, (b) ks = 0.2, (c) ks = 0.3, and (d) ks = 0.4.
Temperature distribution of the contact interfaces
Figure 14 shows the temperature distribution of different slopes at wavelengths, lw, of 240 and 120 μm, where the temperature distribution of KDP crystal is on the left, and that of aluminum alloy on the right. The results show the following. (1) The temperature distribution is circular, and the highest point of KDP crystal temperature is in the contact area with the aluminum alloy peak, while the lowest point is in the non-contact area. The temperature distribution of aluminum alloy is the opposite of this, due to the heat transfer between the KDP crystal and aluminum alloy (5A06). (2) The larger the slope, ks, the lower the temperature of the crystal, but the difference in the surface temperature of the crystal increases. This is because the actual contact area between the KDP crystal and aluminum alloy (5A06) decreases with increasing ks. (3) At the same slope ks, the temperature of the crystal surface increases as the wavelength decreases. This is because the decrease in wavelength leads to increased contact area, heat transfer and temperature.
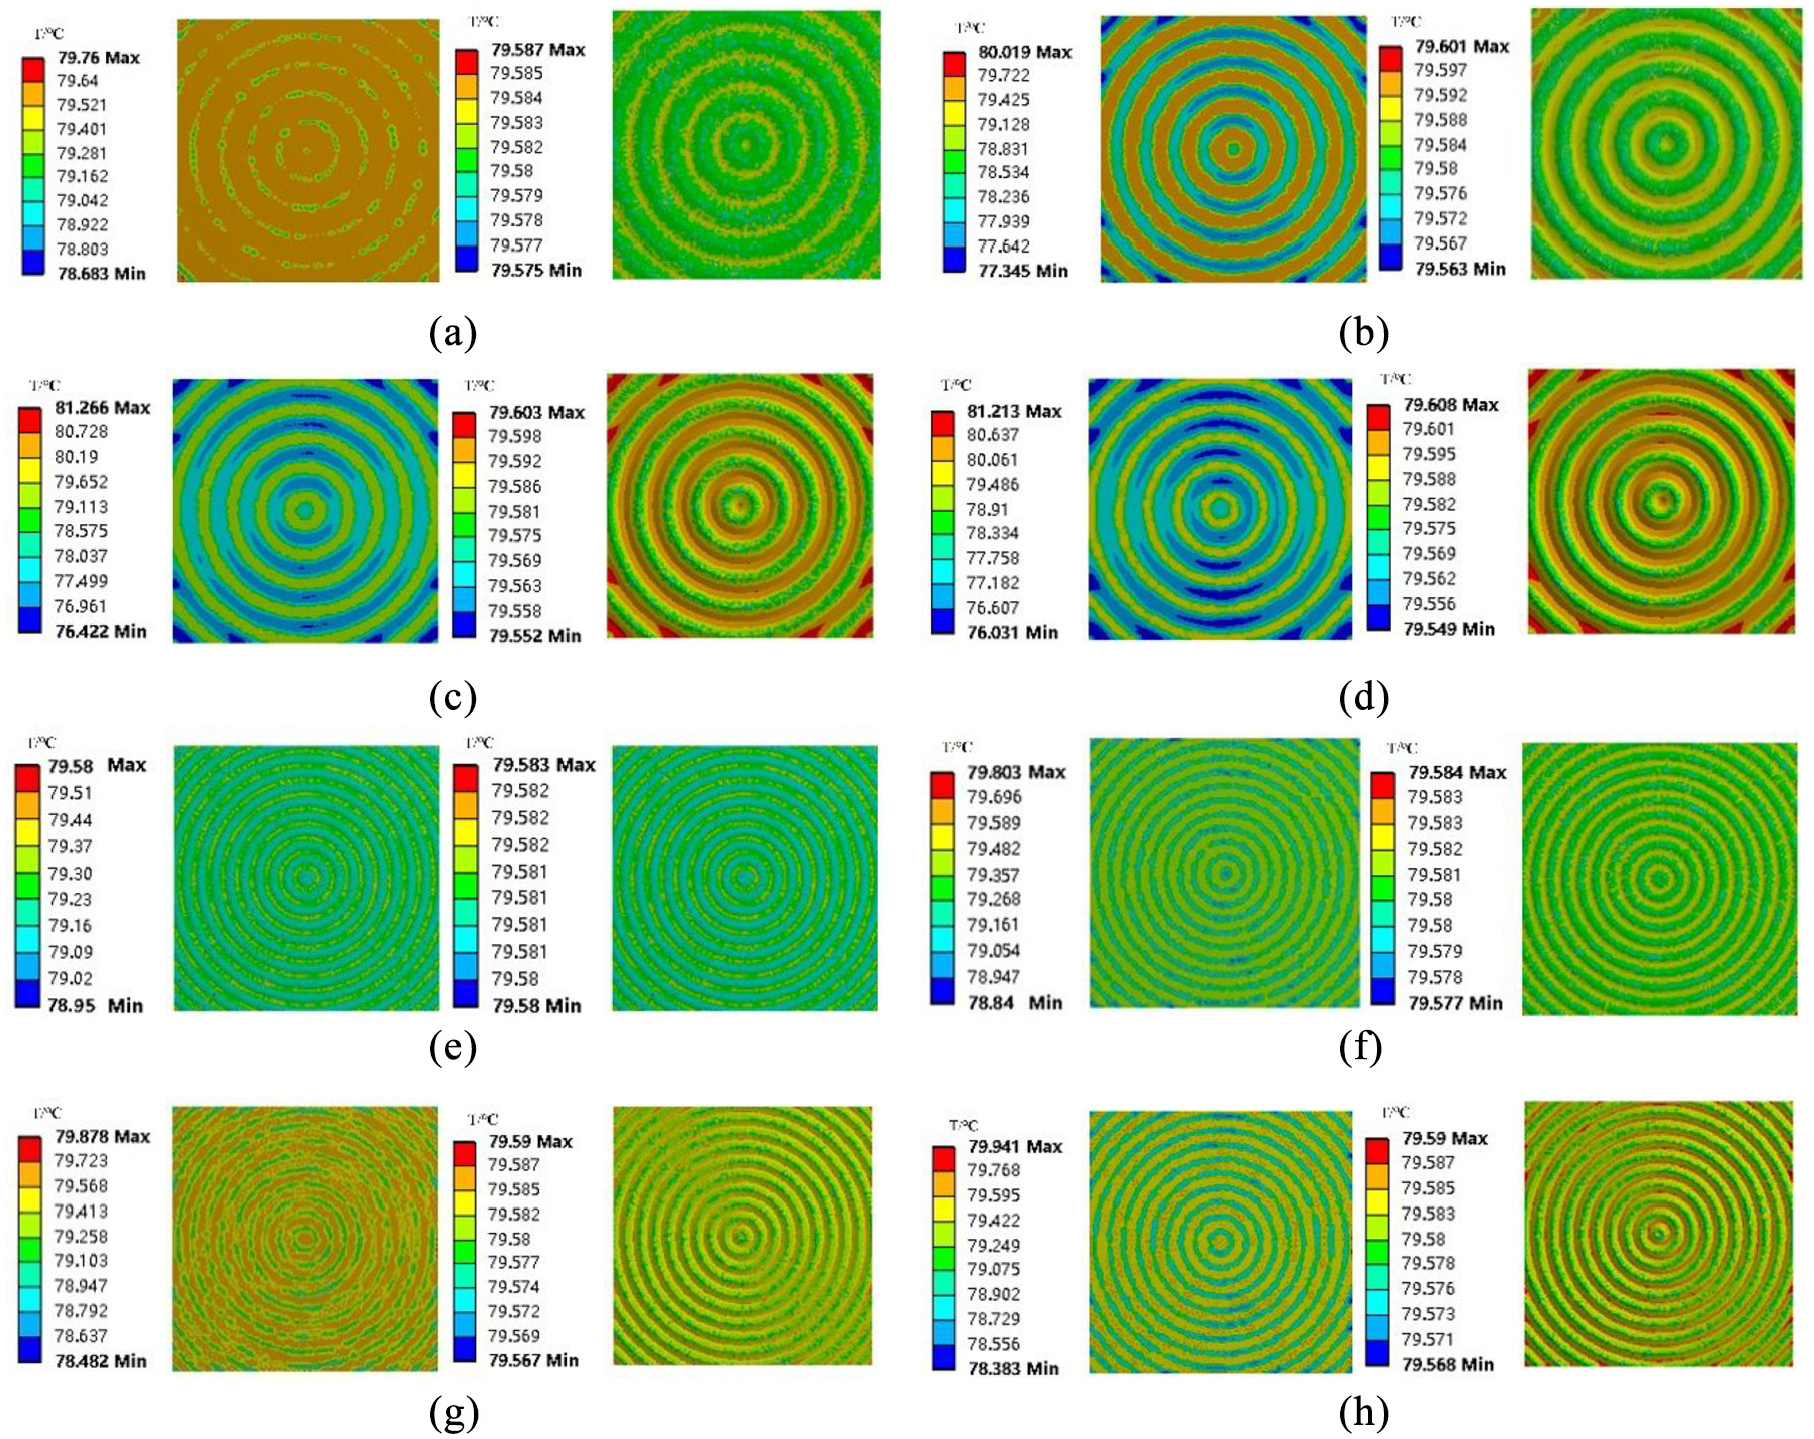
Temperature distribution of KDP crystal (left) and aluminum alloy (right): (a) lw = 240 μm, ks = 0.1, (b) lw = 240 μm, ks = 0.2, (c) lw = 240 μm, ks = 0.3, (d) lw = 240 μm, ks = 0.4, (e) lw = 120 μm, ks = 0.1, (f) lw = 120 μm, ks = 0.2, (g) lw = 120 μm, ks = 0.3, and (h) lw = 120 μm, ks = 0.4.
Heat flux and TCR
When the values of wavelength, lw, are 120 and 240 μm, the relationship between heat flux q and slope ks is shown in Figure 15(a). This shows that, at the same wavelength, lw, the heat flux q decreases with an increase in the slope ks. This is because, under the same stress, the increase in ks will cause a decrease in the actual contact area, thus leading to decreased heat flux q. At the same slope, ks, the heat flux q decreases with increasing wavelength lw. Comparing the heat flux at different wavelengths, it can be seen that when the wavelength lw is 120 μm and the slope increases from 0.1 to 0.4, the heat flux between samples decreases from 22.442 to 22.335 kw/m2, while when the wavelength lw is 240 μm, the heat flux decreases from 22.433 to 21.794 kw/m2. The results show that at smaller wavelength, lw, the rate of change in heat flux q with slope ks is lower.
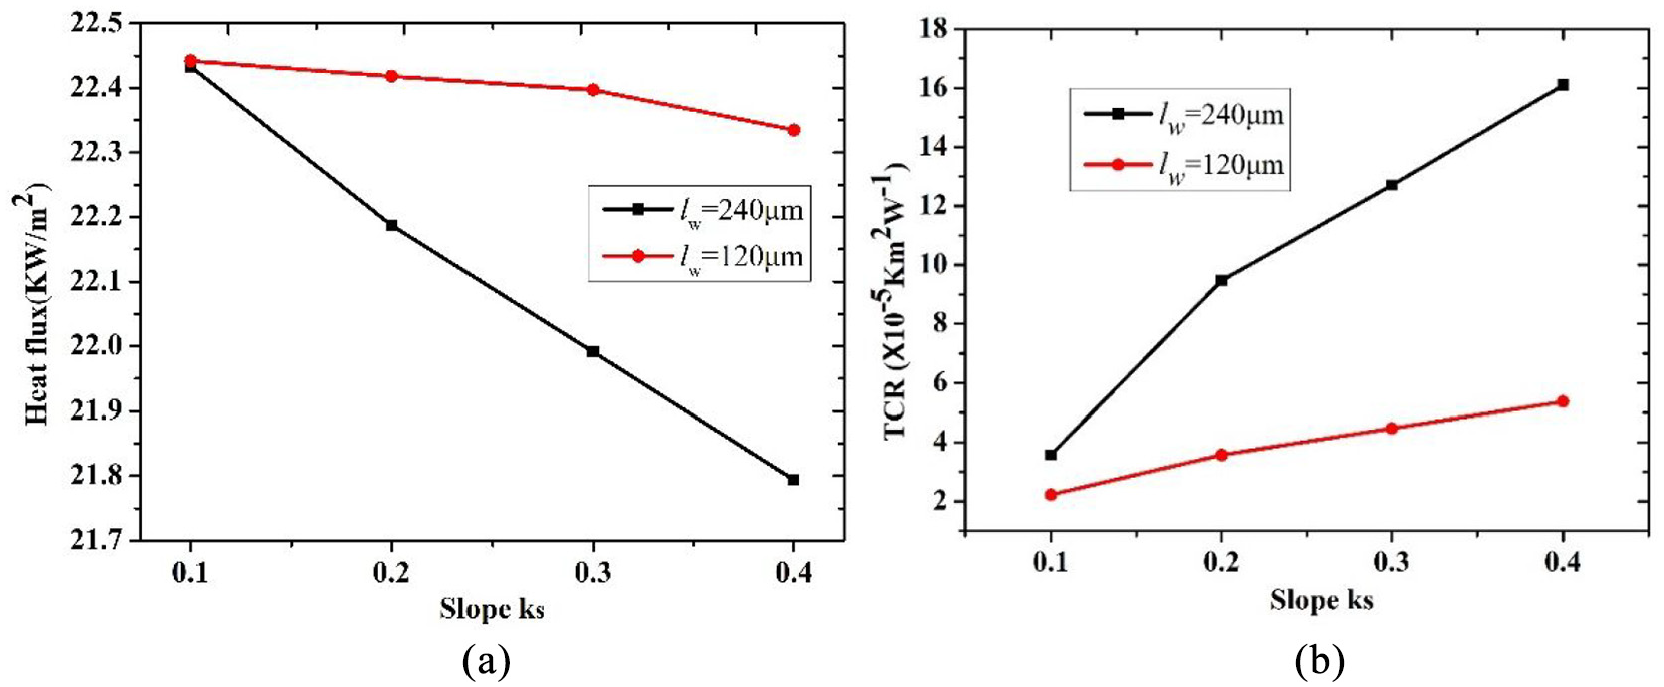
Variation at different slopes in: (a) heat flux and (b) TCR.
When the wavelengths, lw, are 120 and 240 μm, the relationship between TCR and slope ks is shown in Figure 15(b). This shows that the TCR of the KDP crystal/aluminum alloy (5A06) increases with increasing lope ks at the same wavelength lw. At the same slope, ks, the larger the wavelength lw, the greater the TCR. When lw is 120 μm and the slope ks increases from 0.1 to 0.4, the TCR increases from 2.235 × 10⁻⁵ Km2 W−1 to 5.37 × 10⁻⁵ Km2 W−1, while when lw is 240 μm, the TCR increases from 3.57 × 10⁻⁵ Km2 W−1 to 1.61 × 10⁻⁴ Km2 W−1 when lw is 240 μm.
According to sections 4.2 and 4.3, TCR decreases with decreasing wavelength, lw, at the same slope, ks. However, the influence of wavelength, lw, on TCR decreases with Ra. When Ra is 0.4 μm, the change in wavelength lw has little effect on the TCR. In the plane turning process, the wavelength, lw, is related to the feed rate, and the slope, ks, is related to the cutting thickness. Therefore, at a certain roughness Ra, a smaller feed rate should be selected to reduce TCR, while a smaller TCR can also be obtained by reducing cutting thickness at the same feed rate in plane turning.
Conclusions
This paper reveals the influence of the turning morphology of aluminum alloy (5A06) on the TCR between aluminum alloy (5A06) and KDP crystals, and proposes a novel simplified model by considering two parameters of wavelength and slope which is then experimentally verified. According to the two-parameter model, the Mises stress distribution, temperature distribution, heat flux and TCR at different wavelengths lw and slopes ks are analyzed. In addition, a turning method to reduce TCR under a certain roughness is proposed. The main conclusions are as follows.
The new two-parameter model is simple and effective in measuring the TCR between crystal and aluminum alloy, and the calculated results match well with the experimental results.
When values of roughness Ra, are the same, the stress difference increases with wavelength lw, and the smaller the slope ks, the more uniform the stress distribution.
At the same roughness Ra, the temperature difference between the KDP crystal and aluminum alloy increases with wavelength lw, while it decreases with an increase in the slope ks.
At the same roughness Ra, the heat flux q decreases with increasing wavelength lw, while at the same wavelength lw, the heat flux q decreases with increasing slope ks. The smaller the wavelength lw, the smaller the rate of change in heat flux q with slope ks.
At the same slope ks, TCR decreases with wavelength lw. However, the influence of wavelength lw on TCR decreases as roughness Ra decreases.
In the KDP crystal module, if the aluminum alloy is machined by turning under a certain roughness Ra, a smaller feed rate should be selected to reduce TCR; and, at the same time, a smaller TCR can also be obtained by reducing the cutting thickness at the same feed rate.
The present study proves that the two-parameter model represents a good technical means to derive TCR under low stress conditions.
Footnotes
Authors contributions
Xiaoyu Zhang proposed the main idea of article and analyzed data parameters obtained from multiple simulation experiments as well as the general preparation and draft of the paper.
Fuzhong Sun was mainly responsible for the revision of the paper and the summary of conclusions.
Declaration of conflicting interests
The author(s) declared no potential conflicts of interest with respect to the research, authorship, and/or publication of this article.
Funding
The author(s) disclosed receipt of the following financial support for the research, authorship, and/or publication of this article: This project is supported financially by National Natural Science Foundation of China (Grant No. 51805246) and Natural Science Foundation of Jiangsu Province (Grant No.BK20180704).
Ethical approval
The content of this article is about mechanical manufacturing, all data is original and no plagiarism is involved, and there is no secondary submission phenomenon.