
Abstract
On-machine direct detection of profile errors is vital to improve accuracy and efficiency in profile grinding. However, achieving such detection processes is difficult because of harsh machining conditions. This study presents a novel machine-vision-based processing methodology for the profile grinding of contour surfaces instead of the traditional optical-enlargement-based profile grinding which is manual dependent and low efficient. Grinding errors were efficiently detected online through machine vision. A specific vision system was coordinately designed with the profile grinding system to ensure distortionless measurement of workpiece contour and overcome the interferences of machining environment during profile grinding. A machining error detection principle was proposed based on the online captured workpiece contour image. Real-time error identification and compensation algorithms were developed through the synthetic error measurement. Simulations and experiments were conducted successively. The results indicated that profile errors were considerably reduced and measurement efficiency was improved, validating the effectiveness of the proposed methodology for profile grinding of contour surface. The findings can also provide a reference for the direct measurement of machining errors in other machines.
Introduction
Profile grinding is widely used in the machining of curve parts, such as complex precision molds and cutting tools. Optical-enlargement-based profile grinding is a popular precision machining method for contour surfaces, and machining errors in this method are usually inspected by manual vision. The contour of a curve part is optically enlarged and projected onto a projection screen. The enlarged profile image is then compared with the theoretical profile, allowing the profile error to be visually inspected by the operator. This method has the disadvantages of manual dependence and low efficiency. Therefore, improving the accuracy and efficiency of profile grinding is crucial. In addition to developing high-performance computerized numerical control (CNC) machine tools for accuracy improvement, studies have investigated compensation methodologies for reducing machining errors in a variety of manufacturing processes, which have the advantages of low cost and high effectiveness in accuracy improvement. In this study, a machine-vision-based profile error detection and compensation method was presented based on a self-developed digital profile grinding machine.
Error compensation is an essential issue for improving machining accuracy; a variety of error compensation approaches direct at error sources such as geometric errors of machine tools,1,2 thermal errors,3,4 tool wear errors,5–8 residual errors, form errors9–13 and following errors of servo driving system. 14 In profile grinding, grinding wheel wear errors notably contribute to the profile error of a workpiece. Moreover, geometric errors and thermal errors in machine tools also influence final machining accuracy. Geometric errors can be compensated for through error modeling of machine tools. Ramesh et al. 1 and Schwenke et al. 2 have reviewed machine geometric error measurement and compensation. Thermal errors constitute the large contributor to workpiece dimensional errors in precision machining. 3 Some studies have focused on the overall consideration of geometric and thermal errors in improving machining accuracy. Li et al. 4 presented a comprehensive compensation method for integrated geometric and thermal errors of machine tools, with tests on a vertical machining center showing that the position accuracy of the machine tool could be considerably improved after compensation.
Tool wear can be a major factor for the dimensional or form errors of a workpiece. Li et al. 5 studied tool wear in the contour grinding of optical components. A tool wear model was developed to predict tool profiles, and an algorithm was designed for tool path adjustment. Aligiri et al. 6 predicted the amount of tool wear based on a real-time estimation of the material removal volume in micro-electrical discharge machining and produced more accurate micro-holes compared with other methods. Arunachalam and Ramamoorthy 8 presented a machine-vision-based texture analysis method to discriminate the surface condition of the grinding wheel.
Form error is a workpiece-shape-related error and is usually regarded as a challenge among the three main geometric features of size, form error and roughness. Many compensation methods focusing on form errors have been discussed. Huang and Gao 9 proposed a discrete system model for form error control in surface grinding. On-machine measurement is popular in such studies, in which contact and noncontact sensors are tested. Chen et al. 10 presented a profile error compensation approach in ultraprecision grinding of aspheric surfaces based on on-machine displacement sensor measurements. Sharma et al. 11 proposed an offline profile error measurement and compensation approach for machining of silicon aspheric optics. The overall profile error was obtained to generate a new tool path for compensation machining. A touch-trigger probe was installed on a machine’s spindle by Huang et al. 12 to obtain the coordinates of the sampling points on the machined surface, and a compensation algorithm was developed for reducing machining errors of thin-wall parts by modifying the tool path. Lin et al. 13 studied a grate parallel grinding method for large aspheric mirror surfaces. A noncontact displacement laser sensor was used to conduct an on-machine measurement of the form error, and the result revealed that error compensation could considerably improve form accuracy.
Owing to the development of image processing technology, vision systems are being increasingly introduced into machine tools. 15 Some studies have focused on tool wear monitoring.7,16 Various direct measurement procedures have been proposed for measuring different tool wear parameters using charge-coupled device (CCD) vision systems. Zhang et al. 7 studied a wheel wear detection approach based on machine vision in precision curve grinding and the results indicated that the machining precision can be improved by compensating the detected wheel wear. Klancnik and Senveter 17 developed a numerical control system for optical determination of workpiece origin using a QuickCam camera. Al-Kindi and Zughaer 18 provided a new CNC system integrated with vision-based feedback control. This was used for surface roughness measurement to improve the precision of manufactured parts. Liu et al. 19 developed a vision-based contour error detection system for effectively evaluating the dynamic performance of machine tools.
Although the aforementioned studies have explored many error detection and compensation methods, most of them have focused on indirect or non-real-time measurement. Few studies have been conducted on direct detection of machining errors during the machining process. Furthermore, although machine vision has been introduced to machine tools, most studies mainly focused on monitoring and compensation of tool wear in curve grinding 7 and surface quality, 18 or evaluating the performance of machine tools. 19 On-machine visual detection of contour errors is still a big challenge for profile grinding of contour surfaces. This is presumably because interference such as vibrations and chips can considerably affect the behavior of vision systems and also place a higher demand on the coordination design of machine structures with vision systems.
In this study, a machine-vision-based profile grinding method was developed for creating a new profile grinding process. The main contributions of this study are summarized as follows:
A novel vision-based profile grinding method was present for direct detection and compensation of the contour errors in the process of contour surfaces grinding, which changes the situation that the traditional optical contour grinder can only detect the wheel wear caused errors.
The algorithms for direct detection and compensation of contour errors were proposed and effectively applied in the simulation and machining experiments.
A specific vision system was coordinately designed with the grinding system to overcome interferences of machining environment and realize the accurate real-time measurement of workpiece contours.
In this article, the principle of machine-vision-based profile grinding was analyzed in section “Machine-vision-based profile grinding system.” The primary detection of profile errors and criteria for compensation were introduced in section “Criteria for profile error detection and compensation.” The methodologies for real-time identification and compensation of profile errors were proposed in section “Online identification and compensation of profile errors.” Simulation experiments were carried out in section “Simulation” based on the introduced methods in sections “Criteria for profile error detection and compensation” and “Online identification and compensation of profile errors.” Finally, the profile grinding experiment was conducted in section “Experiments.”
Machine-vision-based profile grinding system
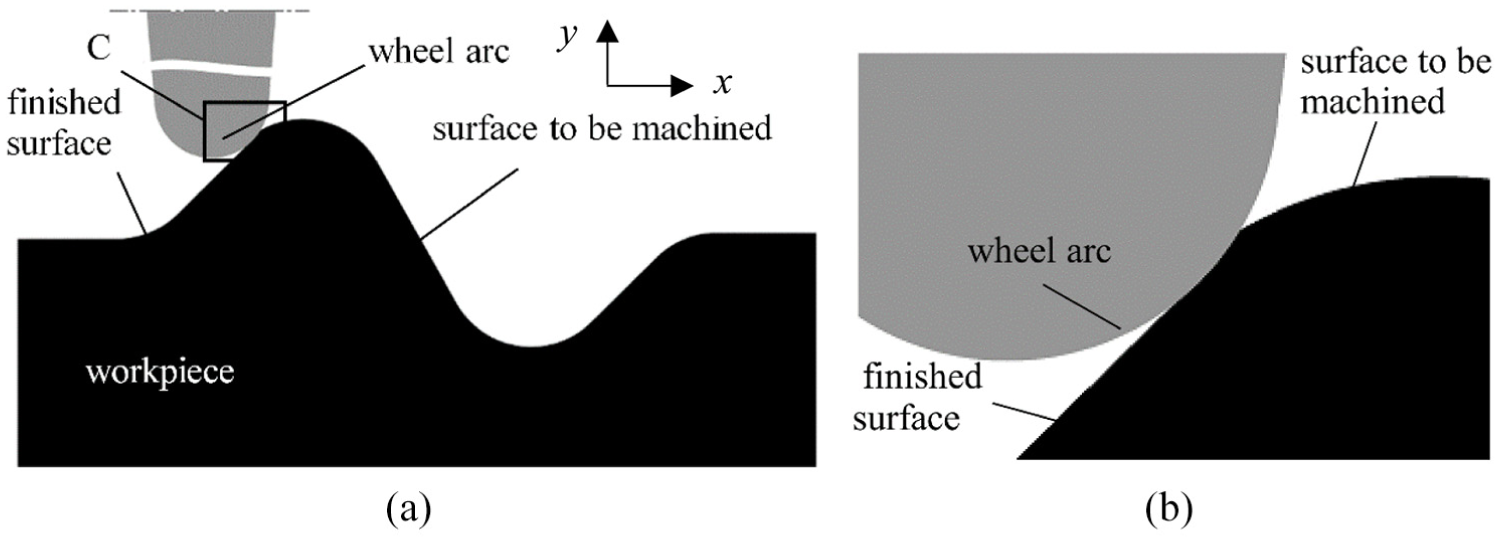
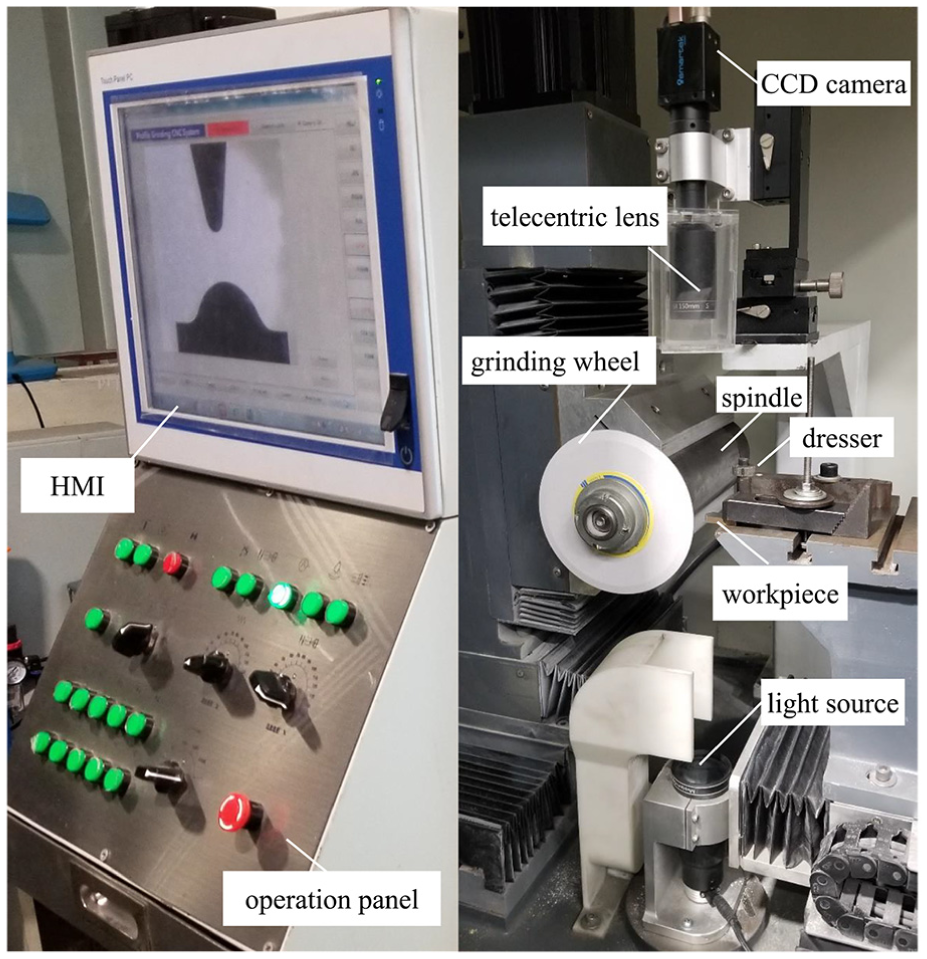
The machine-vision-based profile grinding of contour surface was performed using self-developed five-axis profile grinding machine as testbed. The schematic of the grinding system is shown in Figure 1. Several profile grinding modes can be designed based on the testbed. This study focuses on a global-visual-image-based digital profile grinding mode developed for in situ detection of profile errors. In this mode, the workpiece is attached to the worktable, and the vision system is fixed on the testbed and remains stationary during grinding; additionally, the profile of the contour surface is in the camera field of view. After the workpiece is clamped, the position of the machined profile is also fixed in the acquired image, which can be matched to the theoretical profile position through tool settings. An arc grinding wheel with a double-bevel edge rotates at a programmed speed. Moreover, the wheel conducts interpolated feed motions in the U and V directions and a reciprocating servo feed motion in the Z direction. One reciprocating motion is called one grinding cycle. The profile grinding of contour surface performs a type of dry point grinding, in which wear debris can be collected by a vacuum cleaner. When the wheel moves to the top position in the Z direction, the camera takes a picture of the machined contour of the workpiece. The acquired image obtains high edge sharpness due to noncontact between the wheel and the workpiece, less grinding spark and less motion induced interference on the profile image. The vibration during grinding mainly happens in Z direction and then has less effect on the measurement accuracy of the image profile. The actual finished profile of the workpiece is online extracted through image processing and compared with the theoretical one. The profile error can then be calculated through the design of the error detection algorithm.
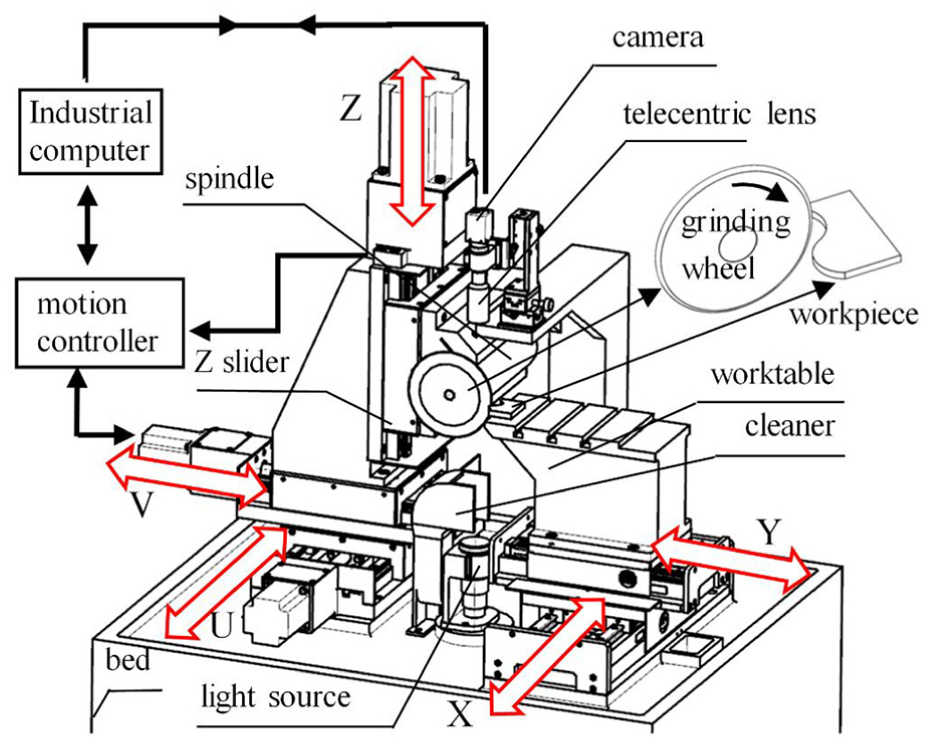
Testbed for machine-vision-based profile grinding system.
The error detection system mainly consists of a high-precision area CCD camera, telecentric lens, directional backlight, computer and controller. The image acquisition process can be software based and internally triggered. The computer controls image acquisition, image processing, command transmission to the controller and grinding process monitoring.
The vision system should be first position regulated, which included the calibration of verticality of optical axis of lens and the worktable plane, the calibration of coaxiality of optical axis of parallel light source and optical axis of lens. Then, the image can be calibrated by a high accuracy calibration template before measurement.
A thin double-bevel wheel with a circular edge in cross section is typically used in profile grinding. An ideal profile of a grinding wheel arc is shown in Figure 2(a). L1 and L2 are the two bevel edges. R is the radius of the wheel arc, and α is the radius angle. Both L1 and L2 are tangent to the wheel arc. L is the center line of the wheel profile. After dressing, the wheel edge profile can be captured by the machine vision system, and one sample is shown in Figure 2(b).
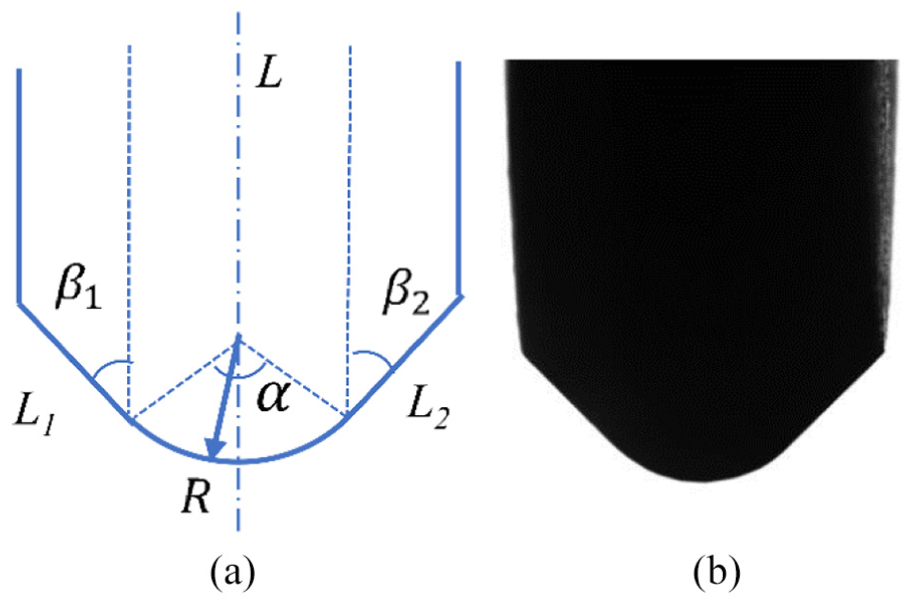
Typical profile of a wheel arc: (a) theoretic profile and (b) profile image.
Criteria for profile error detection and compensation
The schematic of primary detecting profile errors during grinding is shown in Figure 3. Based on the requirement of cutter radius compensation, the path planning of the cutter location point can be determined based on the contour of the workpiece and the radius of the wheel arc. Because the camera and workpiece are both fixed and the theoretical position of the machined contour is constant in the image coordinate system, the actual position of the machined contour should overlap with the theoretical contour position in the image coordinates. Non-overlapping of the two contours signifies the existence of profile errors. In order to realize the online detection of the profile error, we can detect the deviation between the actual and theoretical grinding points.
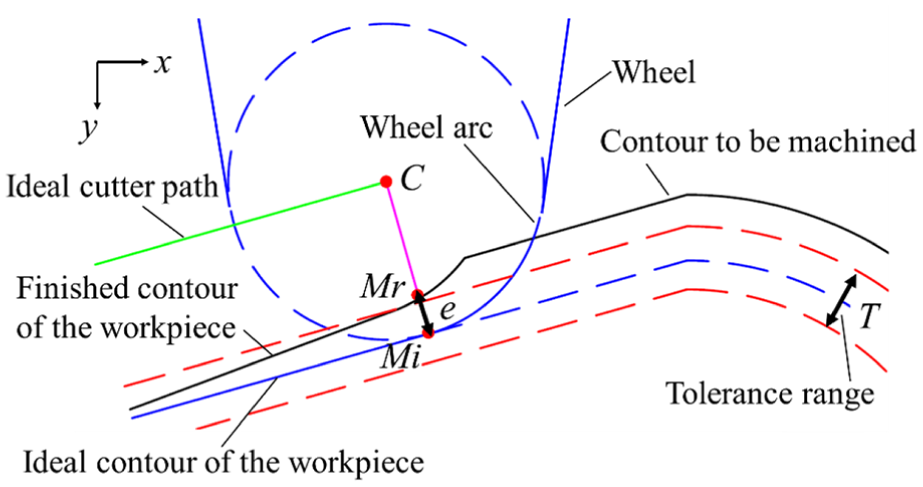
Schematic for profile error detection.
During the grinding process, the first process is to read the current cutter location point C and the corresponding theoretical grinding point Mi from the CNC system; C is also the center of the ideal wheel arc, as shown in Figure 3. The actual machined workpiece contour can be obtained by conducting edge extraction on the captured workpiece image. When point C and Mi are connected, the line CMi intersects the actual extracted workpiece contour at point Mr. The objective of the error compensation is to ensure that Mr is sufficiently close to Mi. The distance e between Mr and Mi can be regarded as the current machining deviation. The three criteria for error compensation are presented as follows, where T is the symmetric tolerance range and T/2 can be defined as the error threshold:
Criterion 1: If
Criterion 2: If
Criterion 3: If
The distance e is calculated every time the grinding wheel completes one reciprocating motion in the grinding process. The compensation is determined by the given criteria. Assume that
Online identification and compensation of profile errors
According to the criteria in section “Criteria for profile error detection and compensation,” a compensation process must be executed when the detected machining error exceeds the error threshold. The theoretical amount of compensation and direction of compensation cannot be accurately identified by considering only the position of the current cutting point. The direction and magnitude of error compensation are discussed in this section.
The center C of the wheel arc can be identified in the image coordinate at any moment during profile grinding. As illustrated in Figure 4, the theoretical circular area of the wheel arc can be formed based on the radius and position of center C. If no machining error exists, the machining allowance inside the theoretical circle can be removed and no workpiece image thus exists inside the circle after one grinding cycle. However, if a grinding error exists due to an insufficient wheel feed caused by factors such as wheel wear or geometric errors, the workpiece image exists in the theoretical circle because the machining allowance is not removed by the previous grinding cycle.
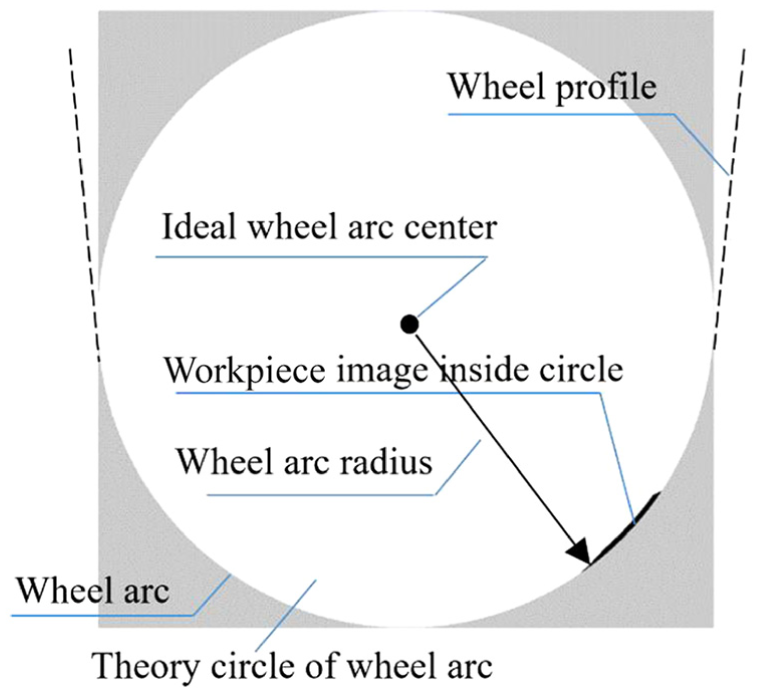
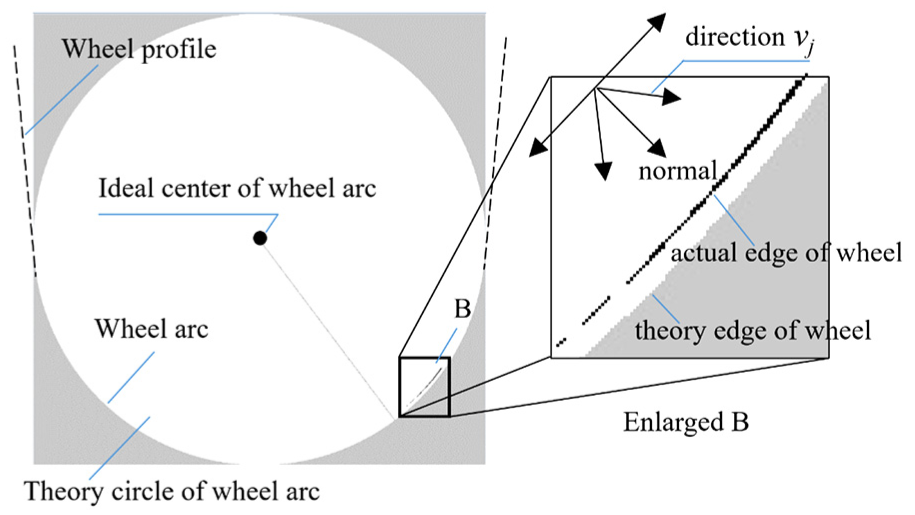
Workpiece image inside a theoretical circle of wheel arc.
This study developed an image-subtraction-based method for determining the direction and magnitude of grinding errors if the wheel feed is judged to be insufficient according to Criterion 2. This method entails capturing the image inside the theoretical circle in the first grinding cycle when an insufficient feed occurs. The process is next repeated in the second grinding cycle. The subtraction of the two adjacent images represents the removed part of the materials by the second cycle and indicates the real profile position of the grinding wheel arc, as shown in Figure 5. When the actual position of the grinding wheel is different from the theoretical position and the deviation occurs in the v direction (Figure 6), the distance from point pi (i = 1, 2, …, n) at the actual edge of the wheel to the theoretical edge of the wheel is defined as
Subtraction of adjacent machining images.
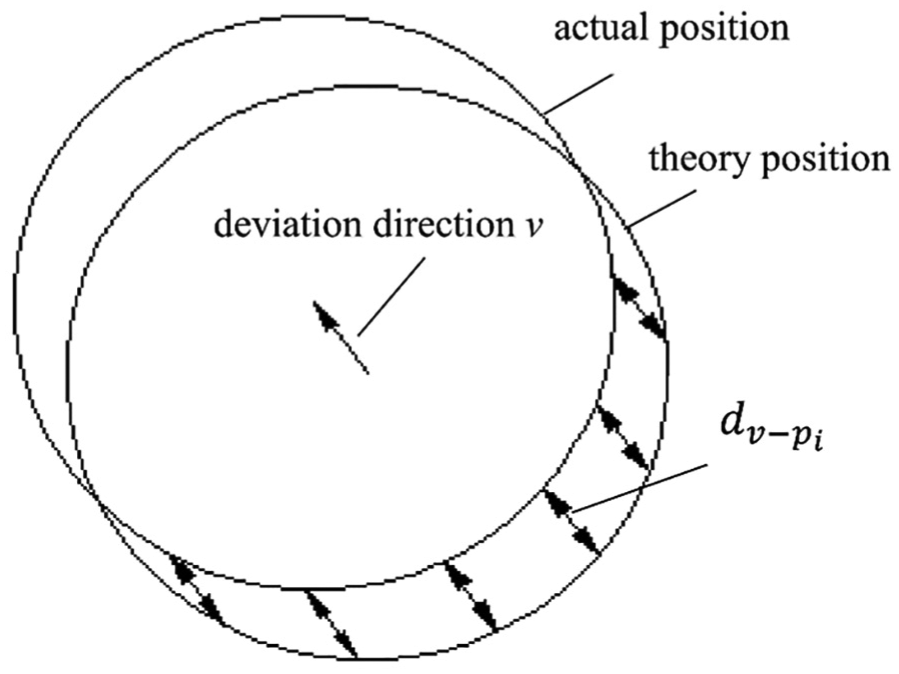
Schematic diagram of deviation of the wheel position.
The real wheel edge during work is obtained by image subtraction and is shown in box B of Figure 5. The points of the wheel edge during work are represented by a set of pixel points pi (i = 1, 2, …, n) at the bottom of each column of the black image inside the theoretical circle. Enlarged box B of Figure 5 presents computations of
Find v
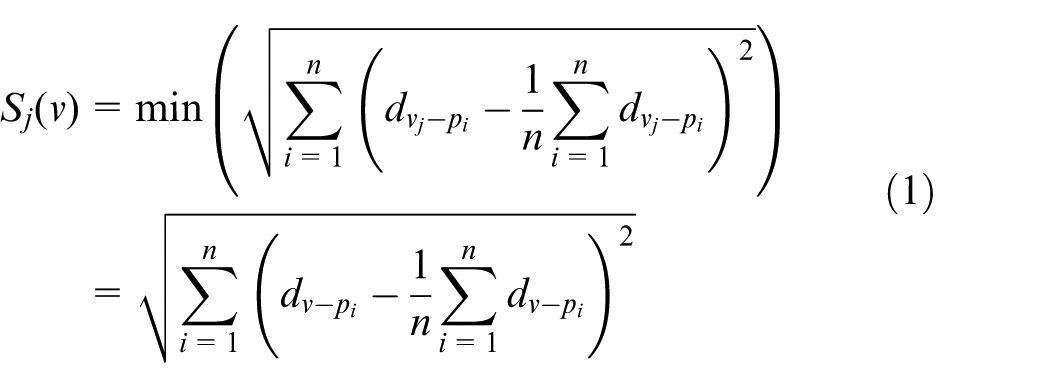
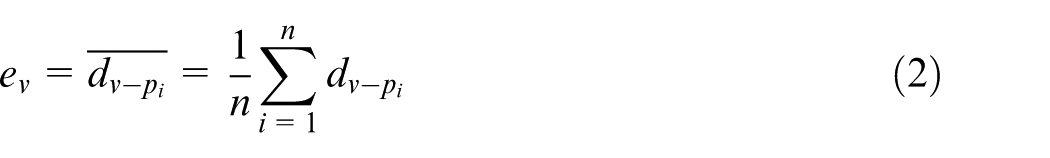
where
Consider a special case in which the wheel feed is judged to be insufficient in the first cycle and no material is removed due to the machining error in the second cycle. In such a case, the real cutting position cannot be determined using the aforementioned method; accordingly, the normal direction of the theoretical grinding point can be used as the direction of compensation and the detected deviation in the first grinding cycle can be used as the amount of compensation.
If the wheel feed is judged to be excessive according to Criterion 3 in section “Criteria for profile error detection and compensation,” the wheel should return a certain distance to avoid overcutting in the next grinding cycle. The normal direction of the theoretical grinding point can be taken as the compensation direction and the calculated deviation can be taken as the compensation distance.
Simulation
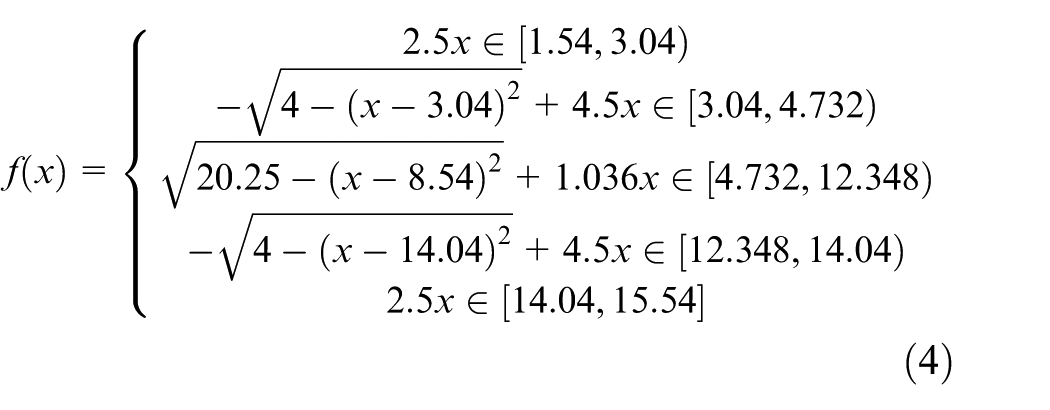
On the basis of the proposed methodology for online profile error detection and compensation, this study conducted a simulation experiment. OpenCV (open source computer vision library) and Microsoft Visual Studio were the software platforms used. An image of the curve workpiece was created as shown in Figure 7(a) according to the theoretical contour, which can be mathematically expressed by
where x is in millimeters. Assume that the image size of the curve workpiece is
Schematic of the profile grinding simulation: (a) simulation scene and (b) enlarged C.
The cutter location point can be determined by processing parameters including the wheel feed rate, reciprocating speed and wheel arc radius. The simulation parameters are listed in Table 1.
Simulation parameters for vision-based profile grinding.
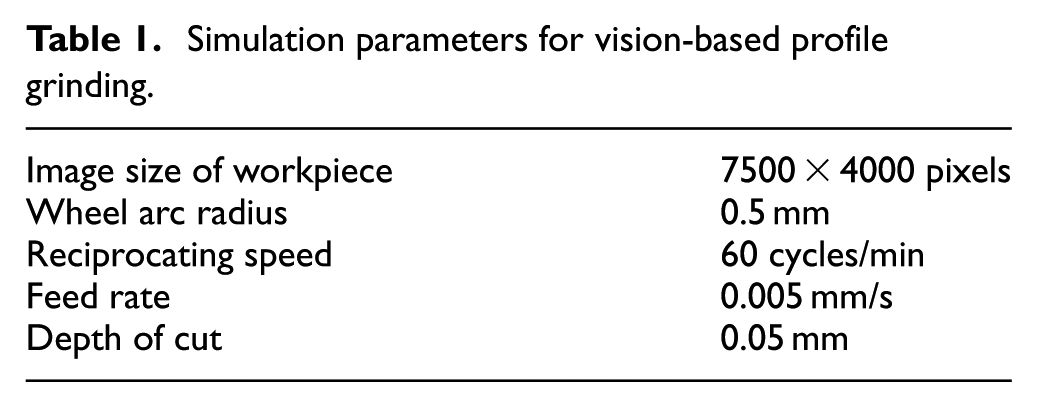
As shown in Table 1, we supposed the wheel arc radius to be 0.5 mm, the cycle rate was 60 cycles/min, the feed rate of the wheel was 0.005 mm/s and the maximal depth of cut was 0.05 mm. The interval of the two adjacent cutter location points can be calculated as 5 μm. The removed material of the workpiece was therefore determined by the image intersection of the theoretical wheel arc area with the rough part during the grinding process. The simulation flowchart is presented in Figure 8.
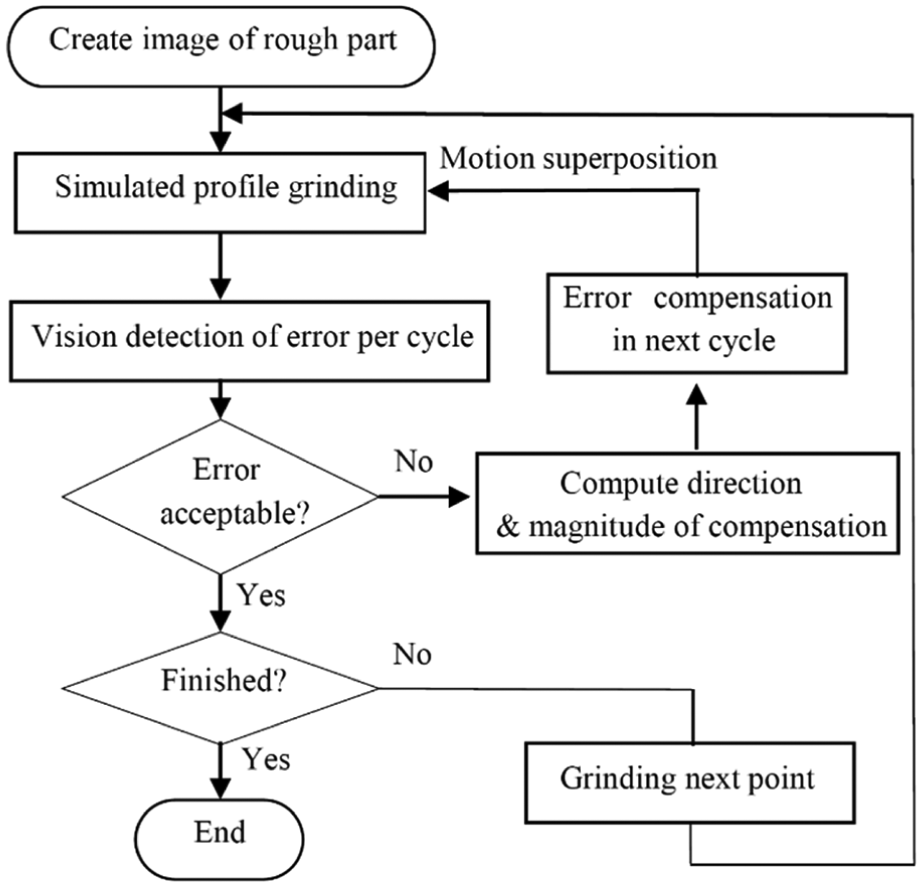
Flowchart of profile grinding simulation.
As indicated in Figure 8, an image of rough part was created and the simulated grinding was conducted based on the parameters in Table 1. The profile error was simulated by creating a coordinate offset to the position of a chosen theoretical cutter location point. Five simulation tests were designed by setting five coordinate offsets for five different theoretical cutter location points, respectively. The following points in the contour were assumed to have the same offset as the first offset point in every experiment.
Error detection was conducted once after a completed reciprocation grinding cycle. If a detected result met the defined Criterion 1, we proceeded to grind the next point. If the detected error was beyond the preset limit, the magnitude and direction of compensation could be computed through the proposed algorithm in section “Online identification and compensation of profile errors” and the feed movement of the grinding wheel was compensated in the next cycle.
In the case of insufficient wheel feeding according to Criterion 2, the searching directions
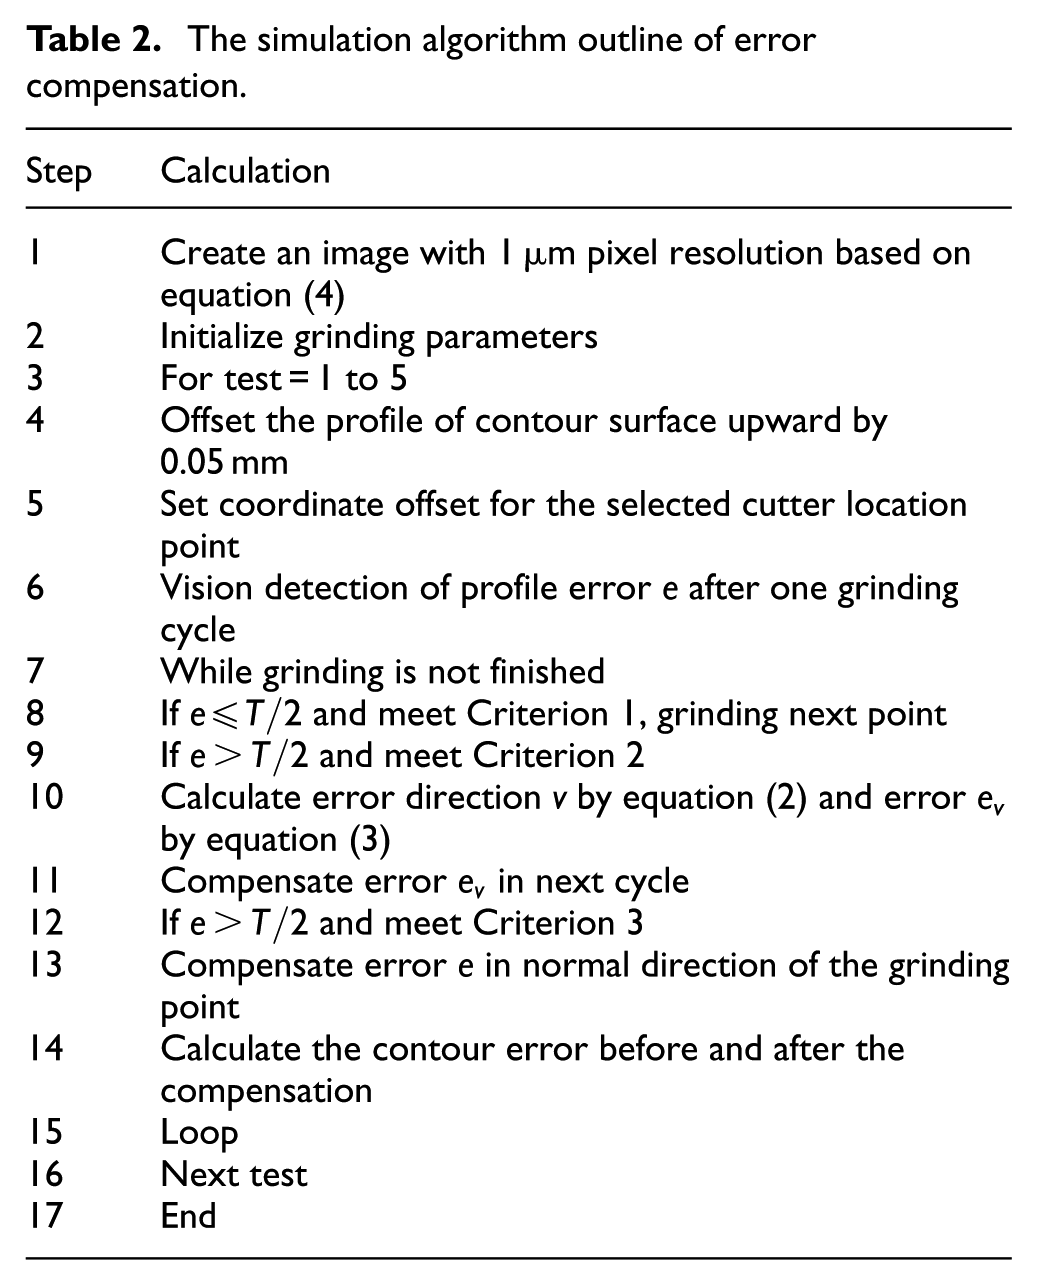
The simulation algorithm outline of error compensation.
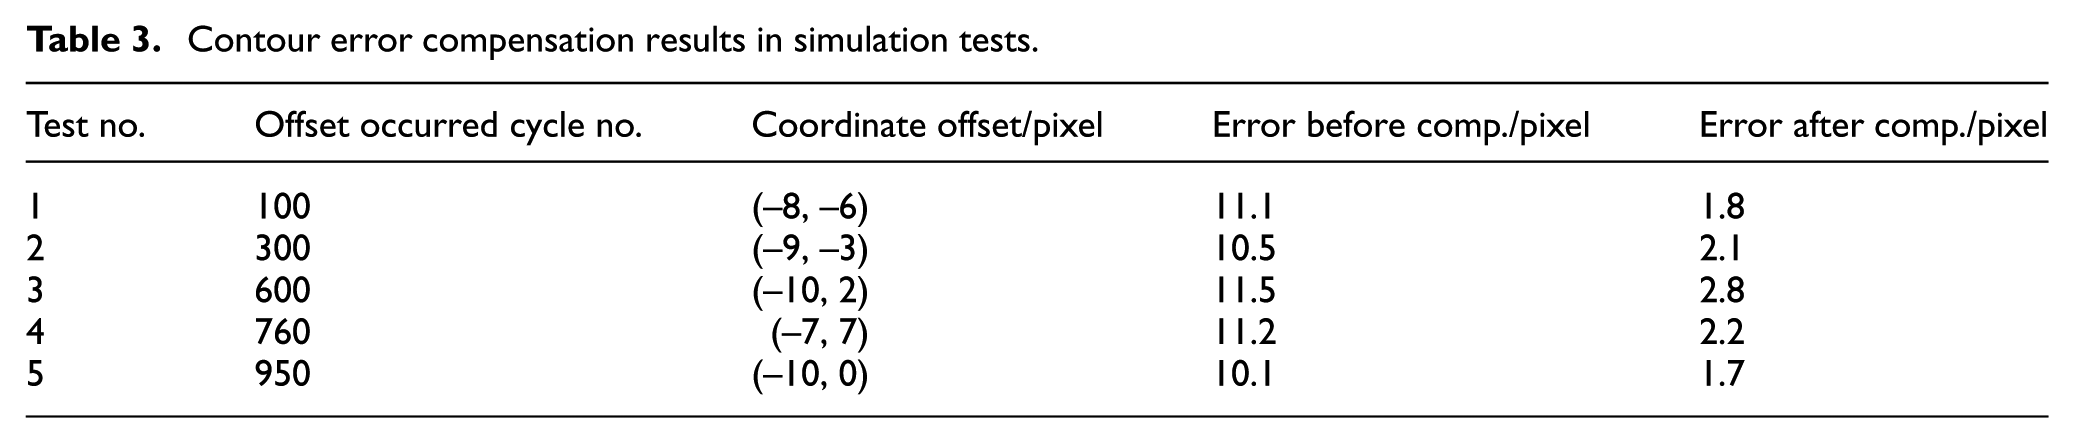
Take Test 4 as an example, a machining error was simulated by setting a coordinate offset (–7, 7) at cycle no. 760 shown in Table 3, that is, the offset value for each following grinding point was (–7, 7). The simulation tests were conducted without error compensation and with compensation, respectively. The contour error was defined as the normal deviation between the theoretical and actual contours. The maximal contour error without compensation was calculated to be 11.2 pixels, and the error distribution is shown in Figure 9(a). By contrast, after compensation, the maximum error was reduced to 2.2 pixels, and the contour error is displayed in Figure 9(b). The abscissa in Figure 9 stands for the measurement point which corresponds to the cycle numbers of reciprocating motion of wheel. The results obtained from the five groups of simulation indicated that the average contour error dropped by 80% after compensation, as shown in Table 3, and that the machining accuracy was within 3 pixels.
Contour error compensation results in simulation tests.
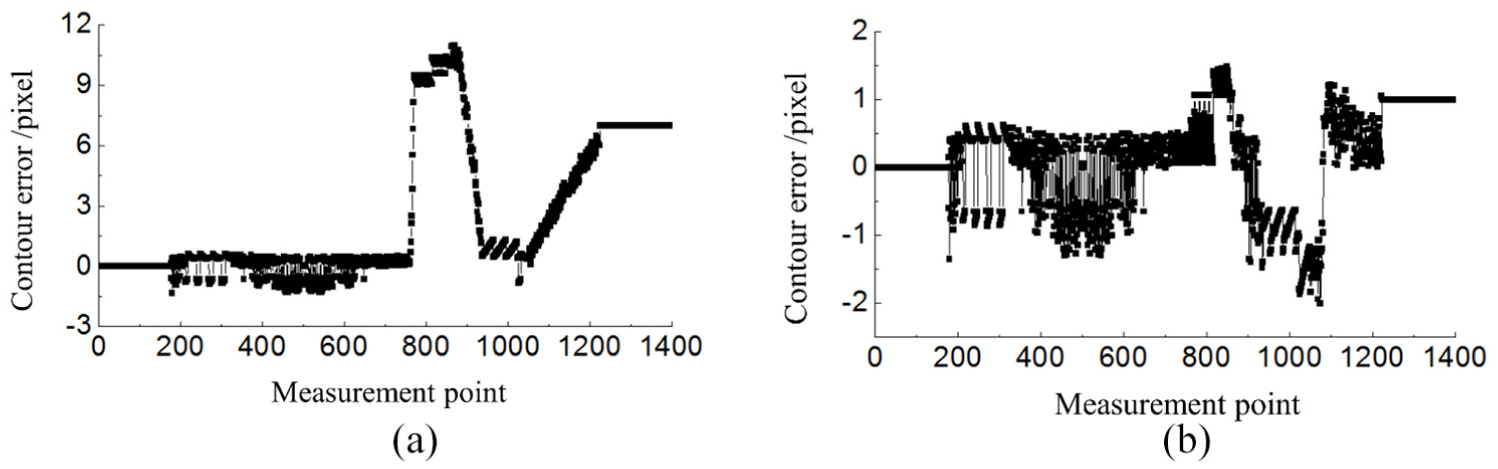
Simulation results of contour errors: (a) without compensation and (b) with compensation.
Experiments
Experimental setup and procedure
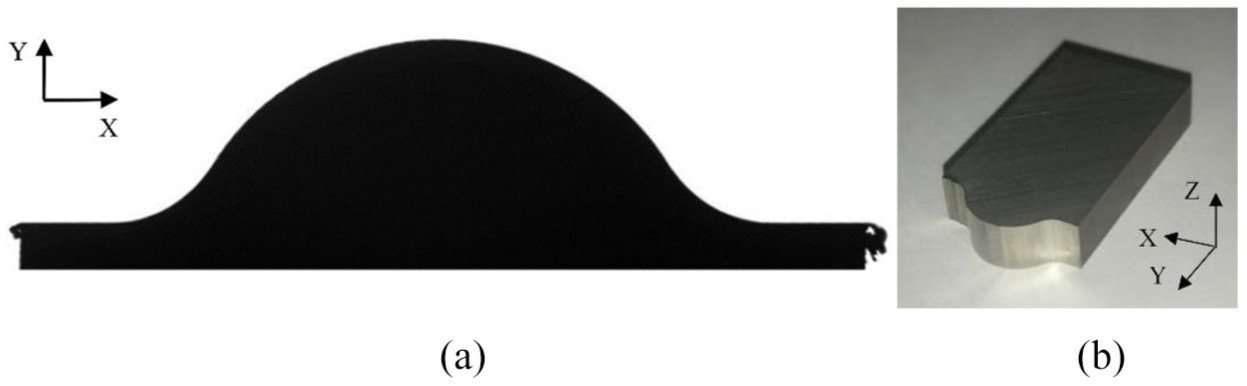
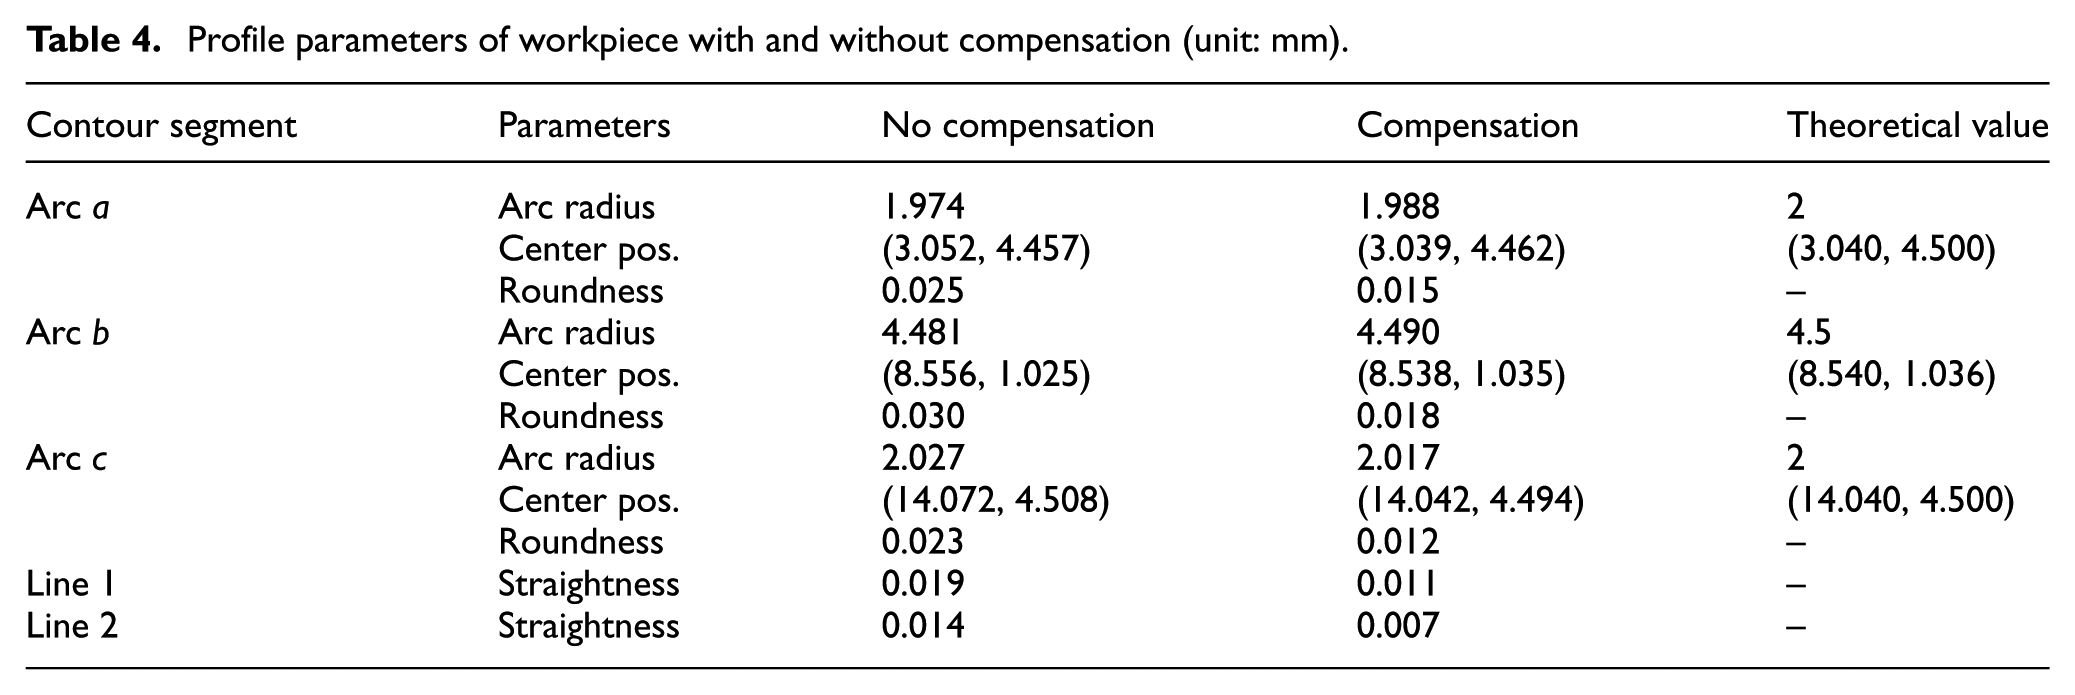
On the basis of the simulation, a profile grinding experiment was designed to test the online visual detection and compensation method for profile grinding errors. The experimental setup involved a self-developed profile grinder, which is shown in Figure 10. A machine-vision-oriented CNC system was developed to control the grinding process. 20 A workpiece W was made of high-speed steel and had a thickness of 5 mm, as presented in Figure 11(b). The contour of the workpiece can be divided into five segments including Arc a to c and Line 1 to 2, which is shown in Figure 11(a) and can be expressed by
where x is in millimeters.
Experimental setup for profile grinding of contour surface.
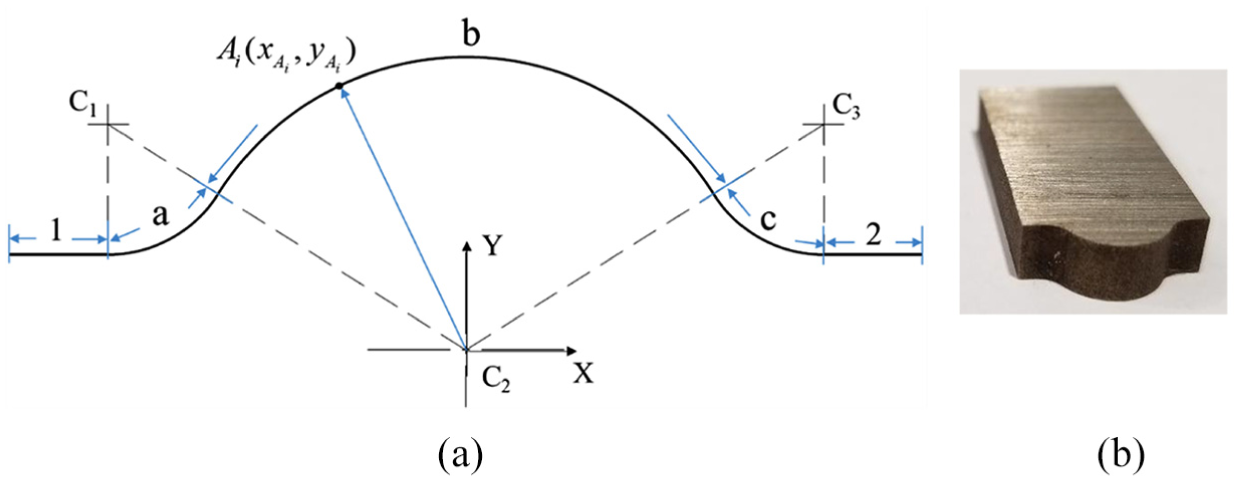
Profile of the workpiece W to be machined: (a) theoretical profile and (b) raw workpiece W.
The vitrified bond grinding wheel, produced by Saint-Gobain, comprised single-crystal corundum abrasive with a mesh size of 150. The wheel was 150 mm in diameter and 6 mm in thickness. The grinding wheel is dressed by the dresser which is fixed on the worktable as shown in Figure 10. The wheel moves relative to the dressing roller to obtain the required contour shape, as illustrated in Figure 2(a). The dresser in the experiment is a diamond roller with 80 ANSI mesh abrasive and 20 mm in diameter. The theoretical radius of the wheel arc R was 1 mm, and the central angle of the wheel arc
In the experiment, the camera model is GC2441M made by SMARTEK Vision in Germany. It is characterized by 2/3″ CCD in size, 15 fps in frame rate and 5 mega-pixels in resolution. The telecentric lens is characterized by 0.02% in distortion, 3 mm in depth of focus, 150 mm in object distance and 0.5 in enlargement factor. A blue LED and parallel backlight source with 5 W in power was used. The camera was mounted in the three-dimensional (3D) adjustable slider which was fixed on the support. Spatial calibration is the process of converting the pixel unit into its corresponding real-world unit. The image calibration was conducted based on a high accuracy calibration template of 1 μm in resolution, which was placed on the worktable. The spatial calibration was conducted and a conversion factor Tc = 6.982 μm/pixel was then obtained. To obtain the minimum image resolution, a subpixel localization algorithm 21 was used for computing the location of an edge with subpixel precision. The vision system could reliably estimate the one-fourth subpixel accuracy 22 (Tc/4 = 1.746 μm).
During the grinding process, the spindle speed was 3000 r/min, the reciprocation distance of the wheel along the Z-axis was 50 mm and the cycle rate was 60 cycles/min. The feed rate of the wheel was 0.02 mm/s, and the depth of cut was 0.02 mm. To obtain a clear workpiece contour, images should be captured when the wheel is separated from the workpiece. Figure 12 displays the different wheel positions in profile grinding.
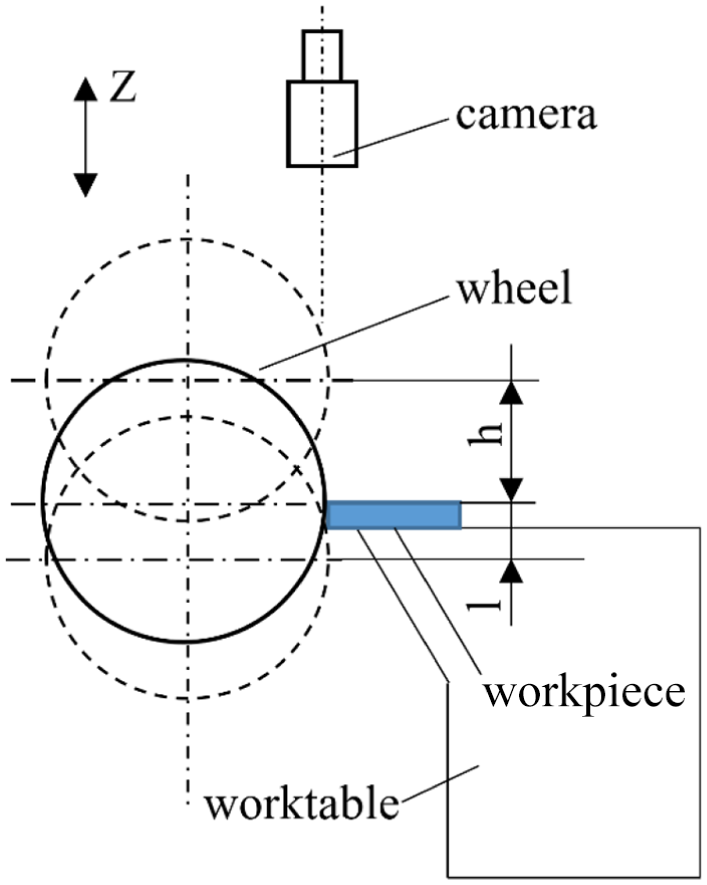
Wheel position in profile grinding.
Figure 13(a)–(c) illustrates the captured profile images during profile grinding when the contour of the horizontal radial section of the wheel was 5 mm below the upper surface of the workpiece (l = 5 mm), equal to the surface (h = 0) and 20 mm above the surface (h = 20 mm), respectively. As indicated in the images of Figure 13, although the field depth of the telecentric lens is larger than that of a normal lens, the contour of the workpiece could still be identified when the wheel kept a large enough distance from the focal plane, that is, the upper surface of the workpiece. Figure 13(a) and (b) indicated that the contour of the workpiece was influenced by the image of the wheel profile when the contour of the wheel radial section was 5 mm below or equal to the workpiece surface. As illustrated in Figure 13(c), the contour keeps identified when it is equal or greater than 20 mm above the workpiece surface, which can be achieved by acquiring the workpiece image when the wheel moves to the highest point of the stroke of Z-axis.
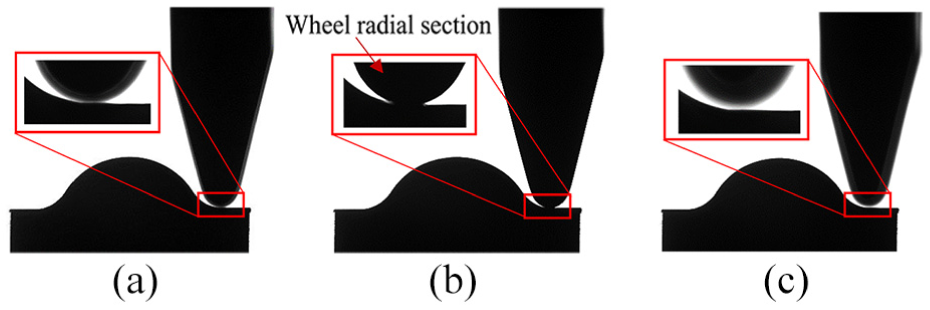
Profile images of wheel at different positions in profile grinding: (a) l = 5 mm, (b) h = 0 mm and (c) h = 20 mm.
To reduce the noise in the image and to retain detail, three types of image filtering algorithms were adopted during the preprocessing of the original image: mean filtering, Gaussian filtering and median filtering. The median filtering was found to have the best results in both suppressing noise and retaining the profile details. The subpixel localization algorithm 21 was then used in edge extraction of the grinding wheel profile preprocessed by the median filtering.
The experiment was divided into two phases. In the first phase, profile grinding was conducted without error compensation. The profile image of the workpiece was captured online using the vision system. The edge of the workpiece contour was extracted to calculate the profile parameters. In the second phase, profile grinding was conducted with error compensation under the same machining conditions. The detection and compensation processes were executed once per grinding cycle, and the tolerance range T was set to 0.01 mm. Finally, the profile parameters of the machined workpiece were measured in situ using the vision system and offline using a profiler.
The realization of online error compensation has always been a challenge in conventional CNC systems. In this study, virtual axis technology was introduced into the vision-oriented CNC system. Online compensation was realized through the motion-superposition principle (i.e. superimposing the motion of the virtual axis onto the motion of the physical axes U and V). The detected profile error was transferred to the compensation value, which was then decomposed into the corresponding virtual axes. The supplemental material provides a movie clip of profile grinding experiments.
In order to investigate the effect of processing parameters on the precision of vision system, a group of dynamic tests were designed, that is, the cross-hair images of a calibration plate were captured when the wheel moves to the top position in the Z direction under the conditions that the wheel reciprocating amplitude is 50 mm, spindle speed is 3000 r/min and wheel reciprocating frequencies are 60, 80 and 100 cycles/min, respectively. The intersection point position of the cross-hair was calculated and the effect of processing parameters on the precision of vision system was analyzed.
Results and discussion
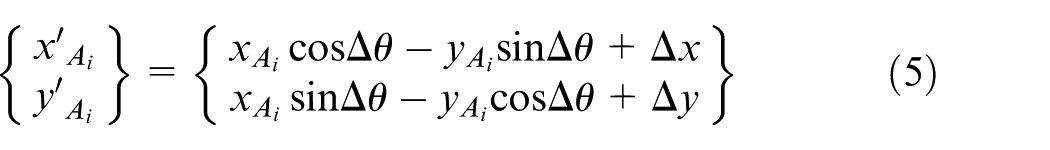
The workpiece contour image was acquired using an in situ vision system after the completion of machining in each of the cases of no compensation and compensation. Figure 14 presents the contour image of machined workpiece W with compensation. The profile accuracy was measured using image processing algorithms, and the parameters of different contour segments were calculated, including arc radius, arc roundness, coordinate of arc center for Arc a to c and straightness error for Line 1 to 2 shown in Figure 11(a). The measurement results are listed in Table 4.
(a) Contour image and (b) appearance of finished workpiece W.
Profile parameters of workpiece with and without compensation (unit: mm).
To compute the profile errors of the machined workpiece, one point was sampled from a group of continuous pixels along the actual contour after edge extraction. The contour error
For contour matching, an optimization model can be expressed as
Find
where k is the number of the contour points. The optimum contour matching model is a typical non-linear constrained optimization problem that can be solved numerically. The optimized individual contour error

The contour error distributions in the cases of compensation and no compensation are illustrated in Figure 15; in this figure, a positive value means that the point is above the theoretical contour and a negative value means that the point is below the theoretical contour.
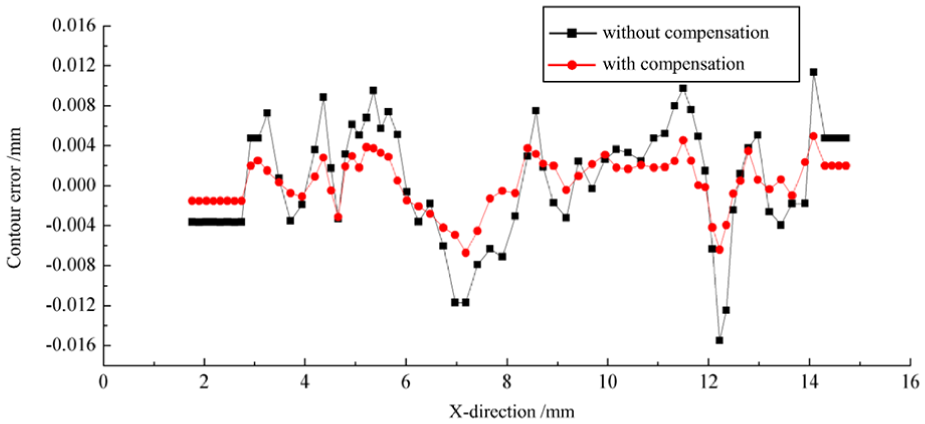
Contour error distribution of workpiece W with and without compensation.
The peak-to-valley (PV) and root mean square (RMS) values were calculated to evaluate the profile accuracy of the workpiece in the case involving compensation or that involving no compensation. The results are listed in Table 5.
Contour error measurements of workpiece W (unit: mm).
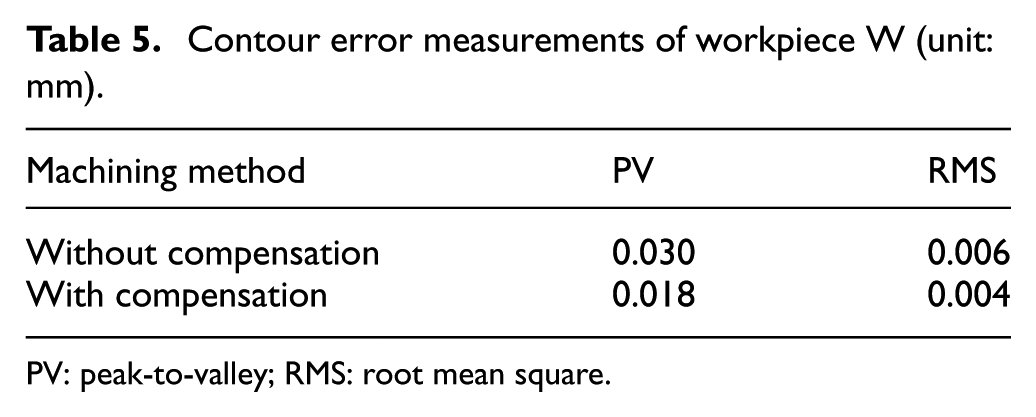
PV: peak-to-valley; RMS: root mean square.
The following findings were obtained after the analysis of the above results:
After error compensation, the relative errors of the arc radii for the three arc segments were reduced by 54%, 50% and 36% relative to the original values without compensation, respectively. The positions of the arc segments were closer to the theoretical position after compensation. In particular, the roundness determined for each arc segment decreased by 40%, 40% and 48%, indicating that the proposed online error detection and compensation method can effectively reduce profile grinding errors.
The straightness errors for Lines 1 and 2 decreased by 42% and 50% after compensation, indicating the effectiveness of the online compensation algorithm in improving the grinding accuracy of the line segment.
The PV value decreased by 40% and the RMS value decreased by 33% after compensation, indicating that the profile accuracy was effectively improved after compensation.
The experimental results were consistent with the simulation results regarding changing trends. Notably, the profile grinding accuracy was expected to be further improved by optimizing the compensation parameters and algorithm.
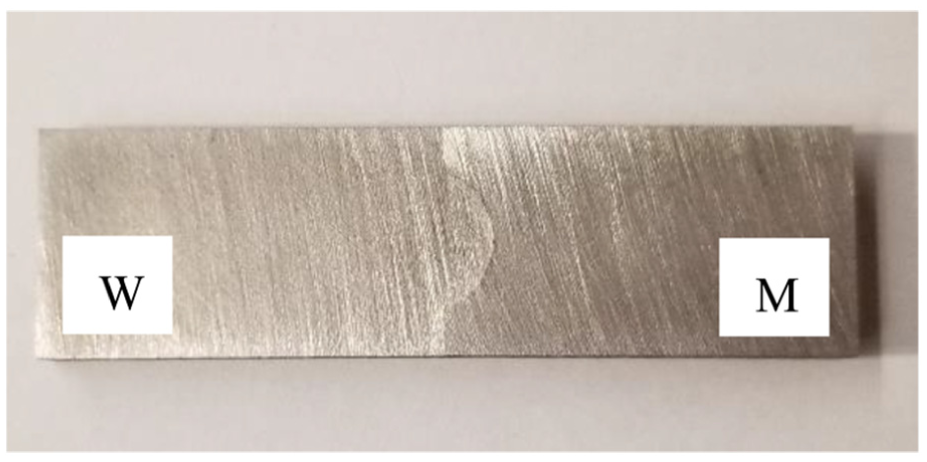
In order to further verify the effect of the proposed method, another experiment was conducted in the same procedure of first experiment for profile grinding a workpiece M, which is mirrored with workpiece W and shown in Figure 16(a). The finished workpiece M is displayed in Figure 16(b) and the contour after compensation is shown in Figure 16(c). The PV, average and RMS values for contour errors were also calculated and the results before and after compensation are listed in Table 6. The PV value decreased by 32% and the RMS value decreased by 34% after compensation, indicating that the profile accuracy was also improved after compensation. The performance of matching two finished workpieces together is displayed in Figure 17.
Contour error measurements of workpiece M (unit: mm).
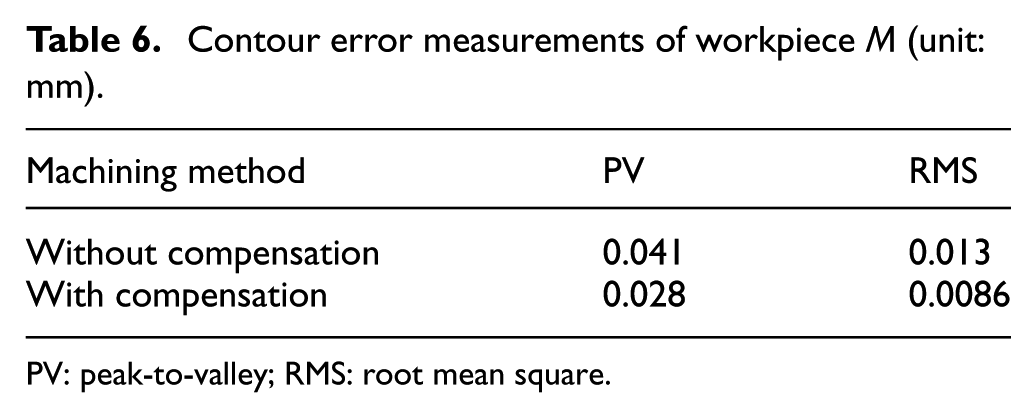
PV: peak-to-valley; RMS: root mean square.
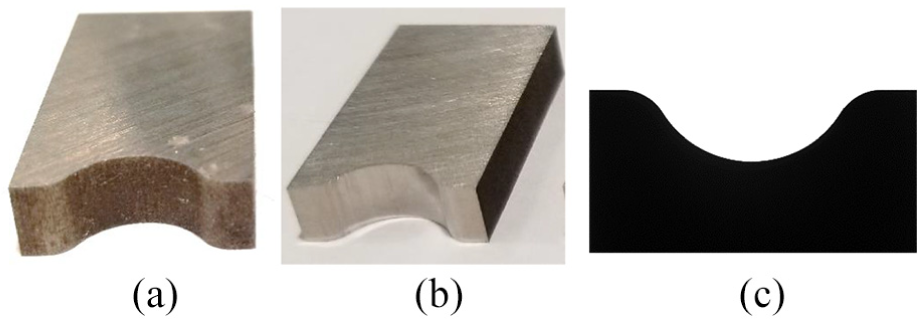
Workpiece M for profile grinding: (a) raw workpiece M, (b) finished workpiece M and (c) profile of finished M.
Performance of matching two finished workpieces.
The dynamic tests were also conducted to reveal the effects of processing parameters on the precision of vision system. The cross-hair images of a calibration plate were captured during each test under certain processing parameters described in section “Experimental setup and procedure” and the captured images are shown in Figure 18.
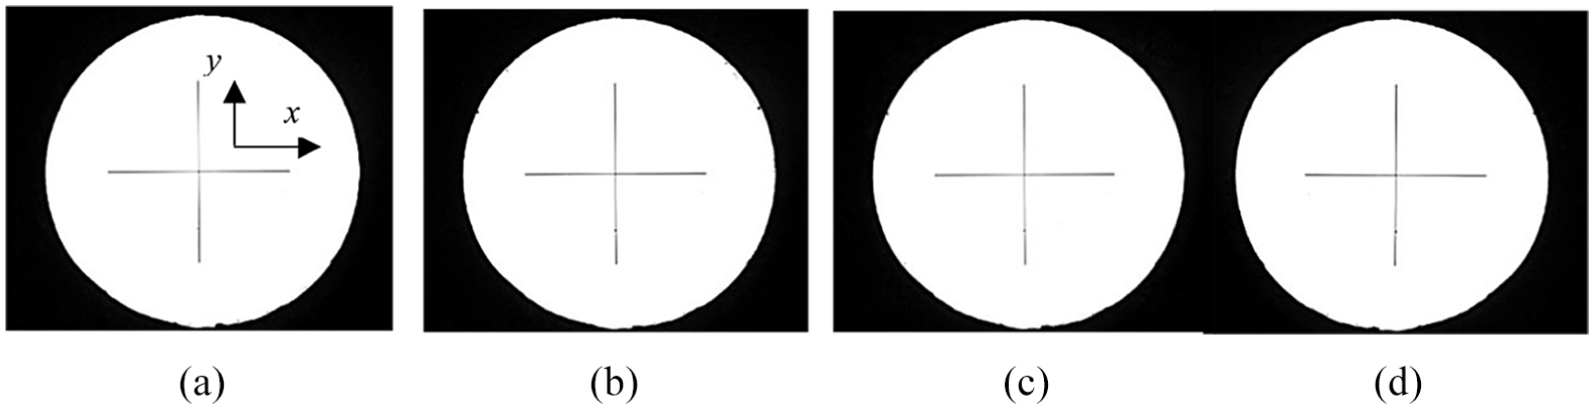
Cross-hair images captured under certain processing parameters in dynamic tests: (a) freq. = 0 cycles/min, (b) freq. = 60 cycles/min, (c) freq. = 80 cycles/min and (d) freq. = 100 cycles/min.
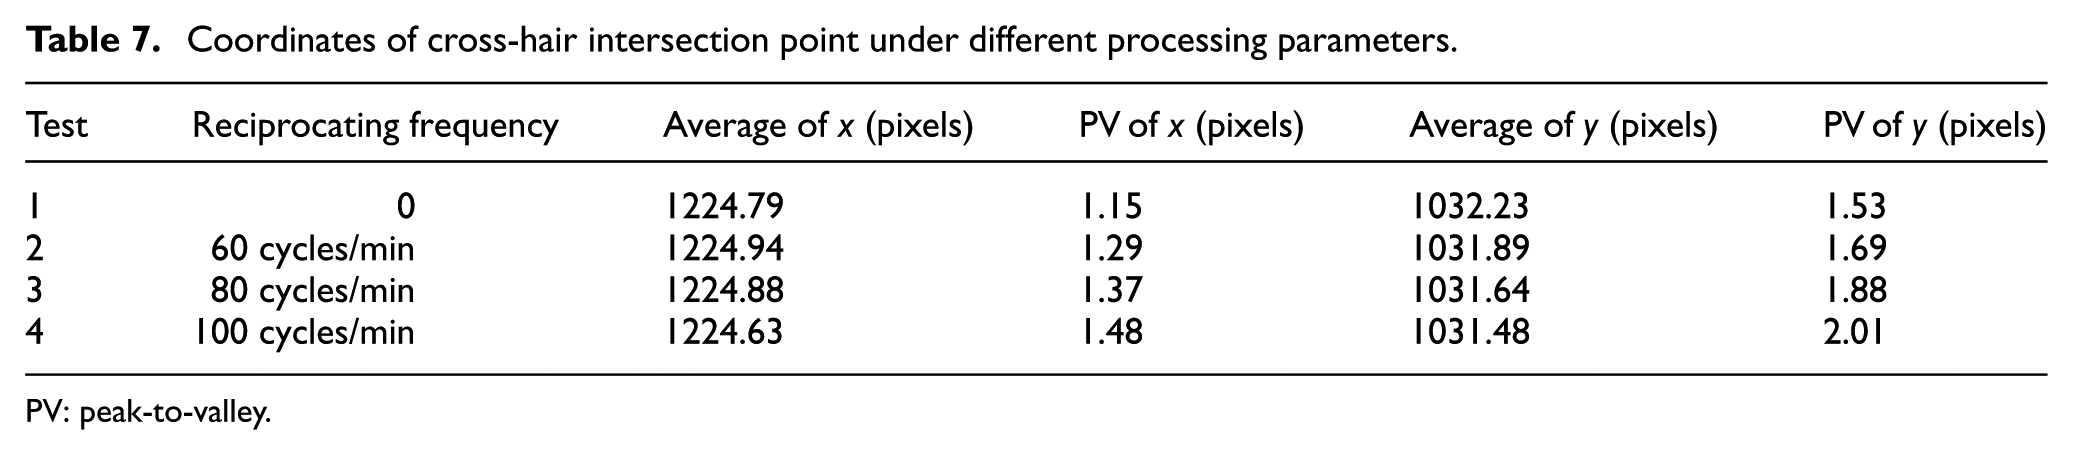
The average coordinate values of the cross-hair intersection point and the PV values of coordinate x and y were calibrated separately and listed in Table 7.
Coordinates of cross-hair intersection point under different processing parameters.
PV: peak-to-valley.
The average coordinate value of x changes within 0.3 pixels under different processing parameters, and the PV value of x for each test is less than 1.5 pixels. Similarly, the average coordinate value of y changes within 0.75 pixels and the maximal PV value of y for each test is about 2 pixels. The results indicate that the effects of processing parameters on the measuring precision of vision system are acceptable.
To verify the machine-vision-based measurement accuracy, the profile of workpiece W after compensation was also measured offline using a profiler, and the profile parameters were calculated. A 3D surface optical profiler KS1100 (made by Keyence) was used to measure the workpiece profile. The repositioning accuracy of the profiler is ±0.5 μm and the absolute accuracy is 4 μm. As the measurement coordinate system shown in Figure 14(b), the sensor scanned the profile surface of the workpiece with a step of 10 μm in the X direction and a step of 0.1 mm in the Z direction. The surface points within ±0.5 mm of the center curve in the Z direction were measured, and the average value of the Y coordinates of the points with the same X coordinate was taken as the measurement value of the contour point. The theoretical and actual profile after compensation is shown in Figure 19. The profile parameters were then calculated using the contour fitting method.
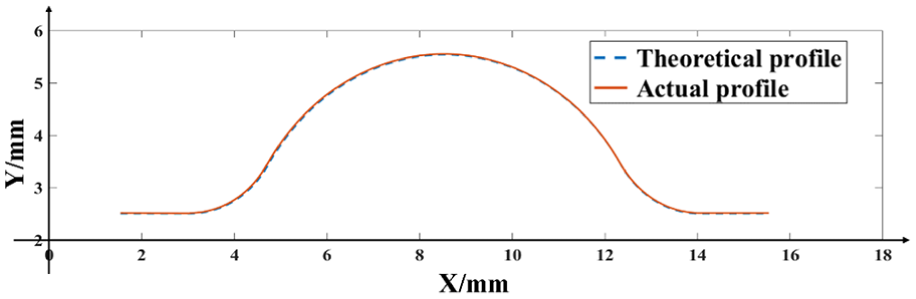
Theoretical and actual profiles of workpiece W after compensation.
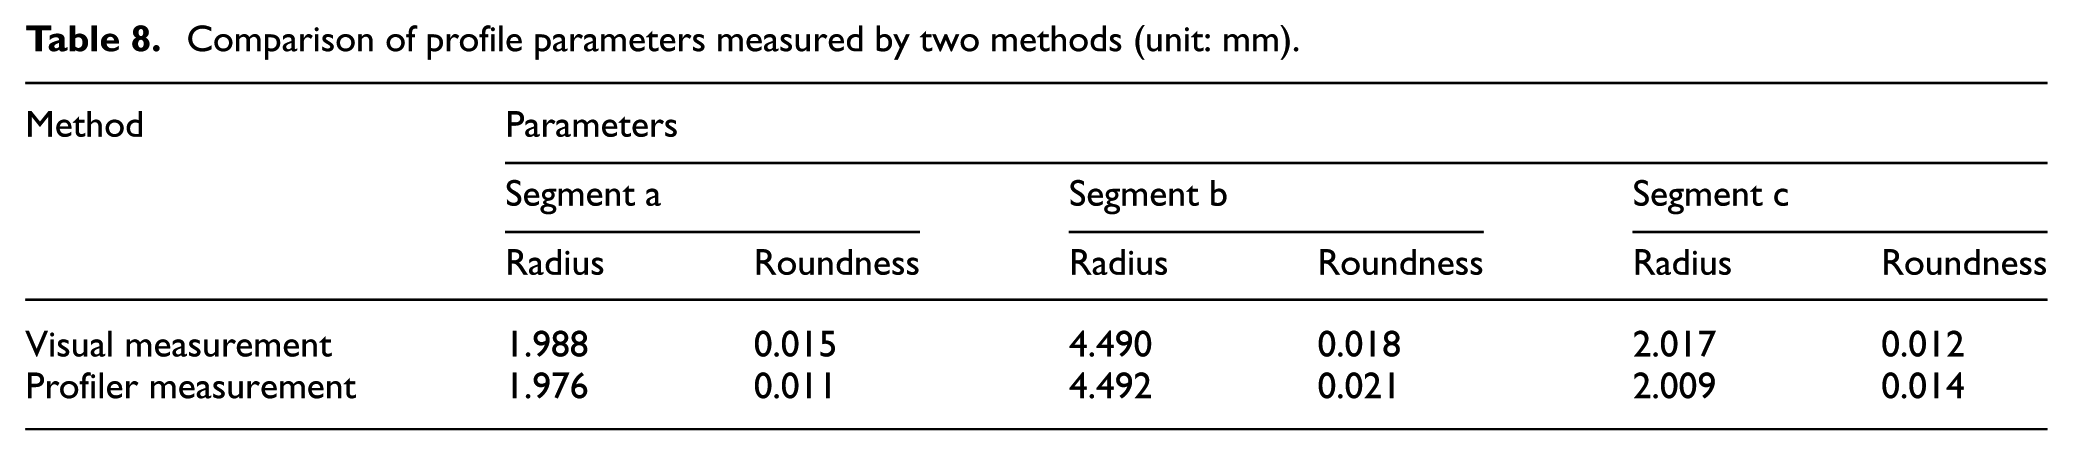
The profiler parameters including arc radius and roundness were calculated and compared with the results measured by the vision system, as shown in Table 8. The results revealed that the relative errors of arc radius for each arc segment were 0.61%, 0.05% and 0.40% and the absolute errors of roundness for each arc segment were 0.004, 0.003 and 0.002 mm. These results indicate that the measurements of the two different methods were highly consistent.
Comparison of profile parameters measured by two methods (unit: mm).
The contour error of the machined test workpiece was calculated on the basis of the measurement results of the optical profiler (Figure 20). The PV and RMS values were calculated to be 0.022 and 0.005 mm. The contour error distributions calculated on the basis of the visual and profiler measurements are illustrated in Figure 20. The average relative contour errors were within 3 µm. The results indicate that the in situ visual measurement method can meet the requirement of measuring accuracy as well as improve measurement efficiency.
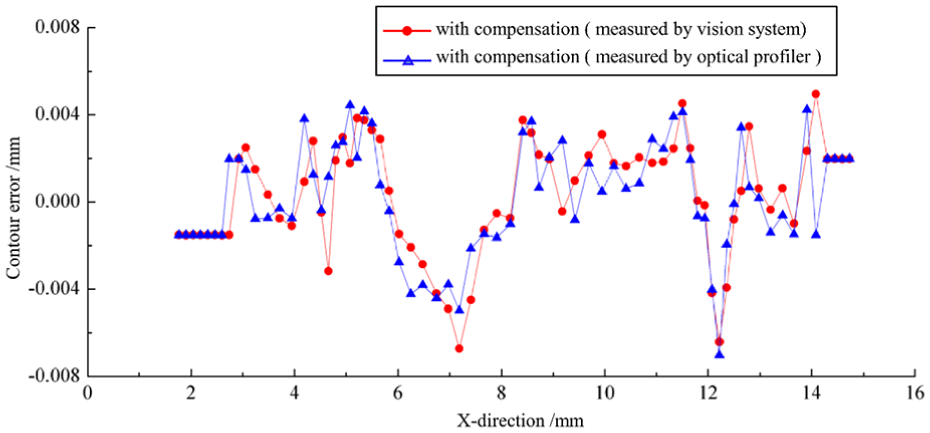
Contour error distribution of workpiece W based on two measurement methods.
Conclusion
Compared with traditional optical-enlargement-based profile grinding, the proposed processing method can achieve online detection of comprehensive machining errors caused by wheel wear, geometric errors and thermal deformation, and overcome the disadvantages such as manual dependence and only detection the error caused by wheel wear in traditional method.
The coordinated design of the grinding system and the visual system greatly reduced the vibrations-chips-induced interference with the behavior of in situ vision measurement systems. Criteria for error compensation were established and methodologies for online detection and compensation of profile errors were developed. The proposed method can achieve online error direction and magnitude identification to realize online compensation of profile errors.
A simulation and experiment were successively performed, and the results indicate that the average profile error decreased by more than 40% after compensation, signifying that the in situ visual measurement process can improve the profile grinding accuracy and measurement efficiency. This validates the effectiveness of the proposed processing method for profile grinding of contour surfaces.
The findings of this study can be extended to in situ measurement of grinding wheel wear and determining the dressing time for the grinding wheel. It also provides a reference for the direct measurement of machining errors in other machine tools.
Footnotes
Declaration of conflicting interests
The author(s) declared no potential conflicts of interest with respect to the research, authorship and/or publication of this article.
Funding
The author(s) disclosed receipt of the following financial support for the research, authorship and/or publication of this article: The authors would like to thank the National Natural Science Foundation of China (Grant No. 51575350) for providing financial support for this study.
Supplemental material
Supplemental material for this article is available online.
References
Supplementary Material
Please find the following supplemental material available below.
For Open Access articles published under a Creative Commons License, all supplemental material carries the same license as the article it is associated with.
For non-Open Access articles published, all supplemental material carries a non-exclusive license, and permission requests for re-use of supplemental material or any part of supplemental material shall be sent directly to the copyright owner as specified in the copyright notice associated with the article.