
Abstract
In the experiment, delayed cracks in deep drawing processes of metastable stainless steel SUS304 cylindrical cups were prevented using elevated blank holding force aided by nanolubrication. Besides tensile residual hoop stresses, the elimination of the cracks was also attributed to the change in wall thickening profile along the wavy cup edges. The wall thickening is a result of the high circumferential stress acting in the flange, leading to the high concentration of deformation-induced martensite and high risk of cracks. The amount of increase in wall thickness in the valleys along the edge during the deep drawing process was higher than the peaks at low blank holding force range due to shorter heights. Therefore, the portions of blank equivalent to the valleys were subject to higher holding force during the process, resulting in decrease in degree of wall thickening with increase in height for blank holding force up to 25 kN. However, the wall thickening and the height increased at blank holding force of 28 kN due to the same amount of increase in wall thickness in both valleys and peaks, resulting in a larger contacting area and lower holding force. Therefore, the wall thickness in the valleys sharply increased, and the formation of the cracks persists. Within the crack-free range, that is, from 29 to 31 kN, both the heights and wall thickening decreased. The decrease in frictional force by means of the nanolubrication has facilitated the flow of material into the die, resulting in lower cup height. It also facilitated the flow of materials away from the thick valley regions under the high pressure, resulting in significant decrease in degree of wall thickening. The cracks were prevented. The amount of compression at blank holding force of 32 kN was insufficient to suppress the increase in wall thickening in valleys, resulting in the formation of the cracks again.
Keywords
Introduction
Stainless steel parts such as kitchen utensils and some auto components are formed with deep drawing processes in the industries. However, residual stresses are developed along the sidewalls of the drawn parts, resulting into delayed cracking and dimensional accuracy problems, particularly for SUS304 metastable stainless steel products. The formation of the delayed or longitudinal cracks in the SUS304 drawn cups is mainly due to the coexistence of hydrogen in the material, deformation-induced α′-martensite, and tensile residual stresses. The hydrogen exists in the steels as an inevitable impurity after the steel manufacturing processes. Even the tiniest amount of hydrogen is adequate to cause cracking. 1 The small amount of hydrogen is mainly absorbed from the environment during the manufacturing process or from the water contained in raw materials or in furnace gases. During the deep drawing process, the metastable austenitic microstructures of the stainless steels tend to transform into more stable and less ductile α′-martensites. The highest amount of α′-martensite is formed along the cup edge at the limiting drawing ratio due to high compressive hoop stresses. The cracks initiate from the edge and propagate along a longitudinal direction toward the cup bottom. The chances for the cracks increase for the increase in the amount of the strain-induced martensite. Xu et al. 2 increased the volume fraction of strain-induced martensite by pulsating load in hydroforming processes of austenitic stainless steel tubes, resulting into an enhanced transformation-induced plasticity effect. Tan et al. 3 reported the disappearance and reappearance of the delayed cracks under enhanced blank holding force (BHF) using nanolubrication in the deep drawing process of SUS304 cylindrical cups at its limiting drawing ratio. They reported that the elimination of the cracks under the high BHF was attributed to the decrease in α′-martensite and the lower tensile residual stress gradient developed along the outer cup surfaces in the cracked regions only. However, the roles of the deformation behavior, that is, the evolution in heights, wall thickening profiles along the cup edges covering both cracked and crack-free regions, dimensions, and two-dimensional (2D) distribution of residual stresses during the deep drawing process, were not explained in detail. A crack-free BHF range exists during the increase in BHF in the process. A significant decrease in volume fraction of α′-martensite was obtained in the X-ray diffraction (XRD) analysis when the cracks were successfully eliminated. The development of the residual stress distribution along the sidewall of the drawn cup is influenced by many factors. Siebel and MuÈhlhaÈuser 4 reported the effect of the die corner radius and the punch diameter on the axial residual stress distribution in deep drawn brass cups. Lange and Bruckner 5 investigated the effect of the punch nose radius on the residual stresses. Weiergräber and Gräber 6 stated the effect of the nickel content on the residual stresses in deep drawn austenitic stainless steel cups. Danckert 7 reduced the residual stresses with a drawing die having a tractrix-shaped profile. Reducing the tool clearance such that ironing occurs simultaneously with deep drawing causes a great reduction in the residual stresses. 8 Fereshteh-Saniee and Montazeran 9 described that residual stresses introduced in a deep drawn cup are mainly caused by the unbending of the material when it leaves the draw die profile. Ortega et al. 10 concluded that tangential residual stress is the most vital factor contributing to the delayed fractures in SUS304 drawn cups. Sherbiny et al. 11 investigated the effect of initial blank thickness, BHF, and different types of lubricants and friction coefficients on the maximum residual stress distribution of mild steel drawn cups using three-dimensional (3D) finite element (FE) simulation. Demirci et al. 12 reported the influence of increase in BHF on the equivalent stress distribution, cup height, and wall thickness distribution of deep drawn Al1050 cups. Asadian-Ardakani et al. 13 applied non-uniform BHF to improve the weld line displacement in deep drawing processes of tailor-welded interstitial free (IF) steel blanks. Tandon and Sharma 14 investigated a combined process of incremental sheet metal forming and deep drawing. They achieved 300% lower reduction in thinning than the ones obtained from each process separately at the same forming depth. Due to the smaller wall thinning, 100% increase in drawing height was also obtained. Zhang et al. 15 introduced a multi-point forming process as a preforming step before conducting the incremental sheet forming processing to improve the material flow and the thickness distribution of the sheet parts. With the optimal preform design, they formed parts with more uniform thickness distribution and reduced processing time. Although the prevention of delayed cracks in deeply drawn SUS304 cylindrical cups is possible with the incremental sheet metal forming process by controlling the wall thickness distribution along the cup edge, the material yield and the productivity are lower than the conventional deep drawing process. Deep drawing process is also an excellent opportunity in the drawing of multilayer metal and composite material sheets to complex shapes. 16 Shot peening, ironing, 17 or multistage deep drawing 18 processes had been used to eliminate the cracks. However, in most of the studies related to the residual stress distribution, only one-dimensional (1D) distribution following an arbitrary longitudinal path along the cup surface was reported, as the blank material was treated as isotropy in the process. There is a possibility that the path not passing the cracked point and the residual stress analysis becomes meaningless. The 2D distribution of residual hoop stresses along the outer surface of the cup taking into the consideration of the anisotropy property are required for better understanding of its role in the formation of the delayed cracks. However, it is difficult, costly, and inaccurate to obtain such a distribution with the conventional measurement methods such as XRD analysis or ring slitting tests.
In this study, the elimination of the delayed cracks under the elevated BHF using nanolubrication was explained from the perspective of the deformation behaviors, dimensions, and 2D distribution of residual stresses during the deep drawing process obtained from both the experiment and 3D FE simulation covering both cracked and crack-free regions along the cup edges. The interrelationship among these factors on preventing the cracks was explained in detail.
Conditions for FE simulation
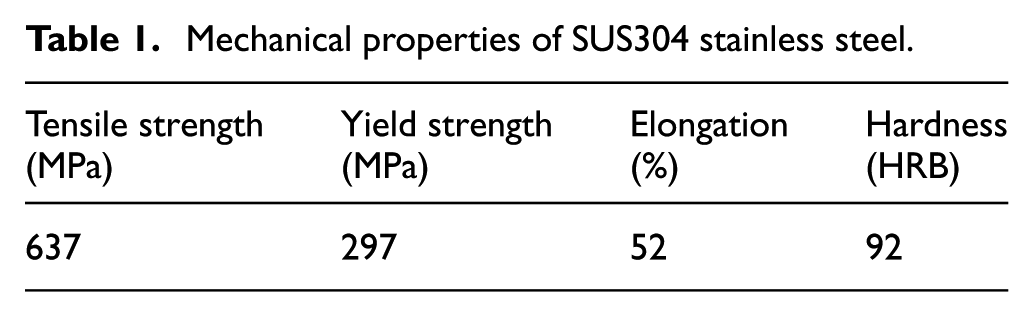
Table 1 shows the mechanical property of the as-received stainless steel sheet SUS304 obtained from the uniaxial tensile test using a laser-cut specimen at an angle of 0° from the rolling direction. Both tensile strength and total elongation of the sheet are high.
Mechanical properties of SUS304 stainless steel.
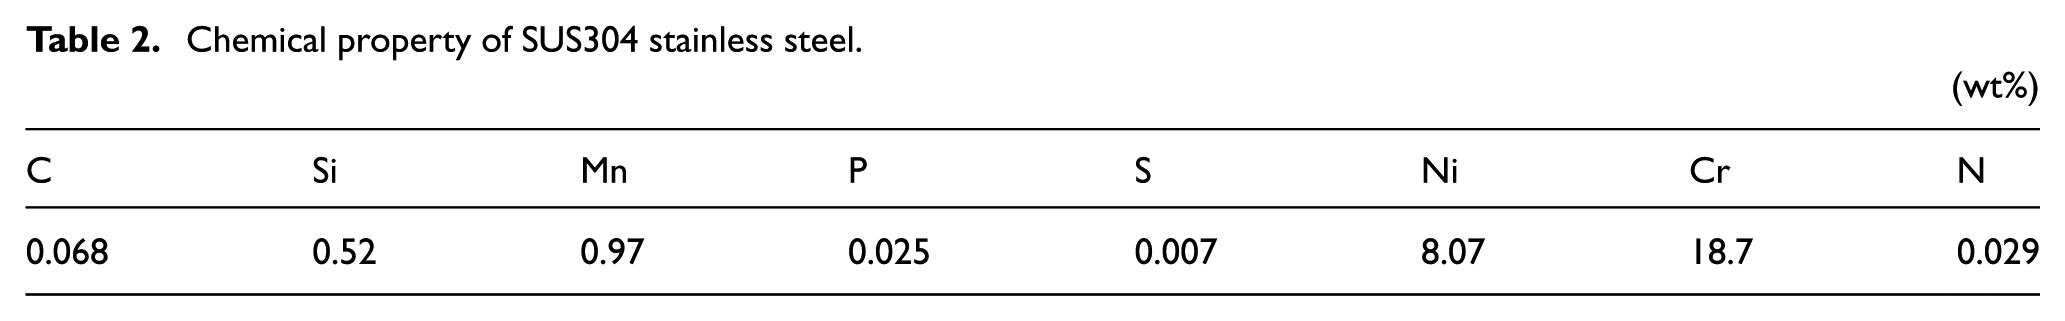
The chemical composition of the SUS304 (18Cr–8Ni) stainless steel is presented in Table 2. It is a metastable, low-nickel austenitic stainless steel.
Chemical property of SUS304 stainless steel.
Uniaxial tensile tests were performed to obtain the mechanical and the anisotropic properties of the sheet. The specimens were cut according to the Specimen No. JIS 13B as specified in JIS Z 2201:1998 standard. The tensile tests were conducted following the JIS Z 2241:2011 standard at a strain rate of 0.003/s. Specimens were cut at angles of θ = 0°, 45°, and 90° with respect to the rolling direction of the sheet. Two specimens were cut for each angle to prevent the scatter of the test results. The specimen was axially aligned with the jig to ensure it is pulled in straight axis during the test. Before conducting the test, the tensile machine was calibrated via a loading fixture by comparing the indicated values of the test forces against the readings of the reference standard. The cut edges, particularly at the reduced section, were polished with sand papers to eliminate the hardened oxide layers. The engineering stress–strain relationship and the flow curves are presented in Figure 1.
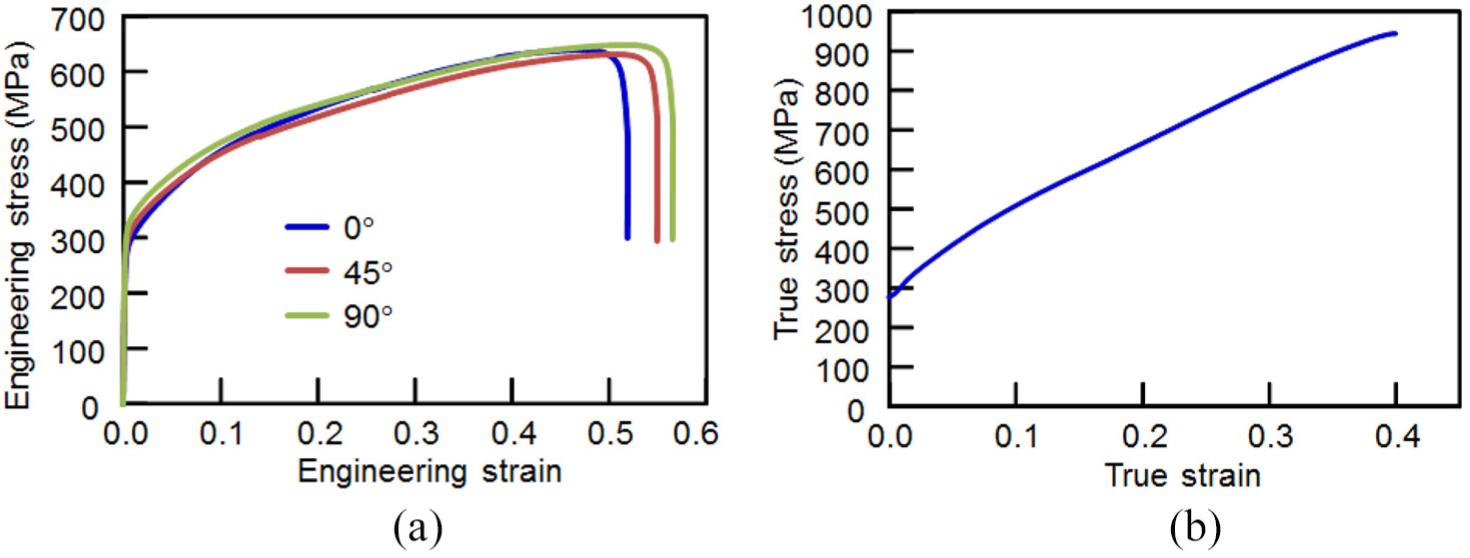
Engineering stress–strain and flow curves of SUS304: (a) engineering stress and strain, and (b) flow curve.
The simulation conditions are summarized in Table 3. The Lankford’s coefficients
Simulation conditions.
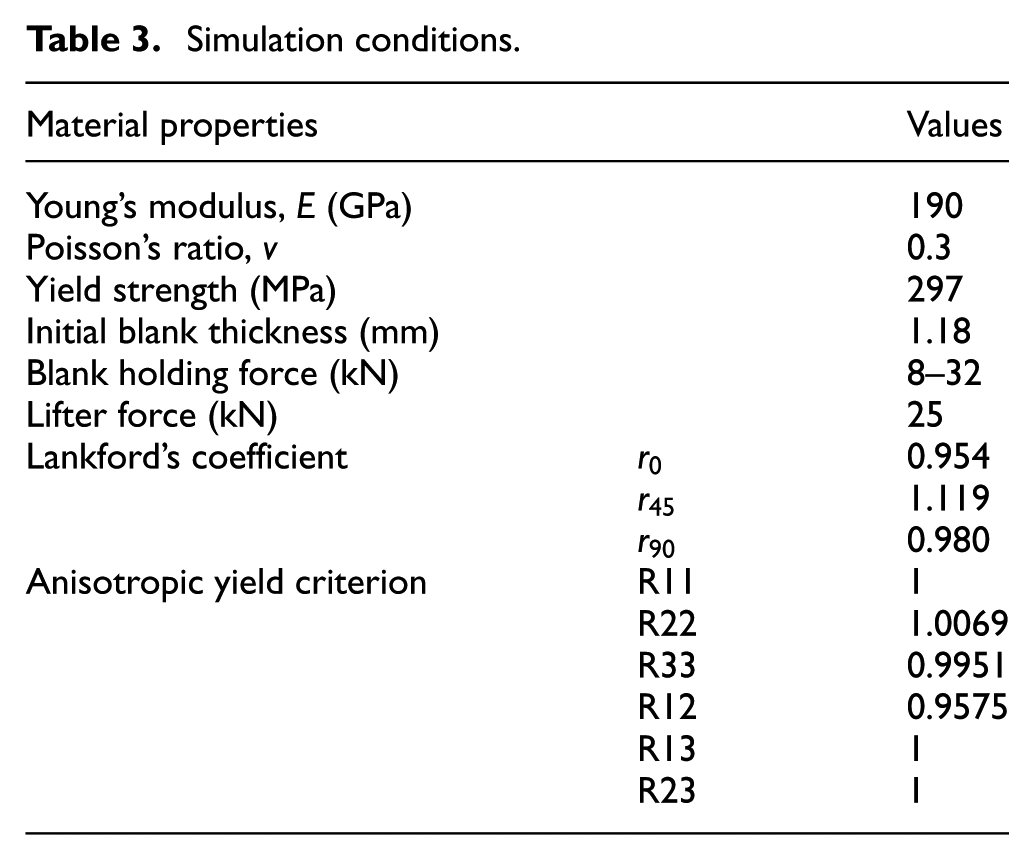
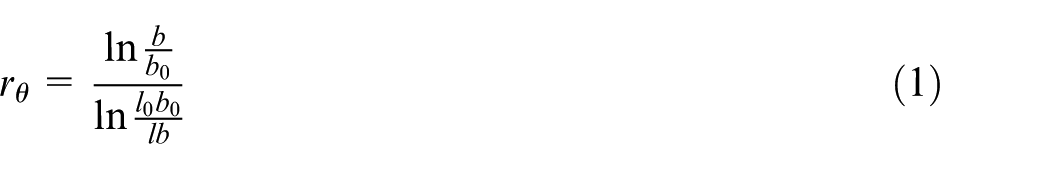
In the simulation, the ABAQUS built-in Hill’48 anisotropic yield criterion was used to describe the anisotropy of the sheet metal. The major advantage of the Hill (1948) function is that it gives an accurate description of yielding of steel sheets. 19 The model has a simple formulation for the 3D modeling, and it can only be applied to drawn cup with four ears in axisymmetric deep drawing. 20 The drawn cups obtained in this study have exactly four ears. The Hill’s 21 function can be expressed as
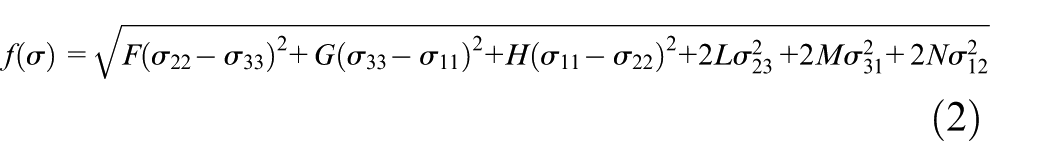
where
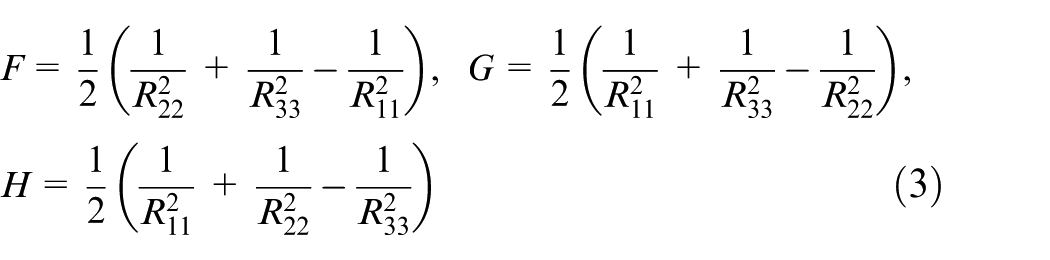
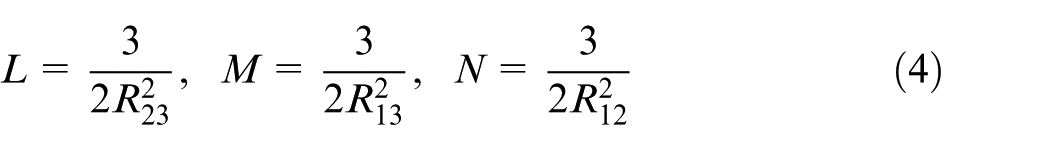
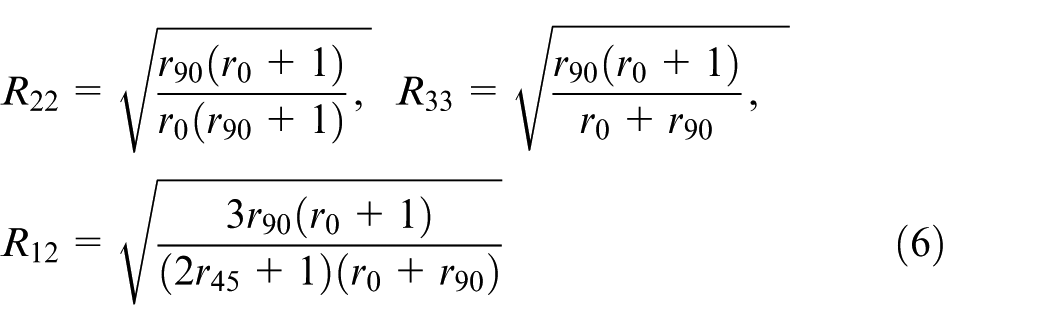
The material orientation was assigned in such a way that the yield ratios of R11, R22, and R33 indicate the rolling, transverse, and normal directions, respectively, of the sheet metal.
In sheet metal forming application, anisotropic material data are commonly used in terms of ratios of width strain to thickness strain. The stress ratios shown in Table 3 were calculated from the Lankford coefficients using equations (5) and (6). Isotropic hardening was assumed for the material work behavior in the simulation

Only a quarter model of the deep drawing process was treated in the 3D FE simulation using ABAQUS, Version 6.11 (see Figure 2), due to the symmetric boundary conditions and for reduction in computational time. Since ABAQUS/Standard is more efficient for solving smooth nonlinear problems, it was employed for the simulation. The type of incrementation for step time was set at automatic mode. Direct method with full Newton solution technique was used in the equation solver. The x–z and y–z planes are the planes of symmetry of the model. All degrees of freedom for the nodes surrounding the bottom center of the cup were fully constrained except for the z-axis. All tools were modeled as discrete rigid and meshed with four-node tetrahedral elements. The blank has an initial wall thickness of 1.18 mm and was divided into deformable 3D shell elements (four-node doubly curved thin shell, reduced integration, hourglass control, finite membrane strains) with five integration points across its thickness following Simpson’s rules. Since the solid elements have locking problem during bending, shell elements were used to model the thin sheet in this study as it consumes less disk space for the results and the post-processing of the shells is faster. The average mesh size of the blank is 1.2 mm. The blank was defined as an elastic–plastic material model following the isotropic hardening law. A ring-shaped insert was added between the holder and the die outside the circumference of the blank. It was divided into deformable shell elements with a wall thickness of 1.16 or 0.02 mm less than the blank thickness to prevent the direct contact between the two rigid tools after the flange being pulled out from the holding region. Hence, the termination of the simulation process was prevented. A lifter force of 25 kN was applied to the flat bottom of the cup in the simulation only for establishing a more stable contact between the tools and the blank surfaces in the simulation. The lifter force will not influence the residual stress distribution at the sidewall as the amount of deformation at the cup bottom is negligible. The coefficients of friction (COFs) for all BHFs were determined by matching the simulated peak loads with the experimental ones. Other interfaces were assumed in dry contacts with an assigned penalty COF of 0.5.
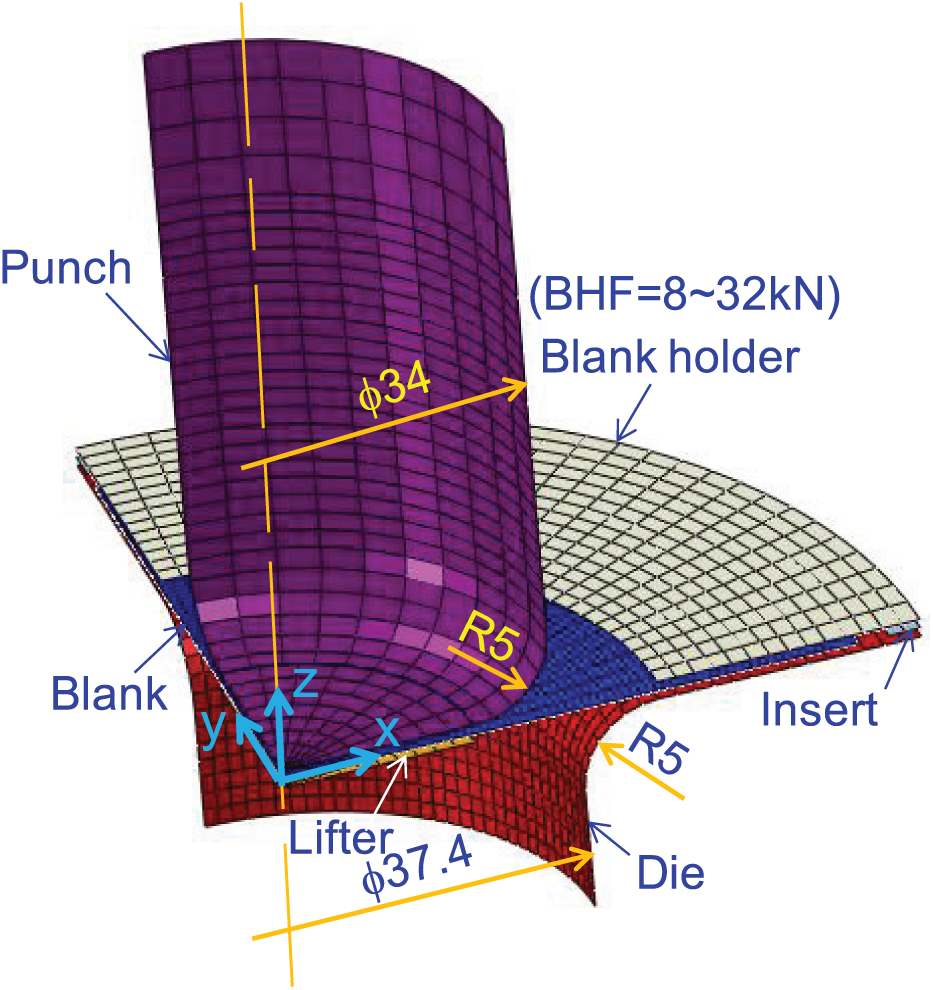
A quarter FE model of deep drawing process.
In the experiment, the drawing test was performed with a finely polished and uncoated die made of SKD 11 tool steel. The blank holder and the die were polished with sand papers followed by lapping with diamond paste (average size of 3 µm). A commercial stamping lubricant with a viscosity of 285 cSt at 40°C was used as a base for the preparation of the nanolubricant. The interfaces for the holder-blank and the die-blank were well lubricated with 2 wt% SiO2 nanolubrication. Tan et al. 22 have applied the same nanolubricant for preventing seizure in a combined deep drawing and ironing process of ultra-high strength steel cylindrical cups. The hardness of the spherical nanoparticles SiO2 obtained from the product data sheet is 1000 Hv, which is approximately 5.6 times higher than the blank with an average size of 5 to 15 nm. The mixture of the lubricant and the spherical nanoparticles in the boundary lubrication prevent the direct contact between the surface asperities of the tool and of the workpiece, particularly at high contact pressure. The relative movement of the nanoparticles at the contact interface facilitates the sliding of the tool over the workpiece surface under high contact pressure; hence, the frictional force is reduced. 23
The movement of tools during deep drawing process in the simulation is illustrated in Figure 3. The punch is divided into two parts, that is, the flat bottom and the vertical section with a punch corner. The whole punch moves till the end of the drawing stage. In the tool separation stage, the flat bottom remains in its position, while the vertical section and the drawing die move diagonally upward from the sidewall of the cup. This movement could avoid the unstable simulation process resulting from the curled cup mouth sliding along the rigid tool surfaces if both tools are moved vertically. Same setting was used in both the loading and unloading steps in the simulation.
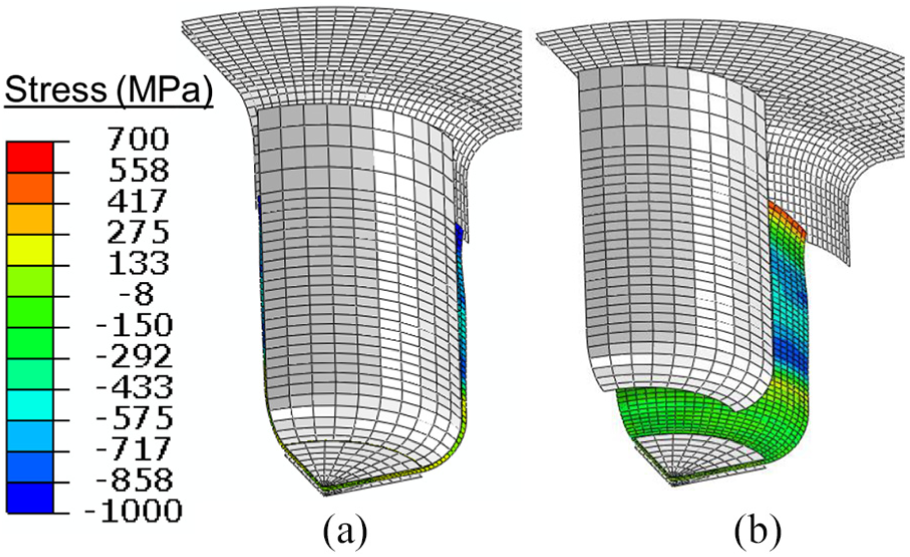
Movement of tools during deep drawing process in simulation: (a) end of drawing and (b) after tool separation.
Results and discussion
The comparison of the hoop stress distributions at the inner and the outer surfaces of the cups between the end of the drawing stage and after the tool separation stage for BHF of 8 kN is described in Figure 4. The FE model and the original simulated results were initially constructed and calculated based on a Cartesian coordinate system (x, y, z). In the post-processor, the Cartesian coordinate system was replaced by a Cylindrical coordinate system (r, ϕ, ι) constructed at the bottom center of the cup. The stress distributions of the cups were transformed from coordinates (x, y, z) into cylindrical coordinates (r, ϕ, ι). The distribution of the hoop stress can then be obtained by setting the output field of stress in θ direction. The simulated results agreed well with the results reported by Gnaeupel-Heorld et al. 24 for a depth distribution of residual stress of AL6022 deep drawn cups obtained with the synchrotron XRD and the ring slitting test. In their report, the tangential residual stresses along the outer cup surface around the mid-cup height are positive (tensile), and the ones along the inner cup surface of the same region were negative (compressive). In Figure 4, the calculated tangential residual stresses along the outer cup surface around the mid-cup height ranged from 484 to 579 MPa, and the ones along the inner cup surface of the same region ranged from −409 to −542 MPa. At the end of the drawing stage, high degree of compressive stresses were observed in the valley points along the earring profile of the cup particularly at the inner surface due to the circumferential compression in the flange during the drawing process. A very high tensile stress distribution was obtained along the outer surface at the upper half section of the cup except the earring portion. After being separated from the tools, the hoop stress at the valley point increases significantly from compressive to high magnitude of tensile. Due to the sharp increase in hoop stress after being separated from the tool, delayed cracks tend to occur at the valley points.
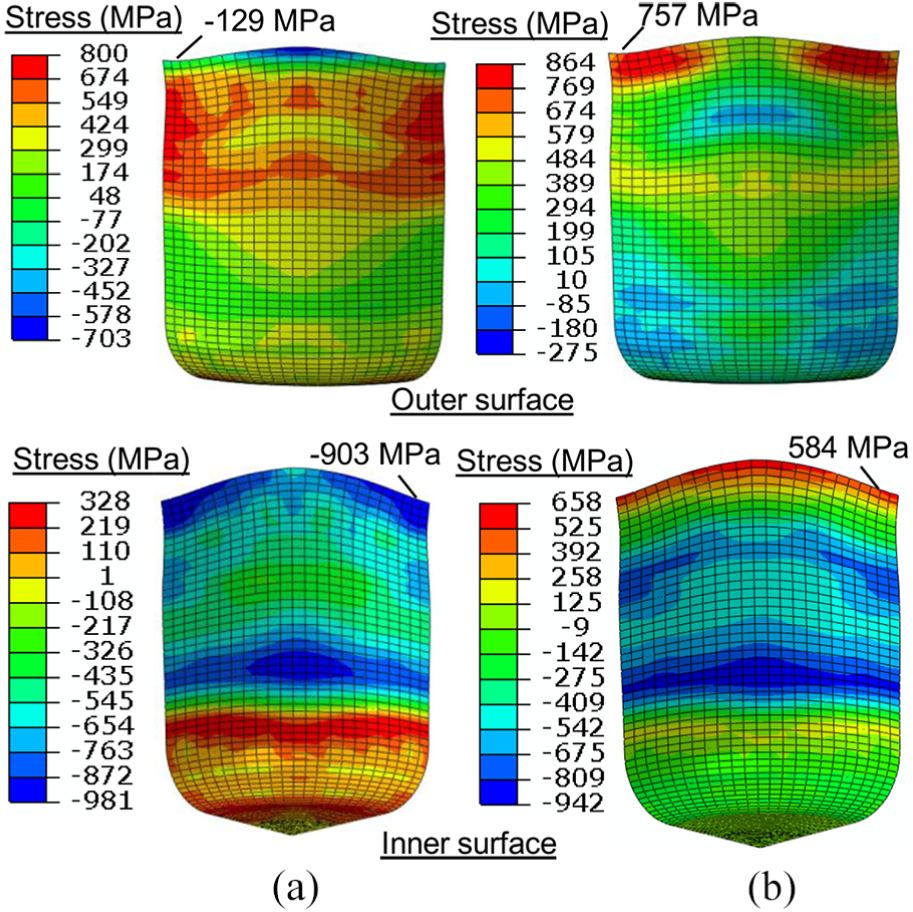
Hoop stress distributions at inner and outer surfaces of cups at the (a) end of drawing stage and (b) after the tool separation stage for BHF of 8 kN.
The comparison of the drawn cups between the experiment and the simulation for increase in BHF is shown in Figure 5. A minimum BHF of 8 kN is required to suppress the wrinkles in the deep drawing test. Delayed cracks (as indicated by the arrows) were observed in drawn cups for BHF of 8 kN in the experiment. The BHF was increased with an increment of 1 kN until the delayed cracks were eliminated at BHF of 29 kN. The volume fraction of strain-induced martensite significantly reduced by half from BHF of 28 to 29 kN resulting into the elimination of the cracks. 3 The increment of BHF continued until the reformation of the cracks again at BHF of 32 kN. A crack-free BHF range of 29 to 31 kN was obtained in the experiment. No cracks were observed within the range, as the volume fraction of the strain-induced martensite was maintained at the same level. 3 The cracks were observed again beyond the range due to the decrease in elongated cup height and high thickness strain particularly in valley points (see Figure 10). The cracks have disappeared and reappeared again when the BHF is increased to an extreme level with the aid of nanolubrication. High concentrations of tensile residual stress were obtained around valley points along the top edge of the cups in the simulation. The simulation has successfully predicted the location of the cracks. However, the maximum tensile residual stress increases with the increase in BHF. No decrease in maximum stress was observed for BHF of 29 kN. Since the plastic property of the blank material was defined by the true stress and true strain curves (see Figure 1(b)), the calculated maximum tensile residual stresses were higher than its ultimate tensile strength (i.e. 637 MPa).
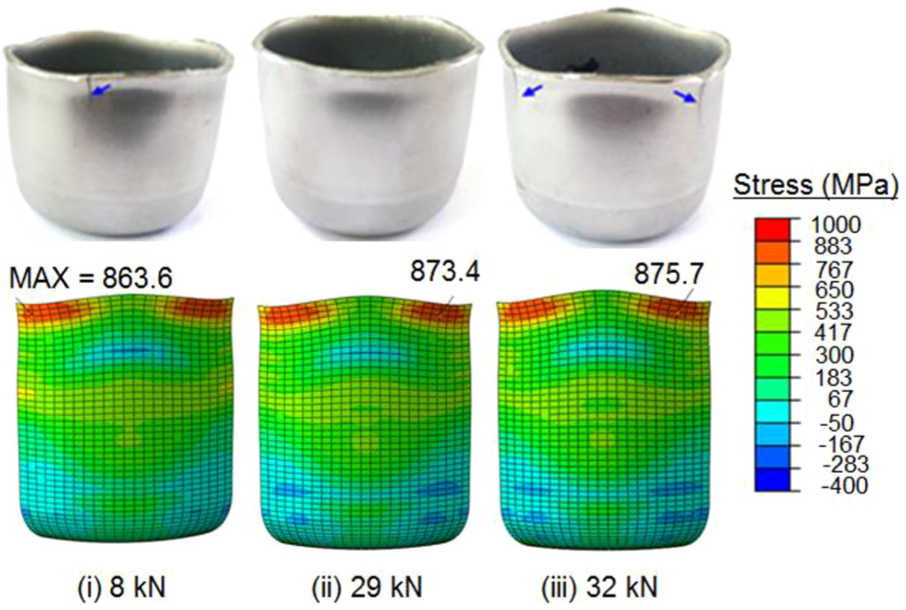
Comparison of drawn cups between experiment and simulation for increase in BHF.
The distribution of the hoop stresses along a longitudinal path passing through a valley point for different BHFs obtained from the simulation is shown in Figure 6. After being separated from the tools, the residual stress in the middle section for all cups reduces by 100 to 200 MPa. The stress around the valley point increases significantly from 100 MPa compressive to above 800 MPa tensile. The peak stresses were obtained at 2 to 3 mm below the valley point. After unloading, the decrease and the increase in stresses in the middle and the upper sections of the cups, respectively, lead to the increase in stress gradient for cup height above 25 mm. The chance for delayed cracks increases for high stress gradient. However, the residual stress gradients reduce for increase in BHF as a result of elongated cup height. The elimination of the cracks may be attributed to the decrease in stress gradient in this section. Nonetheless, there is no recovery from the decline in stress gradient at BHF of 32 kN for the reappearance of the crack. In comparison, the stress gradient along the longitudinal path passing through the peak point for the same cup height is much lower than that for the valley point. Therefore, the chance for delayed cracks is higher for valley points. Since the longitudinal paths for the valley points passed through the boundaries of different stress zones, fluctuations were observed in the curves within the cup height range of 17 to 25 mm. Different stress zones were formed at the same height level due to the anisotropy property of the material. According to the literature, residual hoop stress distributions along the cup height of metastable stainless steels are always in bell shape.25,26 The residual hoop stress distribution along the longitudinal direction below the peak point in Figure 6 is in bell shape. In this path, the magnitude of the hoop stress in the middle height is higher than the upper and lower cup heights.
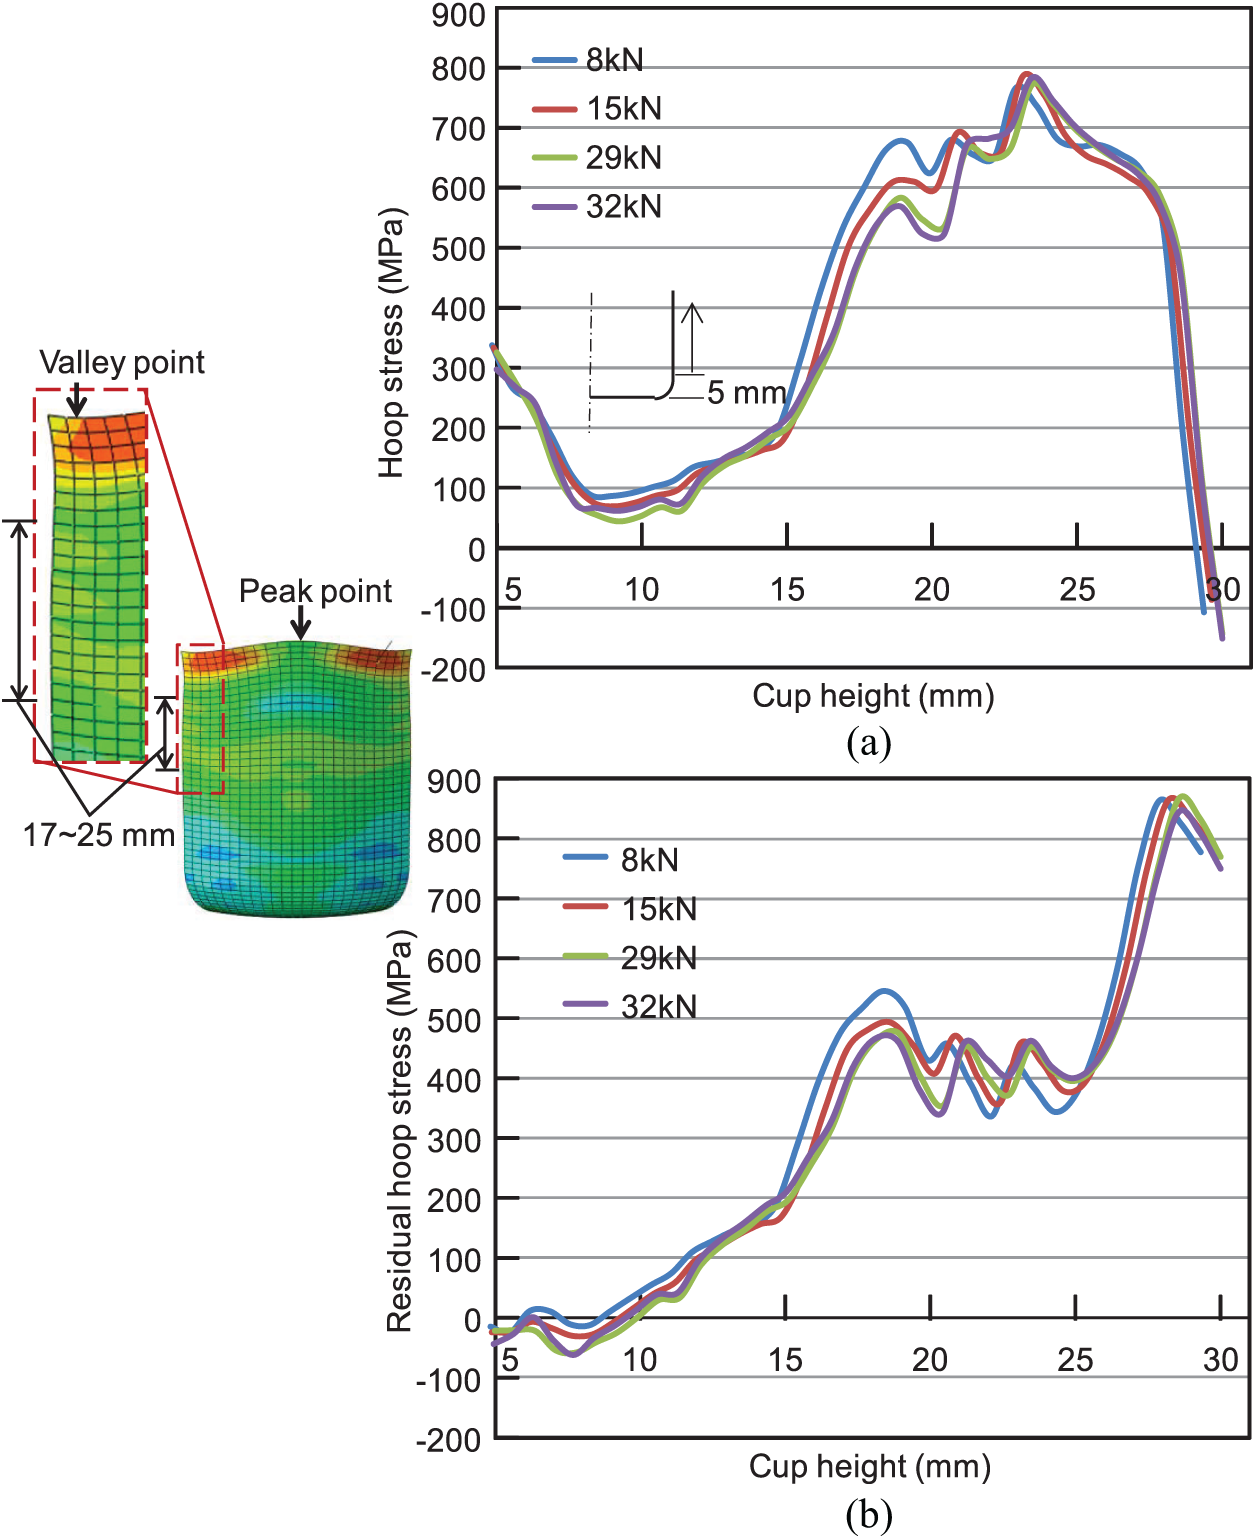
Distribution of hoop stresses along longitudinal path passing through valley point for different BHFs obtained from simulation: (a) at bottom end and (b) after separation from tool.
The cross-sectional shapes of the drawn cups for different BHFs obtained from the simulation are shown in Figure 7. The upper sections of the cups are slightly straightened and elongated for increase in BHF. However, the change in cross-sectional shape between the crack-free cup formed with 29 kN and the one with cracks formed with 32 kN is not significant. The dimensional accuracy of the cup is improved with the increase in BHF.
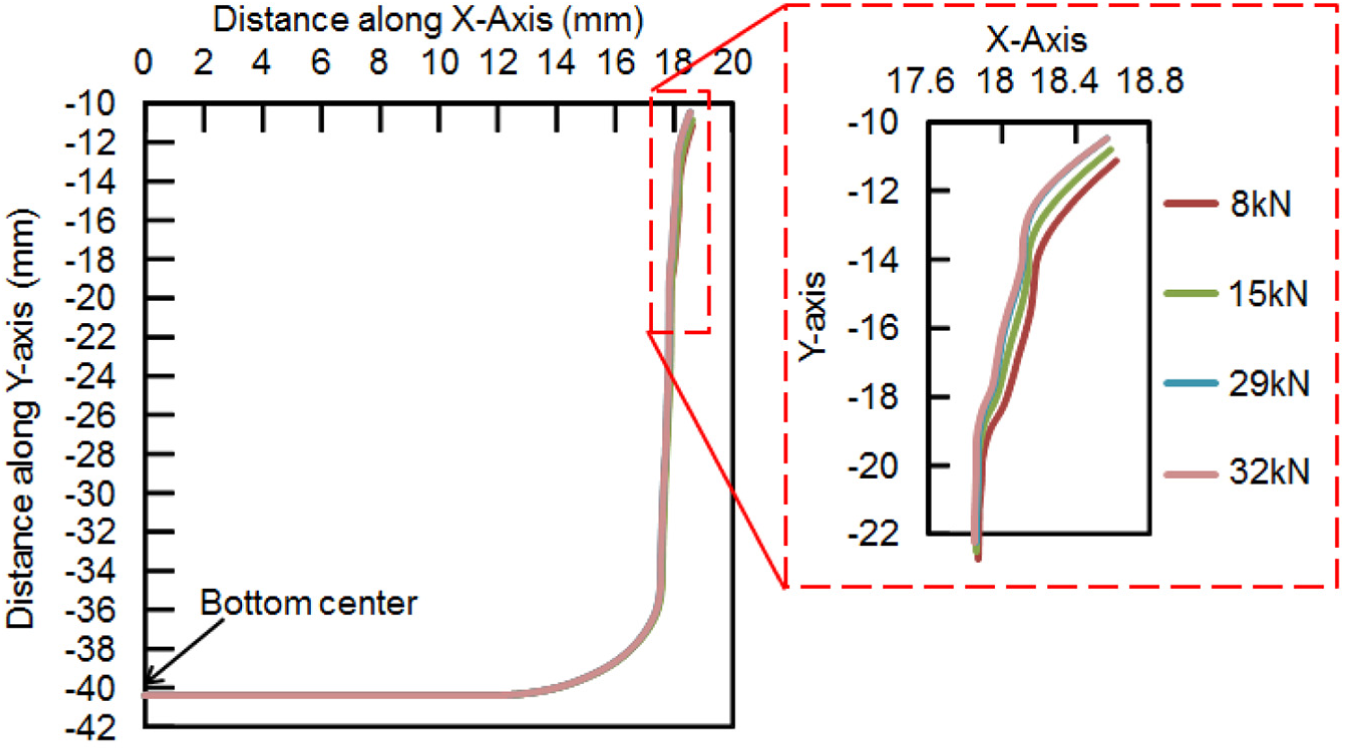
Cross-sectional shapes of drawn cups for different BHFs obtained from simulation.
The relationship between the COF in the simulation and the peak forming loads for different BHFs is shown in Figure 8. Overall, no significant increase in experimental peak loads when the BHF is significantly increased from 8 to 32 kN due to the extreme pressure performance of the nanolubrication. However, the peak load slightly increases when the BHF is low, that is, up to 25 kN. The effectiveness of the nanolubrication was observed from BHF of 28 kN and above. The peak load slightly reduced at BHF of 28 kN, indicating that the optimum performance of the lubricant has been achieved. The increase in peak load after that may be attributed to the increase in frictional force resulting from the removal of the surface asperities by the relative motion of the nanoparticles at the interface. The simulated peak loads are matched with the experimental ones by controlling the COF. Overall, the simulated peak loads are 1% to 2% lower than the experimental ones. Further increase in COF resulted into necking around cup bottom for certain BHFs in the simulation. The effect of asperities removal and the extreme pressure performance of the nanoparticles on the deformation behavior were not reflected in the simulation by increasing the COF. Therefore, the difference between the simulated and the experimental peak loads was maintained at the same level to study the evolution of residual stresses under the elevated BHF. The slight increase in frictional force after BHF of 28 kN was due to the removal of asperities by the nanoparticle. At BHF of 8 kN, the COF obtained from FE simulation is high, that is, at 0.37. These data are meaningful because it is lower than the dry COF of 0.42 for hardened steel ball-SUS316L tribo-pair. 27 However, it is slightly higher than the COF of 0.33 for four-ball (stainless steel) tribotest in accordance with ASTM D4172 standard under mineral oil lubrication due to sliding. 28 The COF obtained from the simulation decreased from 0.37 to 0.26 for increase in BHF from 8 to 28 kN. Chowdhury et al. 29 reported that the friction coefficients for an SUS304 pin sliding on an SUS202 rotating disk under a dry surface condition decreased from 0.22 to 0.12 with the increase in normal load. Both results showed the same trend, that is, the COF decreased for an increase in normal load.
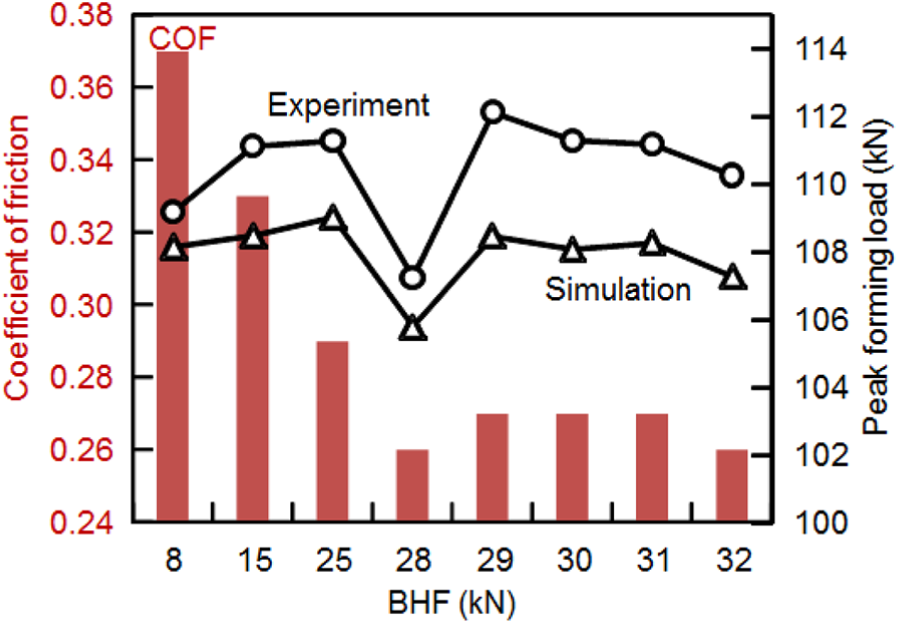
Relationship between coefficient of frictions in simulation and peak forming loads for different BHFs.
The comparison between the XRD and the simulated residual hoop stresses for crack-free cups formed with BHF of 29 and 31 kN, respectively, is shown in Figure 9. The residual stress was examined using the classical
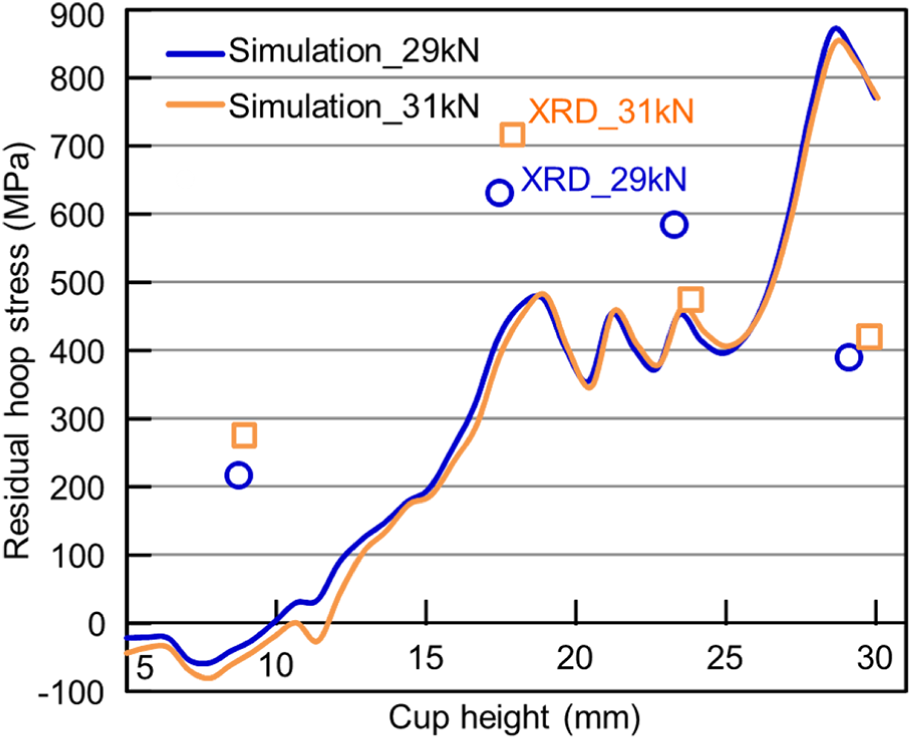
Comparison between XRD and simulated residual hoop stresses for crack-free cups formed with BHF of 29 and 31 kN.
The relationship between the percentage of change in wall thickness and the height of the valley points under elevated BHF is shown in Figure 10. Overall, the degree of wall thickening decreases with an increase in height of valley points for increase in BHF up to 25 kN. Wall thickening is the percentage of increase in measured wall thickness with relative to the initial blank thickness. The wall thickness in the valleys is larger than the one in the peak, particularly at low BHF (see Figure 11(b)). Therefore, the valleys are under higher amount of contacting pressure than the peaks during the deep drawing process. However, the difference in wall thickness and in height between these two points becomes small for increase in BHF. The degree of wall thickening sharply increases but not decreases at BHF of 28 kN with increase in height. This might be attributed to the equal wall thickness of the two portions and increase in contacting area, leading to the decrease in the amount of holding force to suppress the wall thickening in the valleys. In addition, the amount of circumferential compression contributing to the increase in wall thickness in the valleys is higher than the ones in the peaks due to the wavy earring profile. Therefore, the degree of wall thickening in the valleys increases sharply, and the formation of the cracks persists due to the increase in the amount of deformation-induced martensite. The increase in height of valleys is due to the high frictional force under the high BHF, as the nanolubrication is not yet effective at this level. Within the crack-free range, that is, from BHF of 29 to 31 kN, both the cup heights and the degree of wall thickening in the valleys reduce. The decrease in frictional force by means of the nanolubrication has facilitated the flow of material into the die, resulting in lower cup height. Along with the decrease in height, the sidewall thickness is supposed to increase. However, the decrease in frictional force has facilitated the flow of materials in the thick regions away from the valleys under the high pressure, resulting in a smaller degree of wall thickening. The relative motion of the nanoparticles in the boundary layers has facilitated the flow of the material, resulting in a lower degree of wall thickening and in shorter height of the valleys. However, the height sharply drops at BHF of 32 kN with a higher degree of wall thickening, resulting in the formation of cracks again. The magnitude of increase in the amount of BHF is insufficient to suppress the high degree of wall thickening as a result of the sharp reduction in height. In comparison to the experiment, the changes of both values under the elevated BHF are not reflected well in the simulation results. It is suggested that a more advanced friction model taking into the consideration of the dynamic normal load, the 2D dynamic friction, and the presence of nanoparticles in the boundary lubrication shall be developed for improving the discrepancy between the experimental and the simulated results.
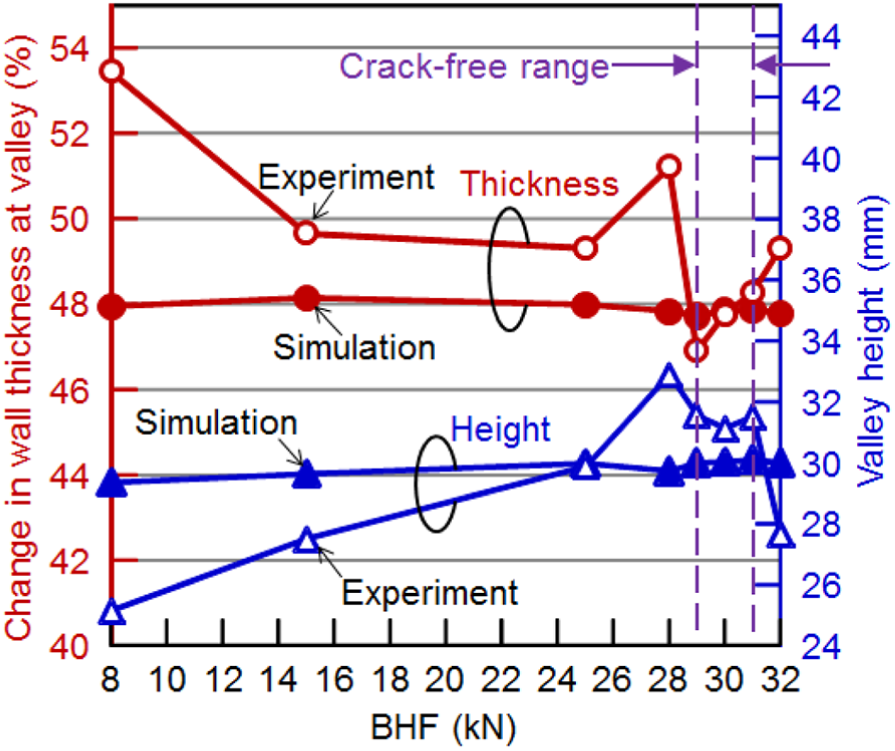
Relationship between change in wall thickness and height at valley points under elevated BHF.
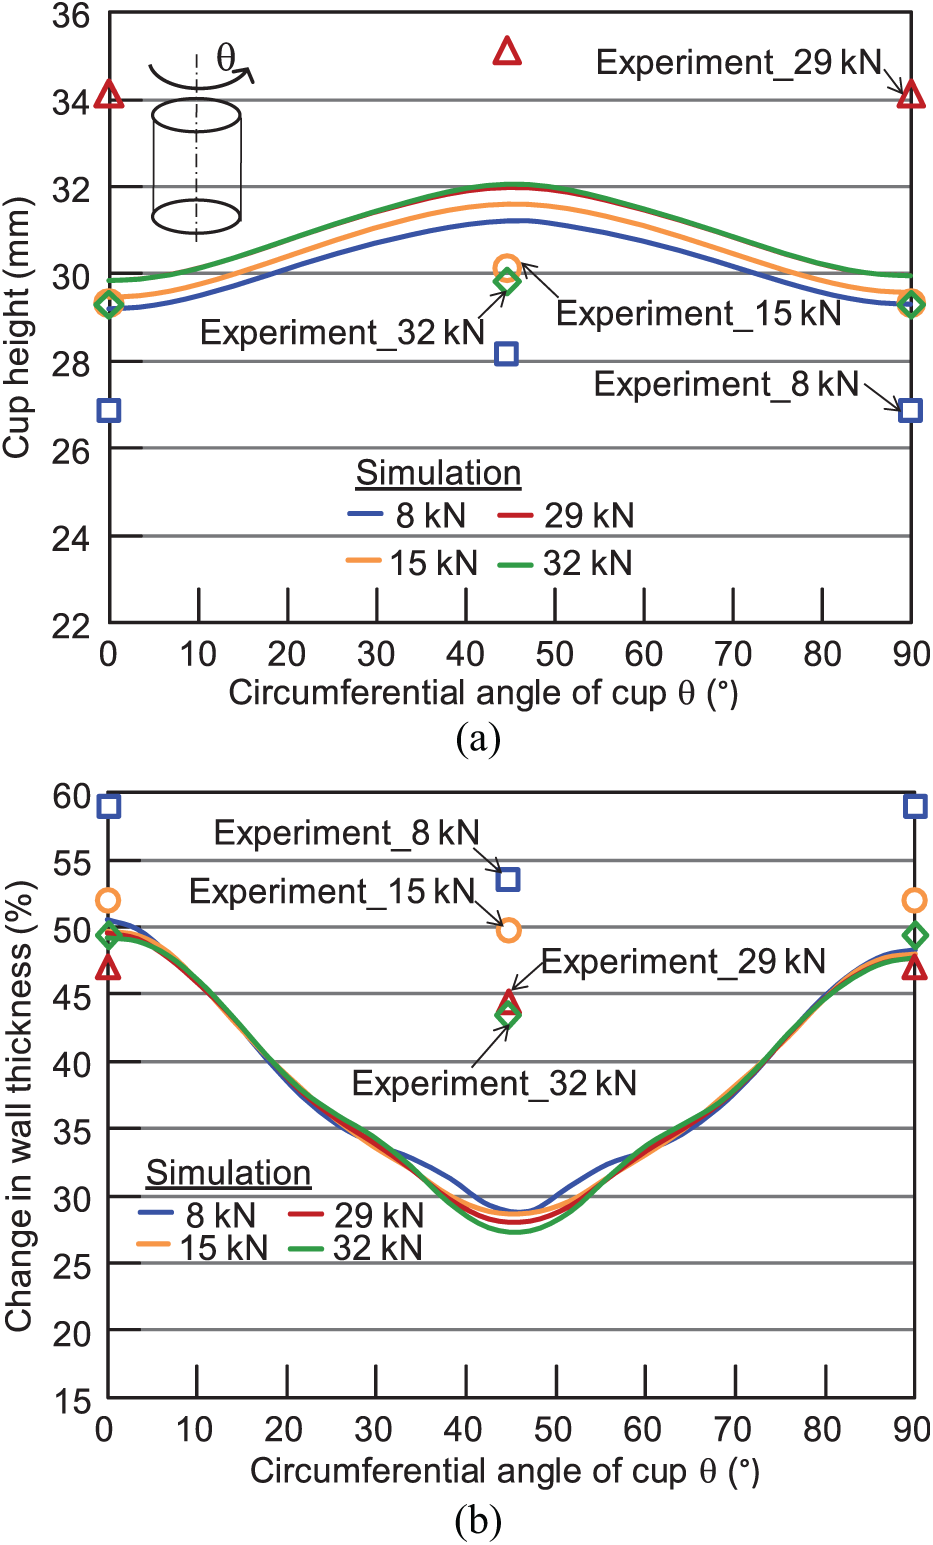
Comparison of (a) cup height and (b) change in wall thickness distribution along earring profile between experiment and simulation.
The comparison of the cup heights and the change in wall thickness distribution along the earring profiles between the experiment and the simulation under the elevated BHF is shown in Figure 11. The circumferential angle of cup θ = 0° corresponds to the rolling direction of the sheet material. Overall, the cup height for all angles increases and the degree of wall thickening reduces for increase in BHF up to 29 kN using nanolubrication. The normal compressive force for BHF of 29 kN has successfully lowered the degree of wall thickening in the valley, resulting in more even wall thickening profile. The formation of the delayed cracks in the valley points was successfully prevented due to the decrease in deformation-induced martensite. However, the overall experimental cup heights for BHF of 32 kN sharply reduce and the amount of wall thickening in the valley, that is, at θ = 0° and 90°, increases as the amount of BHF is insufficient to suppress the degree of increase in wall thickening as a result of sharp reduction in height. Hence, the formation of the cracks in the valley points is observed again due to the increase in deformation-induced martensite. The change in cup height and in wall thickness under the elevated BHF in the simulation is less significant than the experimental ones. Nonetheless, both results showed that the cups elongated with an increase in BHF. The difference in the amount of wall thickening between the valley and the peak points obtained from the simulation is higher than the experimental ones.
Conclusion
Since it is meaningless to measure the XRD residual hoop stress of the cracked cups, the influence of the enhanced BHF on the residual stress distribution and the change in deformation behavior leading to the elimination of the cracks remained unclear. In the 2D distribution of residual hoop stresses along the outer surface of SUS304 drawn cups obtained from the simulation, it was well predicted that the valley points have higher chances for the delayed cracks due to high stress concentration. The simulated results showed that the significant increase in stress from compressive to tensile at the valley points after the tool separation stage is one of the reasons for cracks. The formation of the delayed cracks is strongly influenced by the change in degree of wall thickening along the cup edge, that is, higher risk of crack for higher degree of wall thickening due to the high concentration of deformation-induced martensite. The increase in BHF to approximately 3.6 to 3.9 times of the normal BHF required under the nanolubrication has successfully suppressed the increase in degree of wall thickening in the high risk regions and prevented the cracks.
Footnotes
Appendix 1
Declaration of conflicting interests
The author(s) declared no potential conflicts of interest with respect to the research, authorship, and/or publication of this article.
Funding
The author(s) disclosed receipt of the following financial support for the research, authorship, and/or publication of this article: This research was funded by the University Malaya Research Grants under RU Geran—Fakulti Program through Grant No. RF026A-2018.