
Abstract
In this study, an innovative method was devised and implemented to produce continuous glass fiber–reinforced thermoplastic composites via a fused deposition modeling three-dimensional printer to enhance the mechanical properties of the printed products. In the extrusion-based, or filament-based, additive manufacturing process, namely, fused deposition modeling, the parts are basically formed via deposition of the material in the molten state, and thus embedding continuous fiber, in a solid form, is highly challenging. Hence, a nozzle system was designed and manufactured to feed the continuous fiber into the molten polymer simultaneously, which is called, here, in-melt simultaneous impregnation. With the presence of continuous fibers in the nozzle outlet, the feed of filament was calculatedly adjusted in the G-codes depending on the fiber volume percentage, to produce sound flow, and consistent deposition. Composite products were produced with various geometrical shapes. Via analysis and close control of the filament feeding, as a critical requirement to produce a sound printed product, composites with various fiber volume percentages were printed. Also, the mechanical properties of the printed parts with 30% by volume of glass fiber were measured. The results of the tensile test indicated that the continuous fibers were appropriately and effectively embedded that could result in remarkable increases in tensile strength and modulus of the samples, higher than 700%. The resulted values of tensile modulus were consistent with the values calculated via the rule of mixture. In addition, scanning electron microscopic images of the fracture sections suggest a sound adhesion between fibers and the matrix.
Keywords
Introduction
Additive manufacturing (AM) technologies have been expanded in recent decades. In these processes, to make three-dimensional (3D) objects, the final parts are constructed by joining material layer by layer. For manufacturing polymeric parts, stereolithography (SLA) and digital light processing (DLP) for photopolymer resin, fused deposition modeling (FDM) for polymeric filaments, laminated object manufacturing (LOM) for polymer laminations, and selective laser sintering (SLS) for polymer powders are mainly proposed. 1 Among the AM methods, the FDM process is more desirable due to its simplicity, lower cost, minimal waste, and ease of material change and has been used in various applications and become attractive for industries and, more importantly, for the public. In this process, the part is designed into a CAD file and converted into the STL format. Then, the part is sliced by special software into layers with a constant thickness. A (continuous) polymeric filament is then forced through a heated channel, via an extruder, where it is heated up to the flowing temperature, and then the molten material is extruded through the nozzle. The first layer is formed by depositing raster next to each other, and after the completion of the corresponding layer, the bed or nozzle moves to the layer height, and the next layers are deposited on the already deposited layer. This process repeats until the completion of the product. 2
The main drawback in the FDM process is that the printed parts are low in strength, due to the nature of thermoplastic materials which are too weak compared with metallic and ceramic materials. Due to the nature of the FDM process, the overall strength is also lower in comparison to the traditional methods such as injection molding, where the molten material is packed under high pressure, and machining where the original block is strongly made. 3 Besides, in the FDM process, generally poor adhesion between the rasters and layers exists. This poor adhesion between the rasters and layers affects the tensile, compression, and the impact properties of the products. These all limit the usage of this technology to make complex products subjected to multiaxial loads; hence, the application of this method is mainly limited to prototype manufacturing. 4 Therefore, strengthening the products manufactured by the FDM method can expand the application of this process into various fields. Studies of the mechanical properties of the FDM-produced parts have been shown of great importance for researchers. 5 Various methods have been proposed to solve issues in FDM-printed parts and also to increase the strength including the optimization of the process parameters, addition of fillers, increasing the strength in the bonding between rasters and layers, and using continuous fibers. Using continuous fibers is an effective method to increase the strength of 3D printed parts via the FDM to manufacture continuous fiber–reinforced thermoplastic composites (CFRTCs). 6 CFRTCs could provide a variety of superior properties such as high fracture toughness, high strength-to-weight ratio, excellent fatigue, corrosion, and wear resistance. These composites can be widely used for many applications including automobile, robot arms, chemical container, aerospace, and commercial aircraft.7,8 Employing the advantages of AM into composite production can further develop hard-to-make products in the conventional methods that require expensive and time-consuming mold making step.
In regards to the optimization of the process parameters, Ahn et al. 9 optimized the parameters of the FDM process, such as raster orientation, air gap, bead width, and nozzle temperature. They reached up to 72% tensile strength and 90% compressive strength of the injected parts. Ghorpade et al., 10 using swarm intelligence, optimized the part orientation in the FDM process. Panda et al. 11 analyzed the parameters of the FDM process and their effect on tensile strength, flexural strength, and impact strength. Rayegani and Onwubolu 12 provided modeling, prediction, and optimization of the FDM process parameters. Tymrak et al. 13 studied the mechanical properties of acrylonitrile butadiene styrene (ABS) and polylactic acid (PLA). They also examined the filling patterns and thickness of layers. By making use of the classical laminate plate theory, Melenka et al. 14 predicted Young’s modulus of PLA-printed parts and compared the results with experimental data. Torres et al. 15 examined the effect of different parameters including layer height, filling percentage, and heat treatment time at 100 °C on the shear strength of the PLA. Baich et al. 16 studied the effect of filling patterns on strength and cost. Fernandez-Vicente et al. 17 examined the effect of filling pattern and filling percentage on the tensile strength of ABS. Dawoud et al. 18 optimized the mechanical properties of printed parts by examining the air gap and the raster’s angle parameters. Griffiths et al. 19 using the design experiments approach optimized the tensile and bending properties of FDM parts. Lovo et al. 20 optimized deposition orientation in the FDM process for maximizing the strength of 3D printed truss-like structures. Also, genetic programming and automated neural network search for the formulation of models could be used to optimize the FDM process.21–23
On adding filler particles, Zhong et al. 24 increased the tensile strength and hardness of printed products by adding short glass fibers to ABS filament. Ning et al. 25 added carbon fiber (CF) powder to ABS filament to improve its mechanical properties. Moreover, they investigated the effect of FDM parameters such as the angle of rasters, printing speed, nozzle temperature, and thickness of layers on tensile strength, Young’s modulus, yield stress, toughness, and ductility. 7 Wang et al. 26 added microspheres to a polymer, which can expand with the increase of temperature to eliminate the voids in the printed part and to improve its mechanical properties. By making use of 2% weight fraction of microspheres, the tensile strength and compressive strength increased by declining the voids. Shofner et al. 27 added 10% carbon nanofibers to ABS. They successfully produced reinforced polymers that increase tensile strength and stiffness.
Concerning the strengthening by increasing inter-rasters and layer bonding after the operation, Li et al. 28 increased the inter-rasters and inter-layer bonding using ultrasonic waves in products printed by the FDM process. The tensile strength and modulus increased by 11.3% and 16.7% after applying ultrasonic waves, respectively. Shaffer et al. 4 used high-energy ion radiation to create cross-linking and, as a result, improved adhesion between layers in the parts produced by the FDM process.
Mori et al. 29 successfully produced an ABS/CF composite with a fiber volume percentage of 1.4% to reinforce the printed materials using continuous fibers. The nozzle diameter was 0.9 mm and the tensile strength was 43 MPa. Van der Klift et al. 30 used a Mark One 3D printer produced by Markforged company and studied the mechanical properties of nylon/CF composites with the fiber volume percentages of 6.9% and 20.7%. For the samples with the fiber volume percentage of 6.9%, the achieved tensile strength and modulus were 464 MPa and 35.7 GPa, respectively, and for the sample with the fiber volume percentage of 20.7%, the tensile strength and modulus were 140 MPa and 14 GPa, respectively. Matsuzaki et al. 31 successfully produced a PLA/CF composite with a fiber volume percentage of 6.6% and PLA/jute composite with a fiber volume percentage of 6.1%. They achieved to increase the tensile strength and modulus by 425% and 599% for CF, and 157% and 134%, for jute fiber, respectively. The nozzle diameter was 1.4 mm, and the fiber feed speed of 100 mm/min and the nozzle speed of 60 mm/min were also considered for ease of deposition and proper feeding of the fibers. Tian et al. 32 successfully produced a PLA/CF composite with the fiber volume percentage of 27%. They investigated parameters and variables such as nozzle temperature, layer height, the feed rate of the filament, air gap, and print speed at different levels. The diameter of the nozzle used was 2 mm. They succeeded to obtain optimal conditions and reached the flexural strength and modulus of 325 MPa and 30 GPa, respectively. Melenka et al. 33 examined the tensile modulus of nylon/Kevlar composites with the fiber volume percentages of 4%, 8%, and 10%. They also used the Mark One 3D printer. For composites with fiber volume percentages of 4.04%, 8.08%, and 10.1%, the tensile modulus values were 1.76, 6.92, and 9 GPa, respectively. Li et al. 34 successfully produced a PLA/CF composite with a fiber volume percentage of 34%. To improve bonding between the fibers and the matrix, they used an impregnation method in which the fibers were placed into a solution of methyl dichloride with 8 wt% of PLA, before printing. The tensile and flexural strengths of the samples were increased by 134% and 165%, as compared with the non-impregnated fibers, and by 225% and 194.3% as compared to PLA, respectively. Yang et al. 35 succeeded to increase the tensile strength from 50 to 147 MPa and the flexural strength from 80 to 127 MPa, by simultaneous impregnation of 10% by weight content of CF and ABS. The nozzle diameter was 0.8 mm. Besides, Bettini et al. 36 studied the mechanical properties of a PLA/aramid composite in the presence of 8.6% fiber volume percentage. For the samples printed in the direction of zero, the increase in tensile strength and modulus were sixfold and threefold, respectively, compared to those of the neat PLA. Vaneker 37 produced a polypropylene/glass fiber (PP/GF) composite using commingled yarn. The flexural modulus of the samples was 13.06 GPa. Caminero et al. 38 evaluated the interlaminar bonding performance of 3D printed nylon/GF, nylon/CF, and nylon/Kevlar composites. Oztan et al. 39 used a Mark One 3D printer and studied the mechanical properties of nylon/CF and nylon/Kevlar composites. For the nylon/CF composite with the fiber volume percentage of 14.1%, the achieved tensile strength and modulus were 254.8 MPa and 21.73 GPa, respectively, and for the nylon/Kevlar composite with the fiber volume percentage of 16.7%, the tensile strength and modulus were 150.2 MPa and 8.5 GPa, respectively.
A review of the literature reveals that the use of continuous fibers is the most effective way to strengthen the products printed by the FDM process, which can multiply the strength of the printed products. Also, in previous studies, the diameter of the nozzle used was in the range of 0.8–2 mm, and hence, with such nozzle diameter, producing high-quality products regarding dimension and surface fineness is difficult. Moreover, most of the samples were either of poor quality or made in the form of a shell. The use of a smaller diameter nozzle is necessary for the production of a piece with the proper dimensional accuracy and optimum surface finishing, as well as for an increase in the fiber percentage. The use of pre-impregnated fibers30,33,37–39 as well as simultaneous impregnation of fibers and polymers6,29,31,32,34,36 is also proposed for the production of a continuous fiber–reinforced composite by the FDM process. The use of pre-impregnated fibers brings restrictions to the use of different materials as a matrix and results in a fixed percentage of fiber volume. Different types of methods could be used for simultaneous impregnation of fibers and polymer; the best method is the one in which the filament input is separate from the fiber input and which can be controlled on the input of the filament and its feed rate. In addition, the next important issue in the simultaneous impregnation of fibers and polymer is that the feed of filament must be calculated accurately to have control over the percentage volume of fibers; therefore, it is necessary to investigate the effective parameters for simultaneous impregnation of fibers and the polymer, and the feed of the filament must be calculated. In this study, the parameters relating to the simultaneous impregnation of fibers and polymers have been thoroughly evaluated, and a novel method is presented in which the fibers enter into the molten area beside the nozzle and are deposited onto the surface after the impregnation, which is called, here, in-melt simultaneous impregnation. Also, the feed of the filament is calculated according to the composite parameters and fiber diameter and is applied to the printing of composite samples. The composite samples are printed according to the presented method with various fiber contents, and consequently the composite samples with a 30% fiber volume and their mechanical properties are evaluated to investigate the efficiency of the proposed method.
Simultaneous impregnation of fibers and polymer filament
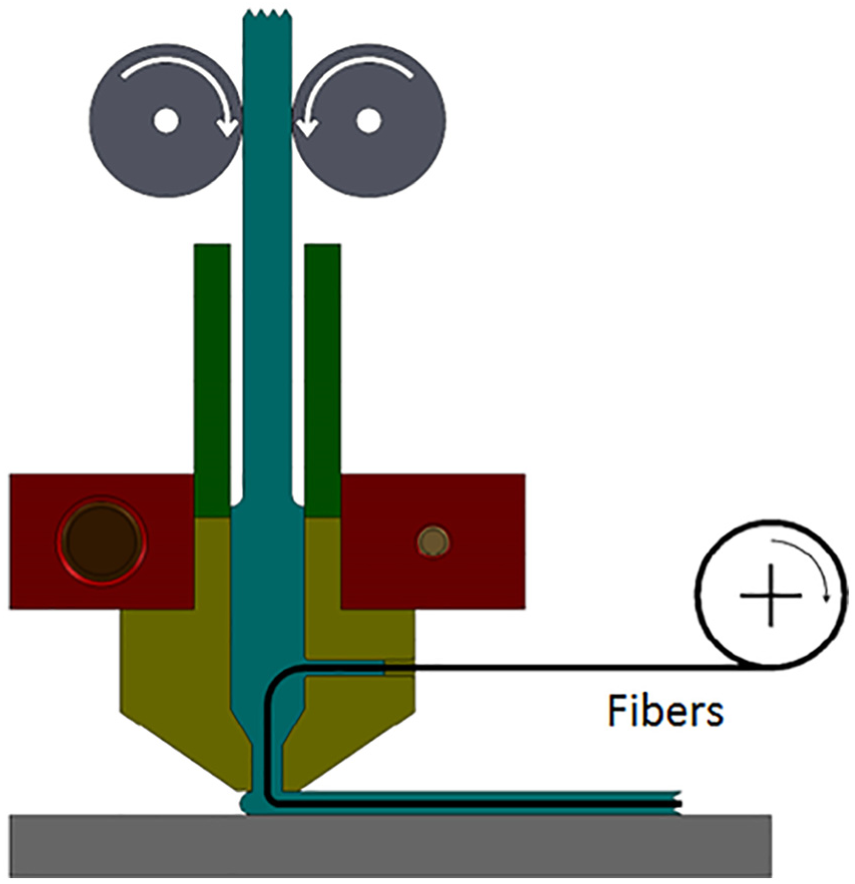
A schematic illustration of the FDM process is shown in Figure 1. For co-impregnation of filament and fibers, it should be noted that, in the FDM process, the nozzle diameter is often smaller than the filament diameter; for instance, for a 1.75-mm filament, mostly, the 0.4, 0.5, and 0.6 mm nozzle diameters are applied. Thus, there is a difference between the material output speed from the nozzle and the filament input speed in the extrusion system. According to the mass conservation law and based on the input and output throughputs, the exit speed of the material from the extrusion system is (equation (1))
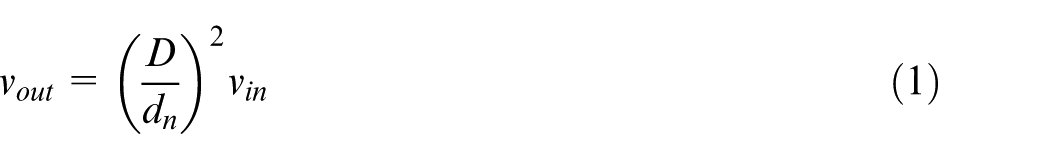
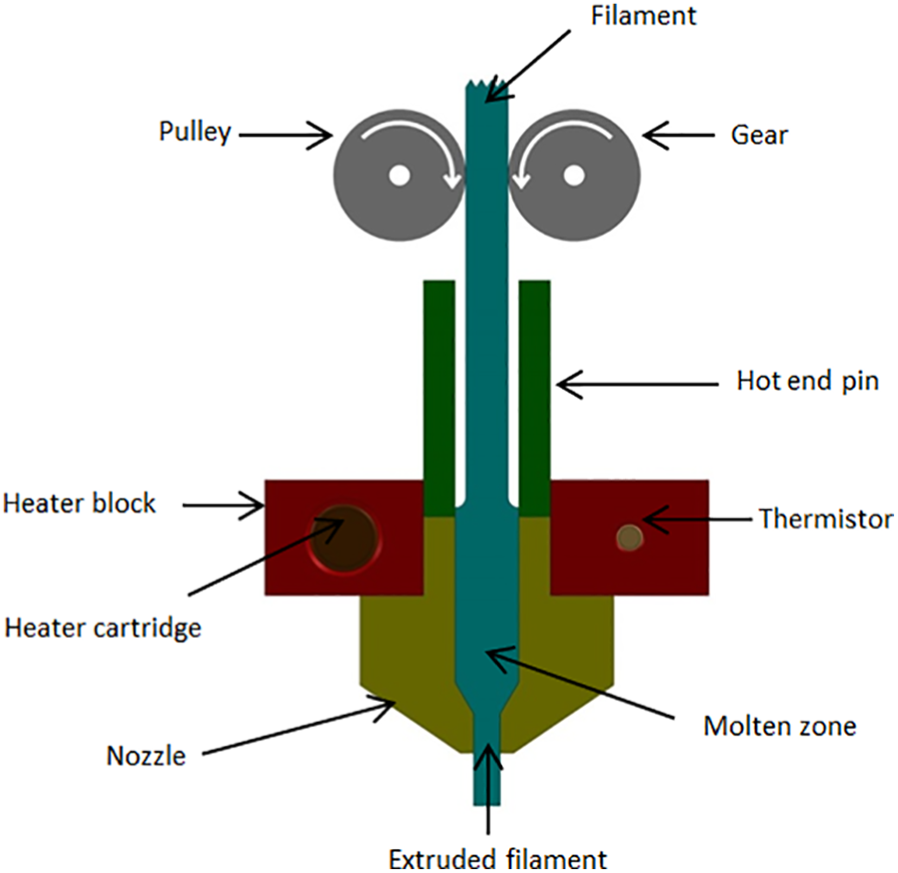
Schematic illustration of the extrusion process in FDM.
In this equation,
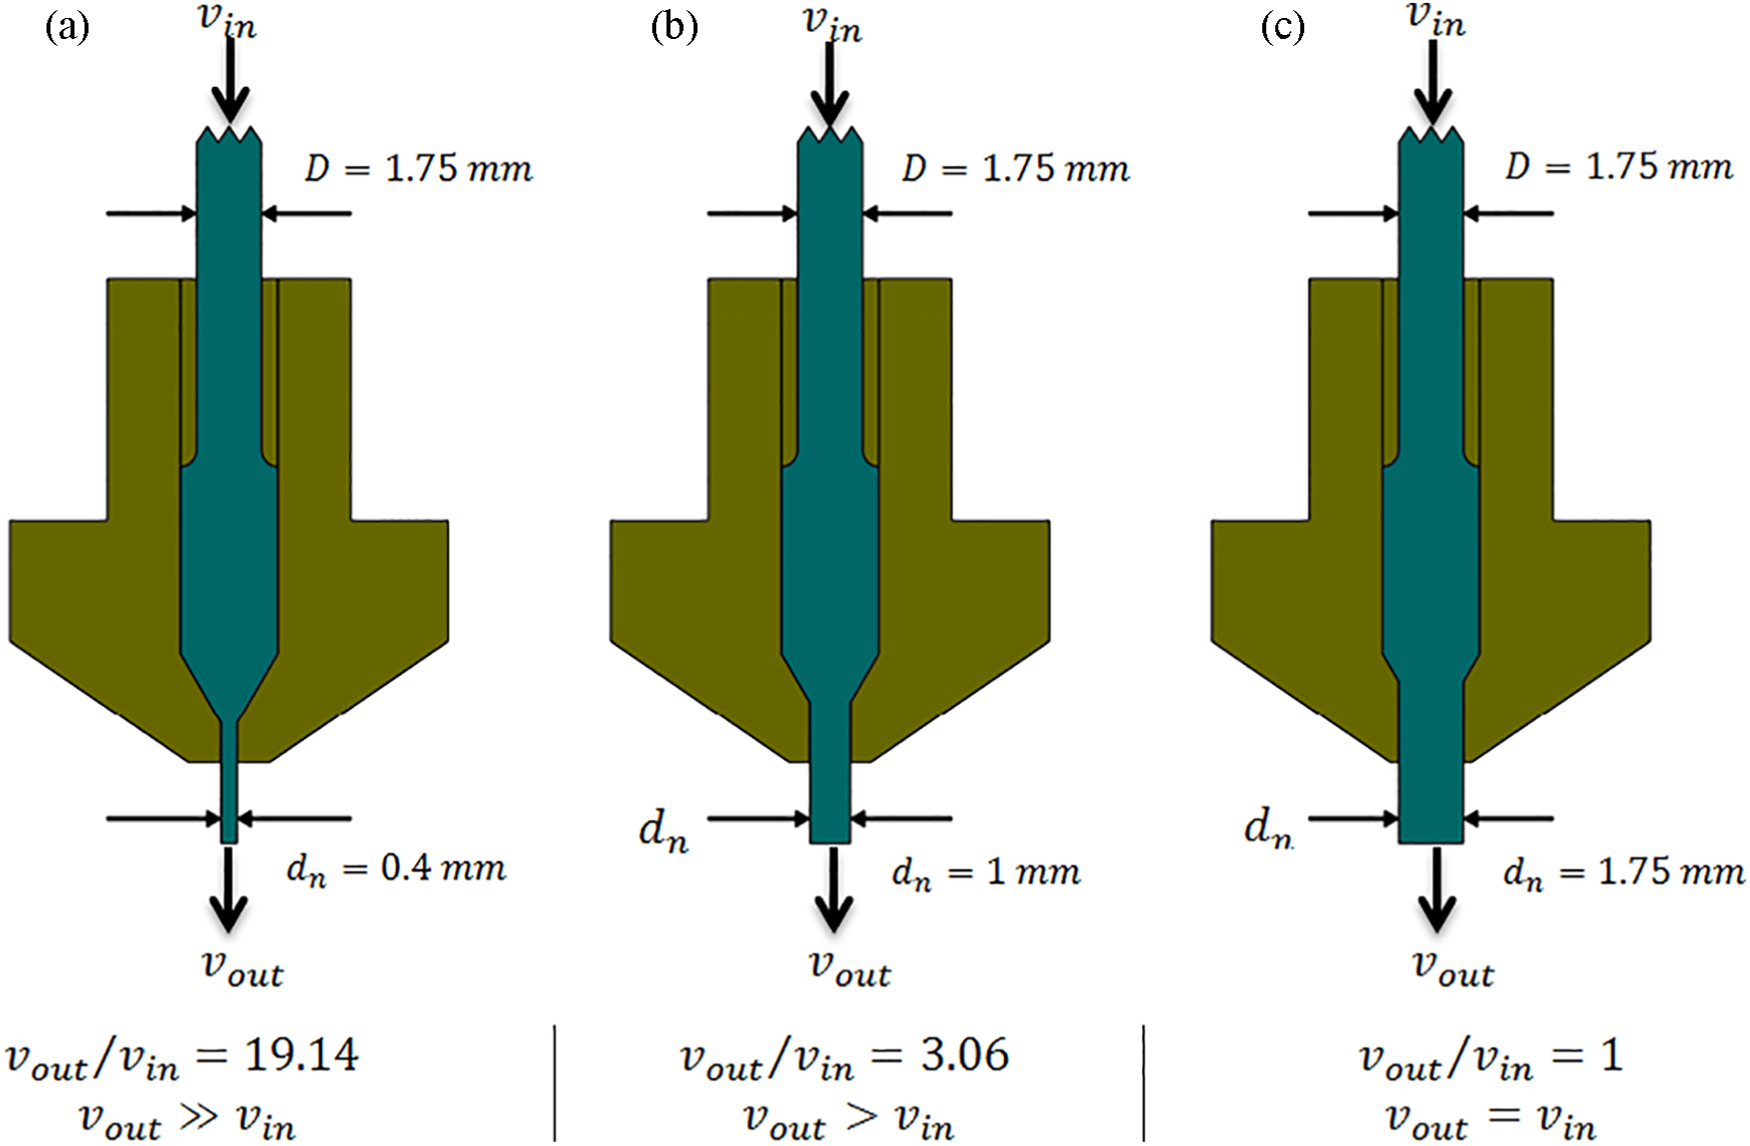
Extrusion process for 1.75-mm filament and 0.4, 1, and 1.75 mm nozzle diameters. Exit speed is (a) much higher, (b) rather higher, and (c) equal to the filament speed.
The same passage of feeding for fiber and filament
In this method (Figure 3(a)), the fibers are fed alongside the extruded filament and deposited on the bed. In this case, the motion of the fibers is affected by the feed rate of the filament. In general, the input (or feeding) speed of the filament is different from the speed of the molten material (raster) exiting from the nozzle, as described above, and hence improper feeding, fiber damage, and fiber rupture are followed in this method. If the nozzle diameter is equal to the filament diameter, the exit speed of material from the nozzle is then equal to the filament input speed which is in fact the same as the fiber moving speed. As shown in Figure 3(b), the fiber is thus fed continuously. However, in this method, the surface finish is highly undesirable, and the fiber volume is extremely low.
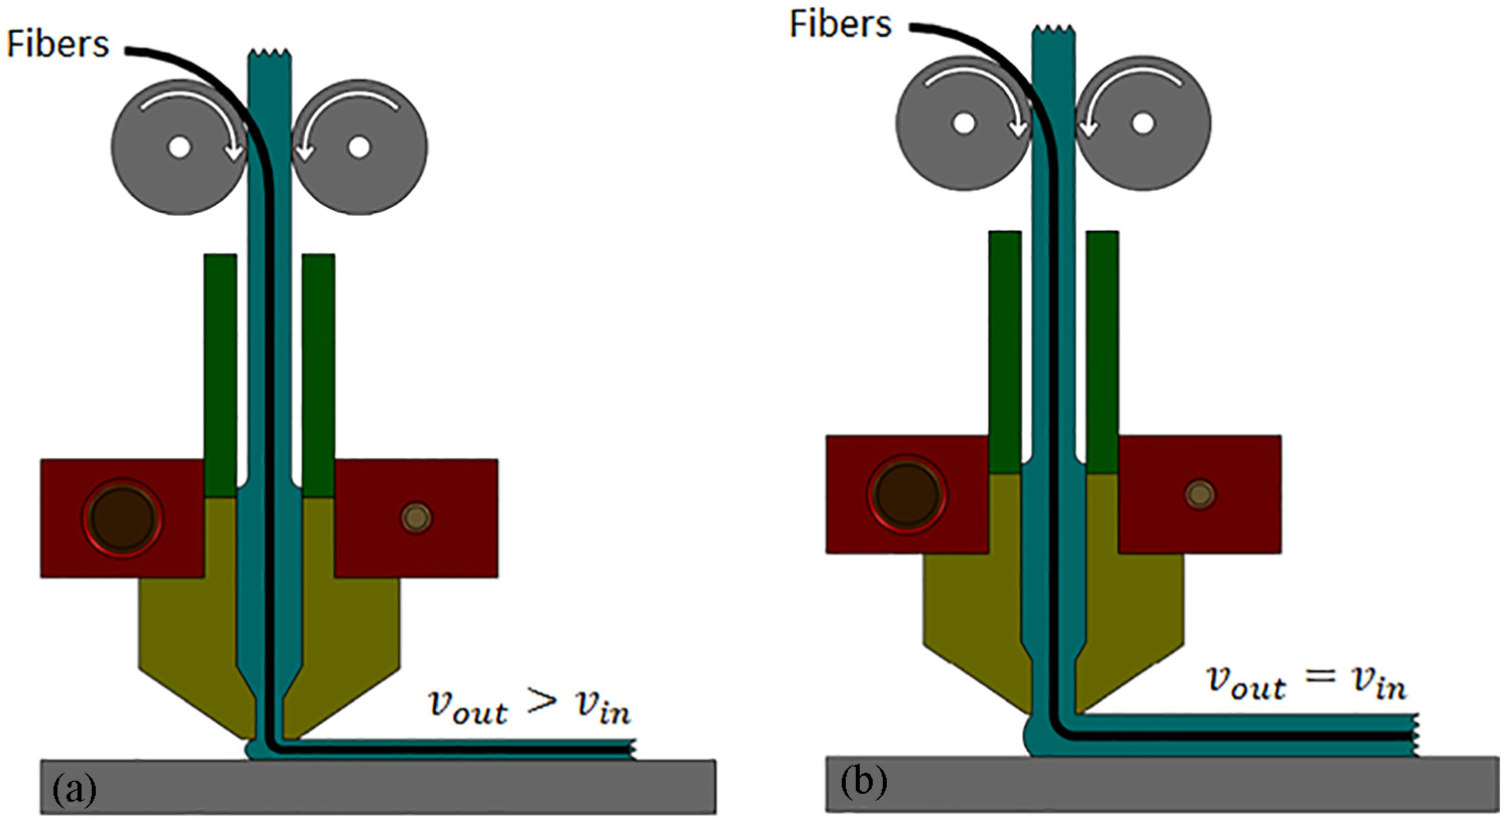
Simultaneous feeding of fibers and filaments, utilizing a nozzle with (a) a small and (b) a large cross-section.
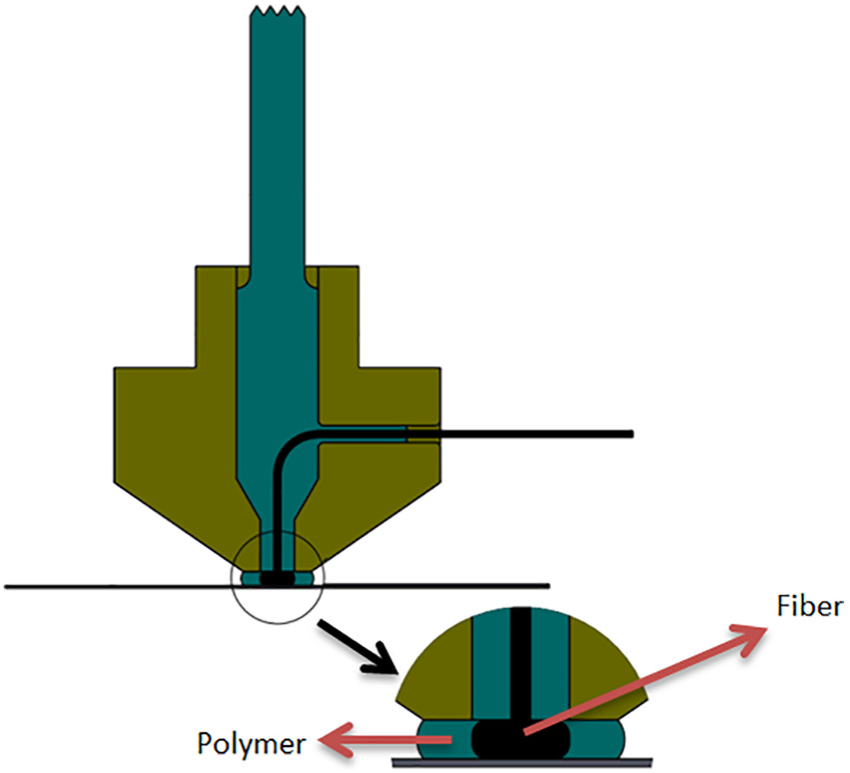
Separate passages of feeding for fiber and filament and in-melt simultaneous impregnation
In this method, the fibers are passed through a separate path from the filament feeding channel but eventually merged with the molten polymer. With this method, the issue of velocity balance is resolved. Different paths can be considered for fiber entry. In this research work, a nozzle was manufactured so that the fiber was fed through an accurately sized orifice made at the side surface where it was then impregnated in-melt polymer, and forced to deposition the bed or on the already deposited previous layer (Figure 4). The critical point in this mechanism is that, with the presence of fiber, the amount of (polymeric) filament feed rate or flow rate should be regulated, accurately, because the primary condition for an optimal impregnation is to create an adequate pressure in the molten zone. An insufficient flow rate leads to a poor impregnation and also creates voids in the printed part. On the other hand, the overflow rate causes increased pressure in the melting zone and may consequently cause damage and rupture of the fibers. Also, increasing the flow rate may result in an excessive output of the polymeric material from the nozzle and the fiber orifice, which has an adverse effect on the surface quality.
Feed the fibers from the nozzle side.
Calculation of the feed of filament
One of the most critical parameters in the G-codes in FDM 3D printers is the feed of filament which is designated by

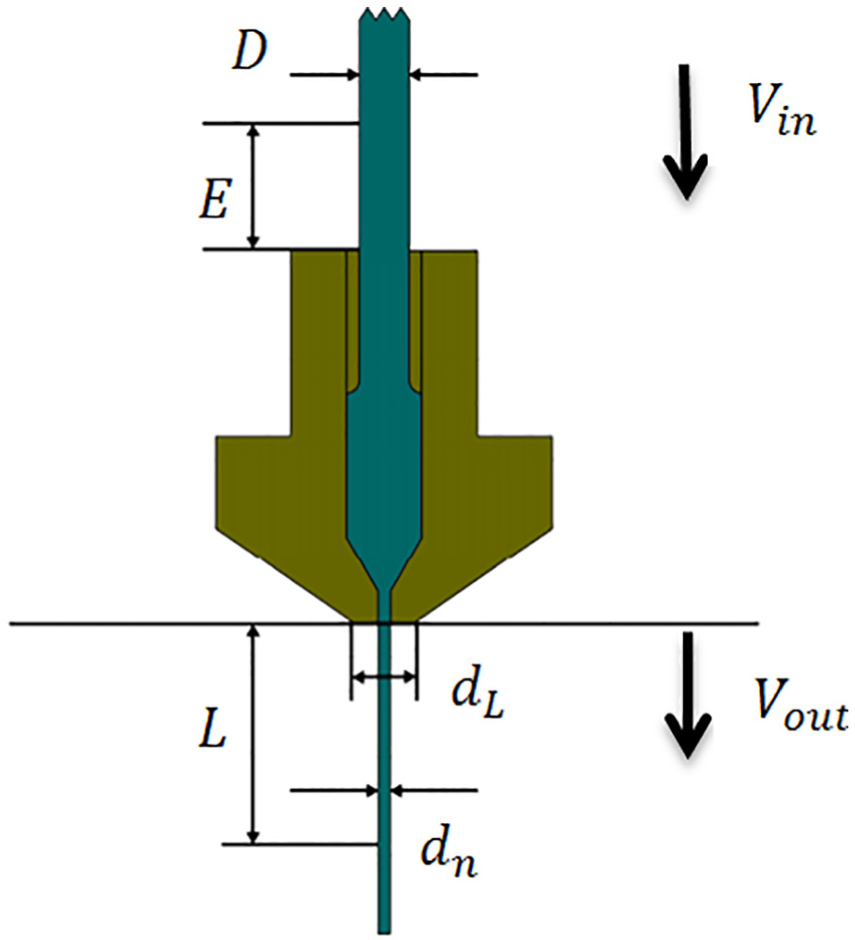
Schematic of an extrusion phenomenon in the FDM process; input and output volume from the extruding system.
Assuming a filament of diameter
In this equation,
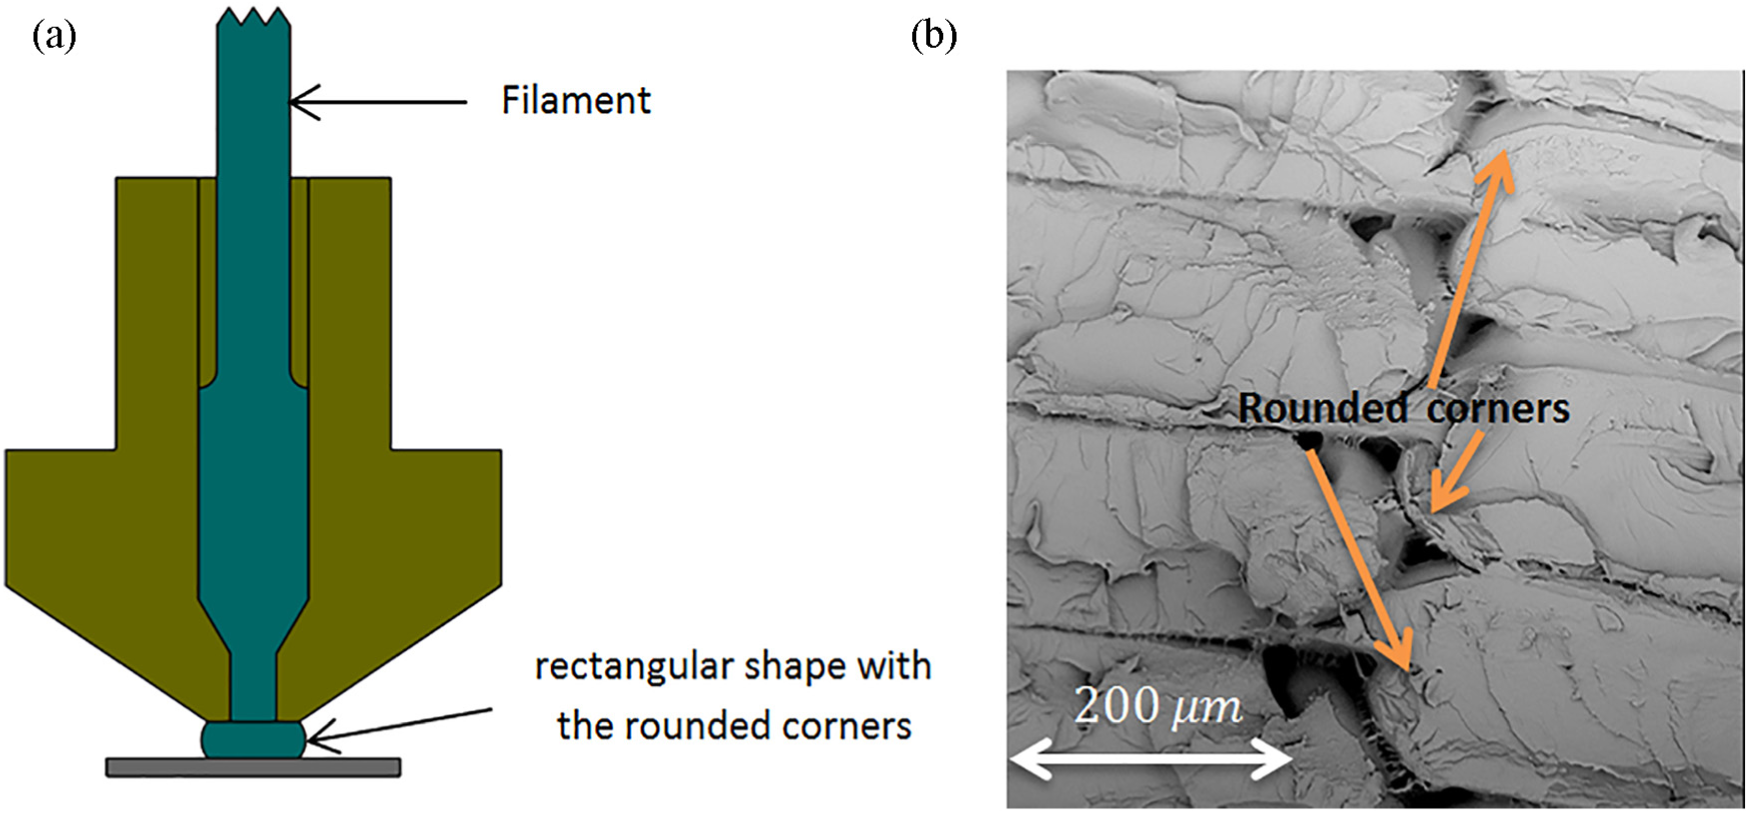
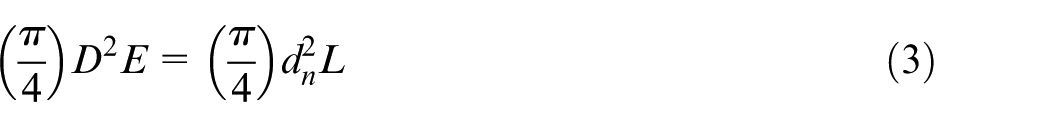
(a) Schematic and (b) SEM image of a deposited material cross-section.
In this case, a parameter named “extrusion width” is defined. The extrusion width is a function of nozzle diameter; however, in some software, this parameter is considered equal to the nozzle diameter for calculating the feed of filament (“E”). The extrusion width may be equal to the diameter of the nozzle as illustrated in Figure 7(a), but it is practically different as shown in Figure 7(b) and (c). If extrusion width becomes too larger than the nozzle outer diameter such as shown in Figure 7(c), the molten material will flow on the nozzle side and some issues like material burning and poor roughness will be followed. As shown in Figure 5, it is generally preferred to select extrusion width between the nozzle inner and outer diameters (equation (4))

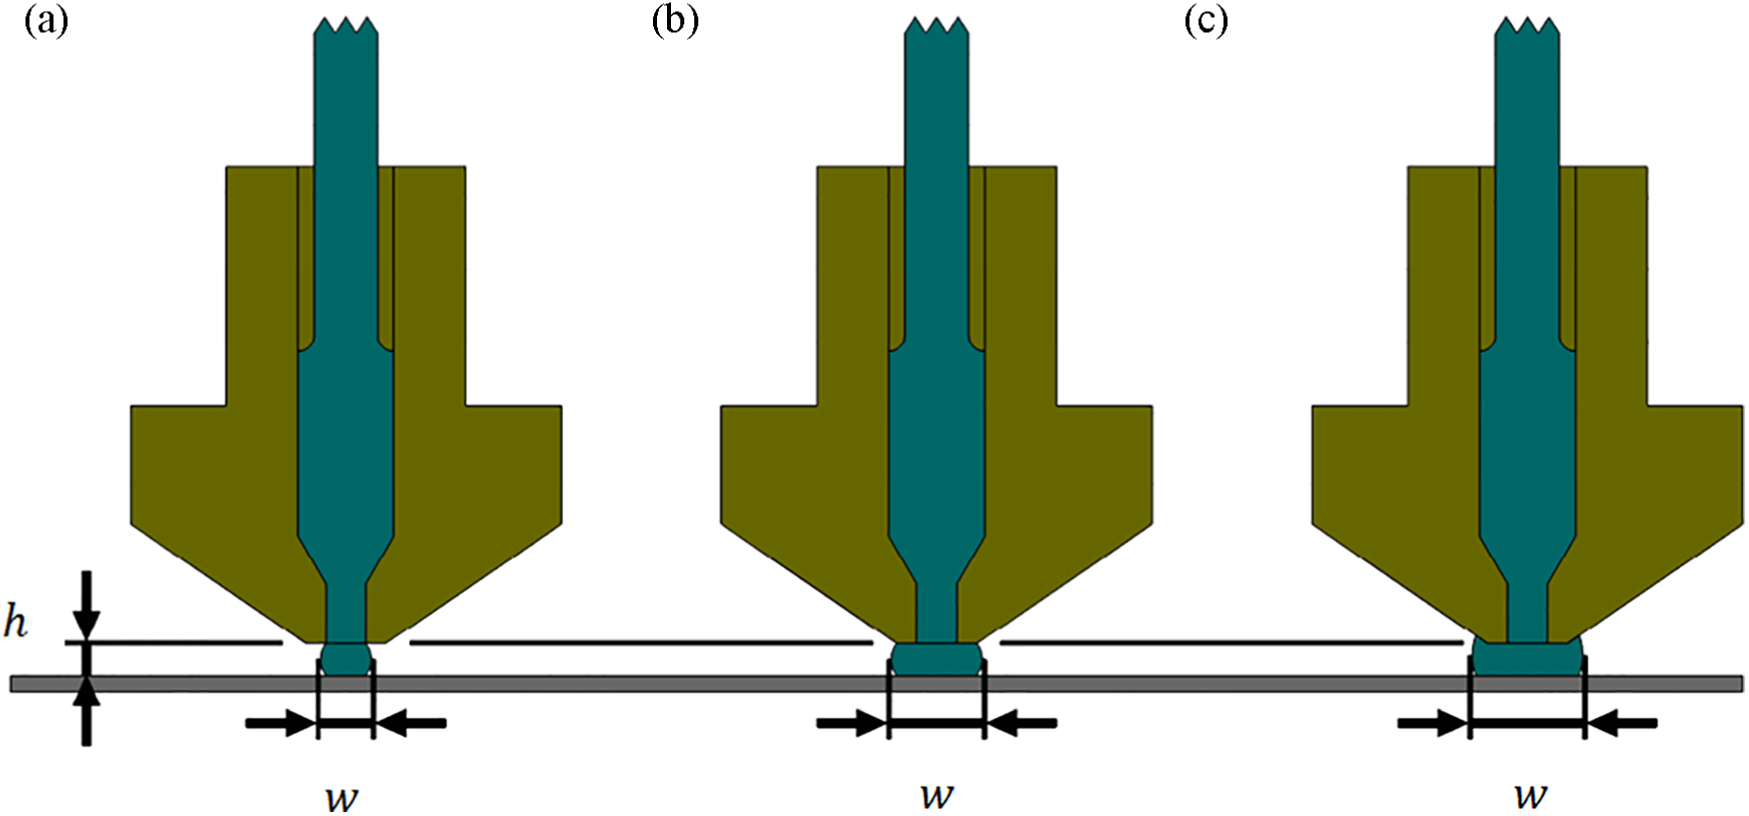
Concept of extrusion width and layer height: (a) extrusion width is equal to the nozzle inner diameter; (b) extrusion width is equal to the nozzle outer diameter; and (c) extrusion width is larger than the nozzle outer diameter.
With a deposited raster length of
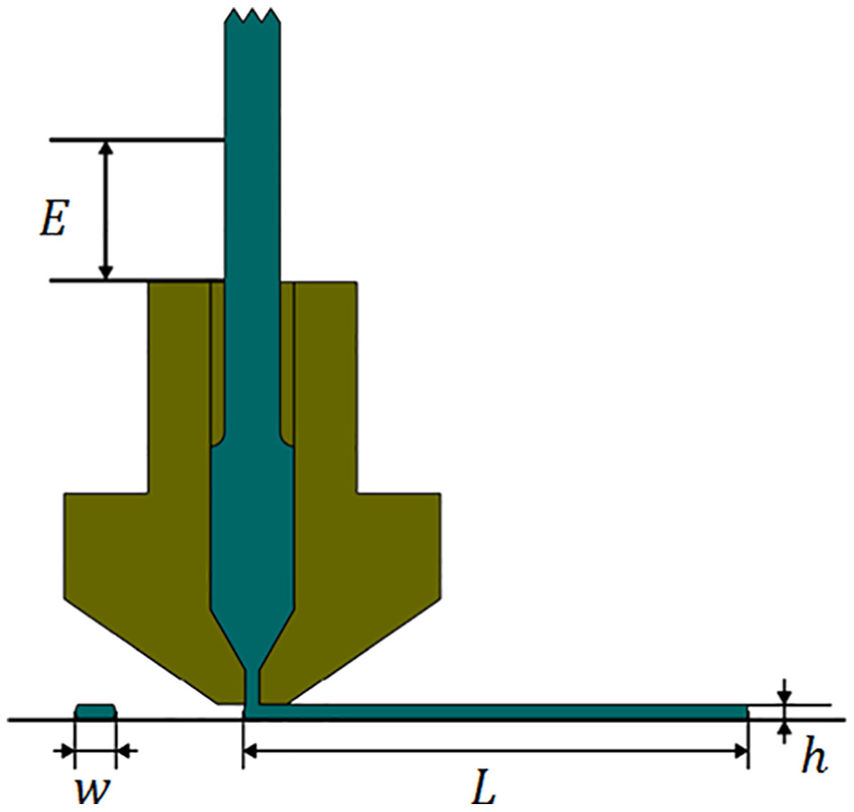
Deposited raster of length
In this equation,
where
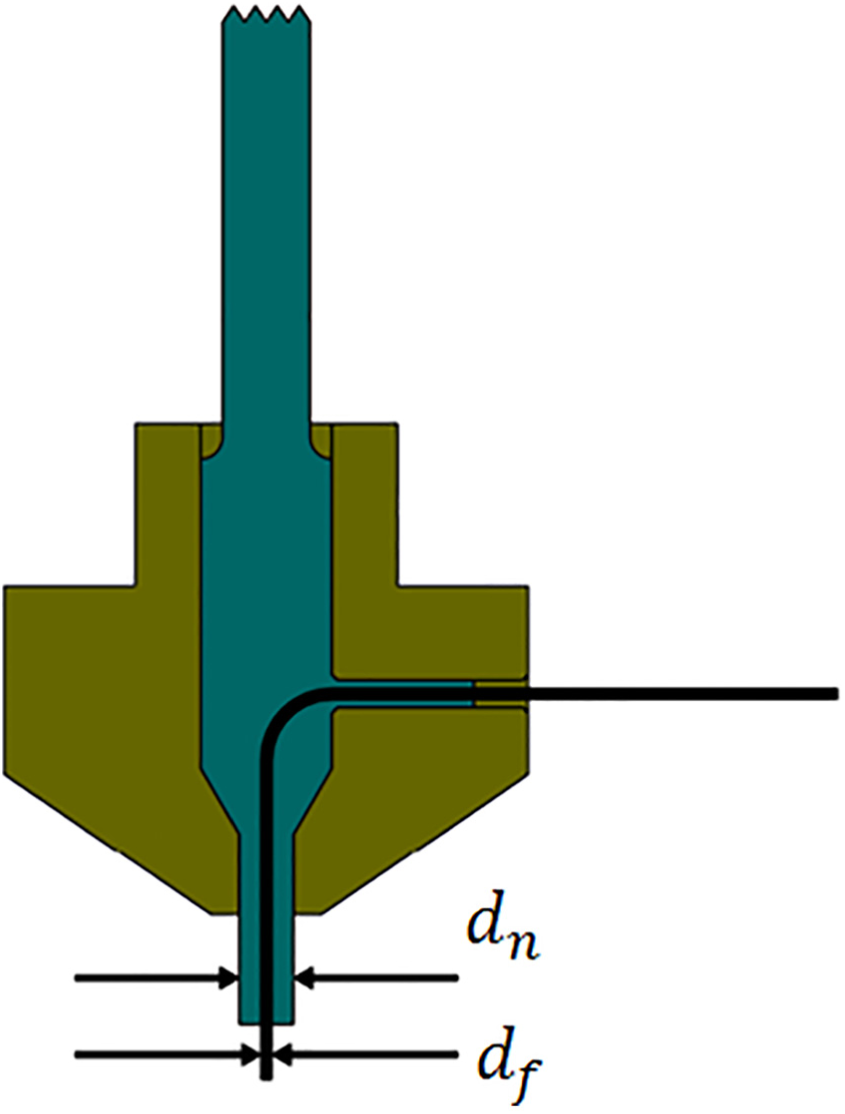
Fiber path in the molten polymeric matrix exiting from the nozzle outlet.
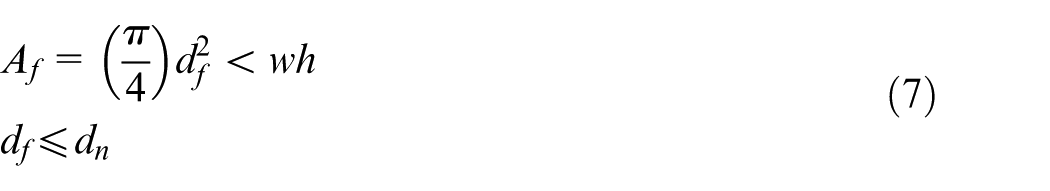
In other words, the cross-section of the fiber should be smaller than that of the deposited raster and nozzle. In these inequalities,
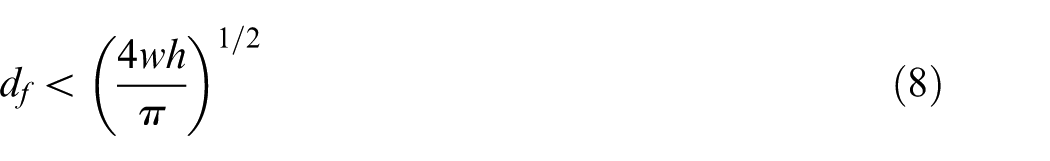
As an example, for a nozzle with a diameter of 0.5 mm and a layer height of 0.2 mm, the maximum diameter of the fiber can be 0.35 mm at the outlet.
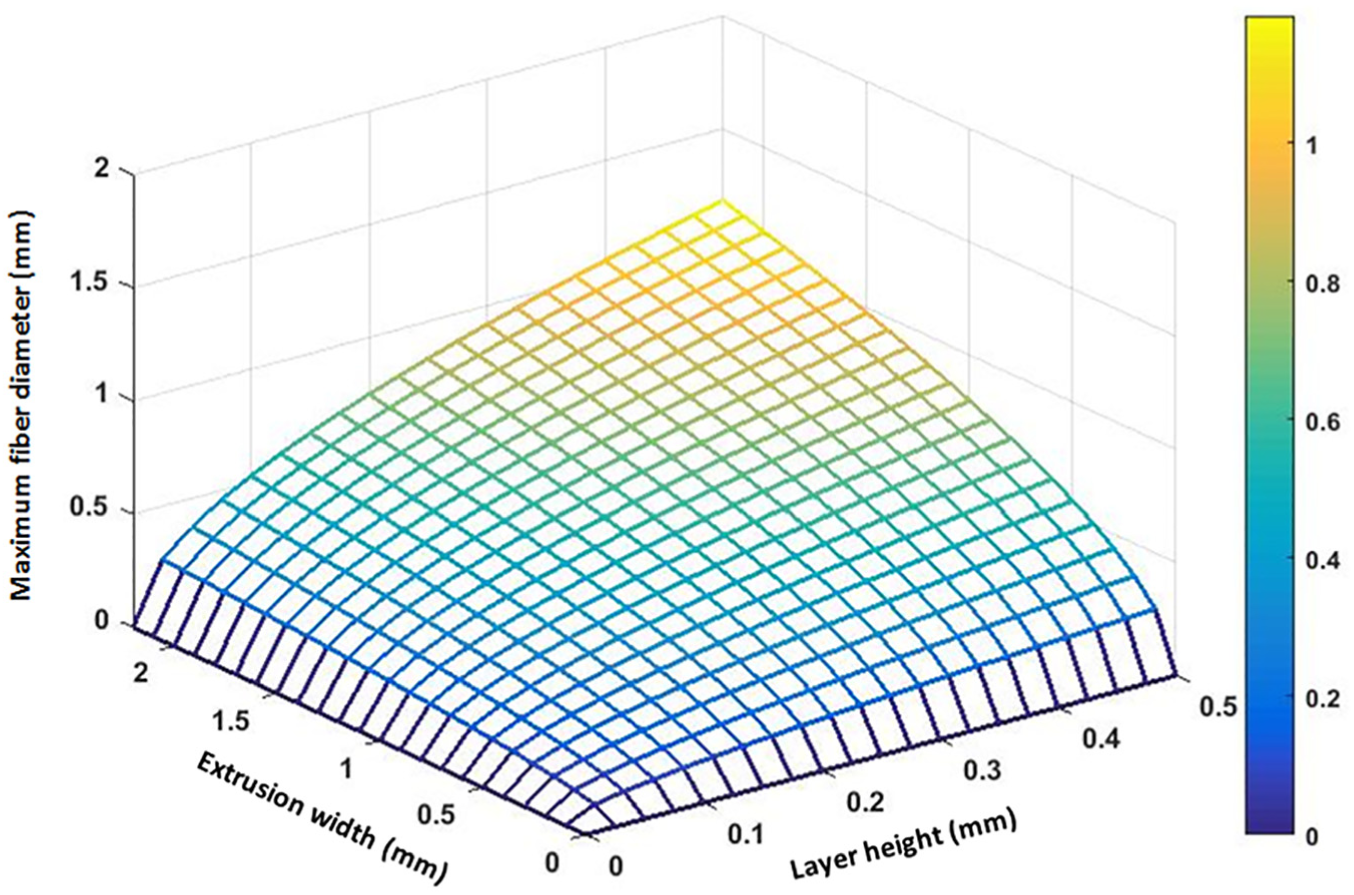
The relationship between the nozzle diameter, the layer height, and the maximum fiber diameter that can be embedded into the raster at the nozzle outlet.
Co-deposition of fiber and polymeric material.
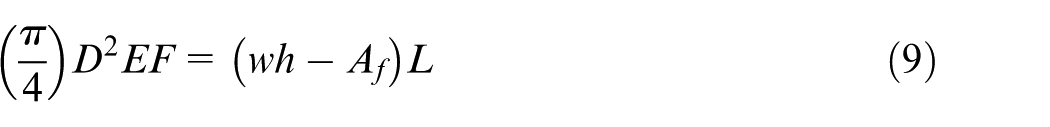
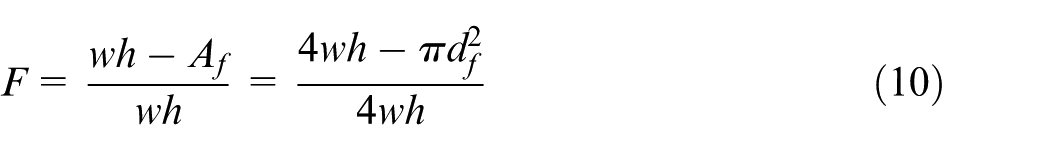
Assuming that the cross-section of the fiber does not change after the deposition or, in other words, the fibers are not compressed. To compensate for the presence of fibers in the deposition, a reduction in the amount of polymeric flow (or feed of filament) must be performed, which is directly related to flow percentage factor or F factor in equation (9)
Knowing the fixed filament diameter, the
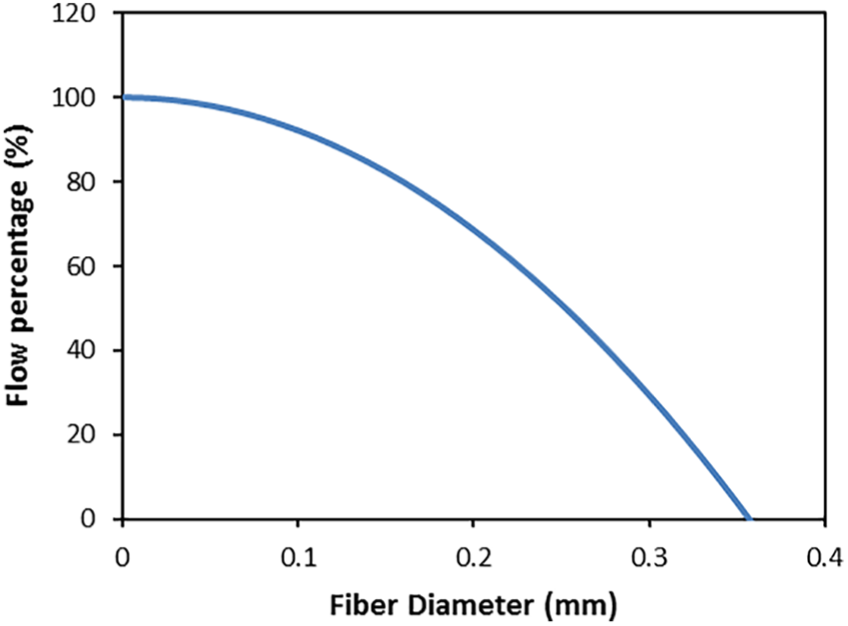
Relationship between the fiber diameter and the flow percentage, plotted for an extrusion width of 0.5 mm and a layer height of 0.22 mm.
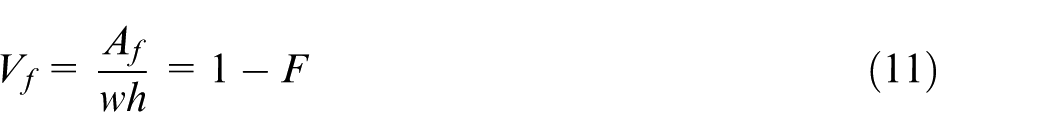
In Figure 13, the fiber volume percentage in terms of extrusion width, fiber diameter, and layer height is shown. It is observed from Figure 13(a) that, for constant extrusion width and layer height, by increasing the diameter of the fiber from zero to a maximum possible value, the fiber volume percentage is increased based on equation (11) and, proportional to this increase, the flow percentage should be reduced. Also, in Figure 13(b), it can be seen that, for constant fiber diameter and layer height, by increasing the extrusion width, the fiber volume percentage decreased and therefore the flow percentage should be increased. Subsequently, according to the 3D printing parameters such as nozzle diameter, extrusion width, layer height, and fiber diameter, the flow percentage should be calculated based on equation (10) and added as a multiplier into the feed of filament,
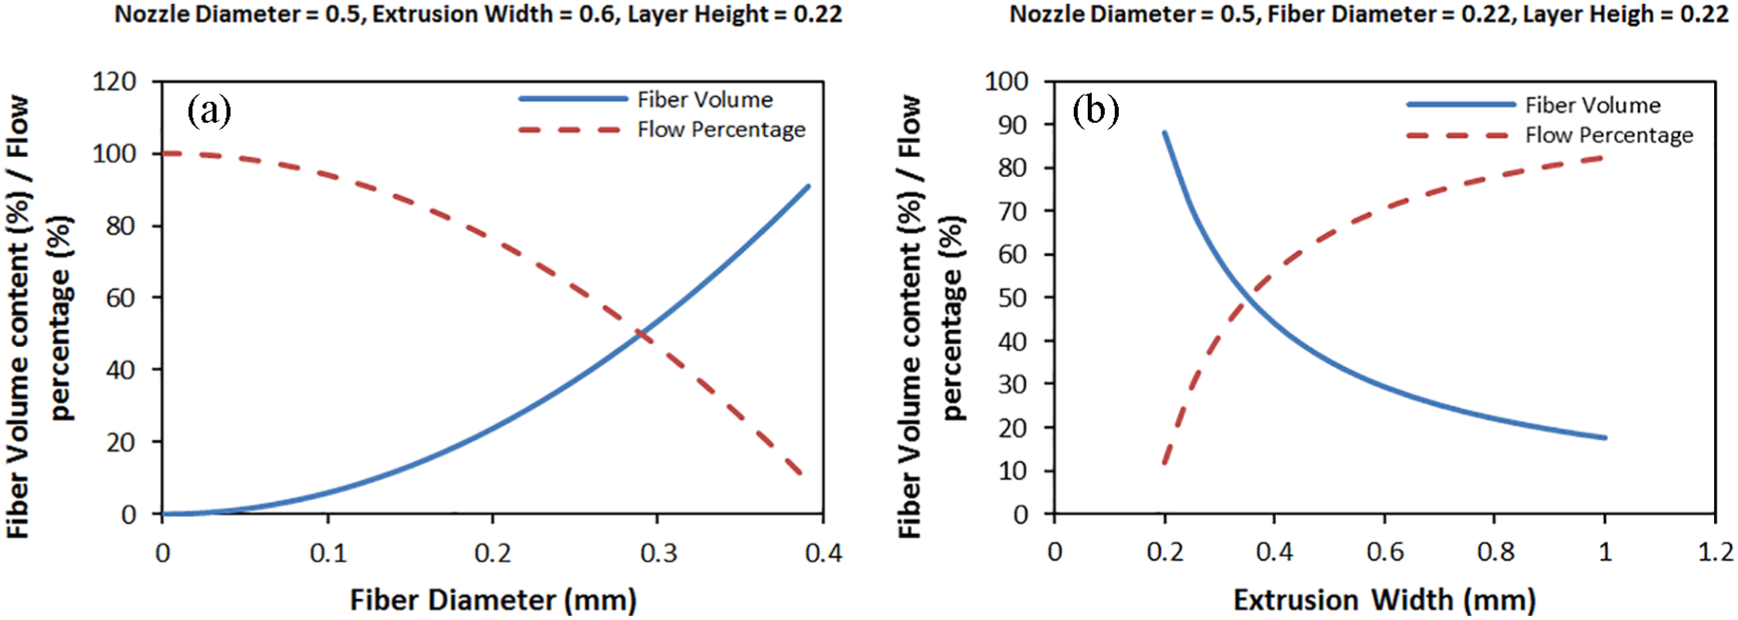
Variations of fiber volume content (percentage)/ flow percentage based on (a) fiber diameter and (b) extrusion width.
Experimental set-up and measurement procedures
Fibers
E-glass fiber yarn was used with the mass per length of 0.1 g/m. Its nominal tensile strength was reported to be around 1000 MPa, although the tensile test was carried out in this research work in order to measure the tensile strength value confidently according to ASTM D2256. The tensile test was performed on 10 samples and the average results are reported. Also, the density of glass fiber yarn was measured according to the Archimedes method.
Polymeric matrix
Various polymeric materials, in filament form, of 1.75 and 3 mm diameters are available for FDM 3D printers. In this study, relatively broad selections of filament-shaped polymeric materials were applied as the matrix to investigate the effectiveness of reinforcement and, more importantly, the compatibility of the implemented procedure with various materials available. A list of the selected polymeric materials in filament form is given in Table 1. To compare the mechanical properties of the neat and the reinforced 3D printed parts, tensile specimens of the neat polymers were also 3D printed, and their mechanical strengths were tested according to ASTM D638 type IV. It is expected that the mechanical properties of the 3D printed parts be lower than those of the injected molded ones.9,29 Also, the bulk density of the samples was measured according to the Archimedes method (ASTM D792).
List of filament-shaped polymeric materials used in this study.
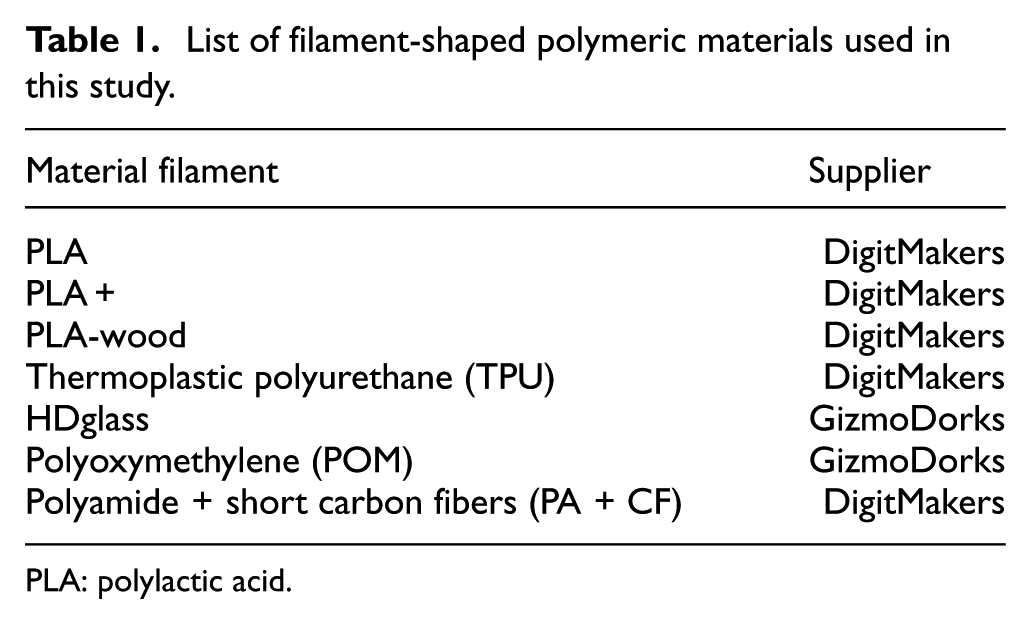
PLA: polylactic acid.
FDM machine
An FDM machine was designed and manufactured to implement the method of fiber embedding into the molten polymeric matrix when extruded from the nozzle, with the build dimensions of 195 × 195 × 200 mm3. A special nozzle was designed and manufactured according to the strategy shown schematically in Figure 4 (in melt simultaneous impregnation). One important parameter is the printing temperature. Depending on the material, a temperature range is usually recommended for printing. A higher temperature causes a higher fluidity (or a lower viscosity) which may enhance the yarn coating and impregnation. 32
Equipment
A universal testing machine (STM-20; Santam, Iran) was used to measure the tensile strength and modulus. For investigating the morphology of the samples, a scanning electron microscope (SEM) (Phenom ProX; Thermo Fisher Scientific, the Netherlands) was employed. To calculate the fiber content according to ASTM D3171, the samples were burned after tensile testing and the residue, namely, glass fibers, was weighed using a scale with a resolution of 0.01 g after washing and drying. The weight ratio was then translated to the volume fraction using equations (12) and (13) 40
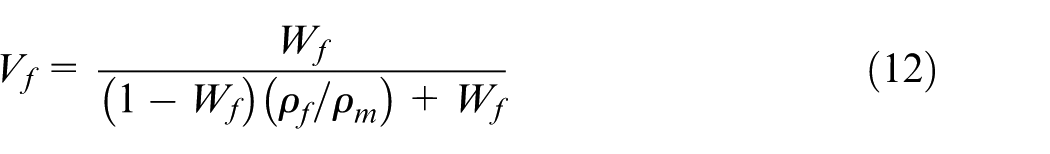

In this equation,
Results and discussion
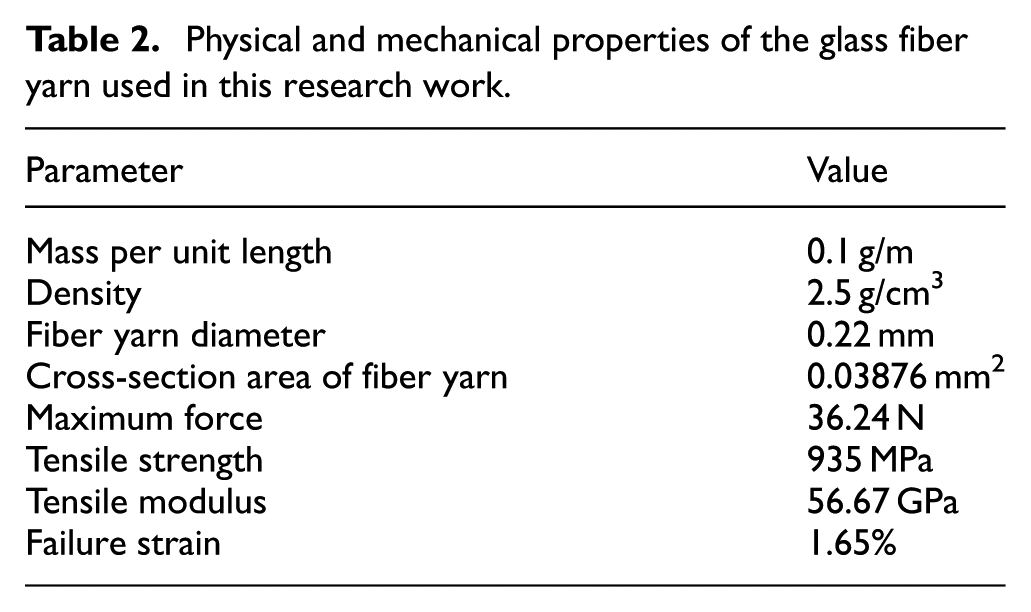
Physical and mechanical properties of glass fiber yarn
The obtained stress–strain curve for the glass fiber yarn is shown in Figure 14, 6 from which the tensile strength and modulus were calculated and are presented in Table 2. The obtained value for tensile strength is in accordance with the reported nominal tensile strength and also the independent investigation reported in the literature. 41
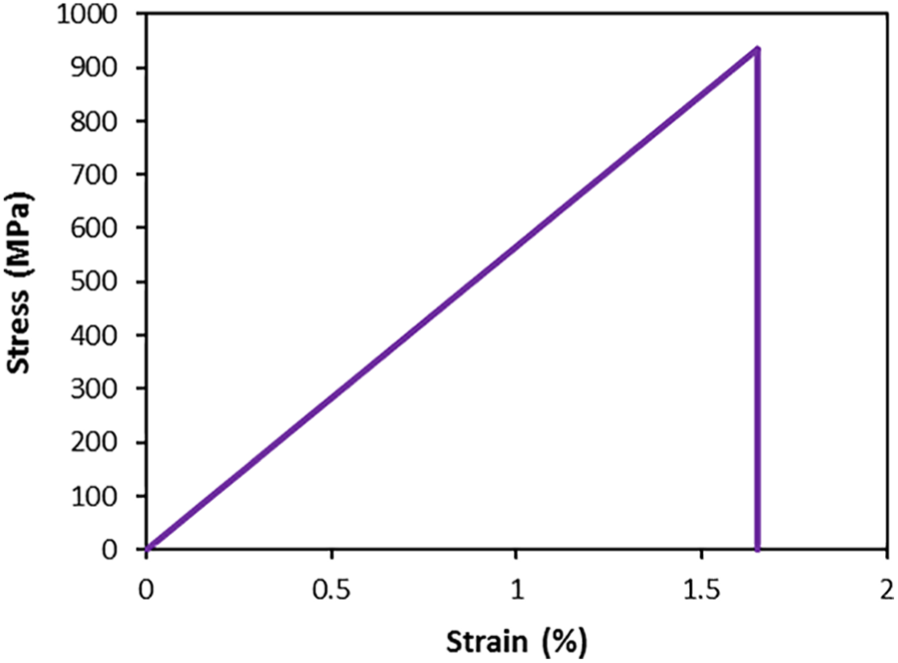
Stress–strain diagram of the glass fiber yarn. 6
Physical and mechanical properties of the glass fiber yarn used in this research work.
Mechanical properties of the neat polymers
The stress–strain diagrams of the examined neat polymers, except polyoxymethylene (POM) and thermoplastic polyurethane (TPU), are shown in Figure 15. TPU showed a large elongation and is depicted separately in Figure 16, due to its elastic nature. As shown in Figures 15 and 16, for all of these materials, the failure strain of the neat polymers is higher than that of yarn fibers (1.65%). When using the POM filament, issues were raised due to its high shrinkage so that no desirable part could be printed. Hence, no sample was available for a tensile test of the printed neat POM. The nozzle and bed temperatures, bulk density, ultimate tensile strength, tensile strength at failure strain of fiber, and tensile modulus of the printed samples of the neat polymers are given in Table 3. The reported values for POM in this table are for a general-purpose POM. Nozzle and bed temperatures were selected as the maximum values recommended by the filament suppliers, which assumingly creates strong bonds between the rasters and the layers, and which does not primarily affect the glass fiber feeding in a moderate temperature interval. 42 The printing speed of 10 mm/s and the air gap of −0.02 mm were selected, similar to the conventional printing. Also, the rasters are aligned in the direction of applied loading, and the concentric infill pattern was considered for printing samples in order to achieve maximum strength. The layer height was selected as 0.22 mm, equal to the glass fiber yarn. An extrusion width of 0.58 mm was chosen to be slightly larger than the nozzle diameter of 0.5 mm. In printing composite and non-composite samples, the build direction was XYZ, the part orientation and raster angle were zero, and the filling percentage was set at 100%.
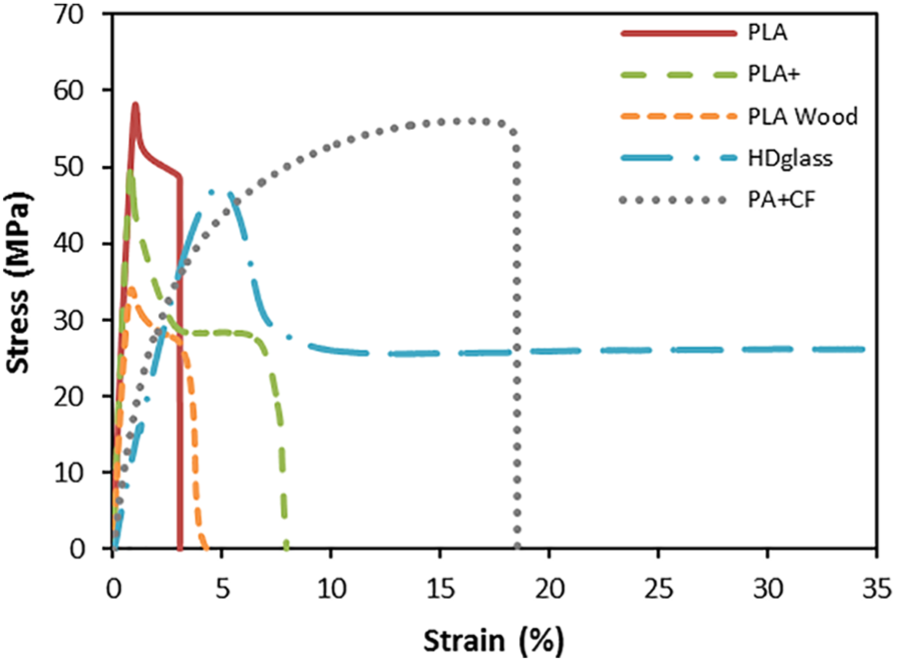
Stress–strain diagrams of the experimental filamented neat polymers, except TPU and POM.
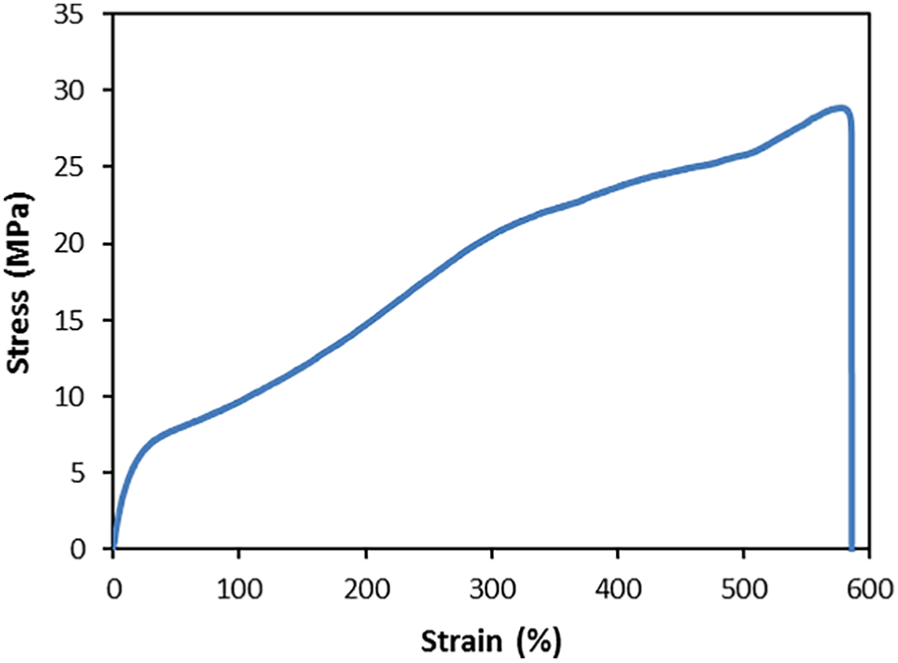
Stress–strain diagram of TPU.
Bulk density, tensile strength, and modulus measured for the 3D printed parts: neat polymers.
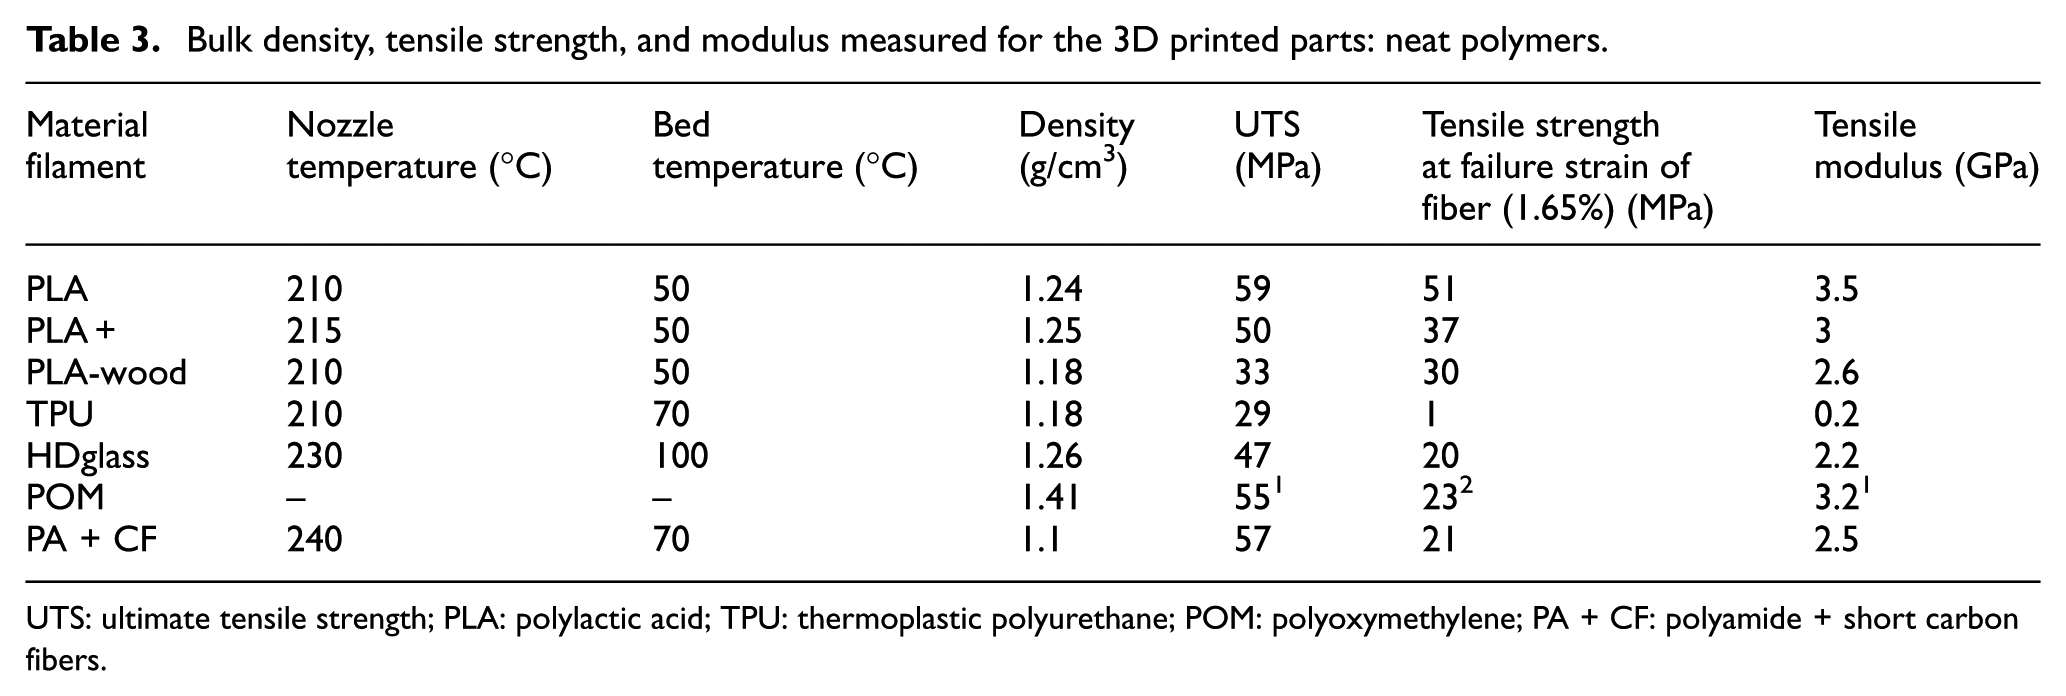
UTS: ultimate tensile strength; PLA: polylactic acid; TPU: thermoplastic polyurethane; POM: polyoxymethylene; PA + CF: polyamide + short carbon fibers.
Printed products with various fiber contents
In order to print the composites with various fiber volume percentages, GF/PLA composites were printed, with the extrusion widths of 0.35, 0.4, 0.5, 0.6, and 0.8 mm. The fiber diameter and layer height are both 0.22 mm. Therefore, the fiber volume percentages according to equation (11) are 50%, 43.2%, 34.5%, 29%, and 21.6% for the extrusion widths of 0.35, 0.4, 0.5, 0.6, and 0.8 mm, respectively. Also, flow percentages according to equation (11) are 50%, 56.8%, 65.5%, 71%, and 78.4% for the volume percentages of 50%, 43.2%, 34.5%, 29%, and 21.6%, respectively. The printed samples are shown in Figure 17. 6 The figure indicates that the fibers’ arrangement is in parallel to each other, almost perfectly, surrounded by the polymeric matrix. As shown in this figure, by increasing the extrusion width, the distance between the fibers increased, which led to a decrease in the fiber volume content.
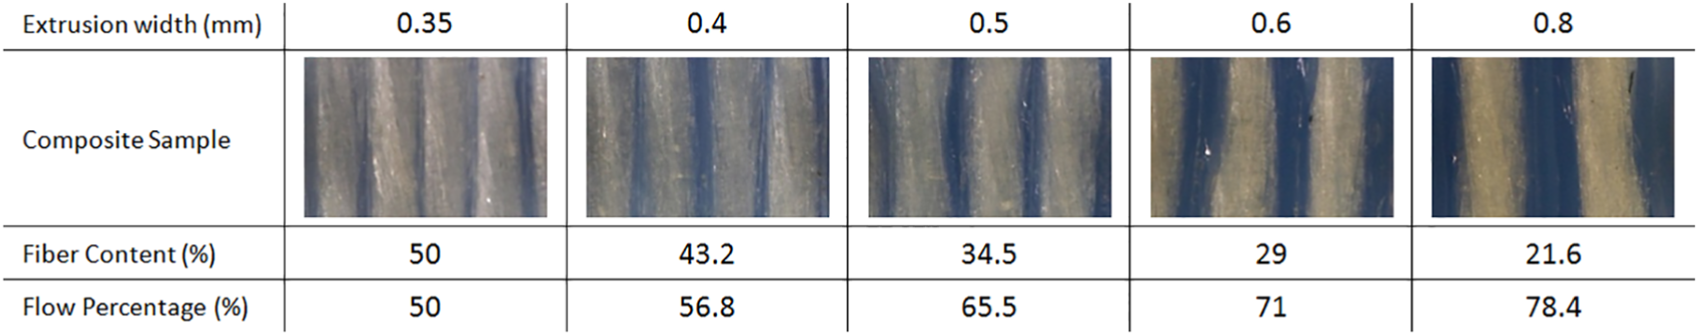
Printed samples of PLA/GF composites with various fiber contents. 6
Printed products with different features
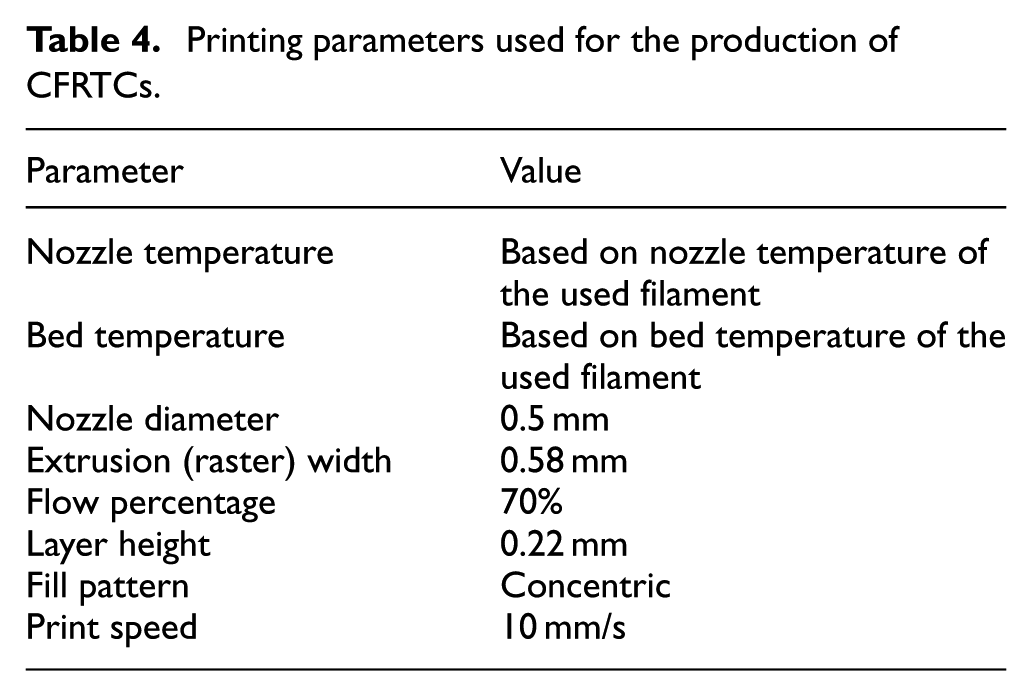
The print parameters for composite samples are given in Table 4, mostly selected according to conventional printing. As the layer height was selected equal to the fiber diameter, the extrusion width and flow percentage were calculated to be 0.58 mm and 70%, respectively, according to equation (11), to yield a fiber volume percentage of 30% and an air gap of −0.02 mm. The outcome of the implemented strategy, presented by the produced reinforced parts, is exhibited in Figure 18. Various samples with different features were produced including bar with straight rasters, disk with circular rasters, flat part with various corner angles, hemisphere with circular rasters of various radiuses and on a curved surface, variable stiffness with curved path, and parts with various fill patterns (filling percentage: 30%); rasters are continued and made with the coated continuous fiber yarn. These specimens show the flexibility of the implemented strategy of continuous fiber reinforcement in the FDM process presented in this study. Some features are nearly impossible to be performed by the conventional continuous fiber reinforcement (such as a hemisphere, web fill pattern). Also, laying up the fibers in a curved path (such as disk sample) is one major advantage of utilizing the 3D printing method, where unique continuous fiber–reinforced products can be proposed for the specific applications. It is clear from Figure 18 that the fibers are neatly deposited at the programmed paths.
Printing parameters used for the production of CFRTCs.
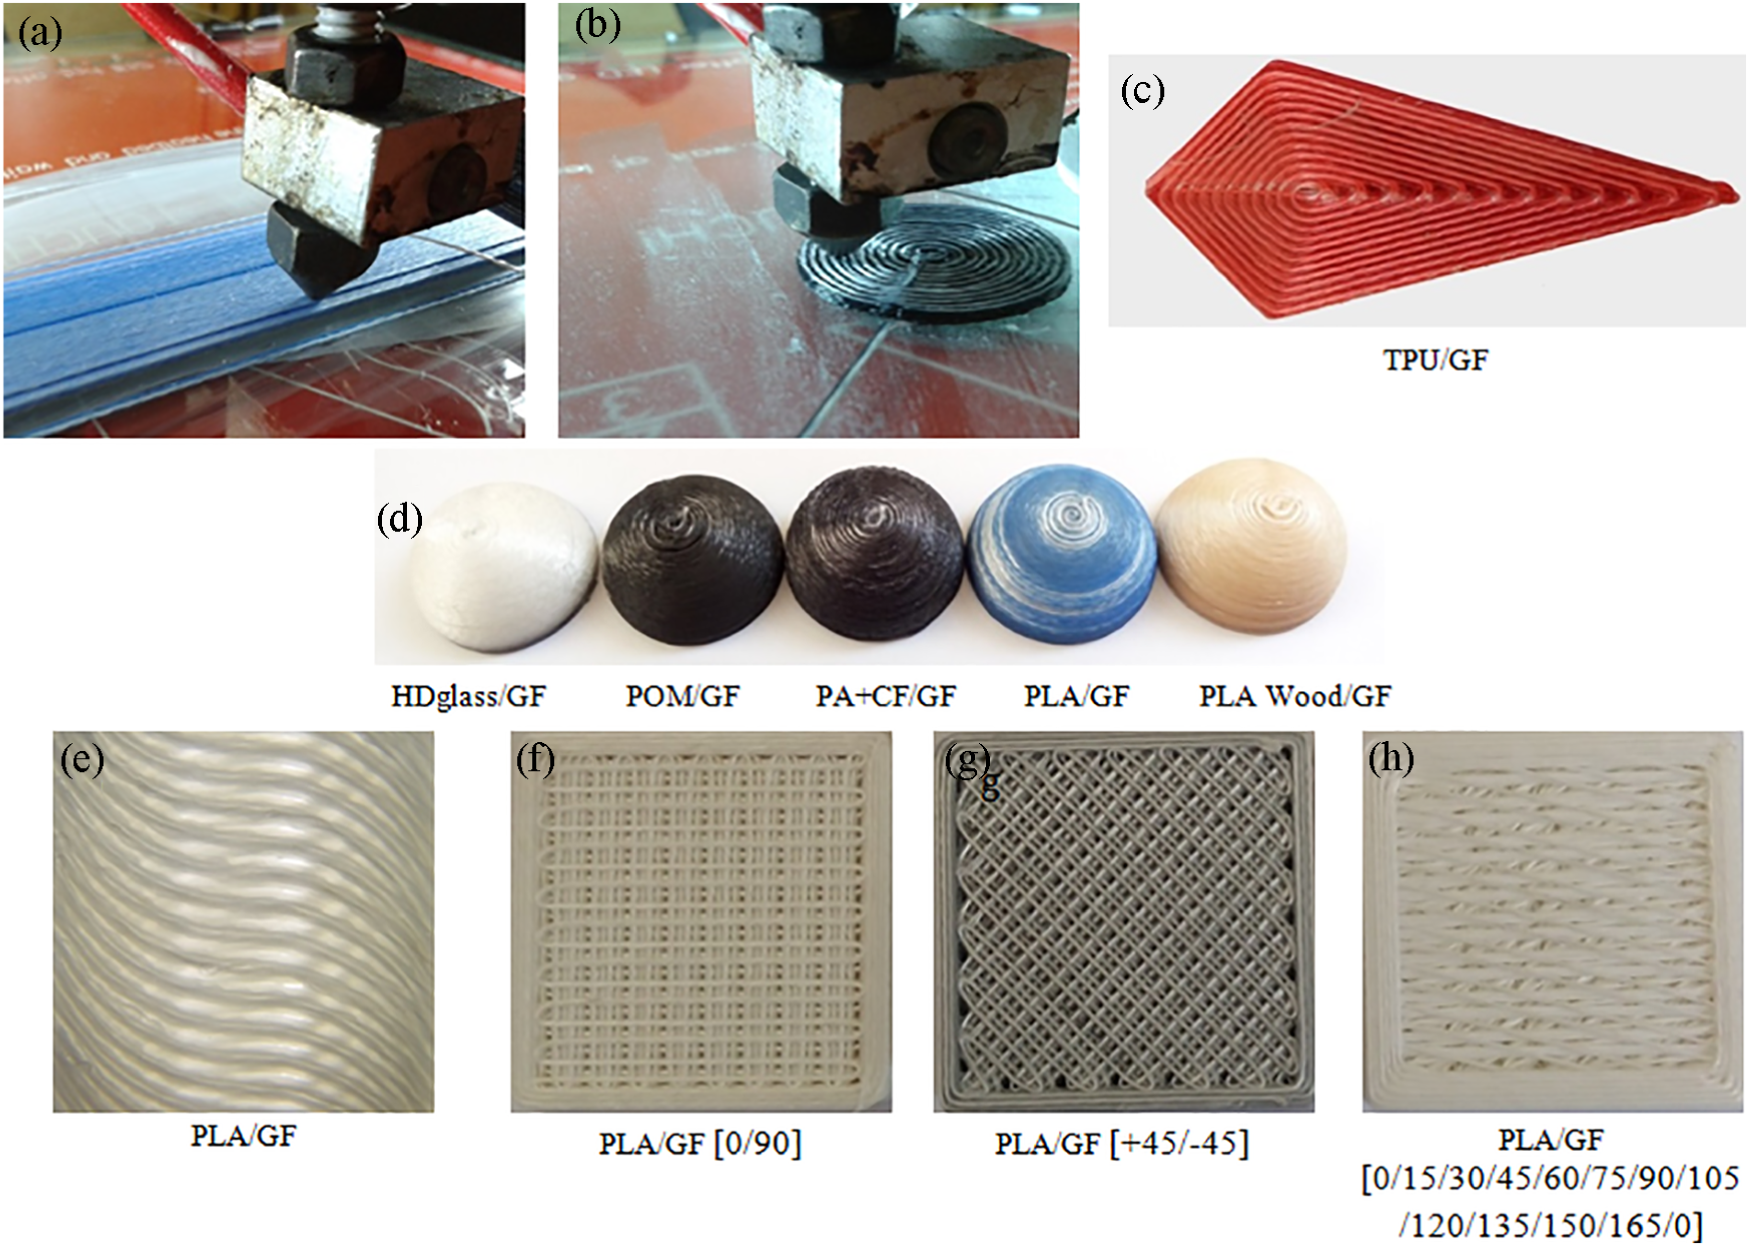
Examples of the produced parts via the implemented strategy of the glass fiber yarn–reinforced 3D printed thermoplastic composites: (a) straight bar with straight rasters, (b) disk with circular rasters, (c) flat part with various corner angles, (d) hemisphere, (e) variable stiffness, (f) [0/90] fill pattern, (g) [+45/–45] fill pattern, and (h) [0/15/30/45/60/75/90/105/120/135/150/165/0] fill pattern.
Mechanical properties of composite samples with 30% fiber content and morphology
For the tensile test of the composites, samples were prepared based on ASTM D638 type IV. With the given parameters in Tables 2 and 4, and applying equations (10) and (11), the flow percentage is 70% and the fiber volume percentage is estimated to be about 30%. The thickness of the tensile specimens with 30% fiber volume percentage was specified at 3.3 mm that resulted in 15 layers of deposition. Also, the infill pattern was concentric to place the rasters and fibers in the direction of loading for the tensile test. The tensile test specimens were tested to measure the effectiveness of the implemented strategy and the function of the fibers, the results of which are plotted in Figure 19. At least, five specimens were produced for each material to yield confident data. The average values of tensile strength of the produced composite samples, as well as the percentage of increase in strength in comparison with neat materials, are listed in Table 5. The values in the table indicate that a high strength of up to 300 MPa can be achieved via the process. A remarkable increase in strength was observed for PLA-wood and TPU, by about 700%. It must be, however, noted that all the tensile test specimens were fractured in the zone beyond the gauge length, close to the gripping zone, as shown in Figure 20. This indicates that the actual strength is far above the measured strength given in Table 5. This also means that the ASTM standards used to test these samples are insufficient and samples with a different configuration should be proposed. The out-of-gauge zone fracture was due to the concentration of stress. As shown in Figure 20(b), there are regions where gaps are present, due to the geometry of the parts, and that does not play a notable contributing role in tensile tolerance. It is thus expected that the obtained tensile strengths could be lower than the theoretical values yielded by the rule of mixtures, which will be discussed in the following sections.
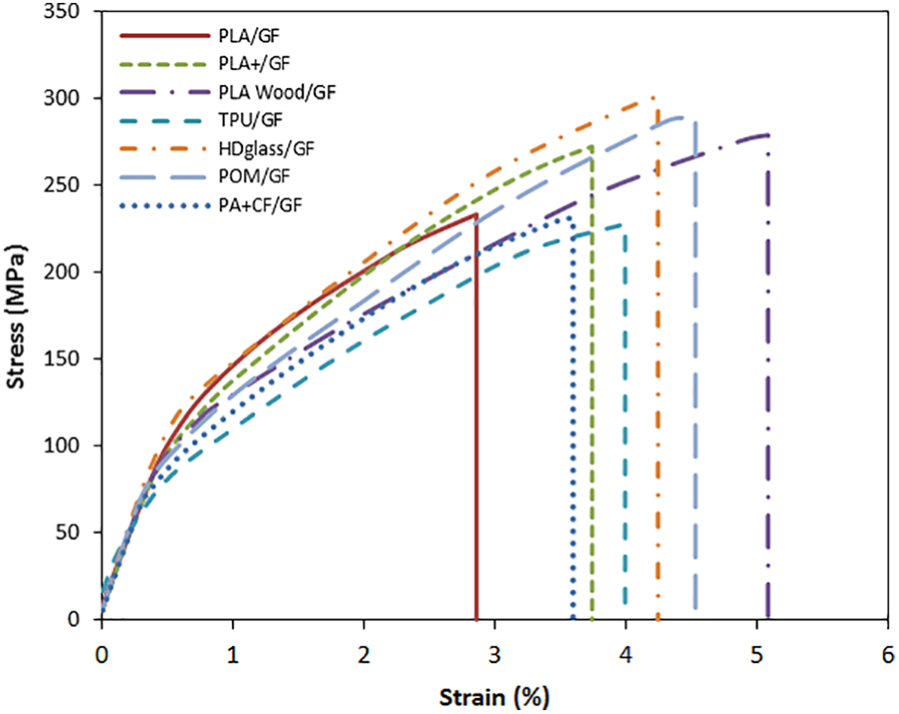
Stress–strain diagrams for each 3D printed composite sample.
Tensile strength of composite samples and percentage of increase of the strength.
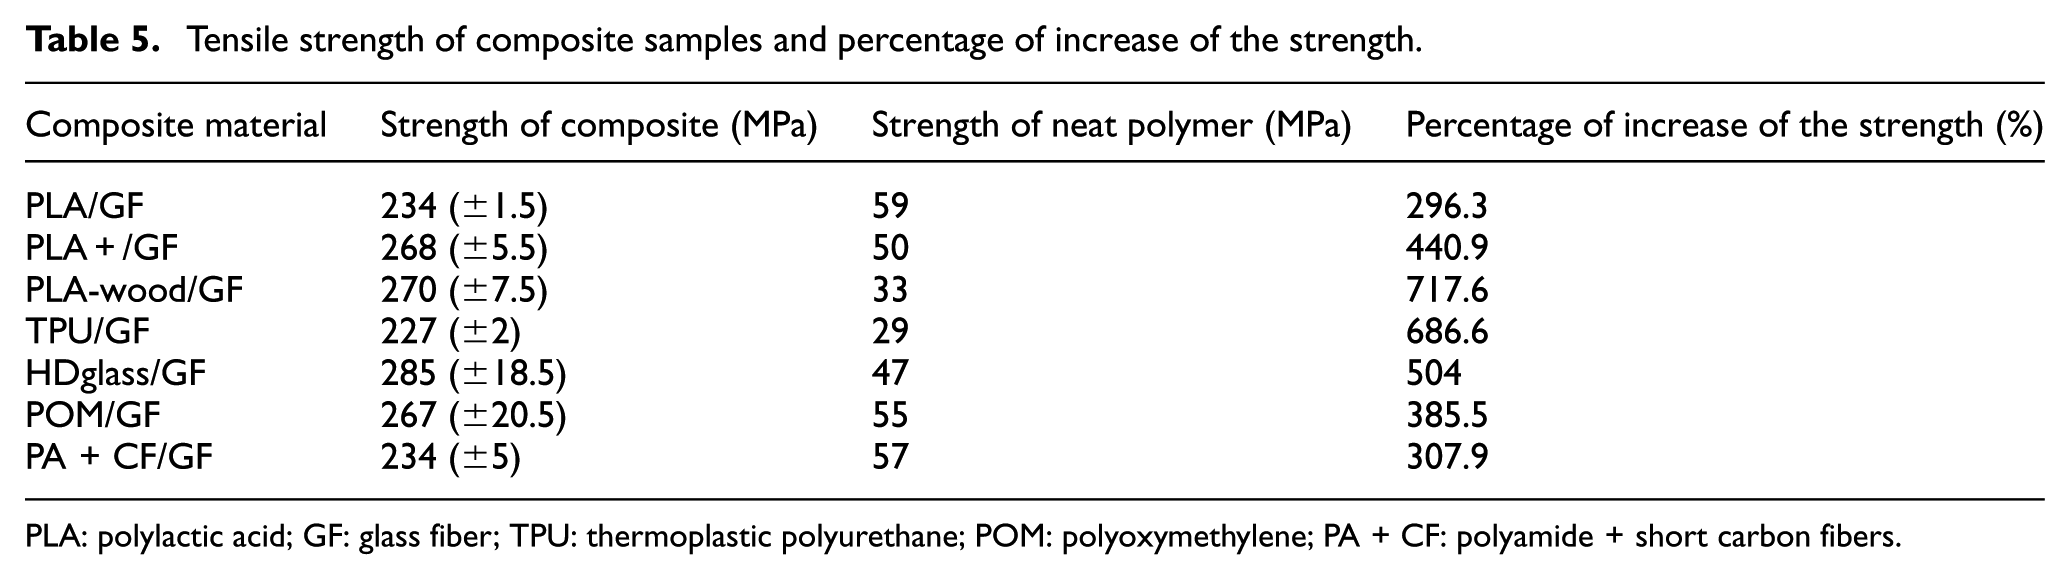
PLA: polylactic acid; GF: glass fiber; TPU: thermoplastic polyurethane; POM: polyoxymethylene; PA + CF: polyamide + short carbon fibers.
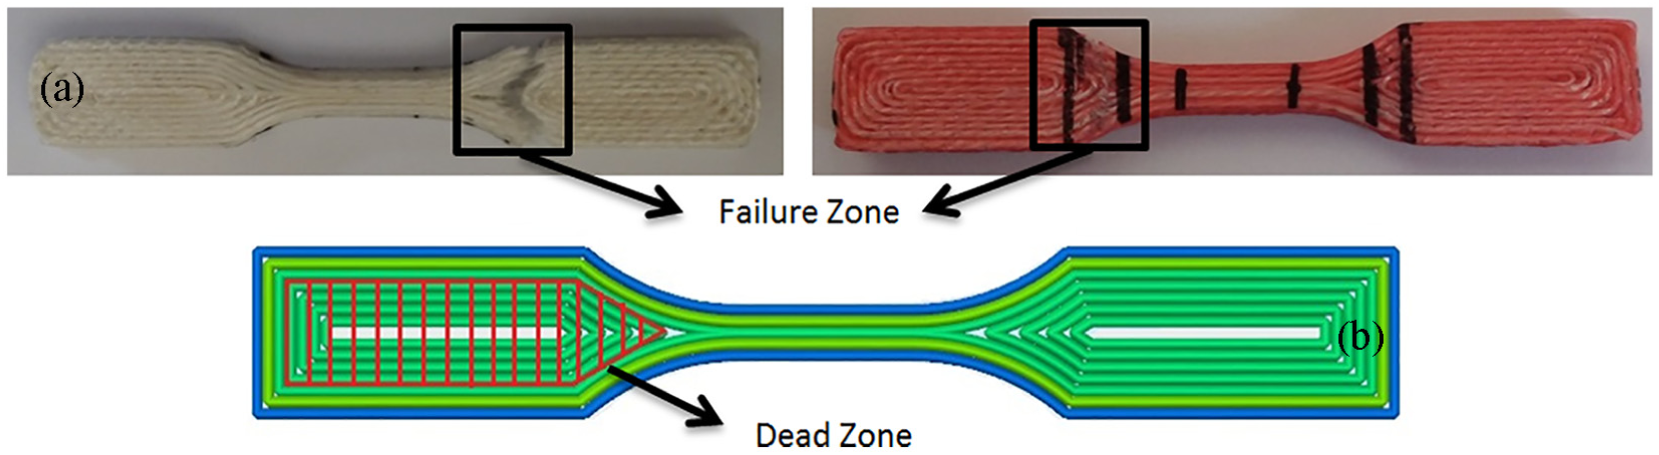
Failure beyond the gauge length occurred in the produced tensile specimens: (a) selected samples failed with the indicated failure zones and (b) the indicated zone does not play a notable contributing role in tensile tolerance.
Fiber volume content
Table 6 presents the measured weight and the calculated fiber volume percentage in the examined samples made with each polymeric material.
Weight and fiber volume content of the produced specimens.
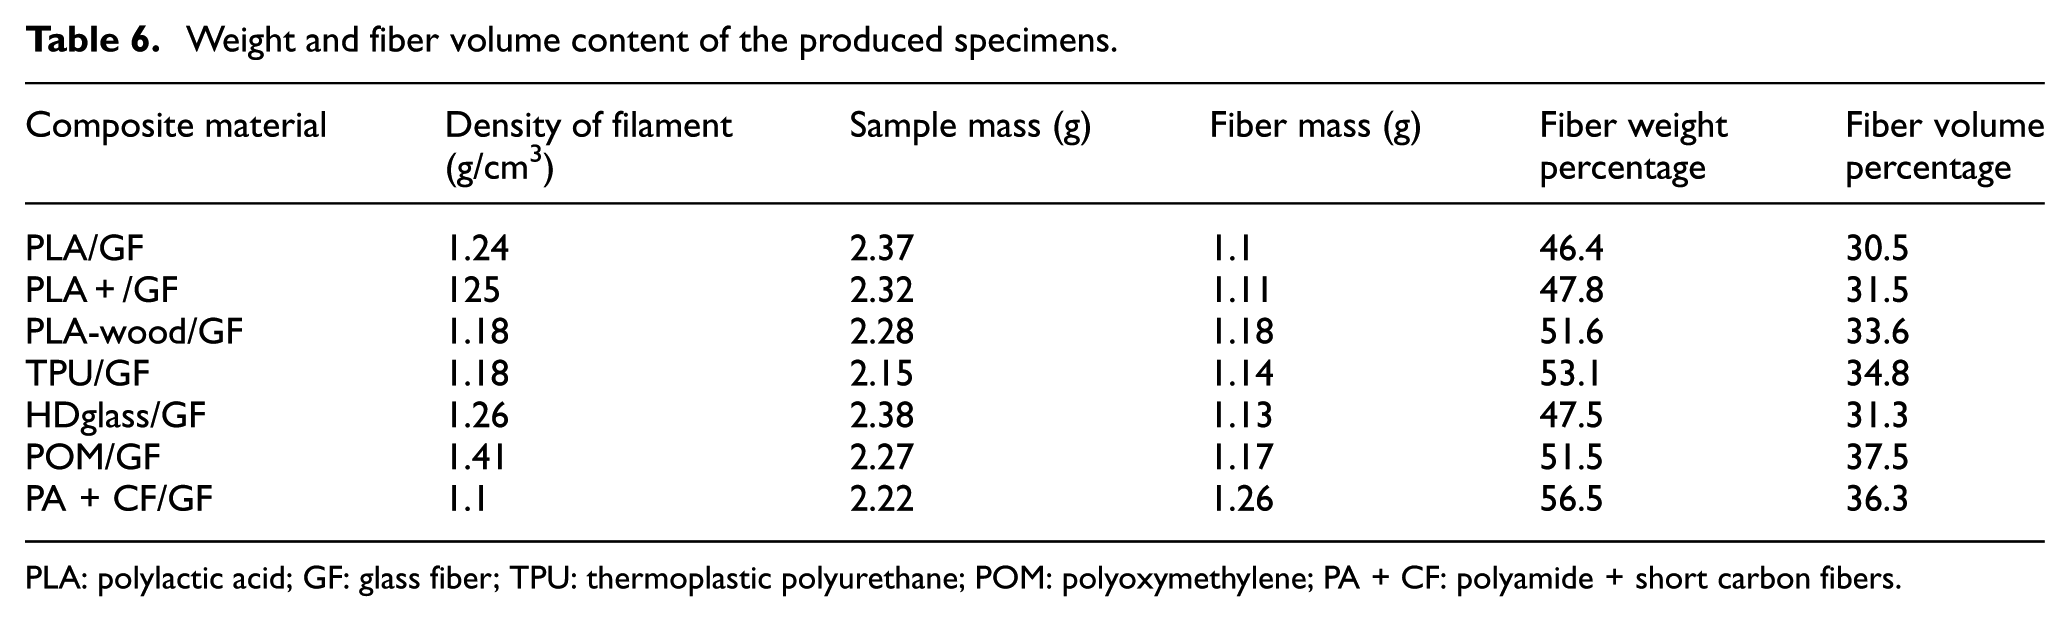
PLA: polylactic acid; GF: glass fiber; TPU: thermoplastic polyurethane; POM: polyoxymethylene; PA + CF: polyamide + short carbon fibers.
Theoretical estimation of tensile strength
Rule of mixture was used to estimate the tensile strength based on the measured fiber volume percentage for each sample, presented by equation (14) 40

In this equation, σ is the tensile strength;
Difference between experimental and theoretical strengths.
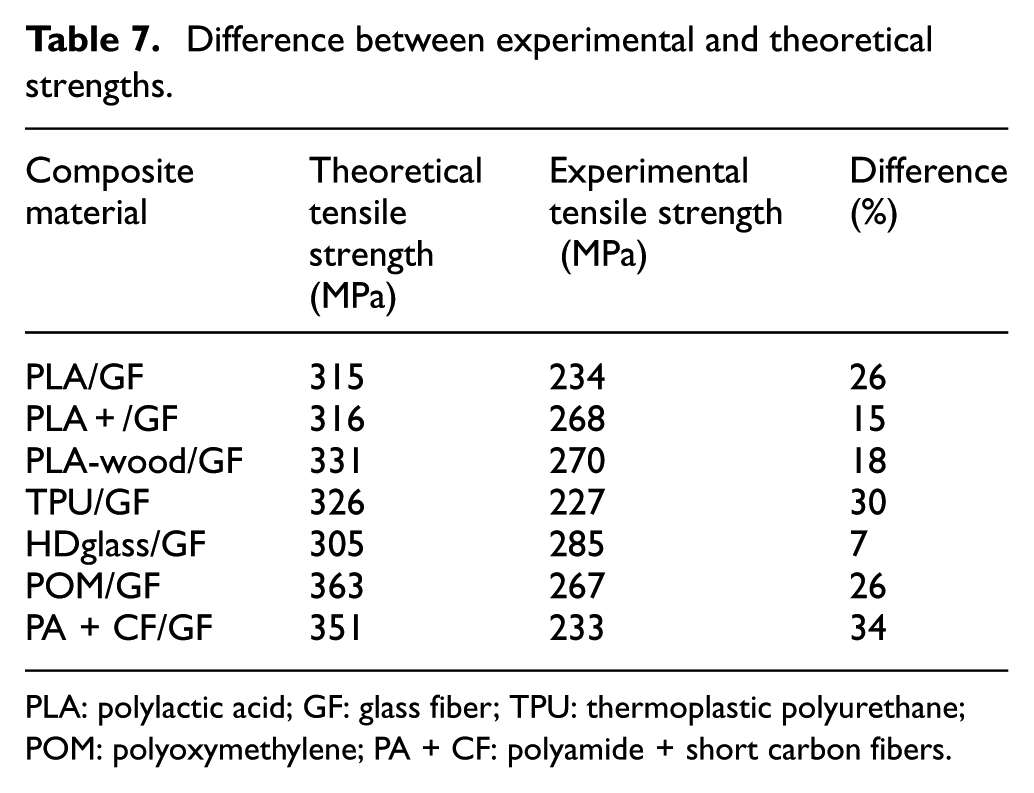
PLA: polylactic acid; GF: glass fiber; TPU: thermoplastic polyurethane; POM: polyoxymethylene; PA + CF: polyamide + short carbon fibers.
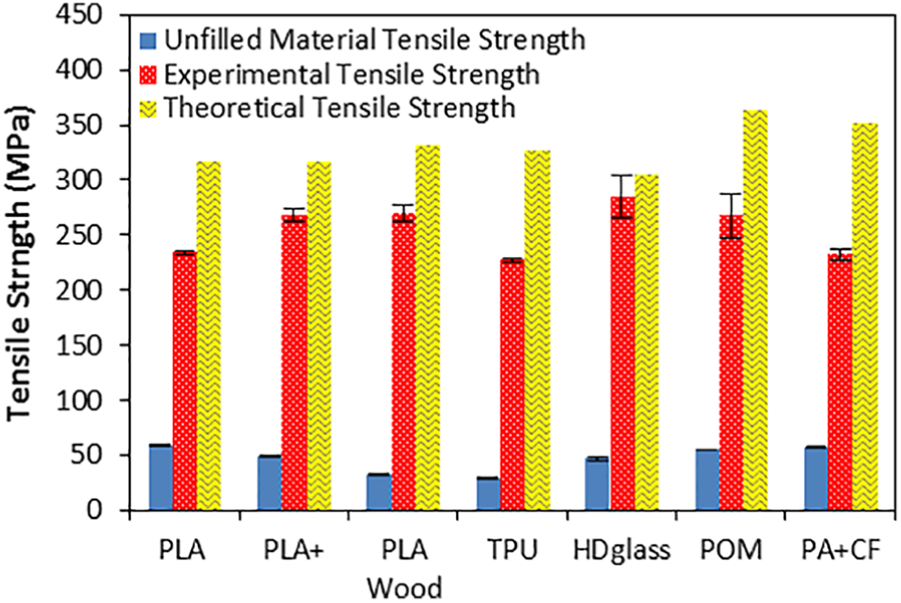
Comparison of tensile strengths of the experimental materials: unfilled, experimental, and theoretical prediction.
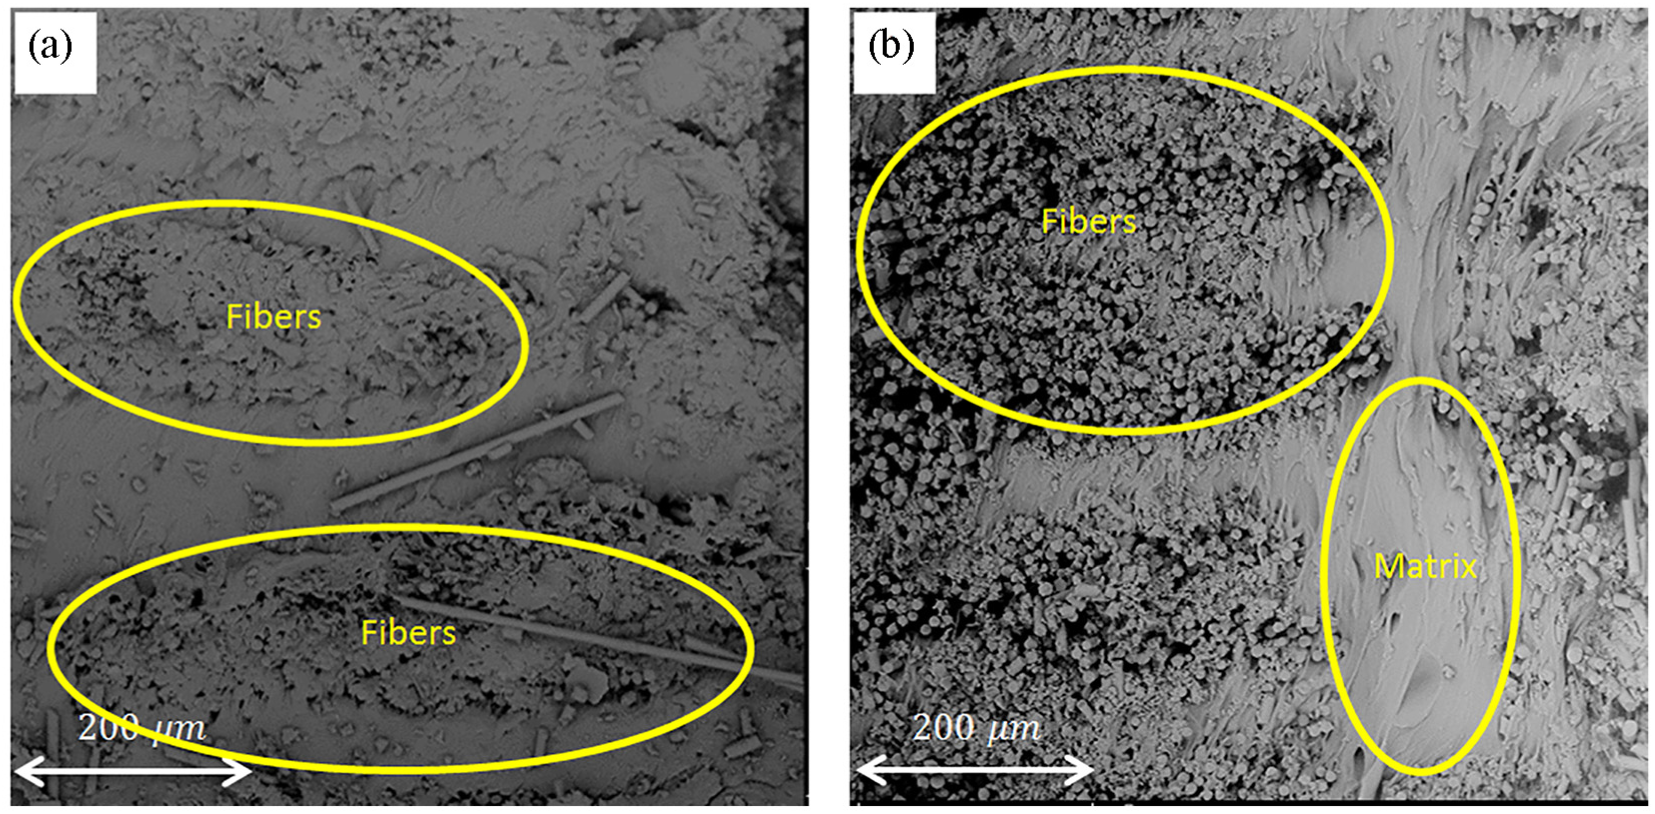
SEM image of fracture cross-section of the selected samples showing the quality of integration of glass fibers with the polymeric matrix: (a) PLA+ and (b) HDglass.
Theoretical estimation of modulus of elasticity
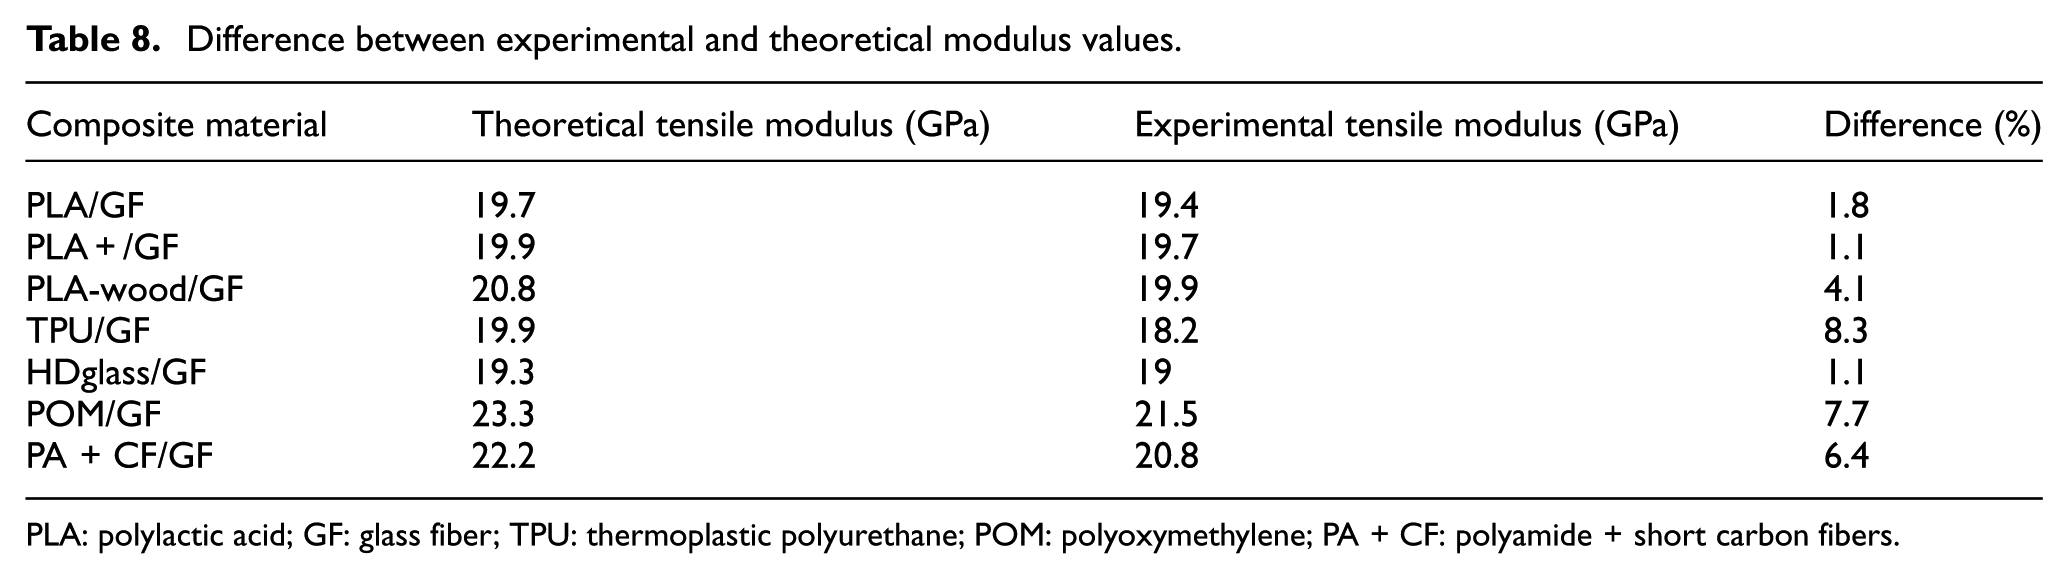
Rule of mixture was used to estimate the tensile modulus based on the measured volume fraction for each composite sample, presented by equation (15) 40

In this equation, E is the tensile modulus. The predicted values are given in Table 8 and compared with the experimental results. Figure 23 shows the comparison of the tensile modulus of the unfilled specimens, experimental filled specimens, and the theoretical predictions for all experimental materials. The least difference between the experimental and theoretical values belonged to PLA+ and HDglass, with a difference of 1.1%. The very low difference indicated a sign of effective role of deposited fibers in load carrying and thus the efficiency of the implemented strategy of depositing fibers, to produce continuous fiber–reinforced 3D printed composites.
Difference between experimental and theoretical modulus values.
PLA: polylactic acid; GF: glass fiber; TPU: thermoplastic polyurethane; POM: polyoxymethylene; PA + CF: polyamide + short carbon fibers.
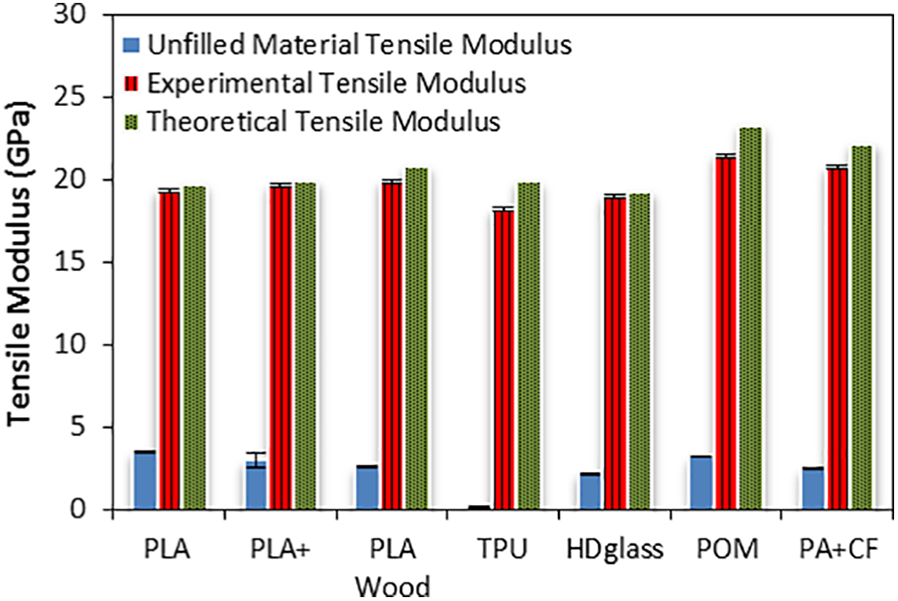
Comparison of the tensile modulus of the experimental materials: unfilled, experimental, and theoretical prediction.
Conclusion
An innovative strategy was devised and implemented to simultaneously deposit continuous glass fibers with the polymeric matrix to produce continuous fiber–reinforced FDM 3D printed parts. In the implemented method, the continuous fiber yarn enters into the molten zone through a provisioned orifice at the nozzle where the fibers are coated and (partially) impregnated with the molten material, hence called in-melt simultaneous impregnation. The main advantage of this method is the ability to vary the fiber content, not observed in the published competitive works. Besides the nozzle design, the main consideration was to accurately calculate and adjust the feed of polymeric filament (with modification of the programming code) and to yield the desired fiber volume percentage, according to the fiber yarn diameter. Various materials were examined to produce composite parts via the FDM printer. The results conclude the following:
The printed samples indicated the successful implementation of the strategy that could produce 3D printed composite parts with various glass fiber volume percentages, up to 50%.
All the examined materials including PLA, PLA+, PLA/wood, TPU, POM, and PA/CF were successfully strengthened with glass fiber in printing, and quality parts were obtained.
The tensile test results revealed an outstanding tensile strength of up to 300 MPa, namely, a 700% increase in strength, with the consistent volume fraction of about 0.33. The values of strengths were compared with those predicted by the rule of mixtures and showed differences from 7% for HDglass to 34% for PA + CF.
The remarkable increase in tensile modulus was observed for all the examined materials, up to 21.5 GPa with a glass fiber volume fraction of about 0.33. The exceptional increase was observed with TPU, up 90 times. The differences with the theoretical values, via the rule of mixtures, were slim from 1.1% to 7.7%.
SEM images suggest an acceptable integration of fibers and matrix.
Parts with various features (curved rasters, various corner angles, curved 3D surface, variable stiffness, types of filling patterns) were successfully 3D printed that suggest the flexibility of the implemented method.
The implemented method is insensitive to the fiber material; hence, while glass fiber yarn was used in this study, alternatives such as CF yarn can also be employed.
The current limitation of this method is the fiber volume percentage that is highly challenging above 50%, although this needs to be tackled in future works. Also fibers in the form of yarn are the best option and using the fiber tow is more challenging.
Footnotes
Declaration of Conflicting Interests
The author(s) declared no potential conflicts of interest with respect to the research, authorship, and/or publication of this article.
Funding
The author(s) received no financial support for the research, authorship, and/or publication of this article.