
Abstract
The car cover mold has characteristics of large structure size, complicated surface shape, dimensional precision, and high surface precision. The milling process of the splicing transition zone having different hardness can easily produce load mutation, which has an impact on the tool in the form of vibration. This vibration affects the surface topography of the splicing transition zone. In this article, we propose the surface motion model for ball-end milling cutter with impact vibration and the surface topography prediction model for splicing transition zone which is established based on the Non-Uniform Rational B-Splines (NURBS) surface control point reconstruction. Then, the effects of surface splicing characteristics (different hardness, over-seam scale, etc.) and processing parameters on the surface topography and on the residual height have been analyzed. Finally, based on the hardened steel surface splicing milling experiment, the accuracy of the surface topography model in which vibration impact has been incorporated is verified. At the same time, the corresponding roughness value and fractal dimension are calculated on the basis of two-dimensional contour graph under different splicing characteristics. The results show that the non-linear characteristics of the surface topography of the hardened steel surface are significant, and the best processing parameters can be obtained under different splicing characteristics.
Introduction
The car cover mold has the characteristics of large structure size, complicated surface shape, dimensional precision, and high surface precision. In order to meet the processing precision of large stamping molds and to improve the processing efficiency, large cover parts mold finish machining mostly adopts the method that overall milling after insert block mold splicing. Due to the large proportion of non-uniform high hardness surfaces in the processing area, the hardness difference between the inserts is between HRC5 and HRC10, and the hardness difference between the inserts and the mold body reaches to HRC15. The splicing mold is shown in Figure 1. In the process of milling, the milling of different hardness splicing transition zone with different hardness can easily lead to the load mutation, which has obvious vibration impact on the tool. The size and position of the tool cut interface change constantly in the surface machining, which will directly affect the three-dimensional (3D) surface topography modeling. Therefore, in the modeling of complex surface splicing mold surface topography, it is necessary to consider not only the influence of the tool forced vibration, wear, impact deformation, and other factors on the surface topography but also the influence of the mold surface features on the mold surface topography.1,2
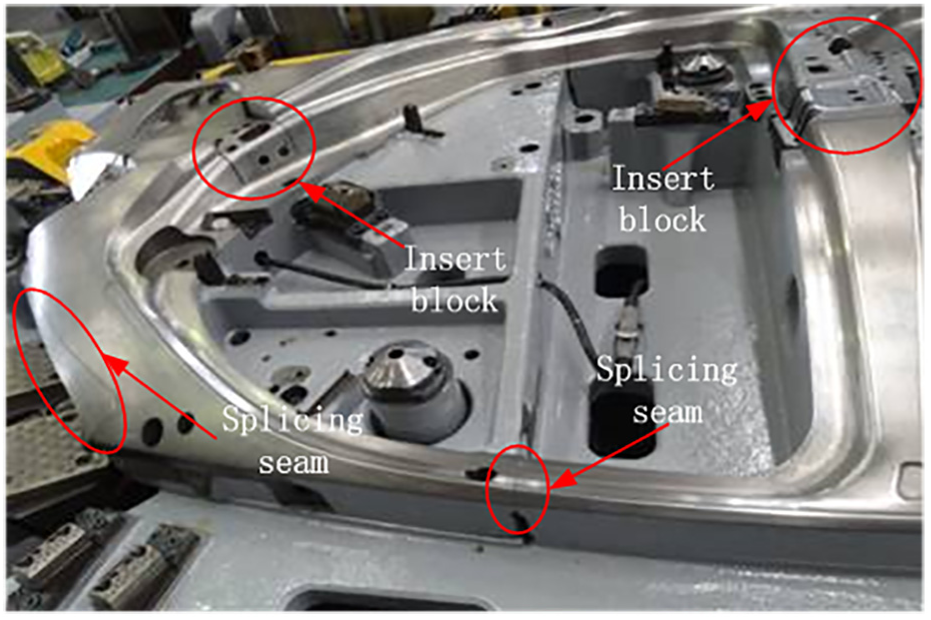
The mold of side enclosure of a car with splicing seam and inserts.
The research work on the modeling techniques for the surface topography of ball-end milling can be divided into two categories. The first technique uses the envelope constraint formed on the tool cutting edge trajectory to model the maximum height of the residual material on the workpiece surface to realize the simulation of the machined surface profile. 3 The second technique uses Z-map method.4,5 None of these techniques include time variable. They cannot be used to model the dynamic response in the milling process and are not suitable for dynamic error profile modeling application.
At present, some tentative studies have been made on the 3D analysis and machining error prediction of machined surface produced at home and abroad. Zhang et al. 6 and Dang et al. 7 have studied the influence of feed mode, angle of inclination and feed rate on the surface topography, and roughness of the workpiece. Peng et al. 8 have used the cutting edge kinematics and cutting mechanism of machining process to study the forming process of workpiece surface topography. The 3D trajectory of the tool and the 3D machined surface topography model are developed. The model incorporates the main factors such as cutting parameters, tool tip geometry, and cutting vibration. The surface of the cutting workpiece is tested by non-contact surface profilometer. Liang and Yao 9 have presented a double buffer discrete mechanism to buffer the residual height at the equidistant between the workpiece surface and the buffer response at the tool end and they also find the same for other time intervals using the 3D trochoid trajectory of the ball-end milling edge. The nominal machining surface modeling and dynamic response trajectory simulation of five-axis milling are performed.
To study the influence of the surface curvature processing characteristics of high-speed milling of machined surface topography of hardened steel, Chen et al.10,11 have used the geometric modeling method to analyze the contact area of workpiece and the influence of different aspects of tool on machining characteristics. It is found that the tool posture with a composite inclination angle with a negative inclination angle, and a positive lead angle are helpful to improve the cutting efficiency and maintain higher cutting speed. The surface performance of the multi-spindle ball-end milling is studied to improve the high performance of the multi-spindle ball-end mill. The cutting speed and machining characteristics of the meshing cutting edge under different dip angles are analyzed. Gray et al. 12 have applied this method to evaluate the influence of tool position on the machined surface profile of five-axis milling. It is found that the equivalent method of tool path envelope surface is only applicable to the milling conditions in which the tool real distance is much larger than the feed per tooth and it is not possible to describe the details of the shape of the adjacent cutting edge in the process of turning.
To study the influence of tool characteristics on the surface topography of hardened steel at high-speed milling, Senatore et al. 13 have used this method for the tool selection and tool path planning in surface machining. Zhang et al.14,15 have established an online simulation model for surface topography of curved surface by considering the cutting edge locus equation which is affected by the tool wear and the side slip angle. Compared with the surface topography of B-spline surface, the prediction of the surface topography model is in good agreement with the experimental results. Xu et al. 16 have established a new simulation model by combining the sweep surface model and the N-buffer method, which can be used to study the effect of cutting parameters and tool runout on the surface topography of the milling. Wan et al. 17 have studied the spectra of the machined surface and pointed out that in the case of stable milling, the only significant spectral property is related to the marks belonging to feed rate. However, in the case of chatter vibration, an inclined pattern of dense spectral property is formed, which is associated with the chatter frequency.
In the article, as for the instantaneous cut out the impact force and instantaneous cut into the impact force of the free form surface cover splicing, the main objective of the study is to provide the machining model for weak rigid milling system and rigid complex splicing surface. We develop the 3D surface topography simulation model for the ball-end milling cutter. The model is capable to analyze the influence of surface splicing characteristics (different hardness, over-seam size, etc.) and processing parameters on machined surface topography and residual height. The accuracy of surface topography prediction model in which impact vibration has been incorporated is verified by performing the hardened steel surface splicing milling experiments, and the non-linear characteristics of machined surface topography are analyzed in the same experiment.
The cutting motion model for the cutting edge considering the impact vibration scheme
The geometric model of the cutting edge of the ball-end milling cutter is shown in Figure 2. The tool coordinate system
Integral ball-end milling tool.
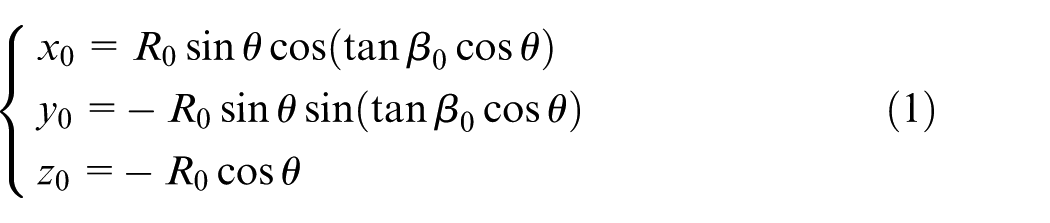
In order to facilitate the calculation, any point (e.g. point
where
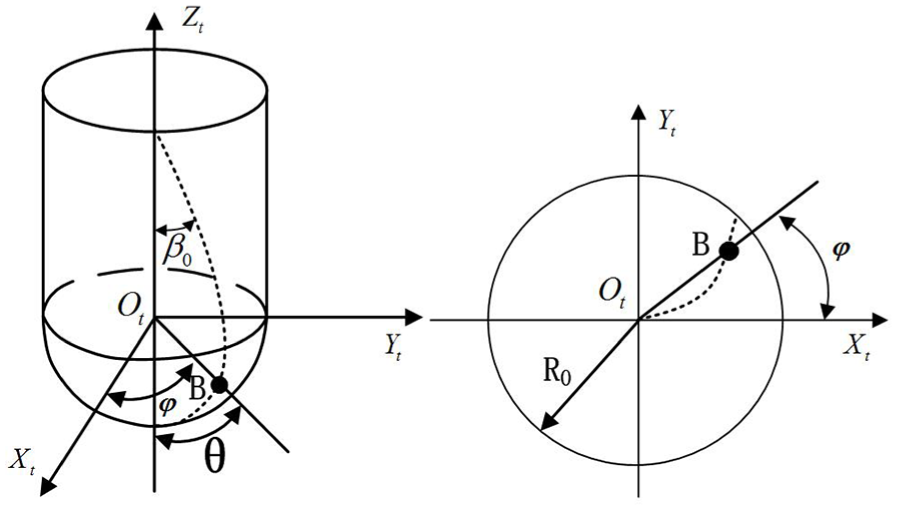
As shown in Figure 3(a), the coordinates of any point (e.g. point
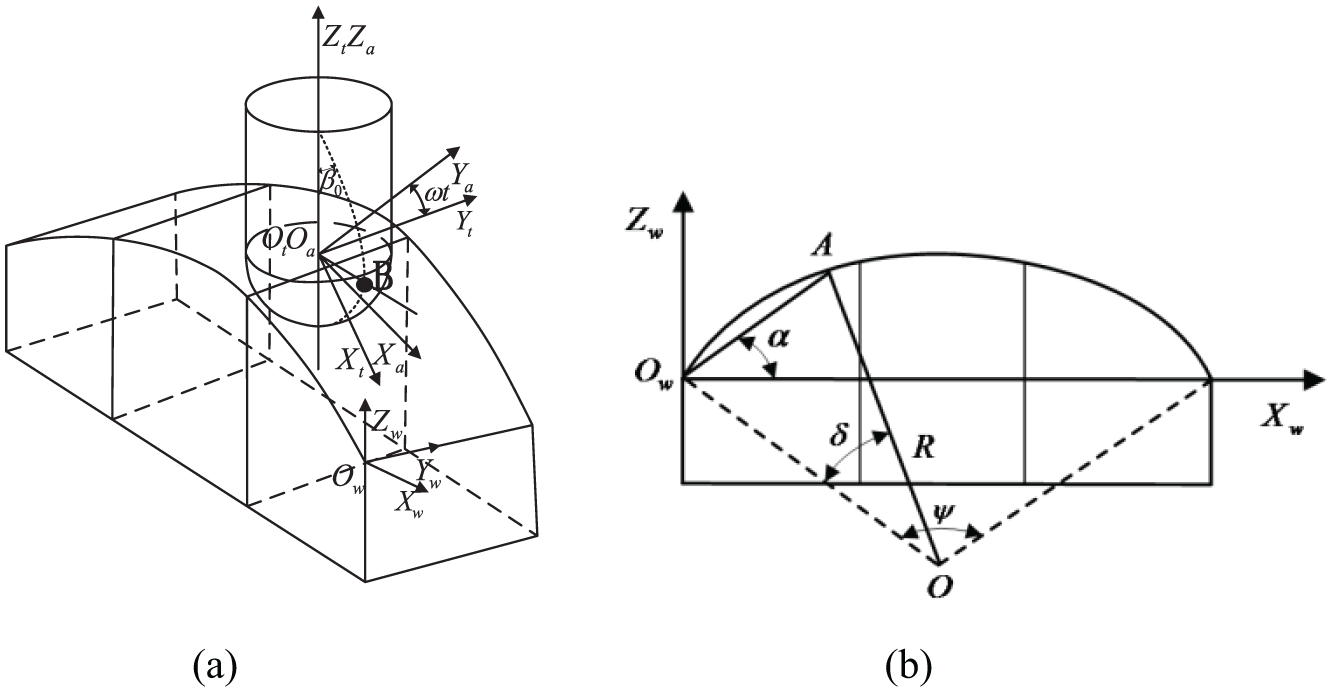
Cutting motion coordinate system: (a) Geometries in milling of the model; (b) Projections directed along the z-axis.
When the cutting edges are more than one, there is an angle transition between each cutting edge and the first cutting edge. The transition matrix is then expressed as follows
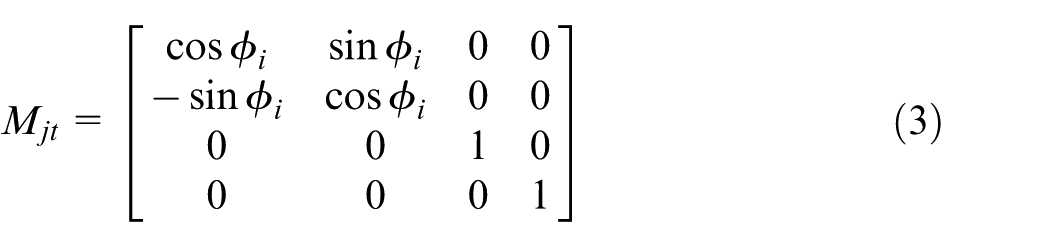
where
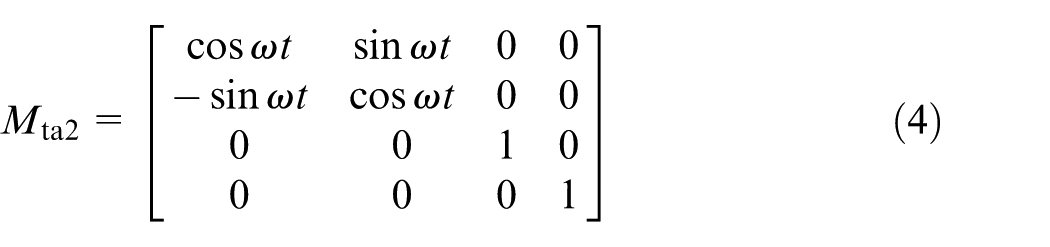
In the cutting process, the tool is represented by its own rotary motion. The rotation of the tool coordinate system is converted to the spindle coordinate system. The rotation matrix is expressed as follows
When the tool produces impact vibration, the impact vibration displacement matrix is expressed as follows
As the mass of the workpiece is far greater than that of the tool, only the milling cutter is considered to be a low rigidity system.18–20 Furthermore, assuming that the system is undamped,
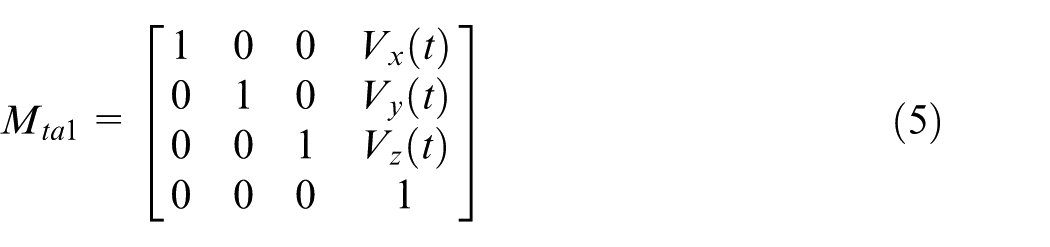
When the tool is given a feed motion, the amount of translation in the three directions is only related to the feed direction. The translation matrix is expressed as follows 21
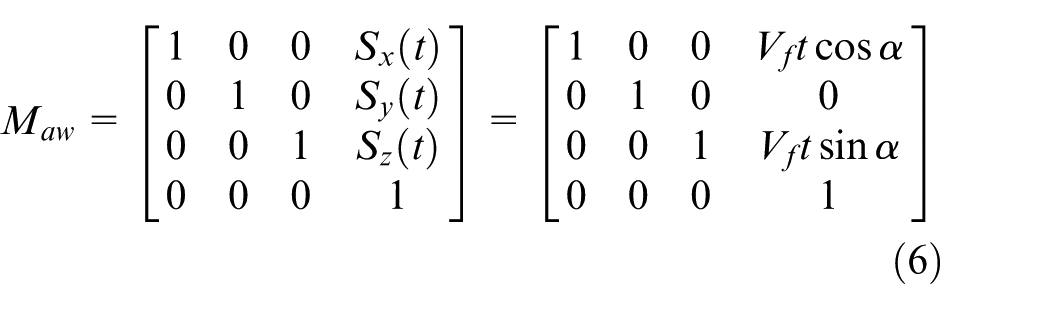
At this moment, the translation transformation matrix is only suitable for the convex arc surface machining with a constant curvature.
In the cutting process, the cutting method is unidirectional, and there is a change of line feed in the direction of row spacing. The line feed transformation matrix is expressed as follows

where
In order to facilitate the calculations without affecting the results, it is assumed that every cycle of the knife starts at time 0. When the tool reaches the same
where
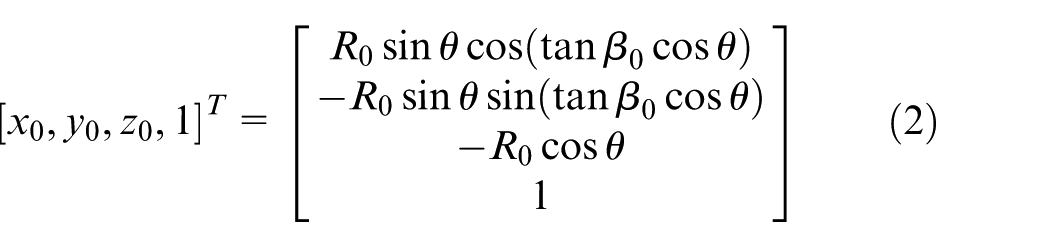
In summary, the coordinate value of any point of the cutting edge of the three-axis ball end in the workpiece coordinate system is expressed as follows
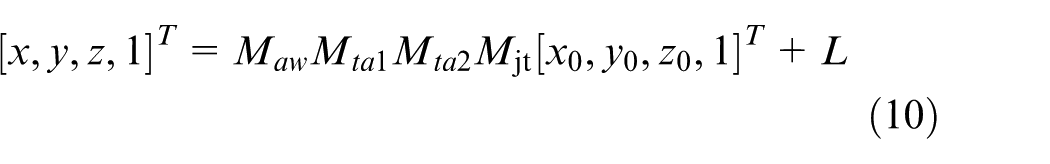
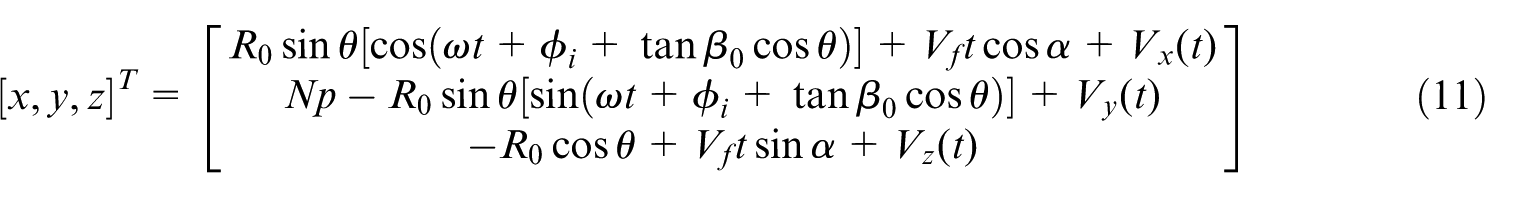
where
Simulation of surface topography considering forced vibration
A simulation algorithm of NURBS surface topography is conducted based on the surface control point reconstruction. First, the 3D model of splicing mold is developed. Then, the mold surface is divided into
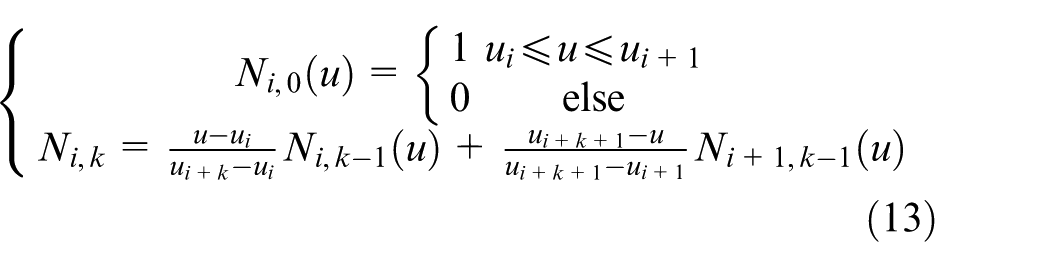
In this article, the surface topography is reconstructed based on NURBS surface control points according to the coordinate values of the residual grid points. Using this method, the required surface can be accurately fitted out with less points; the simulation efficiency is greatly improved.22–24 Assuming that NURBS curved surface meshed into a
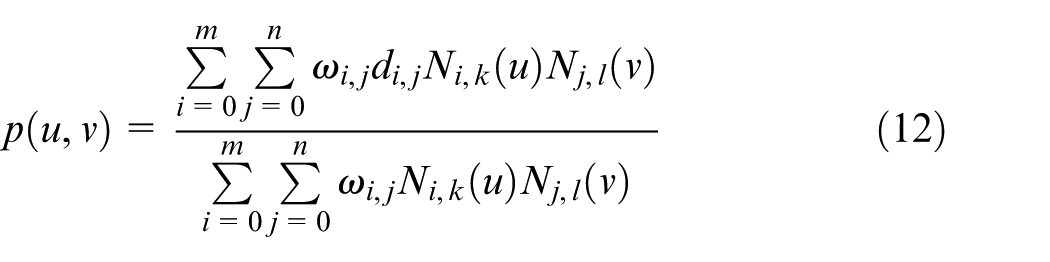
where
It is shown in equation (12) that the shape of NURBS surface is related to the control points, the weight factors, and the node vectors. In this article, the control points are obtained from the previous discrete points, then the control points of the final control surface topography are inverted, and the surface topography of the machined surface is fitted out. The point
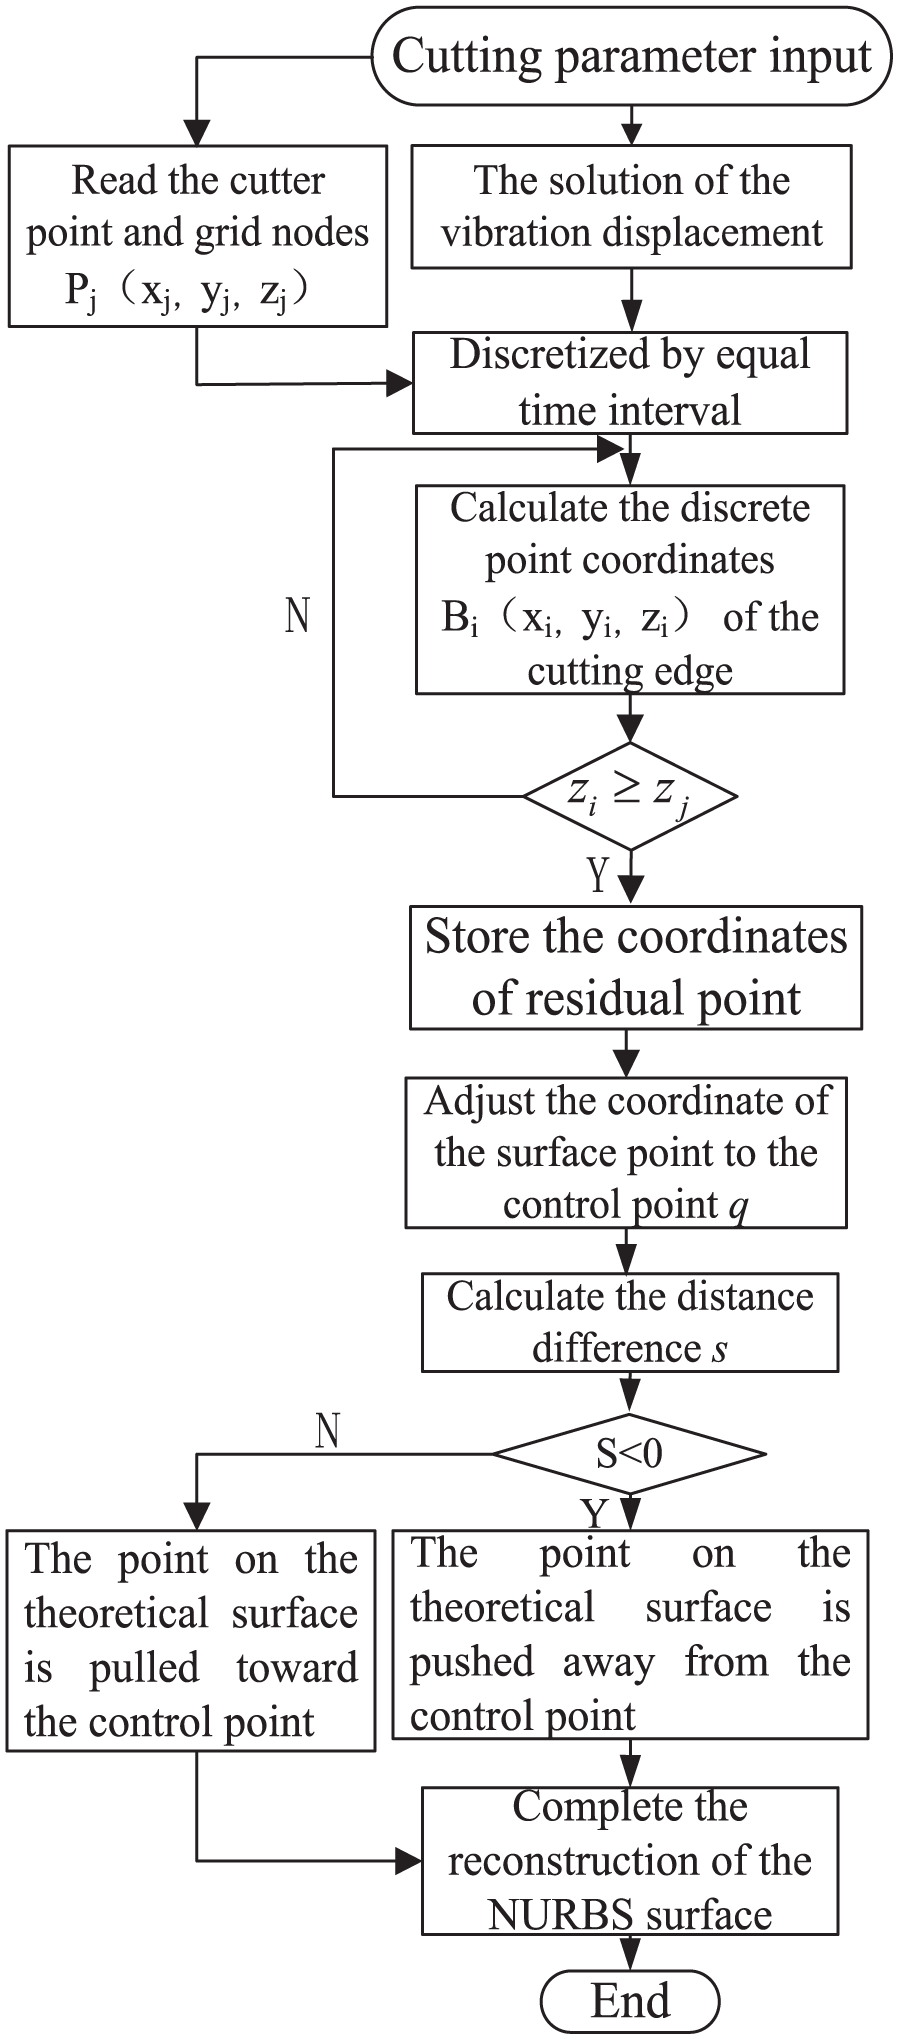
Flowchart of reconstruction of the surface topography based on NURBS surface control points.
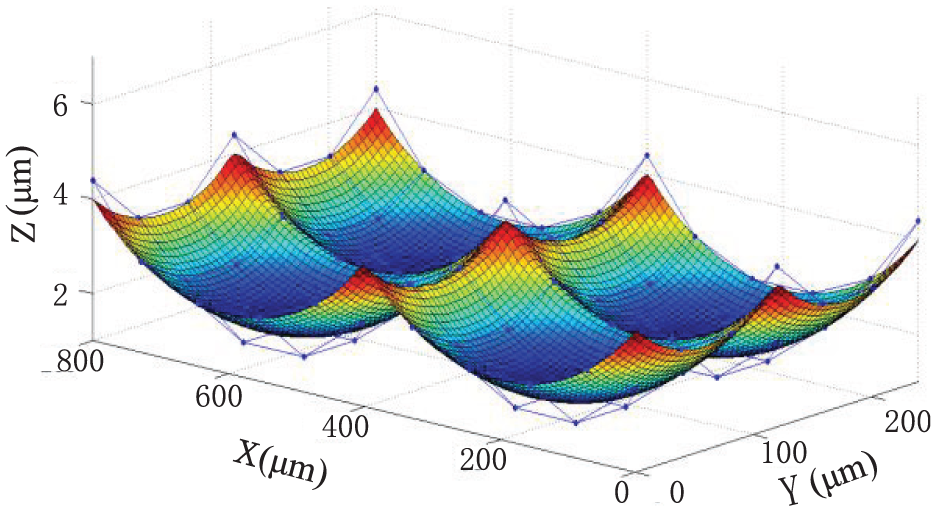
Surface topography control point reconstruction diagram.
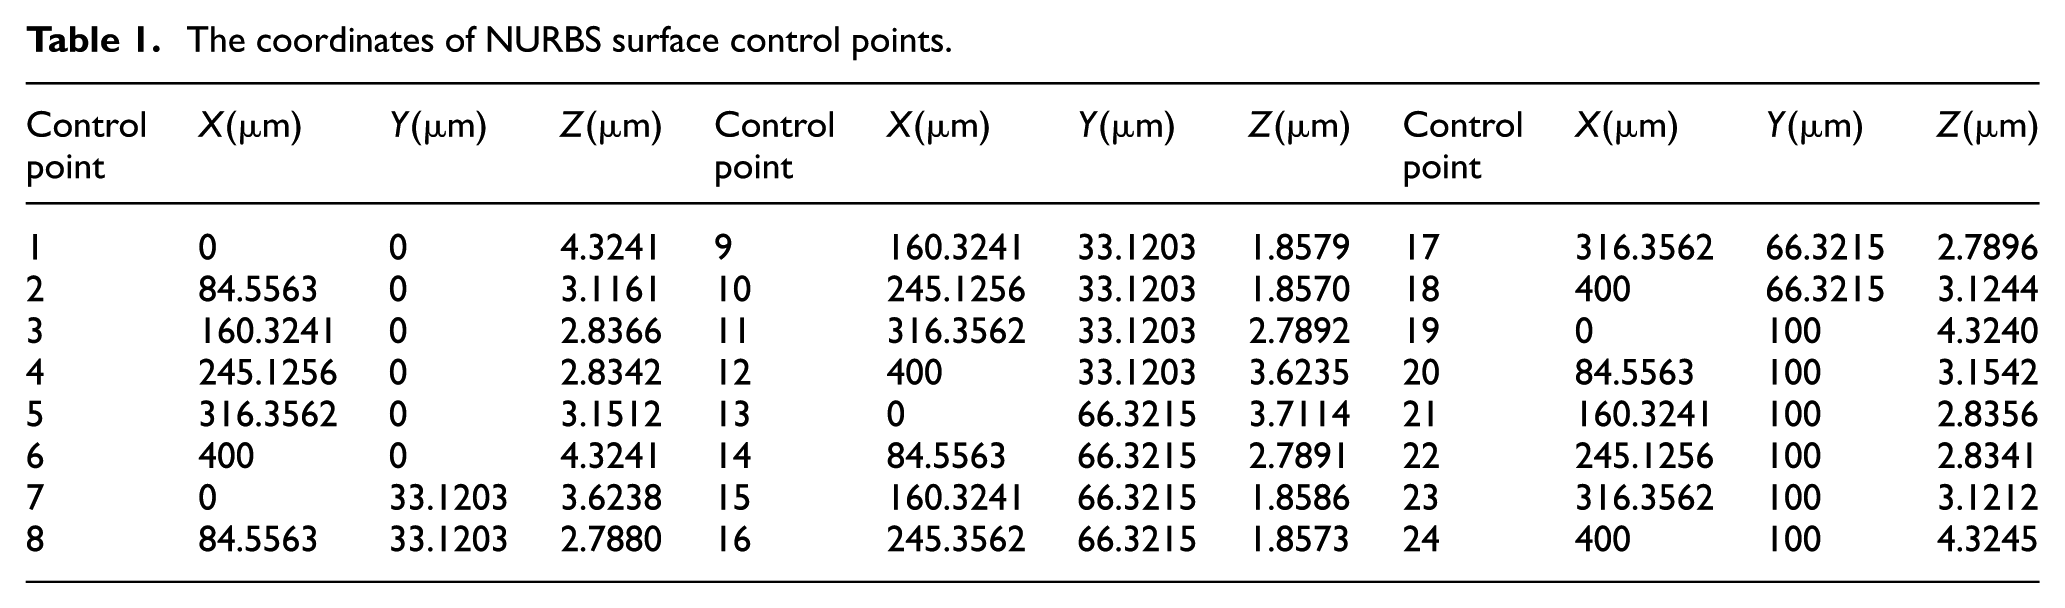
The normal distance between the surface and the surface topography is defined as the normal error of fitting. The relative error rate of the maximum of the normal error of each point on the surface is less than 6.0% and the relative error rate at the minimum of the normal error is less than 4.5%. The coordinates of the control points are shown in Table 1.
The coordinates of NURBS surface control points.
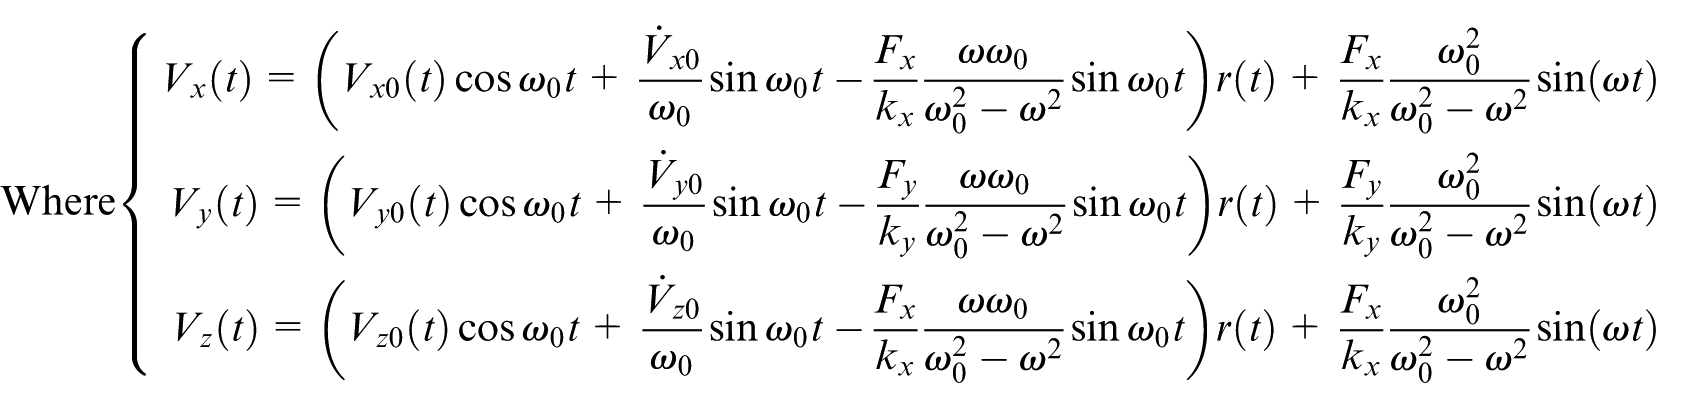
Instead of measuring acceleration signals traditionally required in existing researches,20,25,26 formulas for the determination of the forced vibration in X, Y, and Z directions are theoretically solved based on the stable solution and the transient solution. The surface topography is reconstructed based on NURBS surface control points according to the coordinate values of the residual grid points with considering the forced vibration in X, Y, and Z directions. The proposed method can also be used to simulate the surface topography with considering the impact vibration.
Simulation of surface topography considering impact vibration
For the splicing mold, the influence of impact vibrations on the surface topography under different feed rate is analyzed under the condition of constant speed. The Fast Fourier Transformation (FFT) transform of the milling vibration signal measured at the speed of 4000 r/min and the feed speed of 800 mm/min is performed before and after 0.5 mm seam. The spectrum analysis is shown in Figure 6.
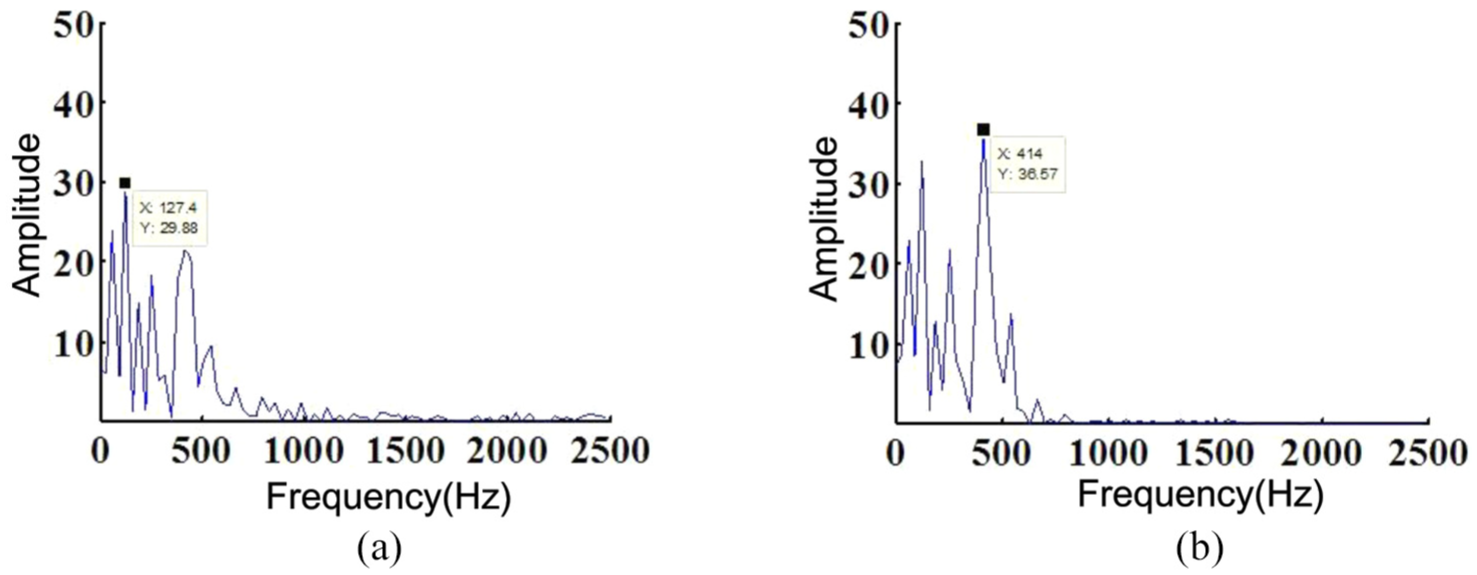
Milling vibration spectrum before and after the splicing seam: (a) milling vibration spectrum before splicing seam and (b) milling vibration spectrum after splicing seam.
The main frequency of milling vibration spectrum before splicing seam is
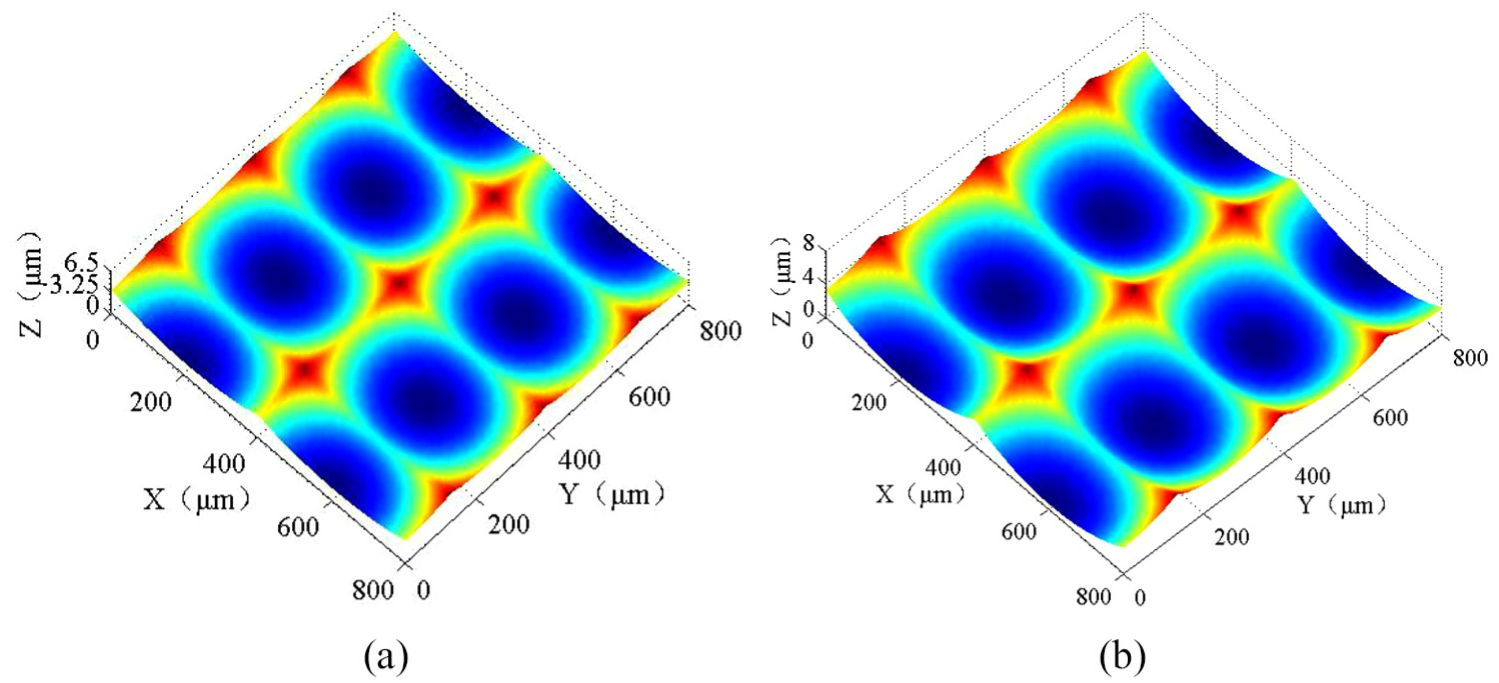
Then, the single-factor experimental method was used to simulate the surface topography of the workpiece after four groups. The four groups of simulation are selected on the principle of the pre- and post-stitched points. The point before the cutting is the point where the tool has not been sewn and the edge of the seam is selected after the cutting of the tool. After the sewing point is the point where the tool passed through the seam. Due to the smaller regional choice for simulation, the minimal impact point of minimum deviation in the simulation results before and after the splicing seam can be neglected. The simulation points are shown in Figure 7 before and after the seam. The snapshots of the surface topography of simulations are shown in Figures 8–11. The simulation parameters are shown in Table 2.
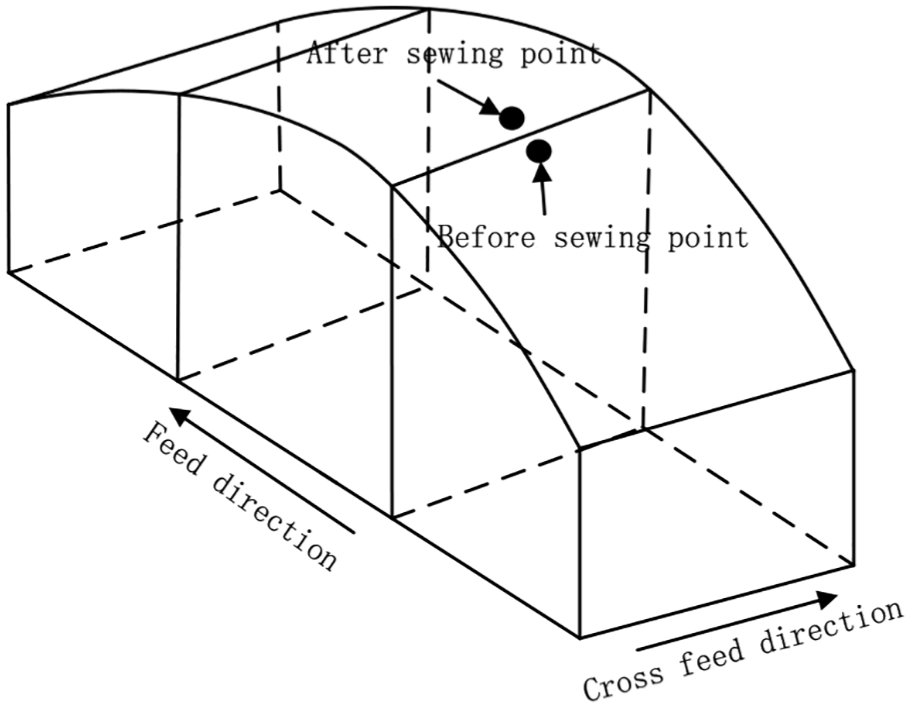
Position of the simulation points before and after the seam.
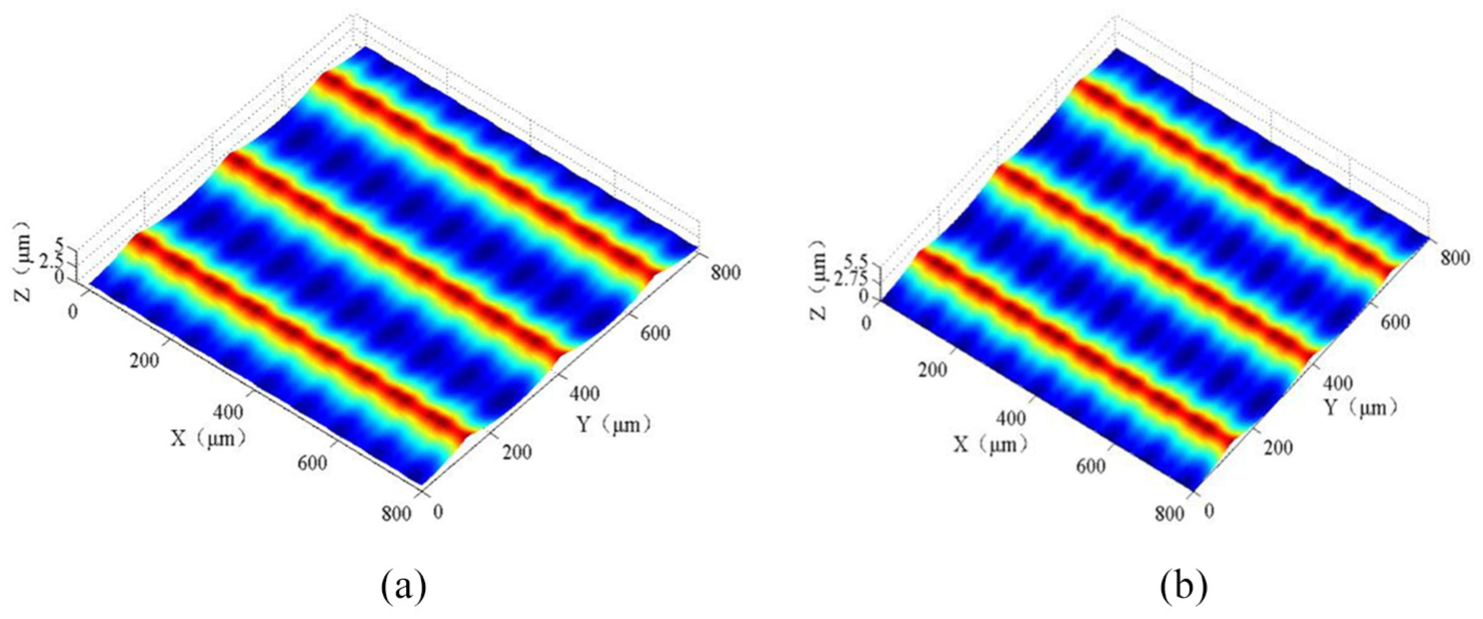
Feed per tooth, fz = 0.05 mm/tooth—the simulation of the surface topography before and after the splicing seam: (a) surface topography before the seam and (b) surface topography after the seam.
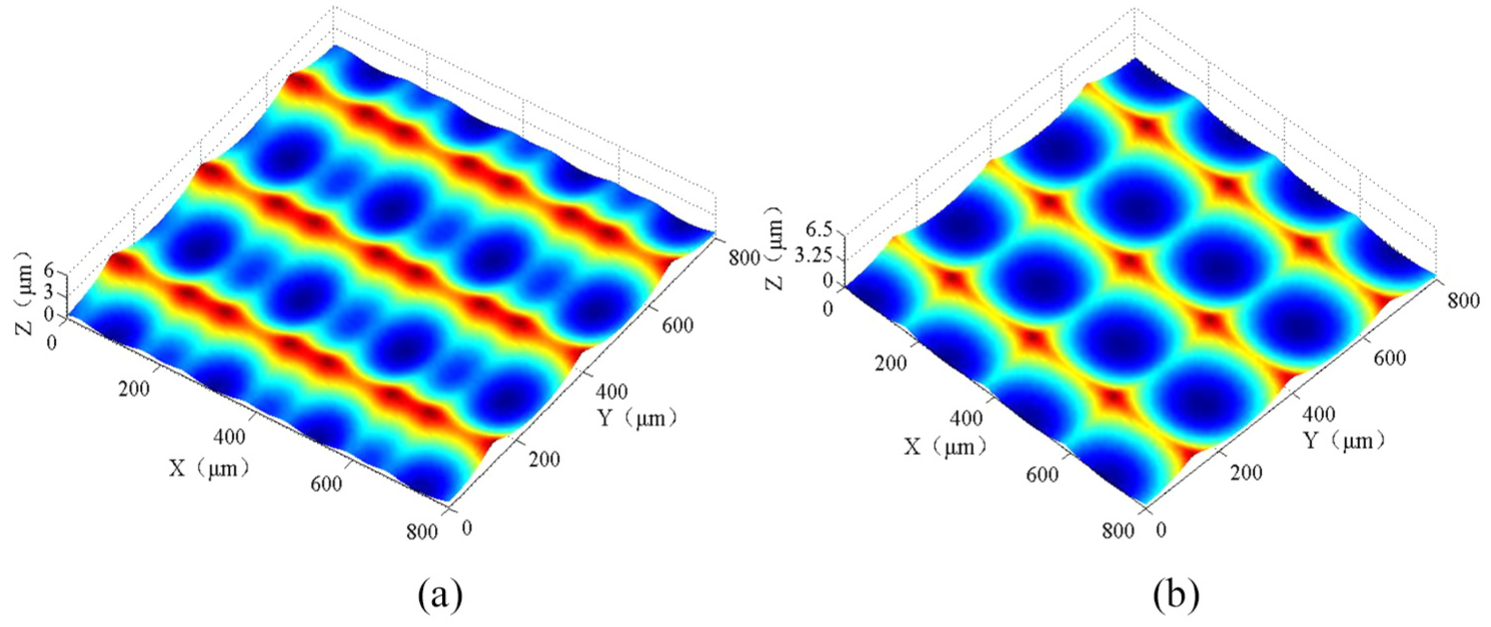
Feed per tooth, fz = 0.10 mm/tooth—the simulation of the surface topography before and after the splicing seam: (a) surface topography before the seam and (b) surface topography after the seam.
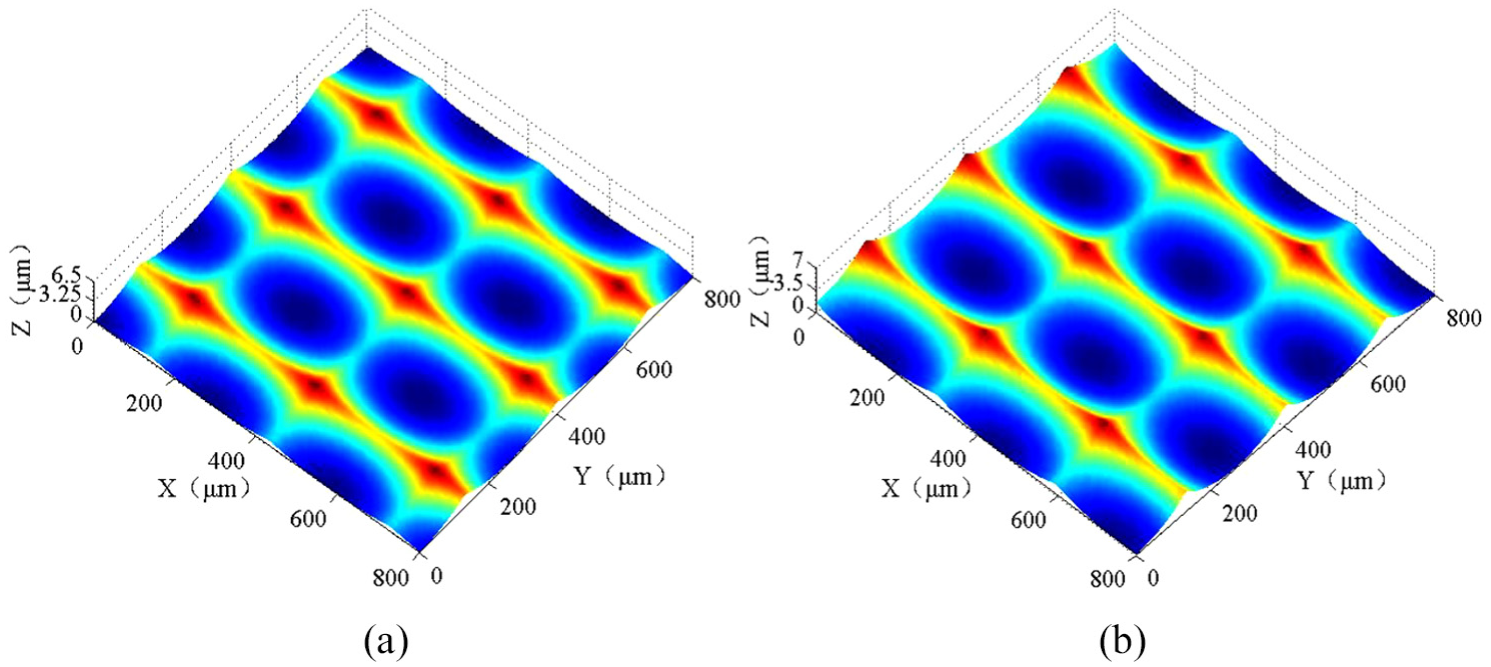
Feed per tooth, fz = 0.15 mm/tooth—the simulation of the surface topography before and after the splicing seam: (a) surface topography before the seam and (b) surface topography after the seam.
Feed per tooth, fz = 0.20 mm/tooth—the simulation of the surface topography before and after the splicing seam: (a) surface topography before the seam and (b) surface topography after the seam.
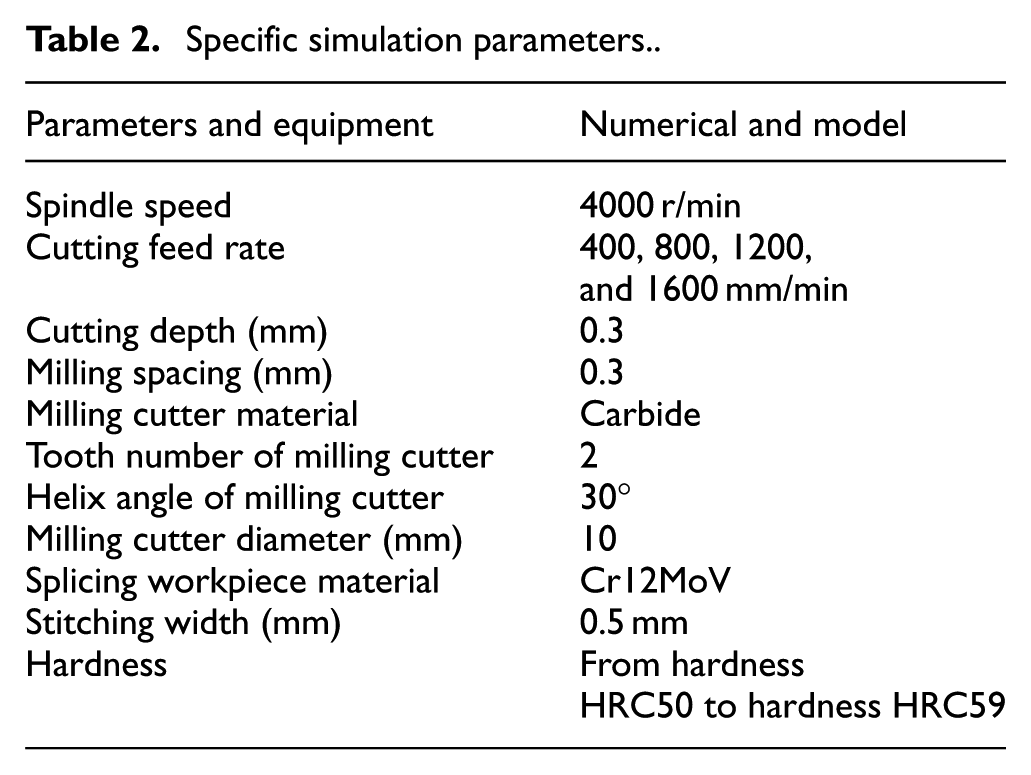
Specific simulation parameters.
It can be seen from Figure 8, with the feed per tooth of
In general, when the amount of feed per tooth is moderate, the residual height of the surface topography increases with the increase in the feed per tooth. Especially, when the feed per tooth is larger than 0.15 mm, the reason for the phenomenon of single tooth cutting is the forced vibration, which has negative impacts on the quality of both surface before and after the seam. Only the forced vibration should be considered in milling of splicing mold, when the feed per tooth is less than 0.15 mm.
Milling experiment of surface topography with splicing characteristics
In this article, VDL-1000E three-axis vertical milling machine is used, the diameter is 10-mm two-edged integral carbide ball-end milling, and the workpiece consists of hardened steel of different hardnesses. The measuring instrument includes data acquisition system, dynamometer, eddy current sensor, three-direction acceleration sensor, and white light interferometer. The experiment is carried out using the above instruments. The experimental site is shown in Figure 12.
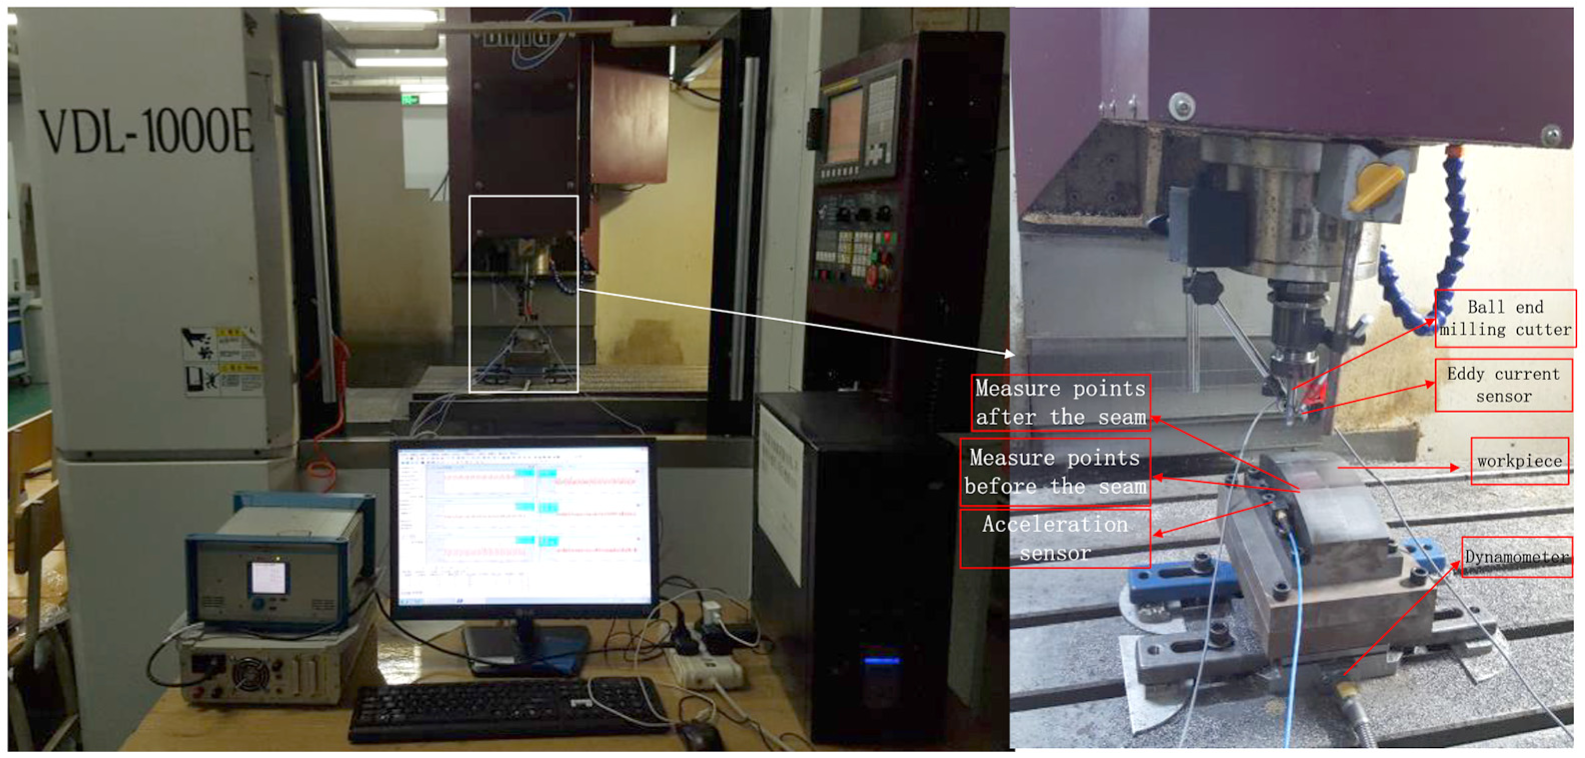
Milling experiments.
First, the mold model is imported into the numerical control (NC) machining module of UG. Then, set up the corresponding process parameters and generate NC code. The code is input to VDL-1000E three-axis vertical machining center. Rough milling, semi-finished, and finished machining are carried out by the way of forward milling and unidirectional milling, and then the machined surface is obtained. The specific experimental parameters and experimental conditions are also shown in Table 2.
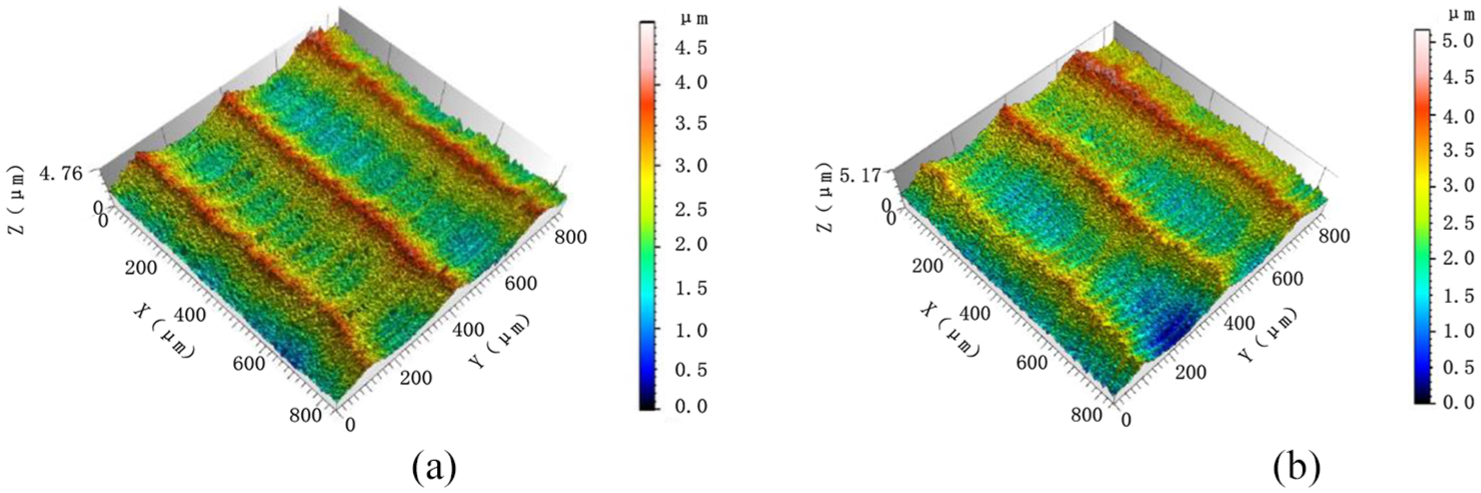
Then, the single-factor experimental method was used to compare the surface topography of the machined workpiece with the white light interferometer based on the influence of variation of surface curvature on the appearance of the surface. The position points of the actual surface topography are obtained according to the position points of simulation of surface topography after the seam. The two-dimensional (2D) contour and the measured surface topography of the position point are obtained and then compare it with the 2D contour that has been obtained from the simulation.
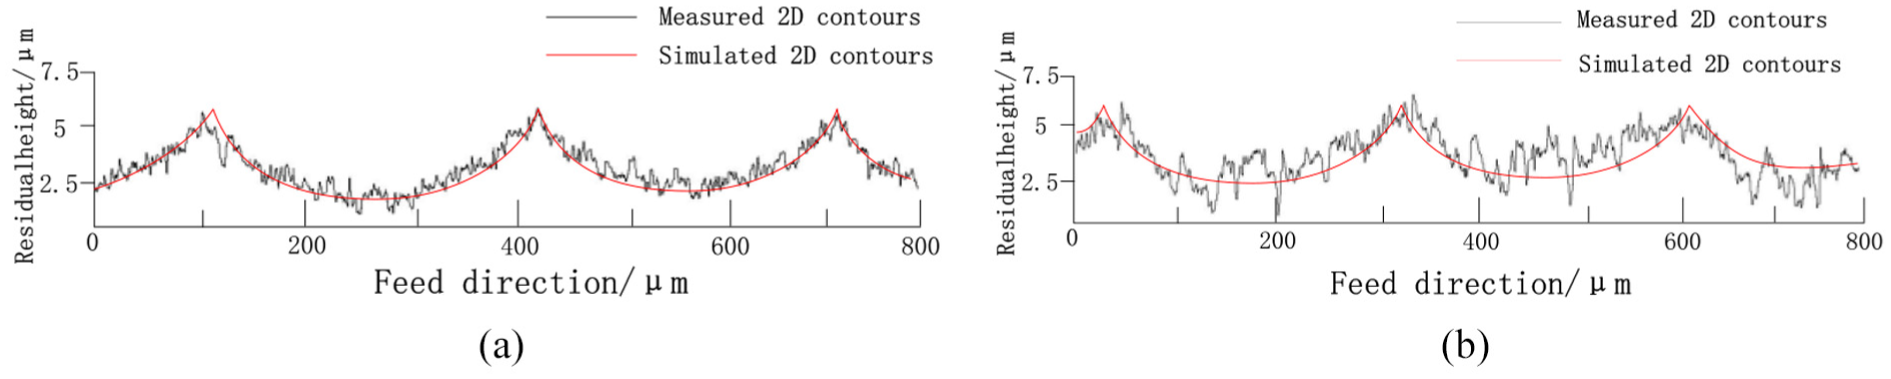
The measured surface topography is shown in Figures 13–16, and the simulated and measured 2D contours are shown in Figures 17–20. By comparing the surface topography of the preceding simulation with the measured surface topography, it can be found that the change rule and the trend of the surface topography are basically consistent. The measured surface topography also appears to be the phenomenon of single tooth cutting. In order to further illustrate the change rule of the surface topography of the simulation and the measured surface, the 2D contours are generated. It can be seen from the contours that the change rule is basically consistent, but the measured 2D profile of non-linear fluctuation is relatively strong. It is due to the fact there are other factors that are not considered. Overall, the simulation model can be used to predict the actual machined surface topography.
Feed per tooth, fz = 0.05 mm/tooth—the measurement of the surface topography before and after the splicing seam: (a) surface topography before the seam and (b) surface topography after the seam.
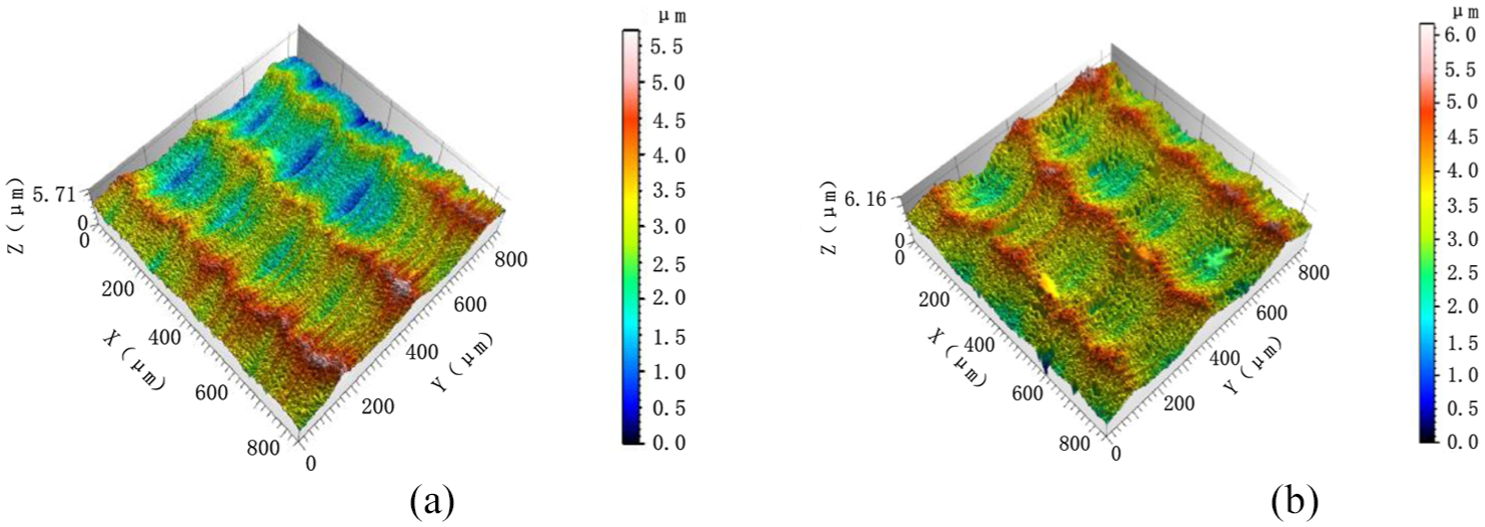
Feed per tooth, fz = 0.10 mm/tooth—the measurement of the surface topography before and after the splicing seam: (a) surface topography before the seam and (b) surface topography after the seam.
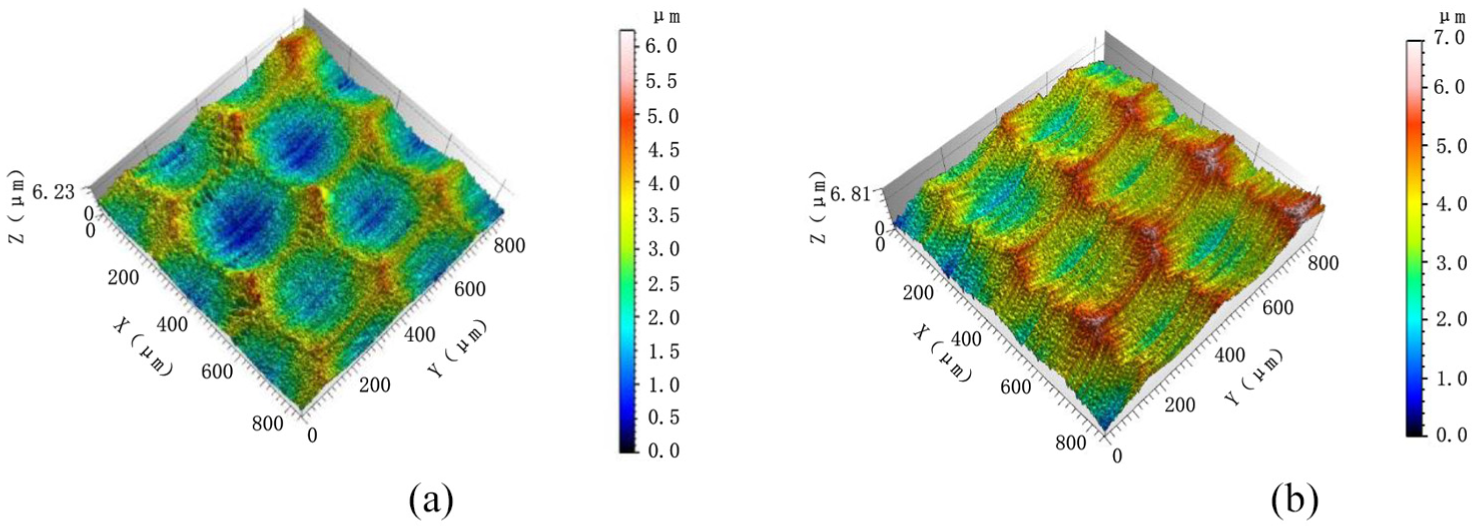
Feed per tooth, fz = 0.15 mm/tooth—the measurement of the surface topography before and after the splicing seam: (a) surface topography before the seam and (b) surface topography after the seam.

Feed per tooth, fz = 0.20 mm/tooth—the measurement of the surface topography before and after the splicing seam: (a) surface topography before the seam and (b) surface topography after the seam.
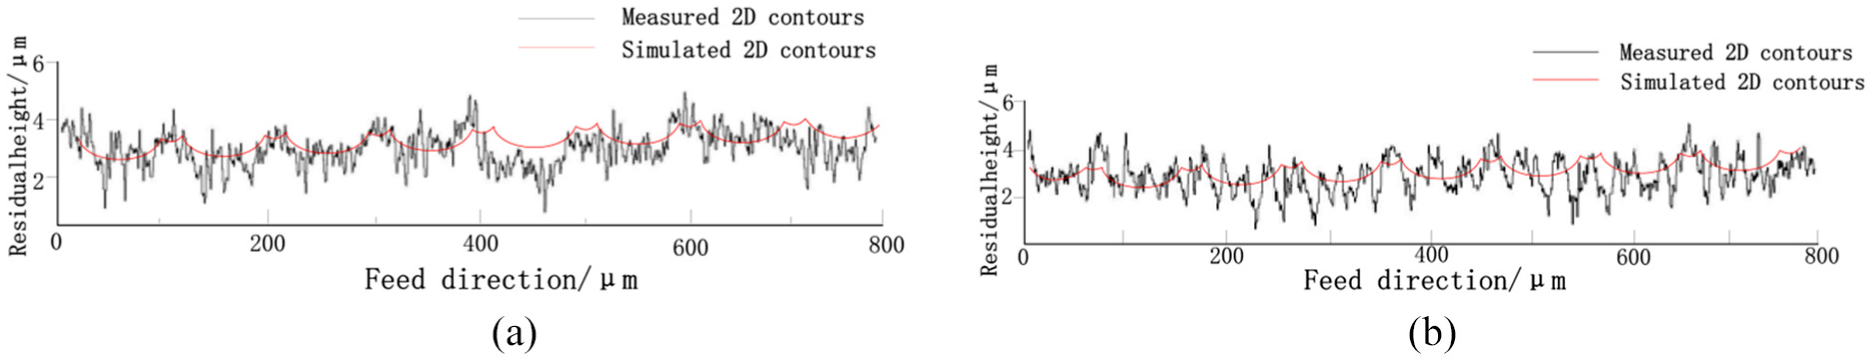
Feed per tooth, fz = 0.05 mm/tooth—the simulation and measured 2D contours before and after the splicing seam: (a) 2D contours before the seam and (b) 2D contours after the seam.
Feed per tooth, fz = 0.10 mm/tooth—the simulation and measured 2D contours before and after the splicing seam: (a) 2D contours before the seam and (b) 2D contours after the seam.
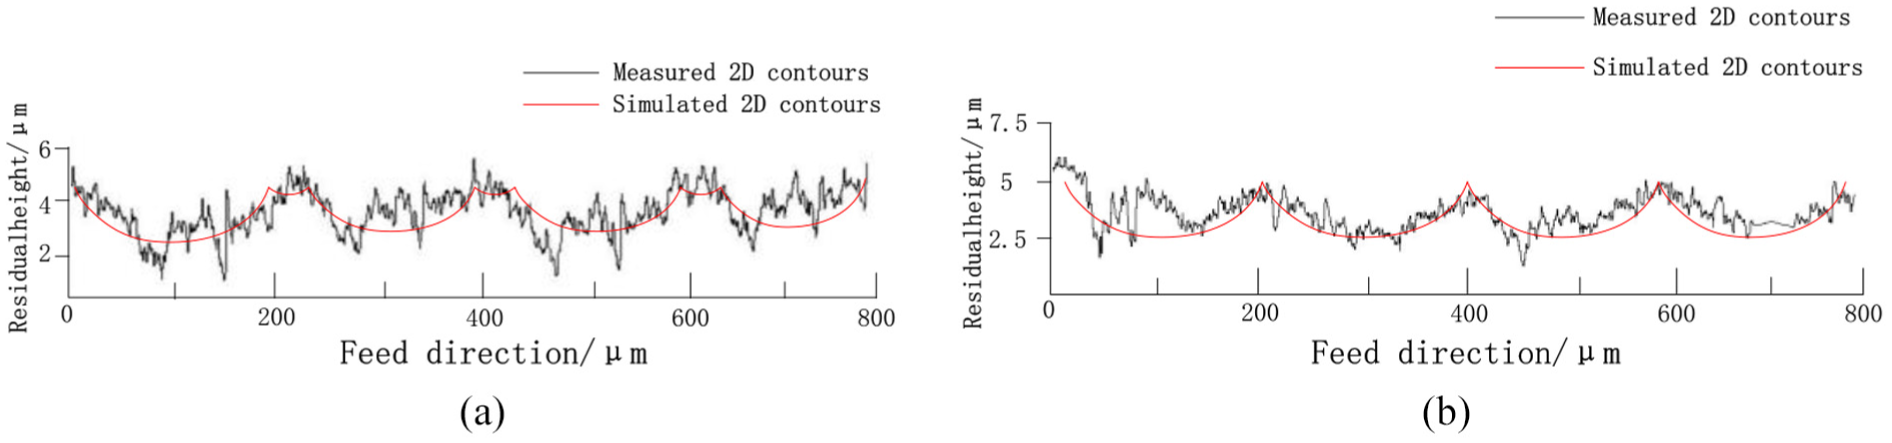
Feed per tooth, fz = 0.15 mm/tooth—the simulation and measured 2D contours before and after the splicing seam: (a) 2D contours before the seam and (b) 2D contours after the seam.
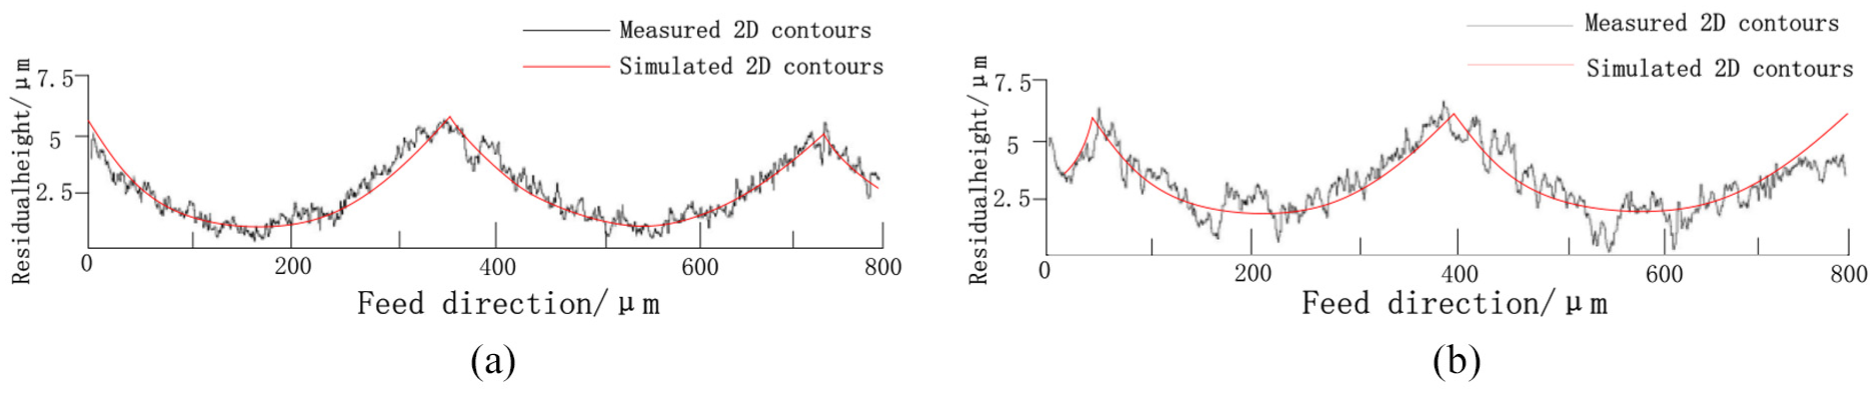
Feed per tooth, fz = 0.20 mm/tooth—the simulation and measured 2D contours before and after the splicing seam: (a) 2D contours before the seam and (b) 2D contours after the seam.
In Figure 13, it can be seen that the surface topography shows obvious fluctuations when the feed per tooth is
In order to further illustrate the change rule of the surface topography of the simulation and the measured surface, a 2D contour line is made. The position of the 2D contour line is a vertical plane along the feed direction at a distance of 200 µm. The 2D contour formed by the intersection of the vertical plane and the surface is the required contour line, as shown in Figures 17–20.
In Figure 17, it can be seen that the 2D contour of the residual surface fluctuates more frequently for the feed per tooth of
Fractal analysis of surface topography with splicing characteristics
As for the study of the splicing characteristics in this article, we still need to analyze the influence of impact vibration on surface topography for different parameters. It reflects that the quality is the size of the surface roughness. The surface roughness represents the arithmetic mean of the peaks and troughs in a certain region and it is a 2D representation. In this article, we use the white light interferometer for 3D representation of surface topography. In addition, the fractal dimension is introduced to analyze the non-linear characteristics of 2D contours under impact vibration and to analyze the fine structure of surface topography.
The fractal dimension reflects the validity of the space occupied by the complex shape and it is a measure of irregularity of the complex shape.28,29 The surface topography has the fractal features of statistical self-similar and self-affine. It is inadequate in evaluating the surface topography only by surface roughness frequency.
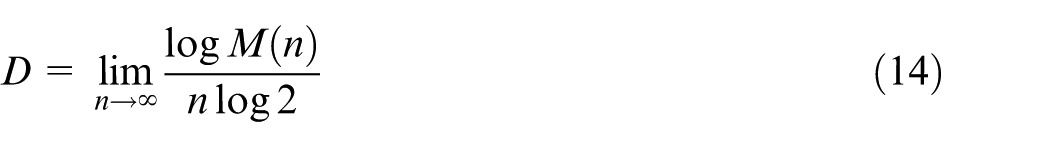
30
Therefore, the fractal dimension of the contour curve can be used to characterize the machined surface. The surface contour curve is covered with a square box with side length equal to 1 and the box is divided into a grid set containing 2n small square boxes. The side length of the small square box is 2–n and the grid covers the contour curve. Then the number
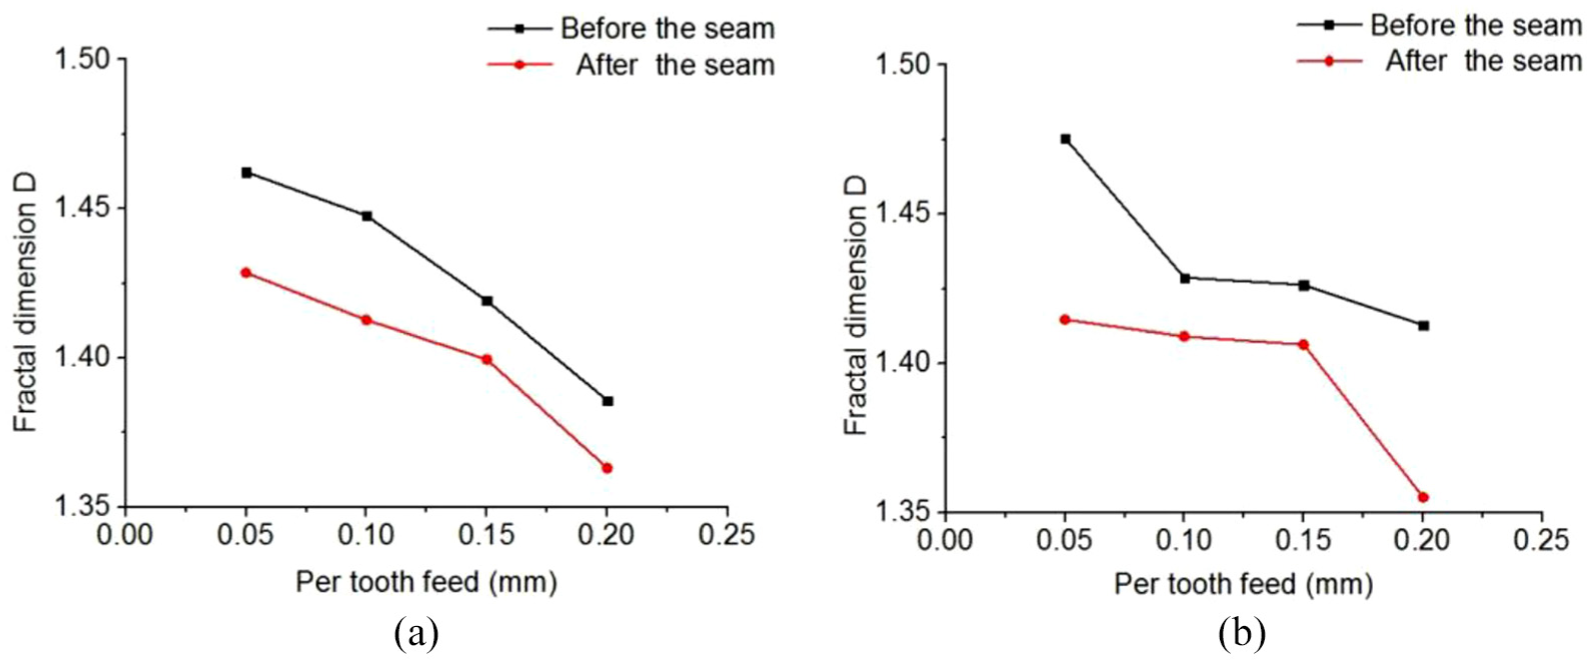
The surface roughness and the fractal dimension of the 2D contour are analyzed under the same rotational speed and at different tooth feed rates. The variation trend chart is made. It can be seen from the chart that the fractal dimension shows a decreasing trend before and after the seam with the increase in feed per tooth (0.05–0.20 mm) under the same rotational speed of
The fractal dimension of the surface two-dimensional contours before and after the splicing seam: (a) speed 4000 r/min and (b) speed 5000 r/min
In Figure 22, we can see that at the spindle speed of
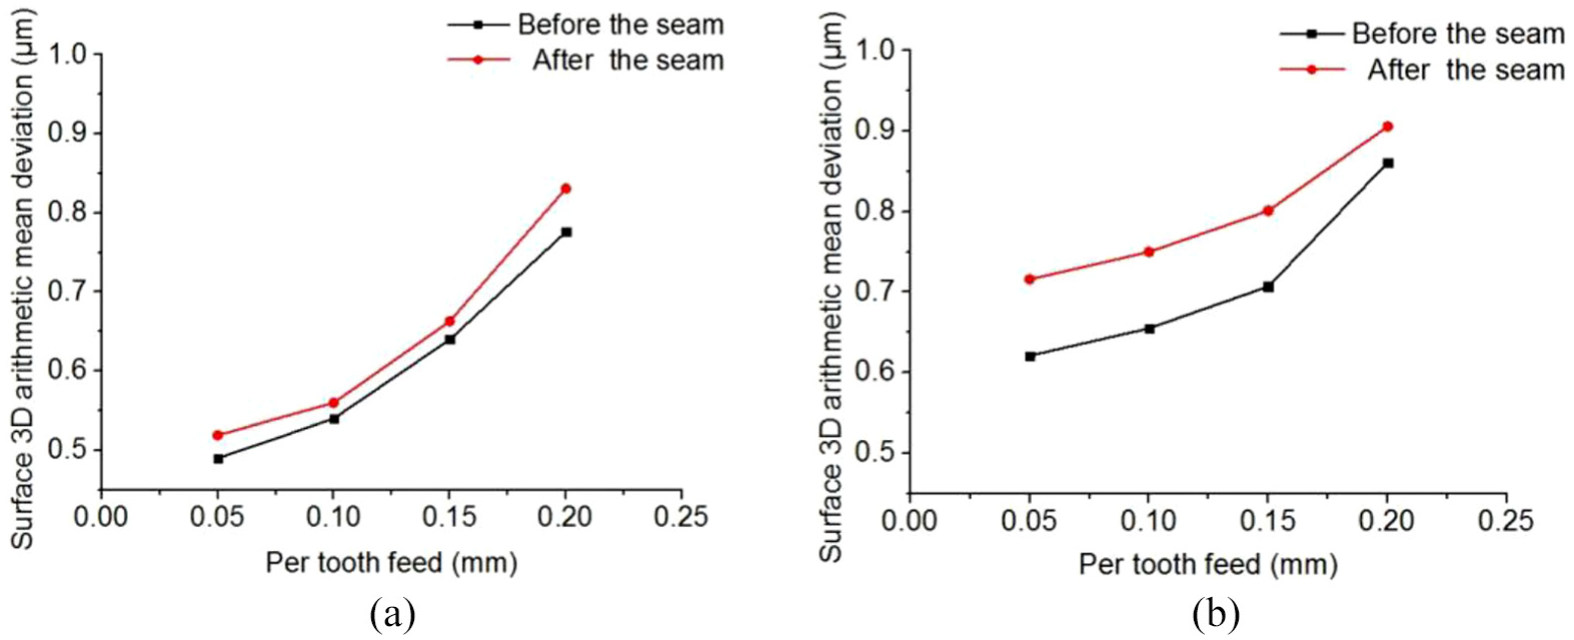
The variation of the three-dimensional arithmetic mean deviation of the surface before and after the splicing seam: (a) speed 4000 r/min and (b) speed 5000 r/min.
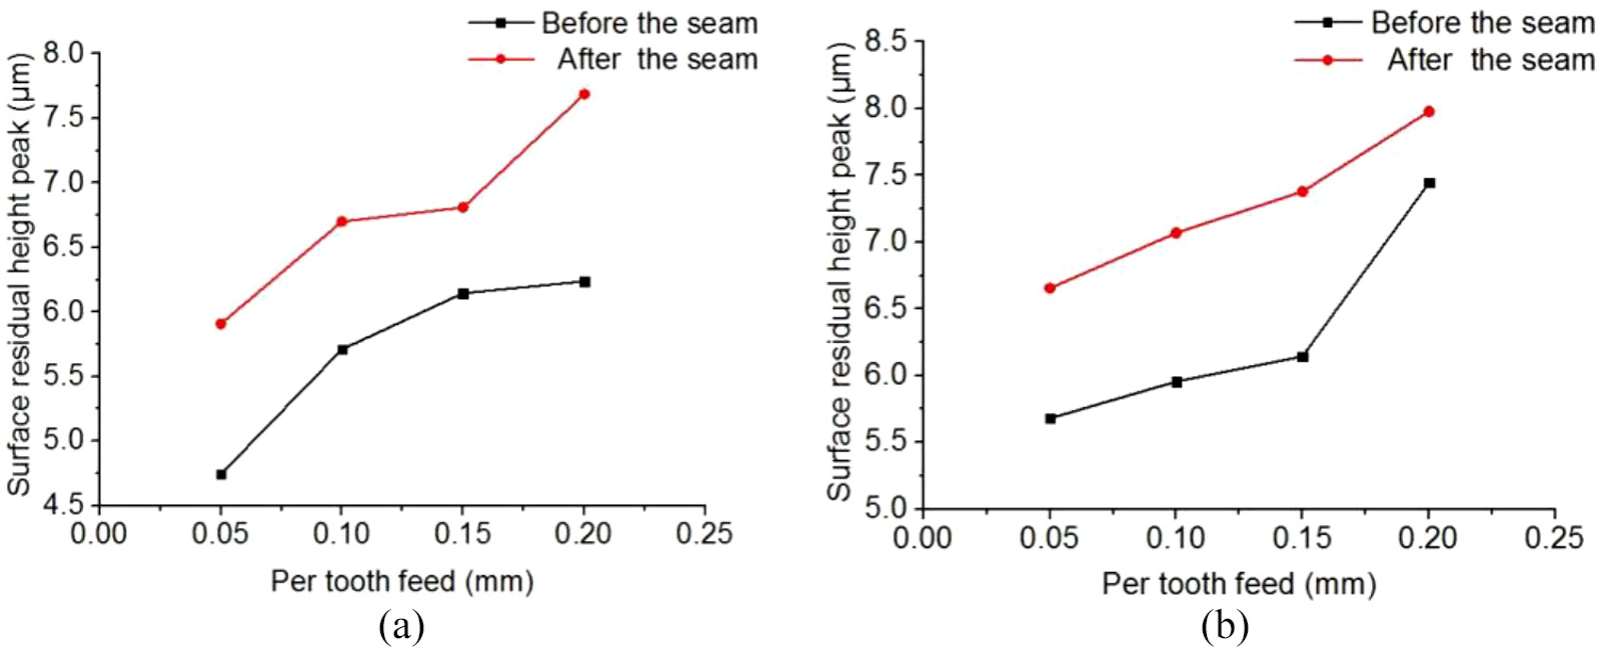
Peak height of residual surface before and after the splicing seam: (a) speed 4000 r/min and (b) speed 5000 r/min.
Conclusion
As is well known, milling is a kind of intermittent machining process, in which the tooth is sometimes in cut while sometimes out of cut. Because of the periodical change of the cutting force, it is easy to lead to forced vibration. There are limited works that were carried out to obtain the forced vibration from experimental measurement. In addition, it is very limited for studies on the impact vibration caused by the seam. The coupling of the impact vibration and the forced vibration has great effects on the surface roughness. Therefore, a simulation model of the 3D surface topography is developed for ball-end milling of splicing transition mold with considering the coupling of the impact vibration caused by the seam and the forced vibration caused by multi-edge interrupted cutting.
Instead of measuring acceleration signals traditionally required in existing researches,20,25,26 formulas for the determination of the impact vibration and the forced vibration in X, Y, and Z directions are theoretically solved based on the stable solution and the transient solution during milling splice mold. The motion trajectory of cutting edge is established with considering the vibration.
In this article, the surface topography is reconstructed based on NURBS surface control points according to the coordinate values of the residual grid points. Using this method, the required surface can be accurately fitted out with less points, and the simulation efficiency is greatly improved compared with methods proposed in references.14–16,24 Based on the NURBS surface control point reconstruction, the surface topography prediction model of the splice transition zone is established with considering the influence of the coupling of the impact vibration and the forced vibration on the surface topography.
After the seam, at the speed of 4000 r/min, with the increase in feed per tooth, surface topography residual height increased gradually, the 3D arithmetic mean deviation of the seam is higher than that before the seam, and the phenomenon of the cutting of the other tooth and the phenomenon of the single tooth cutting occurs, which adversely affect the surface quality.
At the speed of 4000 and 5000 r/min, the fractal dimension of the 2D contours before and after the seam decreases with the increase in the feed per tooth (0.05–0.20 mm). It means that the fractal dimension after the seam is smaller than the fractal dimension before the seam, which indicates that the impact vibration of the tool is caused by the splicing seam and hardness characteristics. The 2D contour line after the seam fluctuations relative to the 2D contour line before the seam fluctuations is relatively large, and regularity is enhanced.
Footnotes
Declaration of conflicting interests
The author(s) declared no potential conflicts of interest with respect to the research, authorship, and/or publication of this article.
Funding
The author(s) disclosed receipt of the following financial support for the research, authorship and/or publication of this article: This research was supported by the National Natural Science Foundation of China (51675146) and the Natural Science Foundation of Heilongjiang Province of China (E2018048).