
Abstract
Based on the Z-map model of a workpiece and the dynamic cutting forces model of peripheral milling in which the regenerative effect of tool radial runout and axial drift are considered, a model for the prediction of surface topography in peripheral milling operations is presented. According to the stability lobe diagram obtained by the zero-order analytical method, the relationship between spindle speed and surface topography, the tool radial runout, and the axial drift following the chatter are studied. The results show that a stable cutting status but a poor surface finish is obtained at the spindle speeds at which the dominant frequency of the milling system is integral multiples of the selected machining frequency, and a stable cutting status with a good surface finish can be obtained near and on the left side of the resonant spindle speeds determined by the predicted stability lobe diagram. The motion equations of any tooth end mill for peripheral milling are established, and these equations are based on the transformation matrix and the vector operation principle of motion-homogeneous coordinates. In addition, the simulation algorithm and the system of surface topography generated in peripheral milling are given based on the Z-map model. Cutting tests are carried out, and good agreement between the measured surface topographies and the topographies predicted by the model in this study is found in terms of their shape, magnitude, feed mark, profile height of cross-section, and surface roughness. The simulation results show that the milling surface roughness increases with the increase in feed per tooth, which further shows that this simulation system has high credibility. Thus, the simulation and experimental results can provide some practical instructions for the actual peripheral milling in determining the optimal machining conditions.
Introduction
With the broad application of high speed milling technology, end mills are widely used in the rough, semi-fine, and fine finishing stages of a workpiece due to the advantages of flexible processing and small cutting resistance.1–6 Peripheral milling is characterized by the axis of tool rotation parallel to the machined surface. The cutting edges are distributed on the cylindrical surface of the milling cutter to form a plane (or surface). As an important machining method for end mills, peripheral milling is not only used in plane machining but also can be combined with multi-axis control technology and is widely used in convex surface machining. 7 Peripheral milling is a machining operation extensively employed in manufacturing, and its surface quality has always been the focus of research.8–16 Due to the increase in the quality requirements for machined surfaces, the development of models for surface topography prediction in peripheral milling has attracted the attention of many researchers in recent years. One of the factors that has the most influence on a milled surface and can cause the deterioration of the surface quality is the presence of tool radial runout and axial drift during the machining process.
Some studies have investigated the influence of dynamic effects on surface topography for milling. Mohammadpour et al. 17 considered the effect of cutting process dynamics in the prediction of milled surface topography. Shi et al. 18 examined the influence of both static and dynamic factors on surface roughness to predict the surface roughness in a face milling operation. They also conducted an in-depth study of the relationship between the processed surface roughness and machining conditions, especially for both axial and radial runout errors generated by static deformation and Z-axial relative displacement generated by forced vibration and other dynamic factors. Tangjitsitcharoen et al. 19 proposed an analytical model for predicting the in-process surface roughness in a ball-end milling operation by using the dynamic cutting force ratio. Zahoor et al. 20 provided the influence of spindle-attributed forced vibrations on the machinability characteristics in the vertical milling process. The influences of three levels of spindle-attributed forced vibrations along with axial cutting depth and feed rate were assessed in terms of dimensional accuracy, surface roughness, and tool wear under constant conditions of cutting speed and radial cutting depth. Zhang et al. 21 proposed a model for predicting surface roughness during the end face milling process based on Gaussian process regression and cause analysis and considering tool vibration. Dong et al. 22 established a generalized dynamic model for spindle vibration to study its distinctive effects on surface topography in different ultra-precision machining processes. Jiang et al. 10 and Long et al. 23 presented a numerical peripheral milling model and surface profile generation mechanism, and the model was based on the measured vibrational displacement signals of both the tool and the workpiece. Surmann and Enk 24 and Surmann and Biermann 25 described a numerical model for predicting the surface generation resulting from peripheral milling operations when tool vibrations on the flank surface were present. Landers et al. 26 took the modelling and analysis for peripheral milling of thin titanium plates as the research object. Impact tests were conducted, the force process was represented with a mechanistic model, and the vibrational characteristics of a thin titanium plate were modelled empirically. Chiang and Wang 27 analyzed and revealed comprehensively the generation mechanism of a kinked surface during the peripheral end milling process in the convolution framework by establishing a surface formation and forming an error model.
As far as the peripheral milling is concerned, although most of the above studies considered dynamic influence factors on the peripheral milling surface, the dynamic model of the machining process cannot predict the exact milling vibrations since most of the tool vibrations were greatly assumed and simplified, for example, these studies considered the vibration only in a single direction and considered only the amplitudes and frequencies of vibrational displacement. However, the factors that result in cutting vibration are very complicated: the dynamics of the machine tool, tool parameters, cutting parameters, and so on should be included. Axial drift, which has a great impact on the cutting vibration and machined surface quality, was lost in the process of peripheral milling and was ignored in these studies. From the discussion, one can conclude that it is necessary to evaluate the actual vibrational effect to obtain an accurate prediction and reconstruction of the surface topography in peripheral milling.
Furthermore, the chatter vibration is the most important factor that restricts machining quality and efficiency when using a weak-rigidity tool or milling a weak-rigidity part. It is a self-excited vibration phenomenon that occurs in the machining process, affecting the machining accuracy and the surface quality of the workpiece and causing tool breakage, workpiece scrap, and bearing damage of machine tools. 28 Therefore, the dynamic modelling and simulation of milling process, the influence of chatter on tool radial runout and axial drift, the prediction of the milling chatter stability region, and the realization of small chatter or even no chatter cutting by the optimization of cutting parameters are the current research hotspots.
A dynamic cutting force model considering regeneration is established based on a Z-map model for a weak-rigidity tool milling system. The differential equations are solved by numerical methods. The stability lobe diagram (SLD) and surface topography are simulated, and the influence of spindle speed on machined surface quality is also analyzed in this study. Furthermore, a model for the surface topography prediction in peripheral milling considering tool radial runout and axial drift following the chatter is developed. First, the mathematical model of a helical end mill is established based on the transformation matrix and the vector operating principle of motion-homogeneous coordinates. Then, the equations describing the cutting-edge trajectory and accounting for tool radial runout and axial drift are derived. Next, the simulation algorithm and procedure developed for surface topography generation are proposed. Finally, the model is validated by comparing the surface topographies simulated by this model with the measured topographies.
Mathematical model of peripheral milling
The compound movement of the milling cutter and the specific vibration of the cutter cause the surface to be undulating and uneven. A slight modification of the classical Z-map model can be used to characterize the shape of the machined surface (side surface), that is, the shape of the machined surface can be represented by grid points
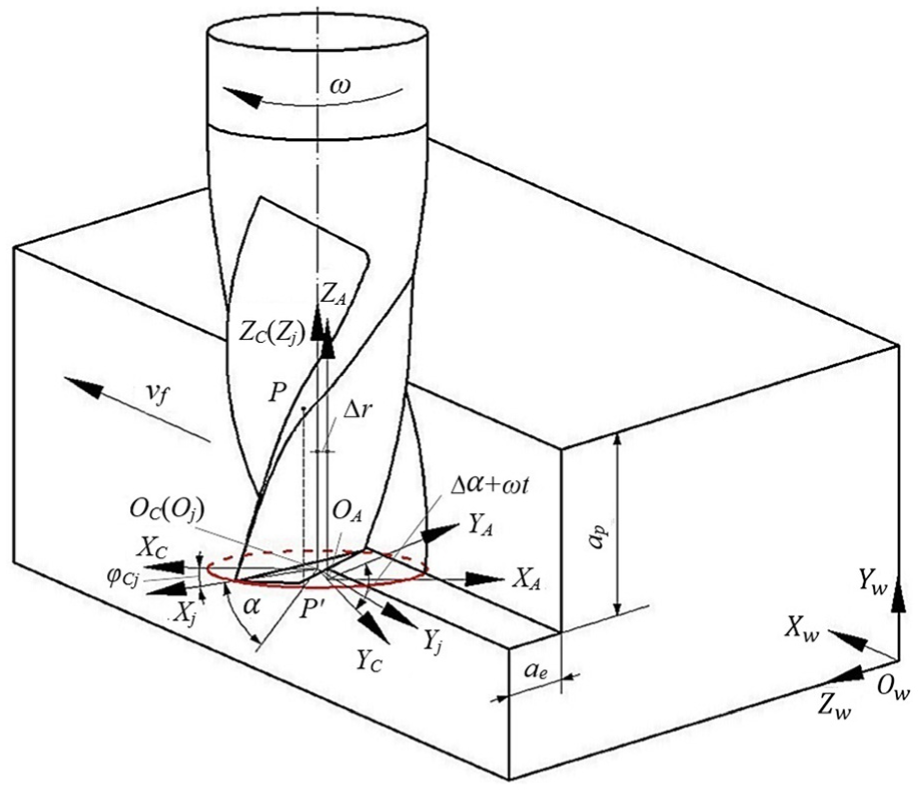
Tooth motion reference frame in peripheral milling.
The basic idea of establishing a topography simulation system is to follow the general machining process of peripheral milling and to solve the trajectory of the cutting edge in space and then, at the selected time, to determine whether the cutting edge cut into the workpiece, and thus whether the height coordinates of the workpiece need to be updated. Finally, the machined surface is obtained by the topological connection of the points remaining on the workpiece. Therefore, determining the relative motion of the cutting edge and the workpiece and establishing the movement model of the cutting edge in the milling process are the keys of the simulation.
Reference frame
To facilitate the modelling, the coordinate system shown in Figure 1 is established. Here, the reference coordinate system
Mathematical expression of the tooth in {j}
The homogeneous coordinates of any point P on the cutting edge of an end mill in the coordinate system
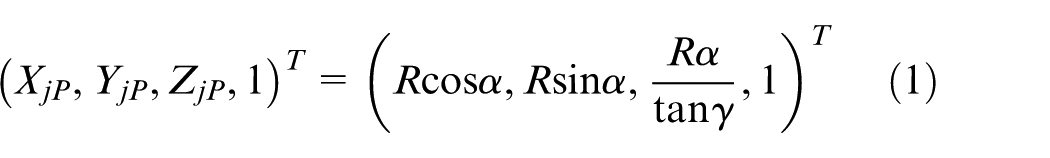
where is the angle between coordinate axis and the line
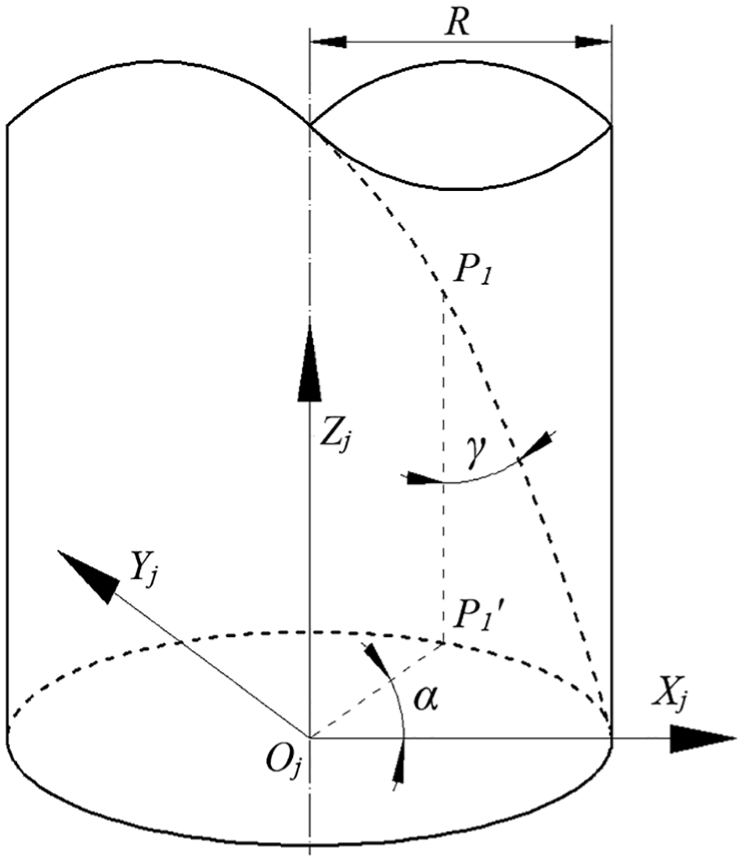
Cutting edge shape of end mill.
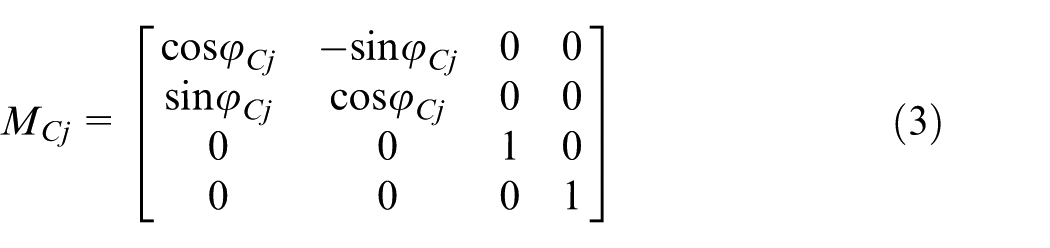
Transformation matrix between {j} and {C}
To be more intuitive, only one cutting-edge shape of the initial tooth is drawn in Figure 2. The angle between the projection of the edge line and the coordinate axis
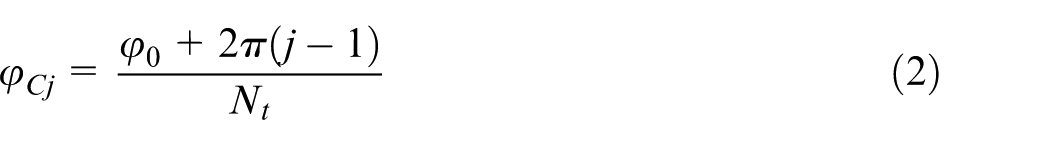
where j denotes the
The transformation matrix between
Transformation matrix between {C} and {A}
The radial runout and axial drift of milling tools have a substantial influence on the surface quality. The eccentric distance between the tool axis
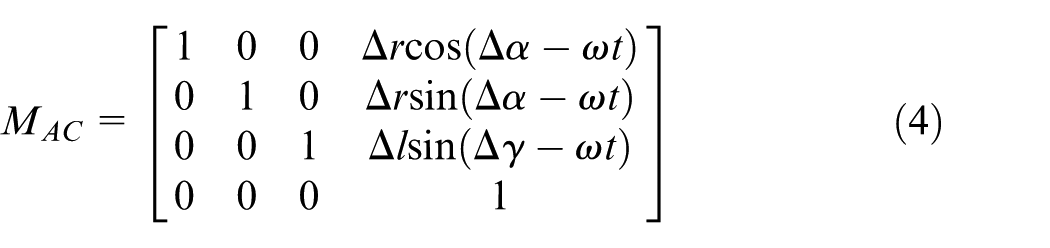
where
Transformation matrix between {W} and {C}
The mathematical modelling for the follow-up coordinate system of the spindle in the workpiece coordinate system should consider two main aspects: the tool path and the spindle rotation.
Tool path
In the current milling process, there are two common tool paths:
29
unidirectional feeding (Figure 3(a)) and bidirectional feeding (Figure 3(b)). In the peripheral milling of end mills, in order to not affect the consistency of the surface topography, the final processing of the workpiece surface is usually required to be as minimal as possible. Therefore, the down-milling and up-milling of a single direction and single path are considered when studying the microgeometric surface topography in peripheral milling. As a side milling, the intermittent feed direction of peripheral milling is along the axial cutting direction. Figure 4 shows the relationship between axial depth of cut (
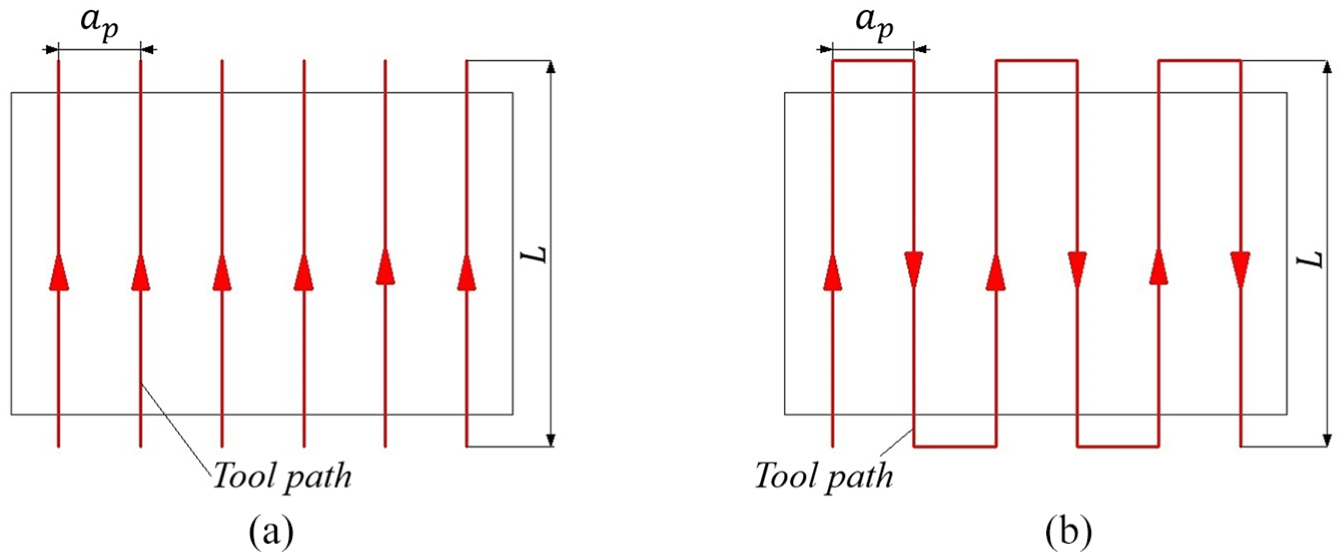
Tool paths of milling: (a) unidirectional feeding and (b) bidirectional feeding.
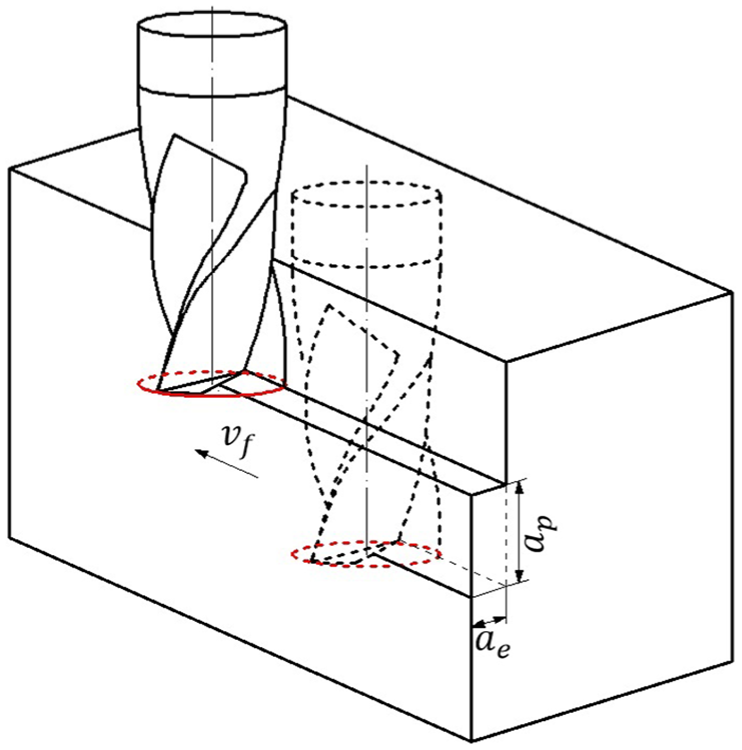
Relationship between
It is assumed that the initial position of the tool location point
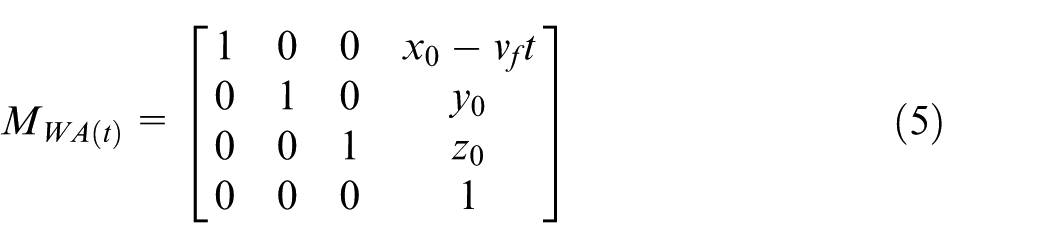
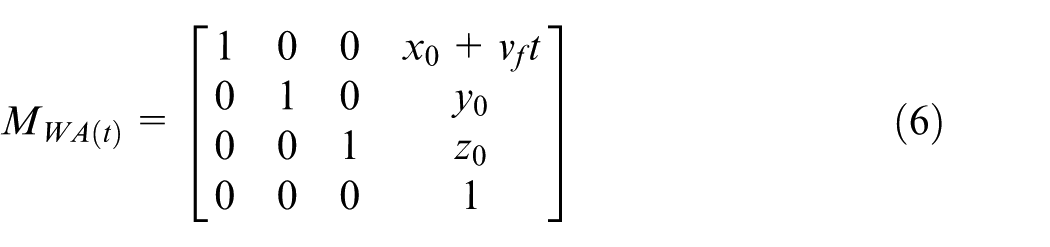
The workpiece coordinate system
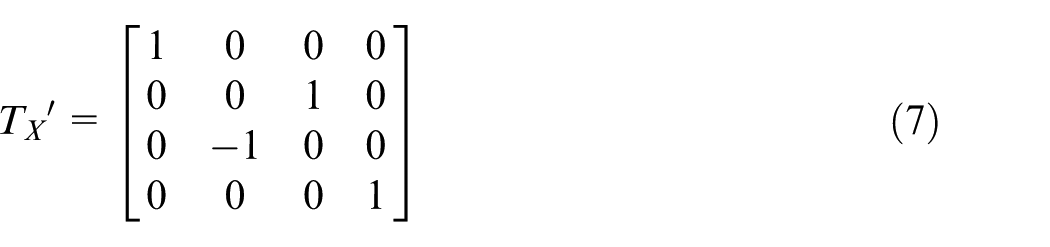
Spindle rotation
The rotational speed of the spindle is assumed to be n (
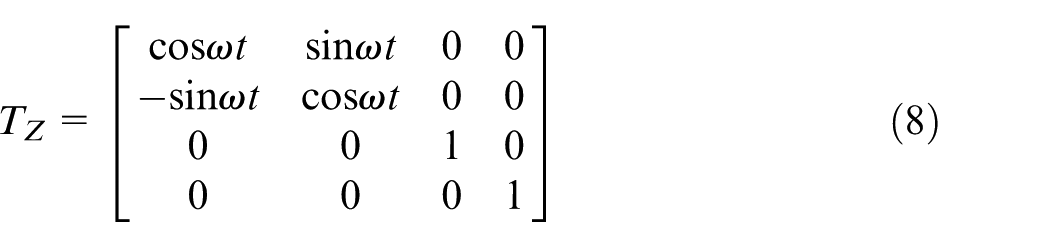
When considering the position and orientation of the tool, the total transformation matrix of the coordinate system

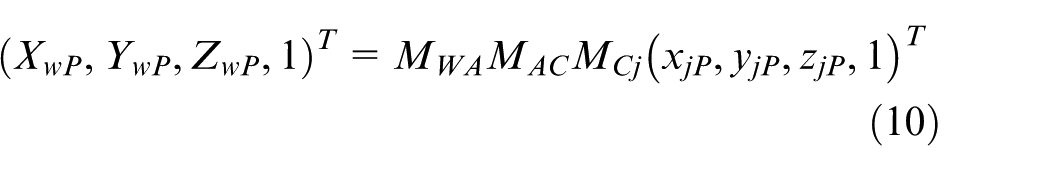
Taking into account all kinds of situations mentioned previously, the coordinates of any point P on the cutting edge in the workpiece coordinate system
Simulation algorithm of surface topography
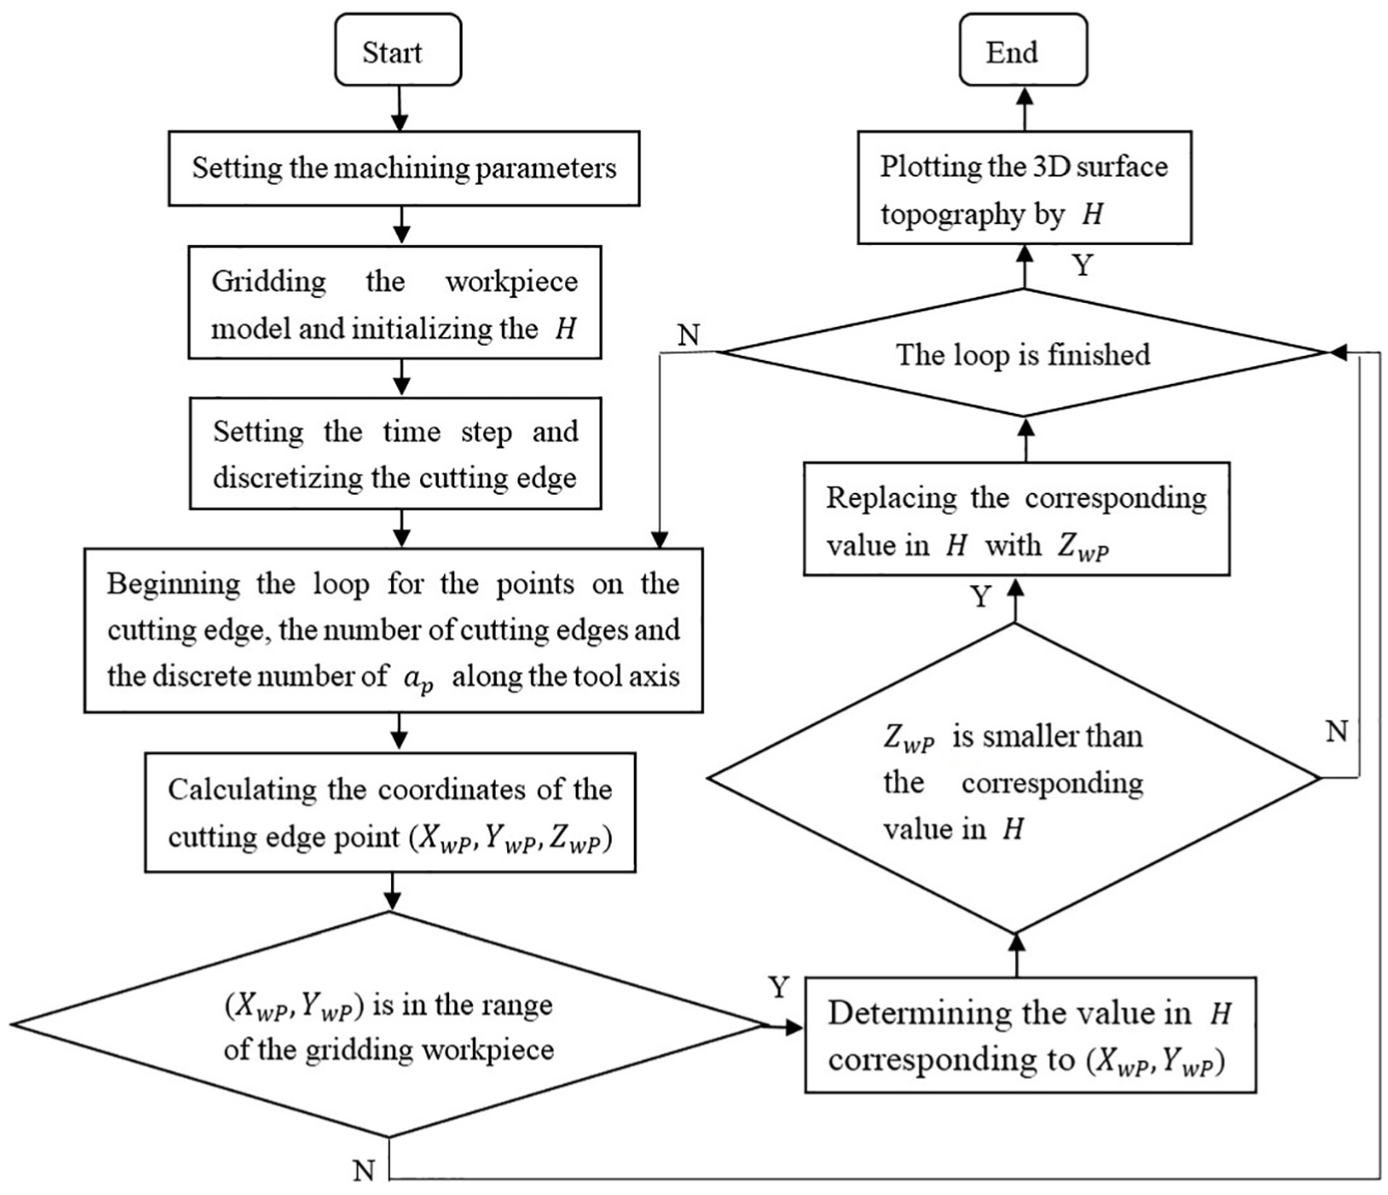
After the mathematical modelling of the machining process, the flowchart of the proposed model is presented in Figure 5, and the main simulation steps are taken as follows:
Initialize milling data: Machining parameters are set, and the Z-map model of the workpiece with
Set up time increments and discretize the cutter and workpiece: The time step is set, and the point number of the cutting edge is discretized according to the workpiece mesh precision, which will ensure that the projection length of the tooth element in the machining plane does not exceed the grid spacing of the workpiece and that the discrete points of the cutting edge sweep over no more than one grid point on the workpiece during a unit time step (there is no more than one point on the spatial cambered surface where the cutting edge infinitesimally sweeps over in each cutting step).
Judge the machining area: For time t, the coordinate values (
Determine the discrete points of the cutting edges that correspond to the matrix elements: According to the corresponding relationship between (
Judge the cutting: For time t, the coordinate value
Generate the 3D surface topography according to the final height matrix
Flowchart of the simulating algorithm.
Dynamic model of peripheral millingand the numerical solution
The tangential, radial, and axial instantaneous cutting forces on the
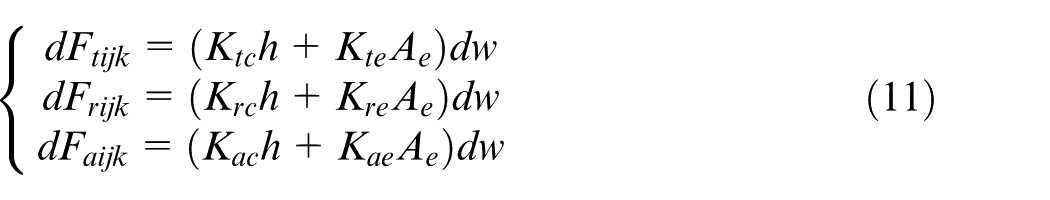
where parameters
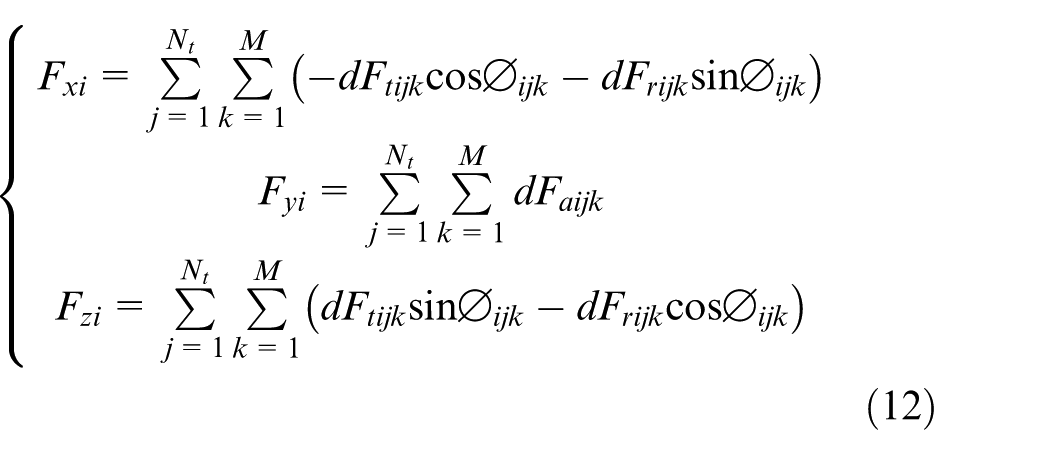
In equation (12),
Considering the tool vibration in the
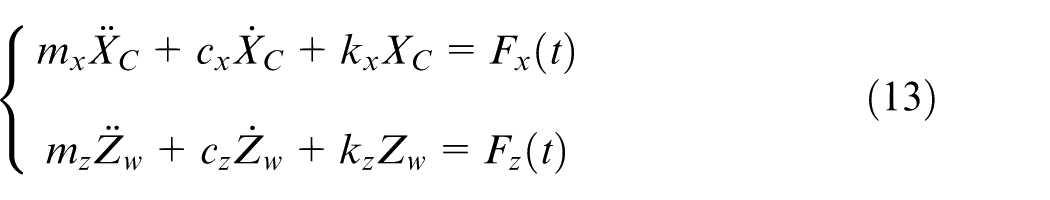
where
Materials, methods, and experiment design
Cutting tests
Cutting tests were performed on a four-axis milling centres (Model KVC650F, Changzheng Co., China). An aluminium alloy (Al7075) was used as the workpiece; the cutting tools used were monolithic carbide end mill cutter JH970100-TRIBON (Seco Co., Sweden) with a 5 mm diameter, two-flute and three-flute, and 45° helical angle. To validate the model predictions, the profiles of the machined surfaces are measured in the feed direction at different heights along the axial direction Z using a 3D optical surface profilometer (Model ContourGT, Bruker Co., USA) shown in Figure 6. Finally, the topography can be obtained from the means of these profiles.
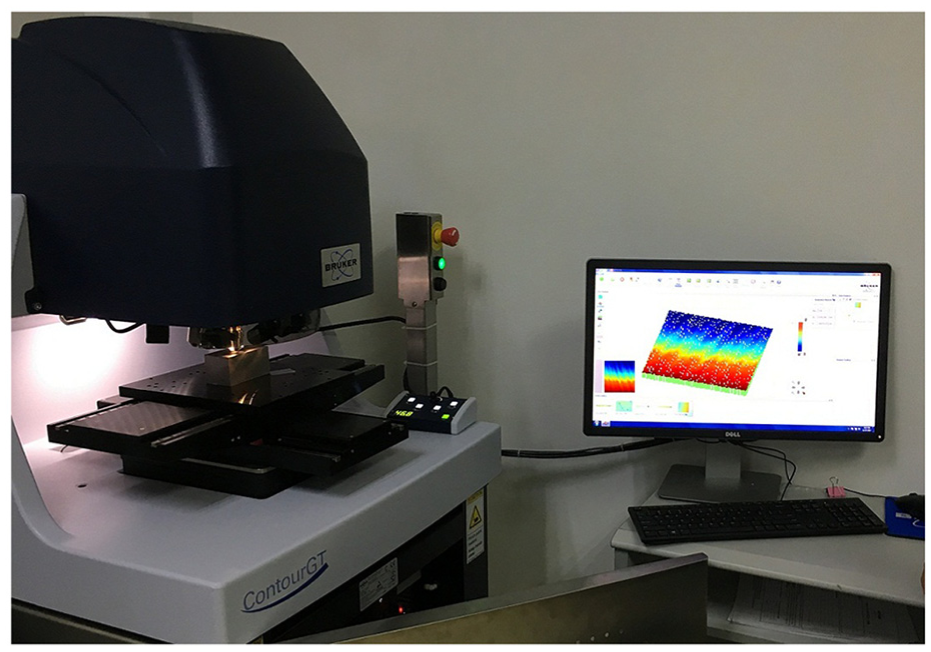
Measuring the surface topography with a 3D optical surface profilometer.
Chatter tests
Cutting force coefficient can be obtained by the experimental method of cutting force coefficient identification.35,36 According to this method, the following results in this article were generated:
Analysis of simulation and experimental results
The effects of spindle speed on radial runout, axial drift, and surface topography
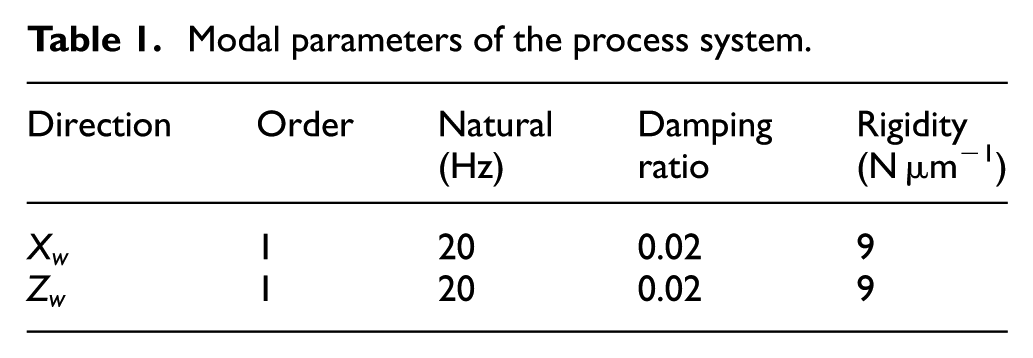
The modal parameters obtained by modal hammering test are shown in Table 1.
Modal parameters of the process system.
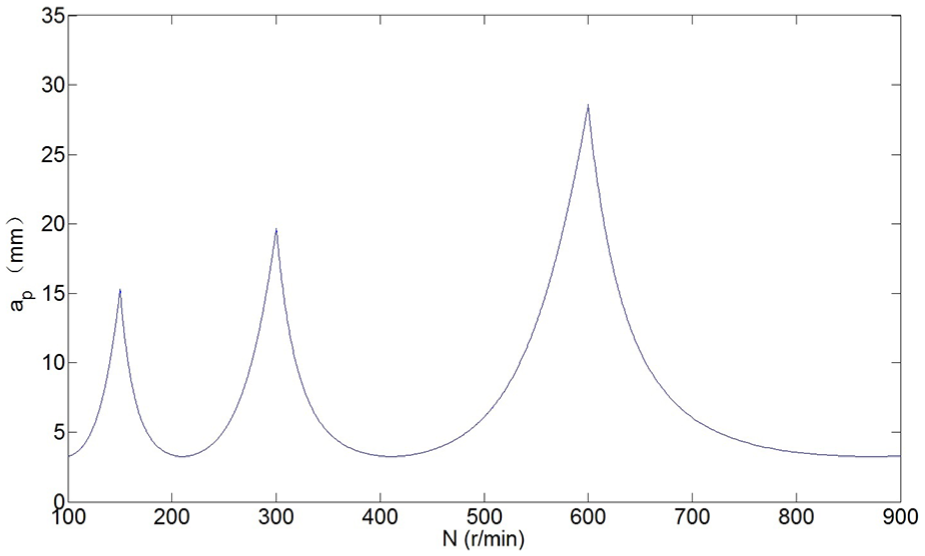
The SLD obtained by the ZOA (zero-order analytical) method is shown in Figure 7. To reveal how to select cutting parameters in finishing milling, peripheral milling simulation is carried out by changing spindle speed with fixed cutting load. The relationship between the maximum surface finish error (
Simulated stability lobe diagram.
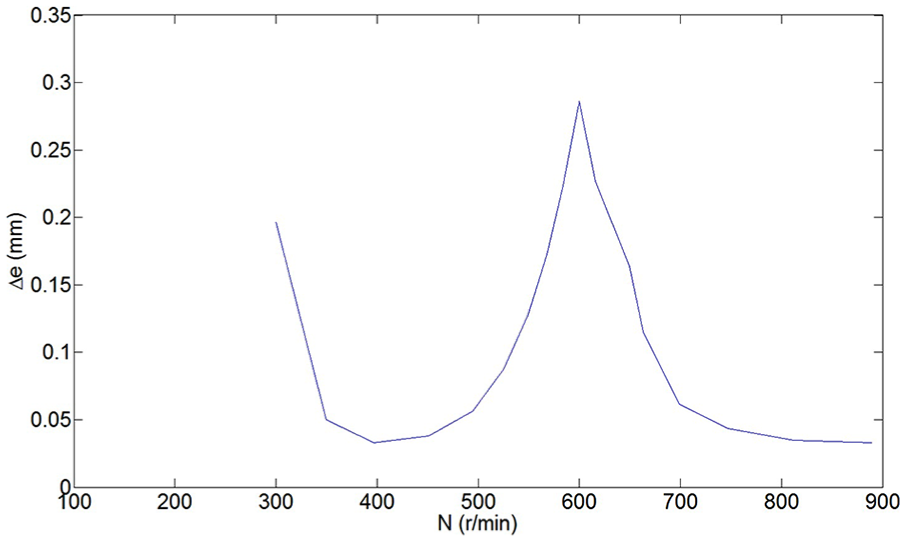
Relationship between the maximum surface finish error and spindle speed.
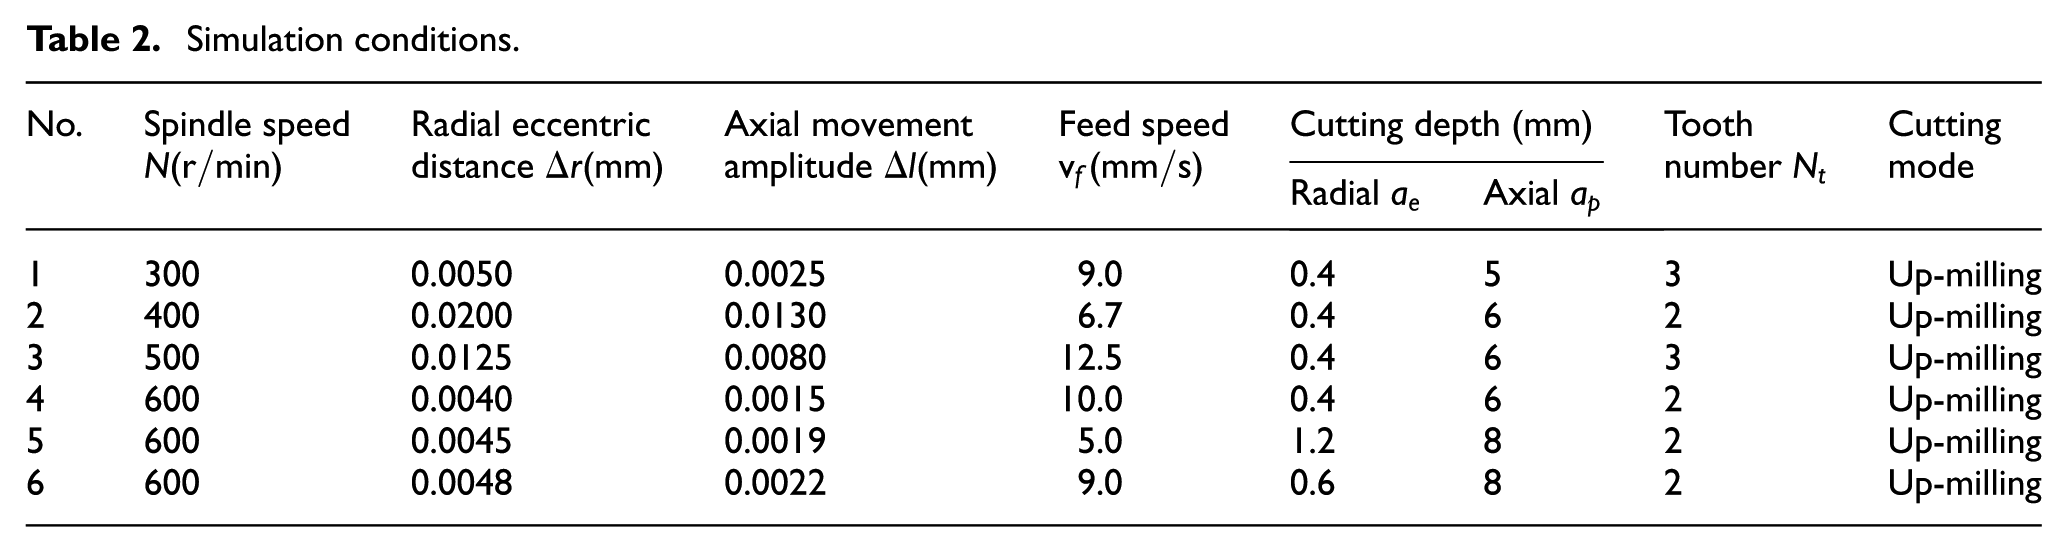
To further reveal the relationship between the spindle speed and surface topography, surface topography simulation is carried out for finish milling. The simulation parameters containing the radial eccentric distances and axial movement amplitudes measured under the condition of flutter are shown in Table 2, and the simulation surfaces under the corresponding parameters are shown in Figure 9.
Simulation conditions.
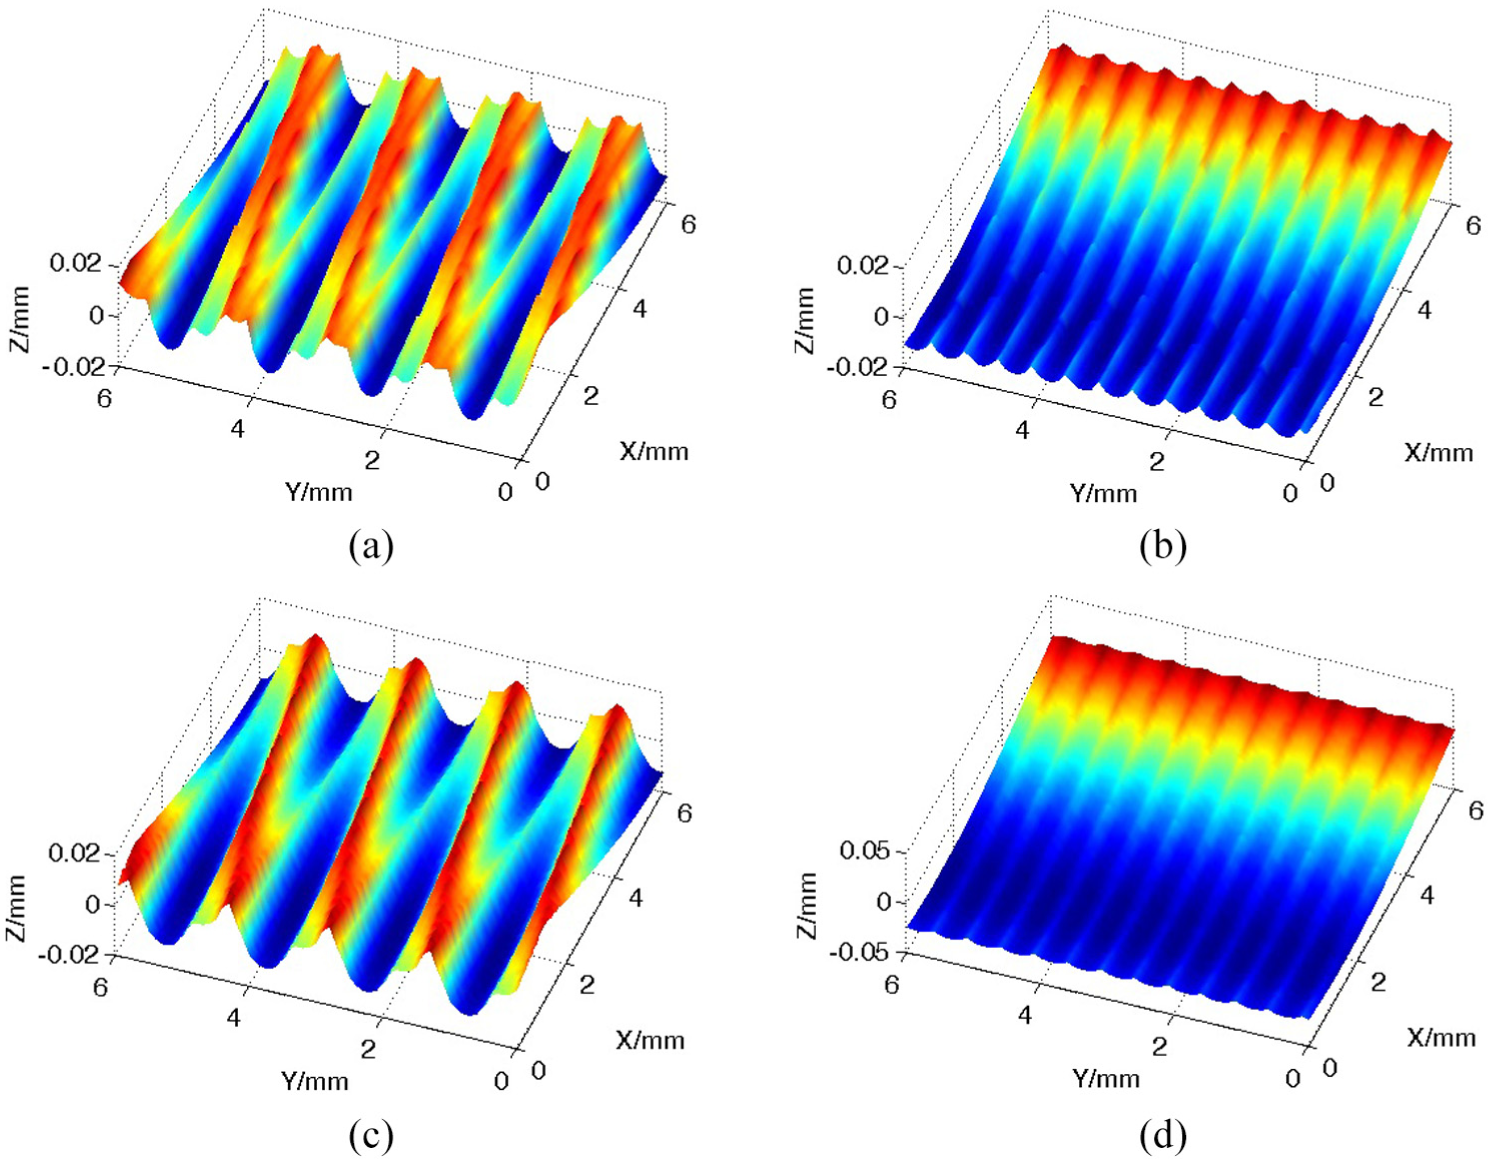
Simulation surfaces under the four conditions in Table 2: (a) simulation condition 1, (b) simulation condition 2, (c) simulation condition 3, and (d) simulation condition 4.
Figure 9 shows that when
Comparison and analysis of simulation and experimental results
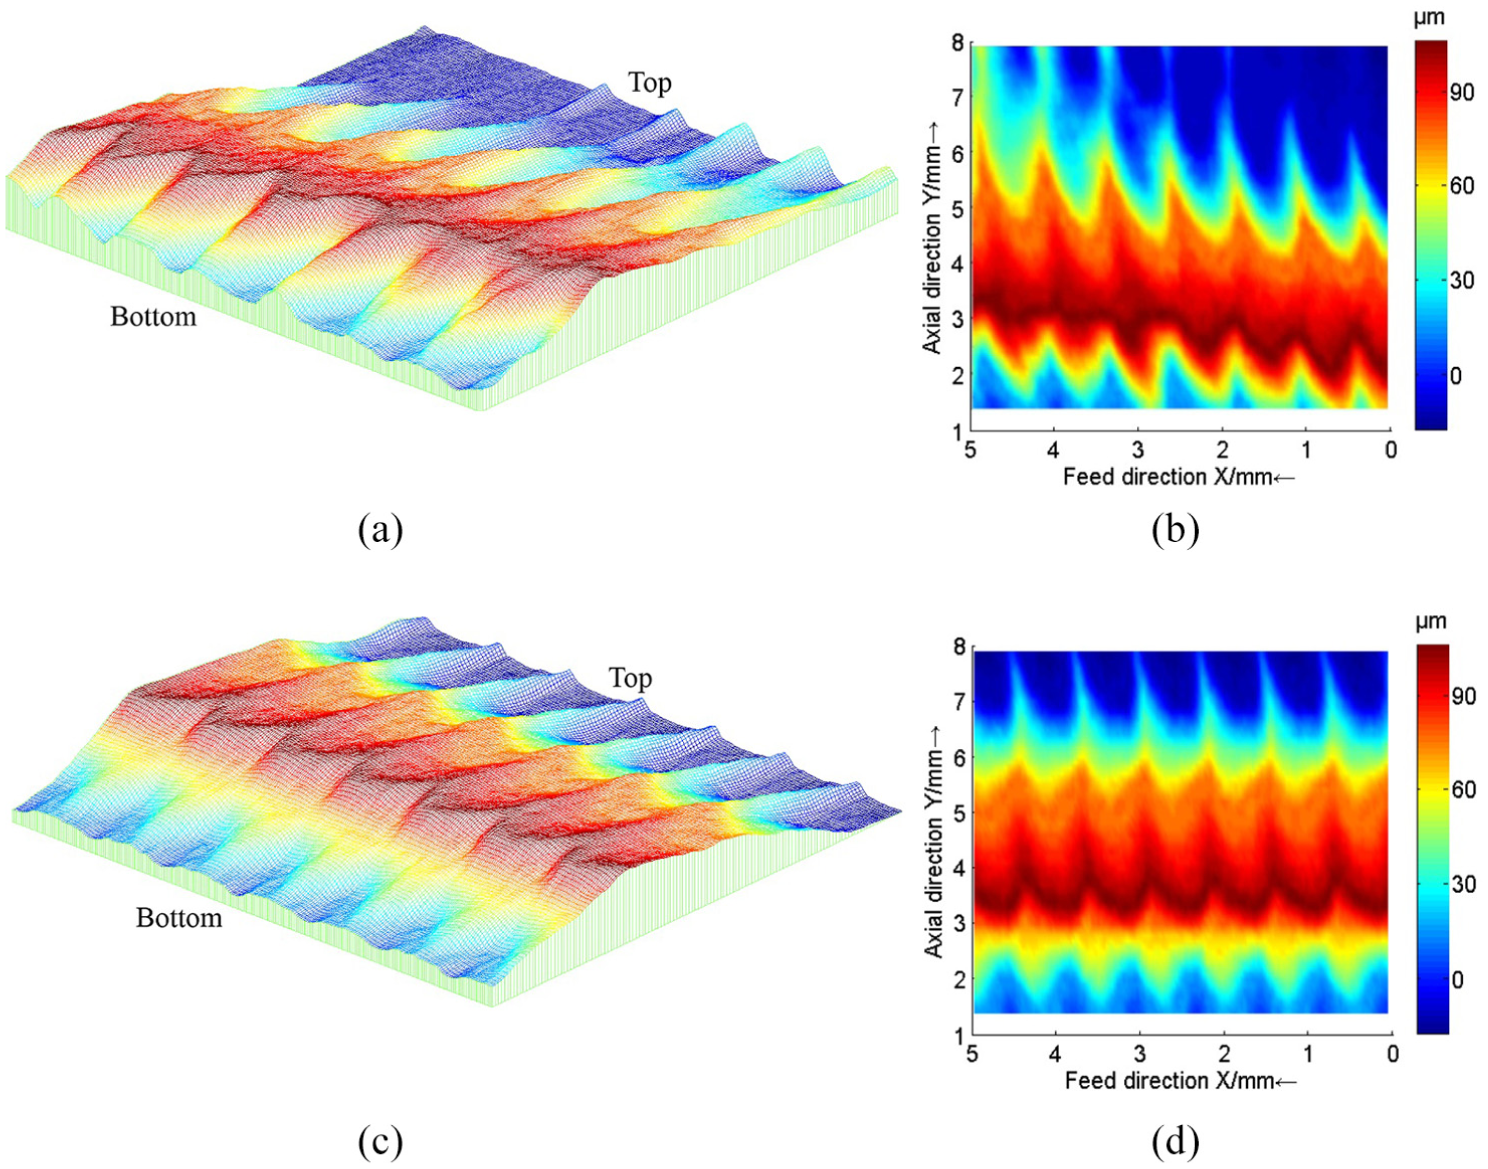
Model validation is carried out by comparing the measured and simulated topographies (in Figures 10 and 11) under the same machining parameters. It is important to note that in the measured topographies, because the profilometer cannot enter the entire visual field of the edge, the height at the bottom of the machined surface is not considered in Figures 10(b) and 11(b).
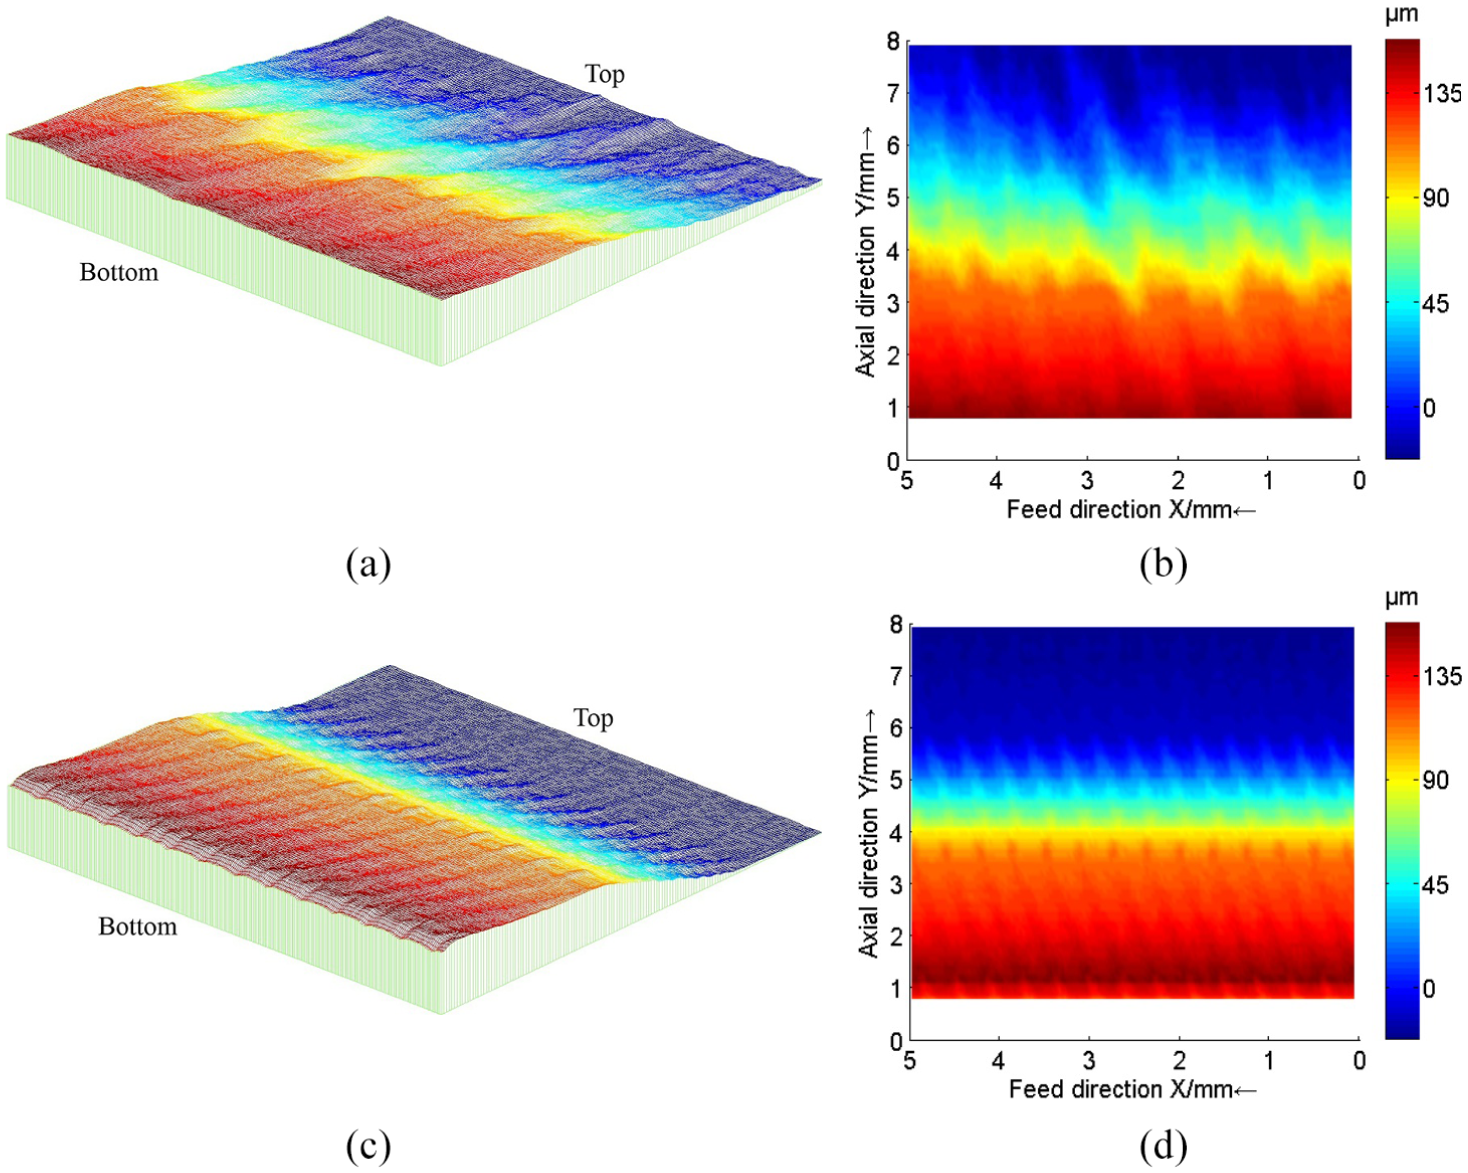
Measured (a), (b) and simulated (c), (d) surface topographies machined under condition 5 in Table 2.
Measured (a), (b) and simulated (c), (d) surface topographies machined under condition 6 in Table 2.
The predicted and measured surface topographies show good agreement in their shape and amplitude in Figures 10 and 11. In the experimental prediction model, there is a deviation between the top and the bottom of the machined surface, and the two tests are 84 and 145 μm, respectively. In the first test (shown in Figure 10(a)), the transition from the top to the bottom of the machining surface is smoother than the transition in the second test (shown in Figure 11(a)), in which the surface has a sudden change at approximately y = 3.5 mm.
In Figures 10(b) and (d) and 11(b) and (d), a reasonable agreement in the width and position of the bands along the Y axis between simulated and measured surfaces can be observed.
The ‘sudden change’ of the surface topography along the Z axis is caused by the marks left between the front and rear cutter paths in the axial depth of cut of the milling cutter. Figures 10(b) and 11(b) show that the ‘sudden change’ connection is not a straight line strictly parallel to the feed direction of the milling cutter, which is caused by tool vibration (including axial drift). The larger the feed speed and the smaller the radial cutting depth are, the more sensitive the chatter vibration is, and the more obvious the effect is at the same vibration amplitude and frequency (low frequency) as well as at the same axial cutting depth. This is the reason why the valley width in the feed direction of Figure 11(b) is larger than the valley width in the feed direction of Figure 10(b), and the transition from the top to the bottom of the machining surface in Figure 10(a) is smoother than the transition in Figure 11(a).
At the top of Figures 10(a) and (b) and 11(a) and (b), the peaks and valleys show the inconsistency, especially at the top of Figure 11(a) and (b). This inconsistency is more obvious due to the non-uniformity of dynamic effects, including workpiece vibration, tool wear deformation, and workpiece material deformation, which are not reflected in the simulation model, which is a problem to be solved in the future study.
To make the feed marks of Figure 11(b) and (d) stand out, the height component is removed and only the feed marks are considered in Figure 12(a) and (b), where the marks agree well in the shape. These figures also show that the feed marks are not continuous along the Y axis direction, and therefore, the tooth generating the surface changes along the Y axis.
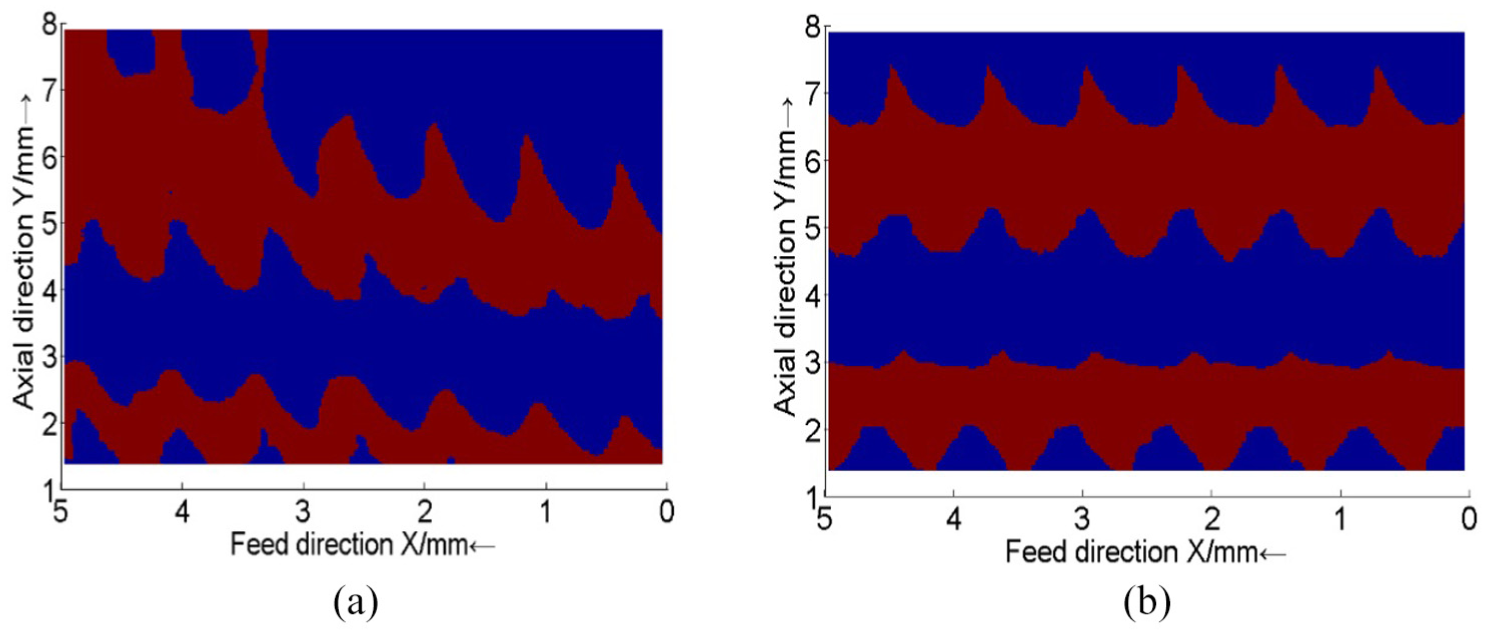
Measured (a) and simulated (b) profiles extracted after removing the height component of surface topographies represented in Figure 11.
The surface roughness is evaluated using
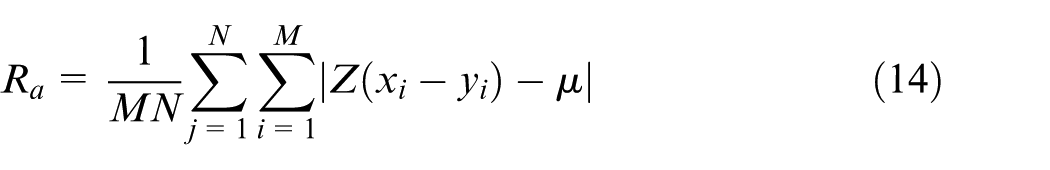
where
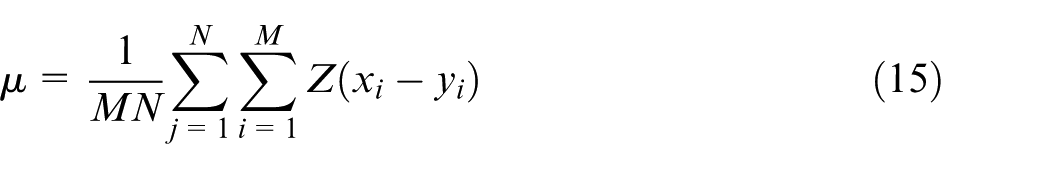
Considering the mean roughness
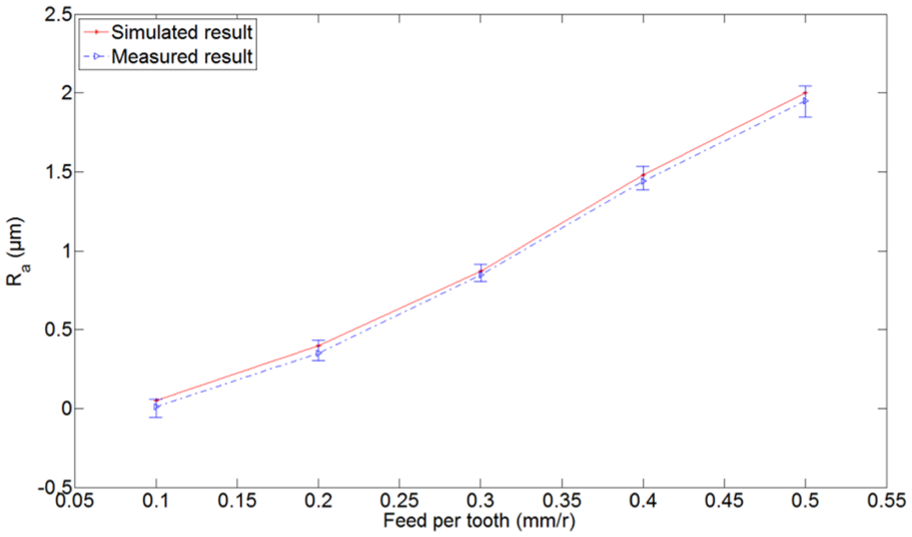
Influence of feed per tooth on
For the convenience of comparison, the cross-section curves of the simulated surfaces are also presented. From the recorded surfaces at the same section of the measured workpiece and the simulated surfaces presented in Figure 14, it can be observed that the simulated surfaces agree well with the recorded (measured) surfaces. The major characteristic parameters such as wave length and height of each peak are almost identical. If tool radial runout and axial drift are ignored, the profiles generated by peripheral milling would be regular waves, which have the same shape (as shown in Figure 14(c)).
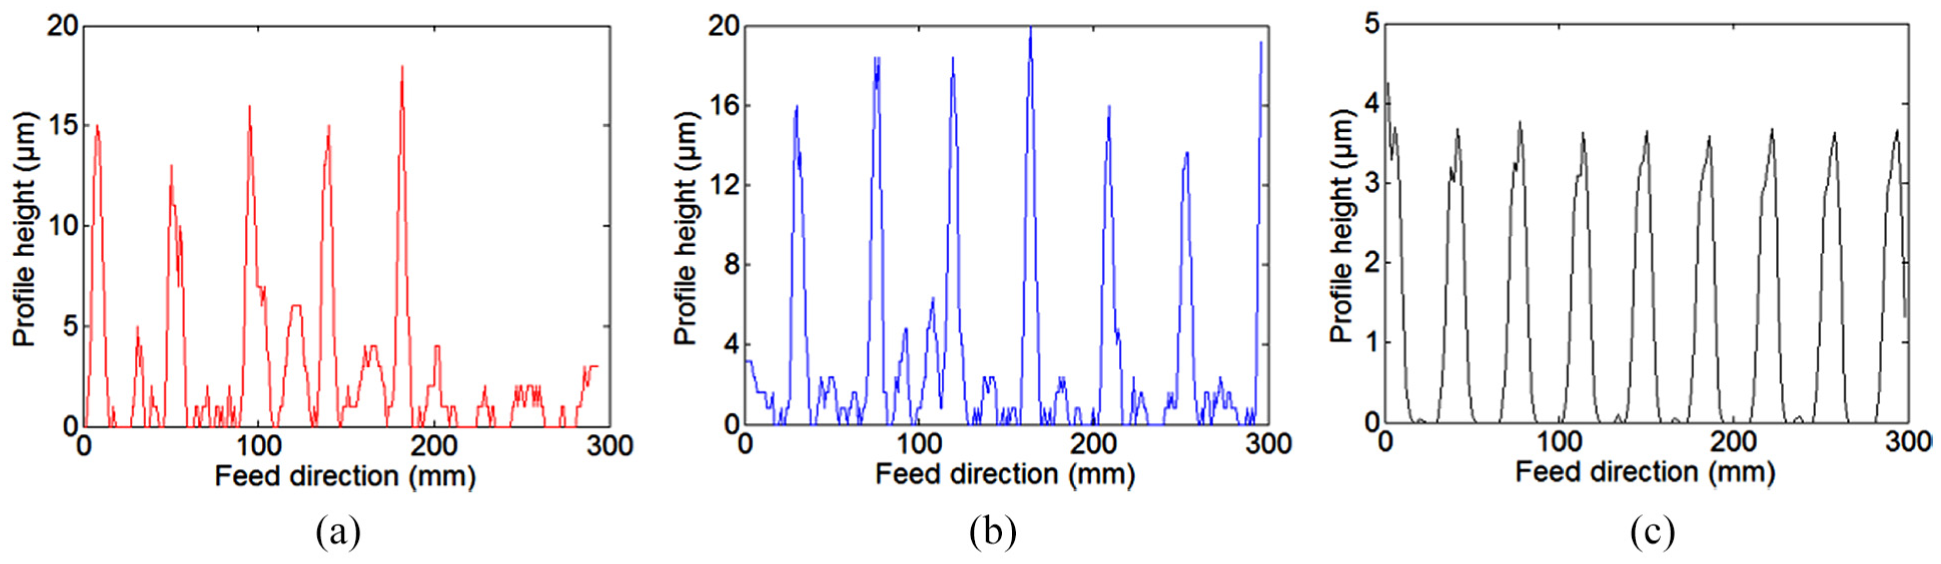
Comparison of cross-section profile curves between measured and simulated surfaces at the same position: (a) measured (with tool radial runout and axial drift), (b) simulated (with tool radial runout and axial drift), and (c) simulated (without tool radial runout and axial drift).
Conclusion
A simulation model of dynamic cutting force and surface topography for the peripheral milling process was constructed. The relationship between surface topography (including surface finish error) and spindle speed was analyzed by simulation and test methods. A model for the prediction of surface topography in peripheral milling considering tool radial runout and axial drift is presented. The model includes the transformation matrix of motion-homogeneous coordinates and the vector operation principle and adopts the Z-map model and discrete method. Surface topography generation is simplified with respect to other models in the literature. Cutting tests are carried out and good agreements between measured and predicted surface topographies simulated by the model in this article are found in terms of their shape, magnitude, feed mark, profile height of cross-section, and surface roughness. The simulation system developed has high reliability and can predict the surface topography obtained by peripheral milling under different processing conditions, which then provides guidance for the selection of actual machining parameters.
The following conclusions can be drawn from the experimental and simulation results.
The strategy of selecting cutting parameters in finish machining is significantly different from the strategy in rough machining. The spindle speed should be selected on near and on the left side of the maximum stability lobe corresponding to the natural frequency of the system.
The simulation results show that the peripheral milling surface roughness increases with the increase in feed per tooth.
The larger the feed speed and the smaller the radial cutting depth are, the more sensitive the chatter vibration of cutter is, and the more obvious the effect is at the same vibration amplitude and frequency (low frequency) as well as at the same axial cutting depth.
Footnotes
Appendix 1
Declaration of conflicting interests
The author(s) declared no potential conflicts of interest with respect to the research, authorship, and/or publication of this article.
Funding
The author(s) disclosed receipt of the following financial support for the research, authorship, and/or publication of this article: This work was partially supported by the Nature Science Foundation of China (Grant Number 5177 5192), the Guangdong Natural Science Foundation of China (Grant Number 2018B030311032), and the Programme for Scientific and Technological Innovation in Shenzhen, China (Grant Number JCYJ 201604151 13818087).