
Abstract
Contraposing the surface quality testing of a Wolter-I type mandrel after ultraprecise turning, we propose a measuring method based on a contact-type profilometer and fabricate an adjusting device to assist in measurements. By coordinating probe translational motion in the Z and Y directions, this device provides 6 degrees of freedom. Extracting the feature point on the curve of a meridian section contour, the measurement data of the two aspherical surfaces that constitute a Wolter-I type mandrel can be segregated. This feature point is used as a reference point to make the measurement coordinate and machine coordinate systems coincide with each other in order to calculate the dimensional errors of the mandrel. By choosing samples of different lengths, some property indexes of the mandrel surface, such as roughness, waviness, and form error, can be extracted from the contour error signals via the wavelet transform method. This proposed method can solve the problem that the aspheric surface dimension error and contour form error of the Wolter-I mandrel surface cannot be measured by the profilometer when the aspheric reference vertex cannot be determined. Using this method, only one measuring instrument is required to evaluate the mandrel after diamond turning, which can improve the measurement efficiency, and cover the full spatial wavelength range from the figure error to the surface roughness. In addition, this method has the potential to achieve the in situ measurement of the surface of the Wolter-I type ultra-precision mandrel.
Introduction
A Wolter-I type imaging system is an important grazing-incidence image system widely applied in X-ray grazing-incidence optics, such as X-ray telescopes for astronomical observation, X-ray microscopes for sample testing, optical collectors in extreme ultraviolet (EUV) photolithographic systems. A Wolter-I type reflector is produced by combining two coaxial, confocal axially symmetric aspherical surfaces. The gradient (length-to-diameter ratio) of this kind of aspherical reflector is normally very large, and the accuracy requirements are strict. Thus, the Wolter-I type reflector is very difficult to be fabricated and measured.1–3 Currently, the common method of fabricating the Wolter-I type reflector is to copy the mandrel. The convex surface of the mandrel is first machined by ultraprecise turning or grinding and polishing to achieve the accuracy requirement. The reflector surface is then copied by means of chemical vapor deposition (CVD) or physical vapor deposition (PVD). After electroforming of the mirror shell, the mandrel is then separated from the mirror shell. The manufacturing of the reflector is then completed.4–7 Obviously, the surface quality of the mandrel is extremely critical to the surface quality of the copied reflector. Hence, during the manufacturing process, the mandrel should be precisely measured several times. Property indexes of the mandrel such as dimensional error, surface roughness, waviness, form error must be precisely measured, especially after ultraprecise turning or grounding, to provide accurate and reliable reference data for next polishing step.
The surface of a Wolter-I type mandrel is a steep aspherical surface with a large length-to-diameter ratio. The methods of measuring this kind of steep aspherical surface can be classified as contact and contactless types. The contactless-type measurement method mainly refers to an optical testing method that is usually the final testing step of an optical surface, while the contact-type measurement method is usually used to measure the surfaces during the manufacturing process.8–10 Biswas and Coupland 11 designed an anamorphic probe and measured the steepness of the aspherical surface by increasing the size of the numerical aperture of the probe. The surface measurement accuracy conformed to submicron level. Zhang et al. 12 proposed a non-null annular sub-aperture stitching interferometry (NASSI) method for steep aspherical surface testing that decreases the sub-aperture number effectively compared to standard ASSI. Poleshchuk et al. 13 proposed a novel approach combining with the principle of computer-generated hologram (CGH) for interferometric testing of the steep axially symmetric aspherical surfaces. Its measurement accuracy depends on the accuracy of the reference wavefront that is formed by the reflective part of the combined CGH. Yang et al. 14 proposed a method for the measurement of small steep convex aspherical surfaces used a combination of a Hartmann test with CGH, which can be used in the production line. Egle et al. 15 suggested its use to manufacture a high-quality mandrel. However, several testing equipments are needed in such manufacturing at present. In the mandrel manufacturing process, the measuring instruments mainly include a coordinate measuring machining (CMM), contact roundness-measuring device, large micrometer caliper, ultra-precision contact profilometer, and interference contrast microscopes, as well as other devices. In the final product acceptance stage, measuring instruments mainly include a non-contact roundness-measuring device, high-resolution interference microscopes, and so on. Cui et al. 16 developed an in situ long trace profiler (LTP) mounted on the fabrication instrument. The slope profiler was converted into a height profiler, which could measure the surface profile of Wolter-I type mirror in real time during the fabrication process.
It is obvious that the ultraprecise measurement of steep aspherical surfaces is difficult. The optical measurement method has a high resolution (sub-nanometer level), but its scope is limited. Optical measurement is usually used to measure the micro-roughness in a small spatial frequency scale. If the measurement scope needs to be extended, the accuracy is normally sacrificed. For the measurement of the form error in larger spatial frequency scale, the sub-aperture stitching method is usually adopted, and the stitching error is critical to the measurement accuracy. Moreover, the measurement time will be lengthened, the data treatment will be more complicated, and several problems will occur, such as error propagation and accumulation.17–19 The CMM is usually used to measure the dimensions of workpieces. It has a large measuring scale and a submicron level resolution. The traditional contact-type profilometer is a common instrument used to measure the two-dimensional dimensions, surface contour shape, waviness, and roughness of workpieces. It has the advantages of high resolution (sub-nanometer level) and large vertical measurement scale.20–22 Therefore, in this article, we propose a method of measuring a Wolter-I type optical mandrel surface based on use of a contact-type profilometer, and an adjusting device is developed to assist in the measurement process. Contraposing an ultraprecise turned mandrel surface, the modified profilometer can conduct the measurement of property indexes, such as dimensional error, form error, surface waviness, surface roughness. Using this method, measurement times can be reduced to improve the efficiency of the measuring process.
Measurement methodology
When measuring an axial symmetric aspherical surface using a contact-type profilometer, the top point is usually included, for example, point A in Figure 1. The measurement coordinate system is established to coincide with the machine coordinate system. The point A is considered as the origin point. The dimensional error and contour form error can be then obtained in the established measurement coordinate system. However, the aspherical surface top point cannot be found when measuring the surface of a Wolter-I type mandrel, which includes an ellipsoidal surface and a hyperboloidal surface, as shown in Figure 2. Obviously, the relationship between the measured data and the mandrel meridian section curvilinear equations cannot be established without the reference top point. This increases the difficulty of precisely measuring the Wolter-I type mandrel surface using a profilometer. For the Wolter-I type mandrel, there are mainly three feature points (A, R, and B) on the contour curve of the meridian section of the mandrel. If one feature point is used as a reference point to make the measurement coordinate system coincide with the machine coordinate system, the precise measurement of the Wolter-I type mandrel can be obtained by the profilometer. 23
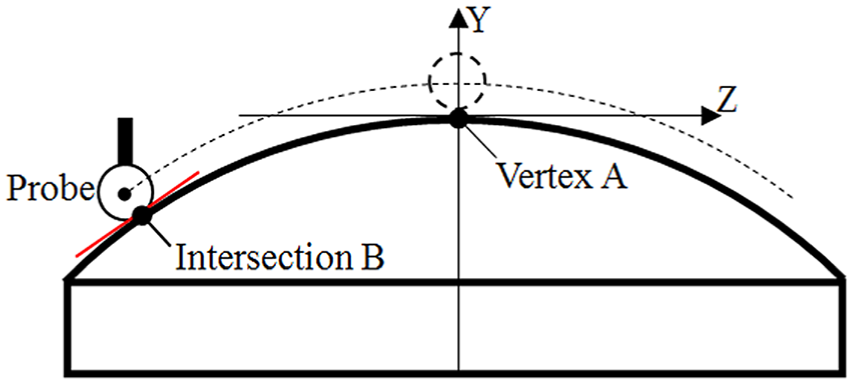
Measured axially symmetric aspherical surface with vertex
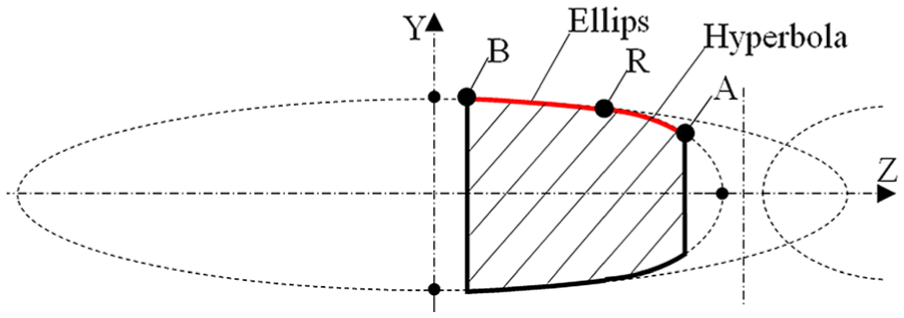
Meridian contour curve of Wolter-I type mandrel.
In order to align the relative position between the profilometer probe and the contour curve of the mandrel meridian section, we designed an adjustment assistance stage. As shown in Figure 3, this stage consists of an X axial linear displacement platform, a horizontal rotating platform, a vertical rotating platform, and chucks. Considering the translational motions of the probe in the Z and Y directions, the measurement system provides 6 degrees of freedom, namely X, Y, Z, A, B, and C. The installation steps of the adjustment assistance stage are described as follows:
First, the X axis is adjusted according to the reference plane of the profilometer probe. The X axis is perpendicular to the moving direction of the probe, which is fixed on the measuring table of the profilometer.
The B axis is mounted on the X axis, which is used to control the rotating motion of the mandrel in the horizontal plane.
The commercially available indexing head is utilized to fix the A and C axes, which is mounted on the B axis. The A axis is employed to adjust the relative position between the C axis and the horizontal plane. The C axis is used to control the rotation motion of the mandrel on its axis.
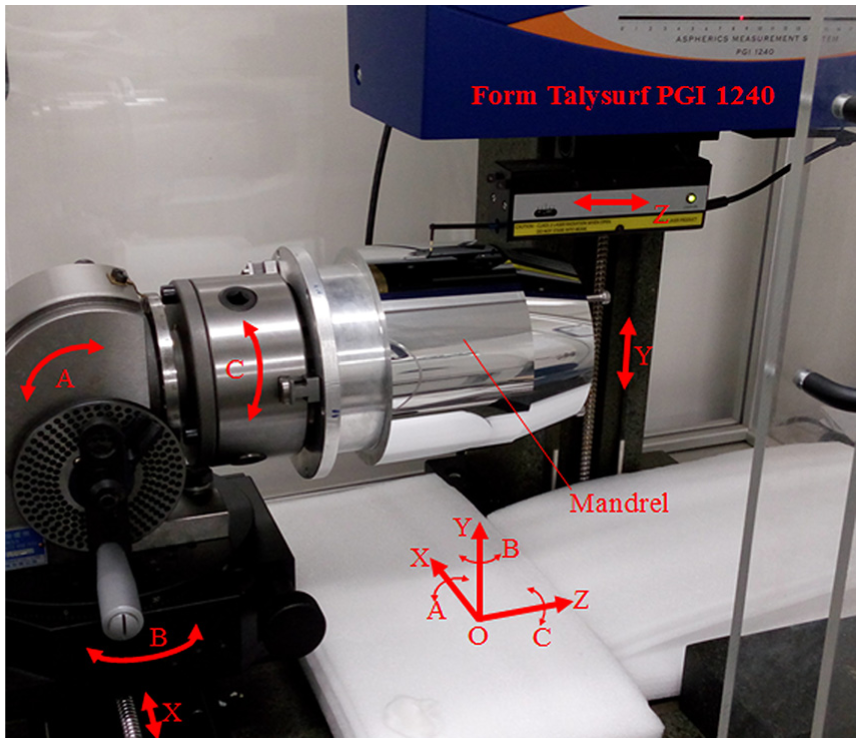
Measurement system for Wolter-I type mandrel.
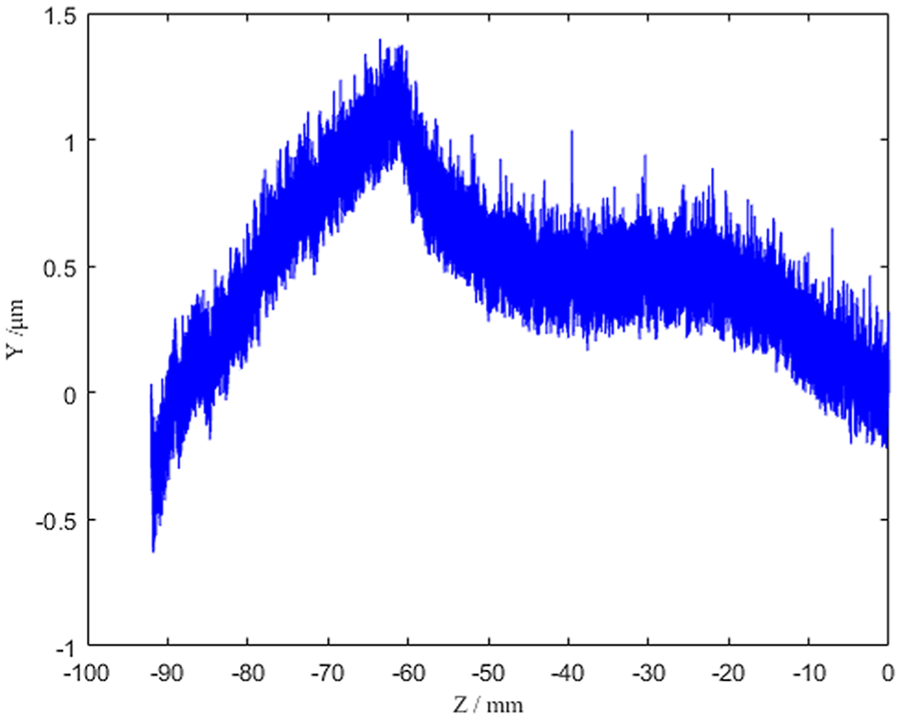
The dial gauges and torsion spring meter are used during the installation and adjustment processes of the mandrel. The installation error of each axis is less than 1 μm. After mounting the mandrel, the adjustment assistance stage maintains stationary. During the measurement process, the probe moves from point B on the contour curve of the mandrel meridian section to point A via point R. As shown in Figure 4(a), the measured curve is similar with the theoretical curve of the mandrel meridian section, but the range of the measurement coordinate system always does not coincide with the machine coordinate system. Because the profilometer probe has a limited moving range, the measured curve only includes the point R on the contour curve of the mandrel meridian section and excludes the points A and B. Assuming that the number of measurement points is N, the difference between every two consecutive points can be calculated, that is, the increment Δyi = yi + 1 – yi (i = 1, 2,…, N – 1). Because the slope of the curves on both sides of the point R varies greatly, the increment data would break at point R. Extracting the position of the point R using the wavelet transform method, we then carry out coordinate translation transformation of the measured results. And the point R is considered as a reference point to make the measurement coordinate system coincide with the machine coordinate system. After the transformation, the relationship between the measured curve and the theoretical curve is shown in Figure 4(b). Considering the point R as a demarcation point, the measurement can be segregated into two aspherical surfaces on the Wolter-I type mandrel, and the surface quality can be evaluated separately. Comparing the measured and theoretical values, the dimensional error of the mandrel can thus be calculated.
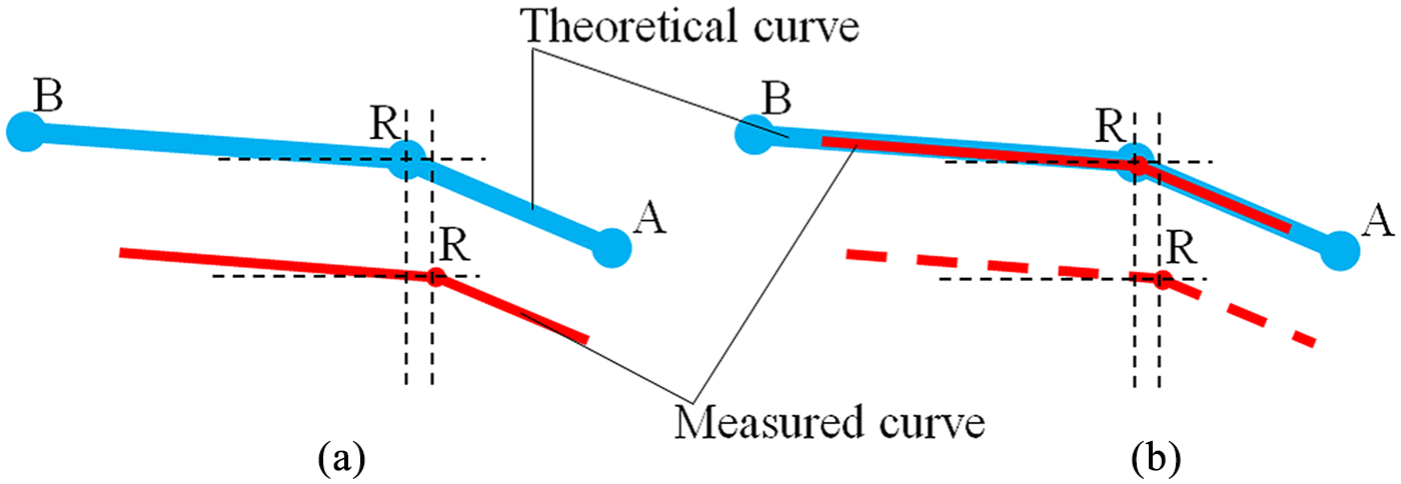
Coordinate transformation of the measurement data: (a) before and (b) after coordinate transformation.
The surface contour of a mandrel is composed of a series of peaks and valleys with different heights and intervals, including surface form errors, waviness, and roughness. It is usually distinguished by the size of the wave pitch, λ, which is defined as the distance between two adjacent wave peaks or valleys. Using the contour wave filter, the long, medium, and short waves in the contour can be extracted and evaluated separately. At present, the common methods of analyzing the signal frequency are the Fourier transform and wavelet transform. The Fourier transform can only analyze the frequency, and the fundamental function used is unique. On the other hand, the wavelet transform can be used to not only analyze the frequency, but also show the time of occurrence, and it focuses more on analyzing geometrical waveform features. The multiscale wavelet transform is helpful in extracting different features at different resolutions. Therefore, the wavelet transform is more suitable to segregate the features of the mandrel surface contour.24–26
The signal superposition relation of the signal S after n-scale multiresolution decomposition through the wavelet transform can be expressed as

where ai (i = 1, 2,…, n) is the low-frequency approximation coefficient of the i layer, and di (i = 1, 2,…, n) is the high-frequency detail coefficient of the i layer.
Experimental details and results
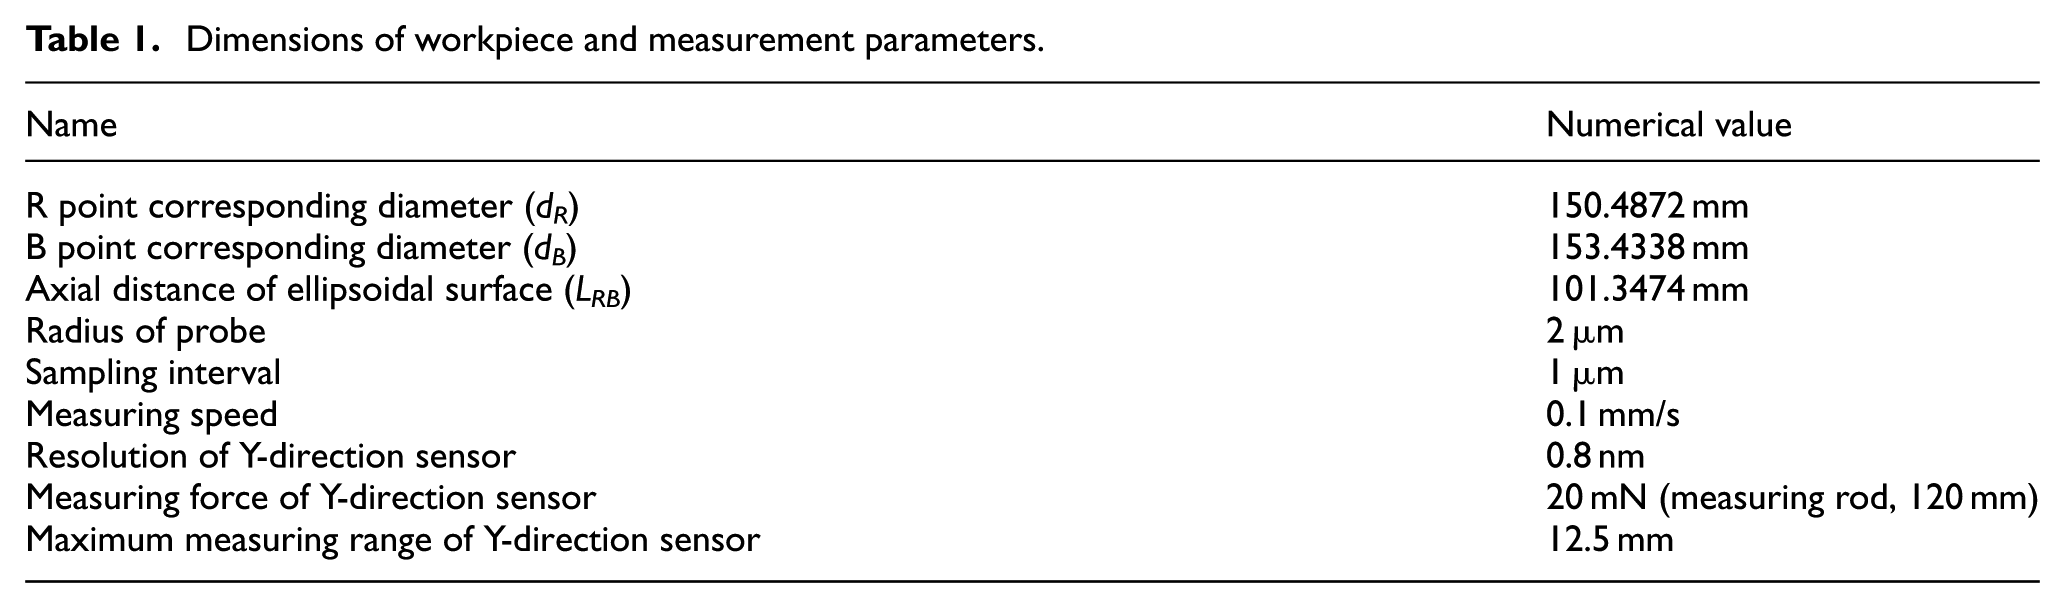
In this experiment, the measurement data of the ellipsoidal surface of the mandrel were analyzed and the surface property indexes were calculated. The analysis and calculation methods used for the surface quality of the hyperboloidal surface are the same as those of the ellipsoidal surface. A high-precision Form Talysurf PGI 1240 type mechanical stylus profilometer (Taylor Hobson Co., UK) was used in the measurement process. It has nanoscale vertical resolution and can be used for the precision measurement of the optical aspherical surfaces. The workpiece dimensions and measurement parameters in the experiment are listed in Table 1.
Dimensions of workpiece and measurement parameters.
The wavelet transform has the property of space locality, which can determine the locations and distributions of the change points. The multiscale decomposition of the obtained signals is necessary when detecting the abrupt change points of the signals. The location of the change point can be clearly determined by the approximation and detail coefficients after the decomposition. However, there is no consensus theoretical standard for the choice of the wavelet basis functions. Due to the incremental value of the measured data for the Wolter-I type mandrel meridional section curve, there is only one breakpoint at the point R. The position of the change point R can be determined using the orthogonal wavelet basis function, such as Daubechies (dbN), Coiflets (coifN), and SymletsA (symN). However, the Haar (db1) wavelet is the only symmetric and compactly supported orthogonal wavelet. Moreover, the Haar wavelet is non-continuous in the time domain, which is more suitable for the feature extraction of the intermittent points. Therefore, in this article, the Haar wavelet is selected as the base function to extract the position of the point R. The total number of the measurement data points is N = 118,099. Decomposing the incremental signal
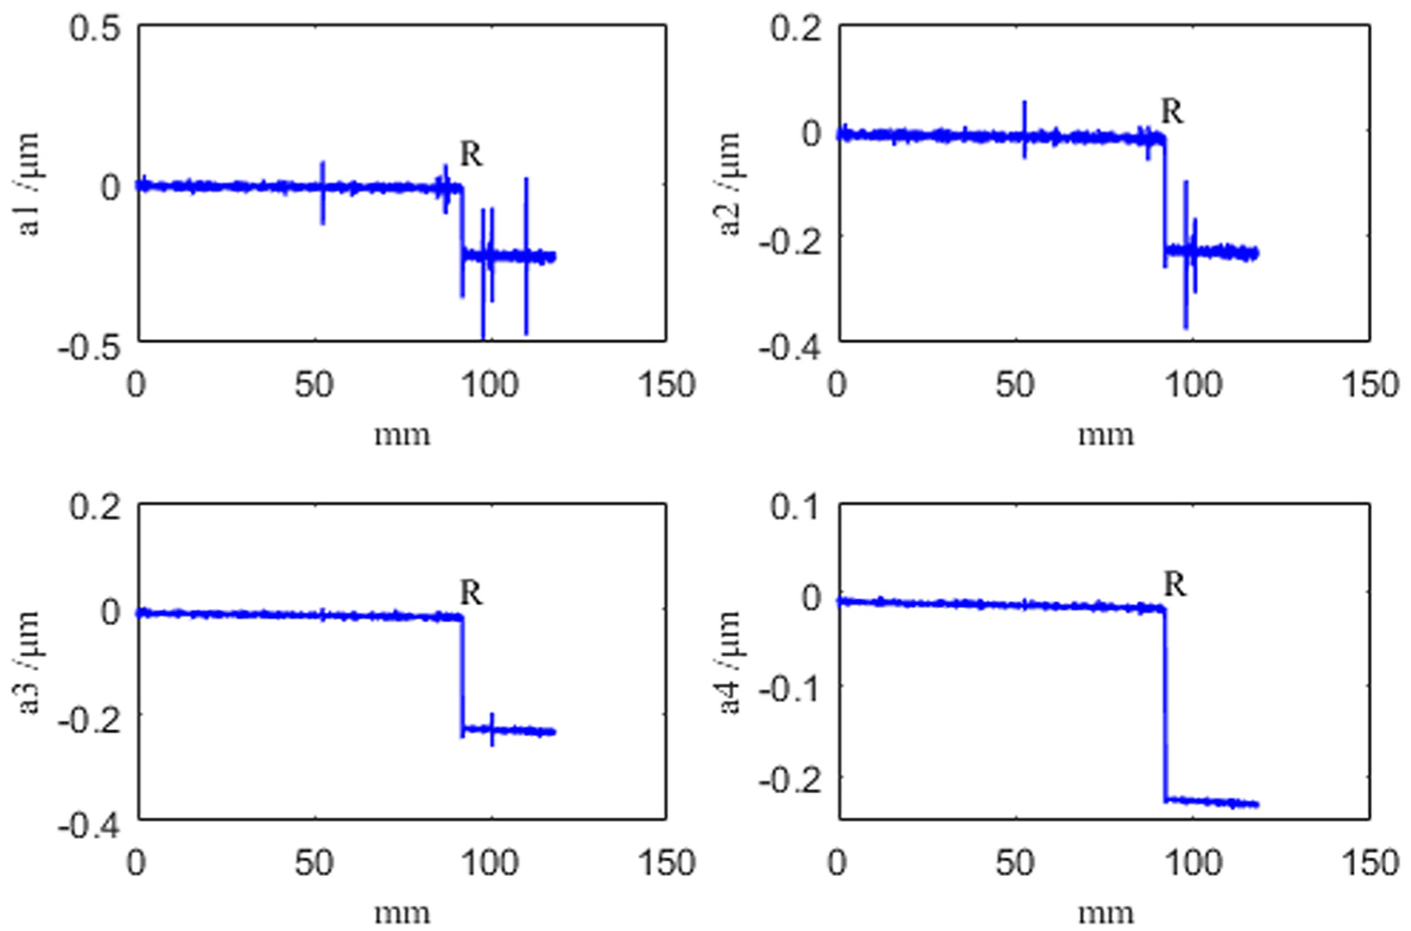
Approximation coefficients (a1–a4) of layers 1–4 after Haar wavelet decomposition.
Dimensional precision calculation
The dimensional error of the mandrel is the algebraic difference between the actual size and the basic size. The basic size is a given size in the design process, while the actual size is measured after machining. Starting from point R, we took 92,070 measurement points on the curve of the ellipsoidal surface meridian section. The corresponding length, 92.07 mm, is close to the total length of the axial of the ellipsoidal surface, LRB, which reflects the dimensional information of the ellipsoidal surface. Comparing the measured data and theoretical data, the dimensional error curve of the mandrel radius can be obtained, as shown in Figure 6. It can be seen from Figure 6 that the dimensional error curve of the mandrel radius is in the range from −0.3 to −0.7 μm. When the radius compensation of the probe is considered as 2 μm and converted into diameter error, the range of the error value is enlarged from −4.6 to −2.6 μm. After measuring the multiple generatrices, it can be proved that the results are consistent. The maximum dimension error is −4.7 μm, and the minimum dimension error is −2.6 μm. The dimension of the mandrel is inspected by three-coordinates measuring machine, and the maximum dimension error is less than 5.5 μm. Obviously, the results obtained by the above two methods are basically consistent, and the error values are on a same order of magnitude. It shows that the proposed method based on the reference point R in this study is accurate and feasible.
The radius dimensional error curve of mandrel.
Surface contour precision calculation
The wavelet transform can be employed for the multiscale analysis of the contour error signals, and the contour information of different spatial frequencies can be extracted. However, the selection of wavelet basis function is not unique. The orthogonal wavelet transformation can retain the signal power and keep the original morphology information, which is convenient for engineering calculations and applications. Therefore, the orthogonal wavelet is chosen as the basis function of wavelet transform. The common orthogonal wavelet basis functions (dbN, coifN, and symN) are selected for 1-scale decompose and reconstruct of the surface contour error signals, respectively. The approximation and detail coefficients obtained by the 1-scale decomposition are derived from the original signal. Using this approach, the reconstructed original signal is better. The branch length of the dbN and symN wavelet bases functions is set to 2N – 1, and the branch length of the coifN wavelet bases functions is set to 6N – 1. The longer the general branch set length is, the longer the filter length is. The refactoring process is relatively smooth, but a branch with too long set length may cause boundary problems. Therefore, in most practical applications, the wavelet bases functions with the branch set length between 5 and 9 are often chosen. In order to better observe the reconstruction of each orthogonal wavelet base function, the N values of both the dbN and symN are selected as 1–10, and the N value of the coifN is chosen as 1–5. After the calculation, the reconstruction error of sym5 wavelet base function is proved to be the smallest. Appling the sym5 wavelet base function, the contour error signals are decomposed into 1–10 scales, and the reconstruction error can be calculated. Results show that the reconstruction errors for each scale are similar, which are all at 10−16 orders of magnitude. In addition, after the 10-scale decomposition of the sym5 wavelet, the energy ratio between each layer approximation coefficient ai (i = 1,…, 10) and the original signal is larger than 0.9748. And the lower the number of layers is, the greater the energy ratio is. It is indicated that the lower the number of decomposition layers is in the wavelet transform, the less the energy component loss of the original signal is. The energy is mainly concentrated in the low-frequency components of the signal. The standard deviations between the approximation coefficients of each layer and the original signal are less than 0.0080. And the lower the number of layers is, the smaller the standard deviation is. It is indicated that the lower the number of decomposition layers is in wavelet transform, the higher the similarity between the approximation coefficients and the original signals is. Thus, in this experiment, we used the orthogonal symmetric wavelet basic function sym5 to segregate the frequency component in the contour error signals.
Roughness calculation
The roughness is usually evaluated by the means of arithmetic mean deviation Ra and root mean square deviation Rq. According to the processing parameters of ultra-precision turning mandrel, the theoretical value of the roughness Ra can be calculated as 8.4 nm approximately. We assumed that λc is the cutoff wavelength distinguishing the roughness from the waviness. The sampling length lr is selected according to the theoretical calculation value of Ra. That is lr=0.08 mm, and λc = 80 μm. Decomposing the sample signal into 10 layers with the sym5 wavelet, the waveform of the detail coefficients of each layer is observed. From the seventh layer, there is no obvious fluctuation of the detail coefficients. Comparing the detail coefficients d1–d6, the surface roughness at different positions along the axis direction of the mandrel can be calculated. The roughness waveform within a single sampling length is shown in Figure 7. The single roughness measurement is considered as the average value of the results obtained at different locations of the generatrix by continuous sampling. Rq can be then obtained as 12.25 nm by a statistical calculation of the mandrel surface roughness. In addition, the value of Rq is obtained as 11.88 nm by the built-in analysis software of the profilometer. It can be observed that the results of the roughness obtained by these two methods are closed to each other, which indicates that the wavelet transform of the original measurement data can be used to evaluate the roughness.
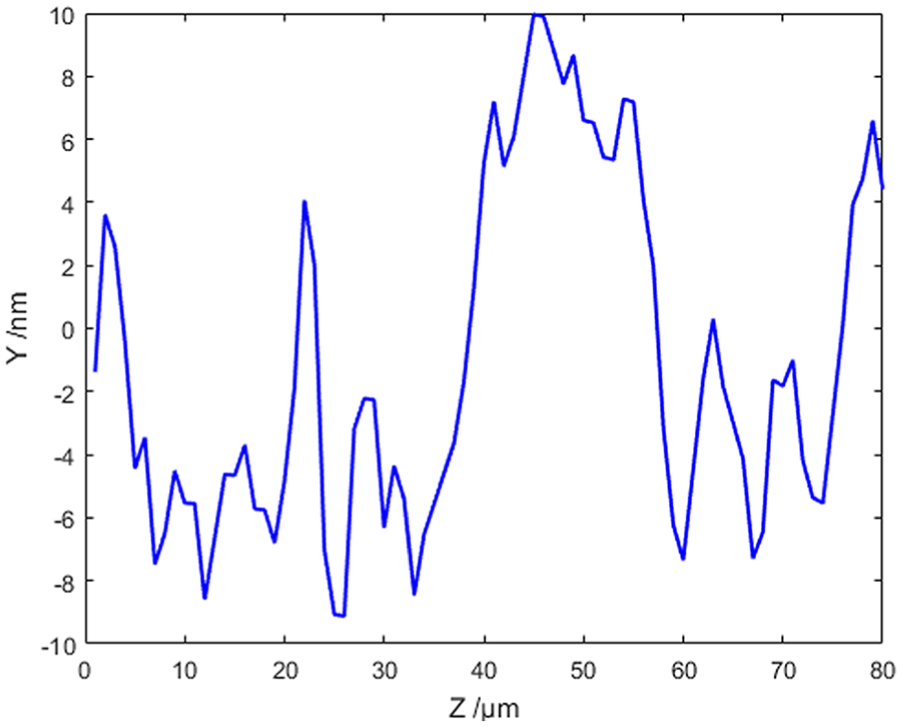
The waveform of roughness within one sampling length.
Waviness evaluation
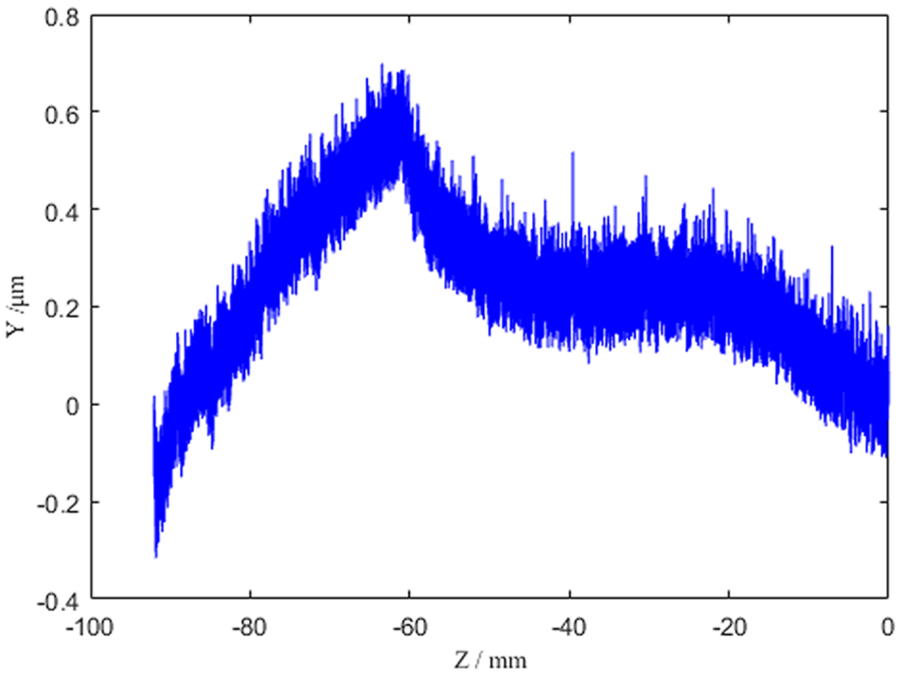
It is obvious that the greater lr is, the more components the sampling signal contains. lr is set as 10 mm and the sampling signal is segregated into 10 layers using sym5 wavelet. By comparing the coefficients of every layer, the approximation coefficients a7–a10 contain low- and medium-frequency components in the contour error signal, and a10 has no obvious periodic variation, as shown in Figure 8. Therefore, the detail coefficients d7–d10 mainly contain medium waviness components in the contour error signal, and the wavelength λ is in range from 200 to 1000 μm. Continuous samplings were taken at five different positions on the contour curve of the mandrel and the waviness results were obtained. The average surface waviness, Wa, and root-mean-square value, Wq, were basically the same. The surface waviness of the multiple generatrices were also measured at different locations on the mandrel surface. The average value Wa and root-mean-square value Wq of the surface waviness can be obtained as 14.71 and 18.80 nm, respectively.
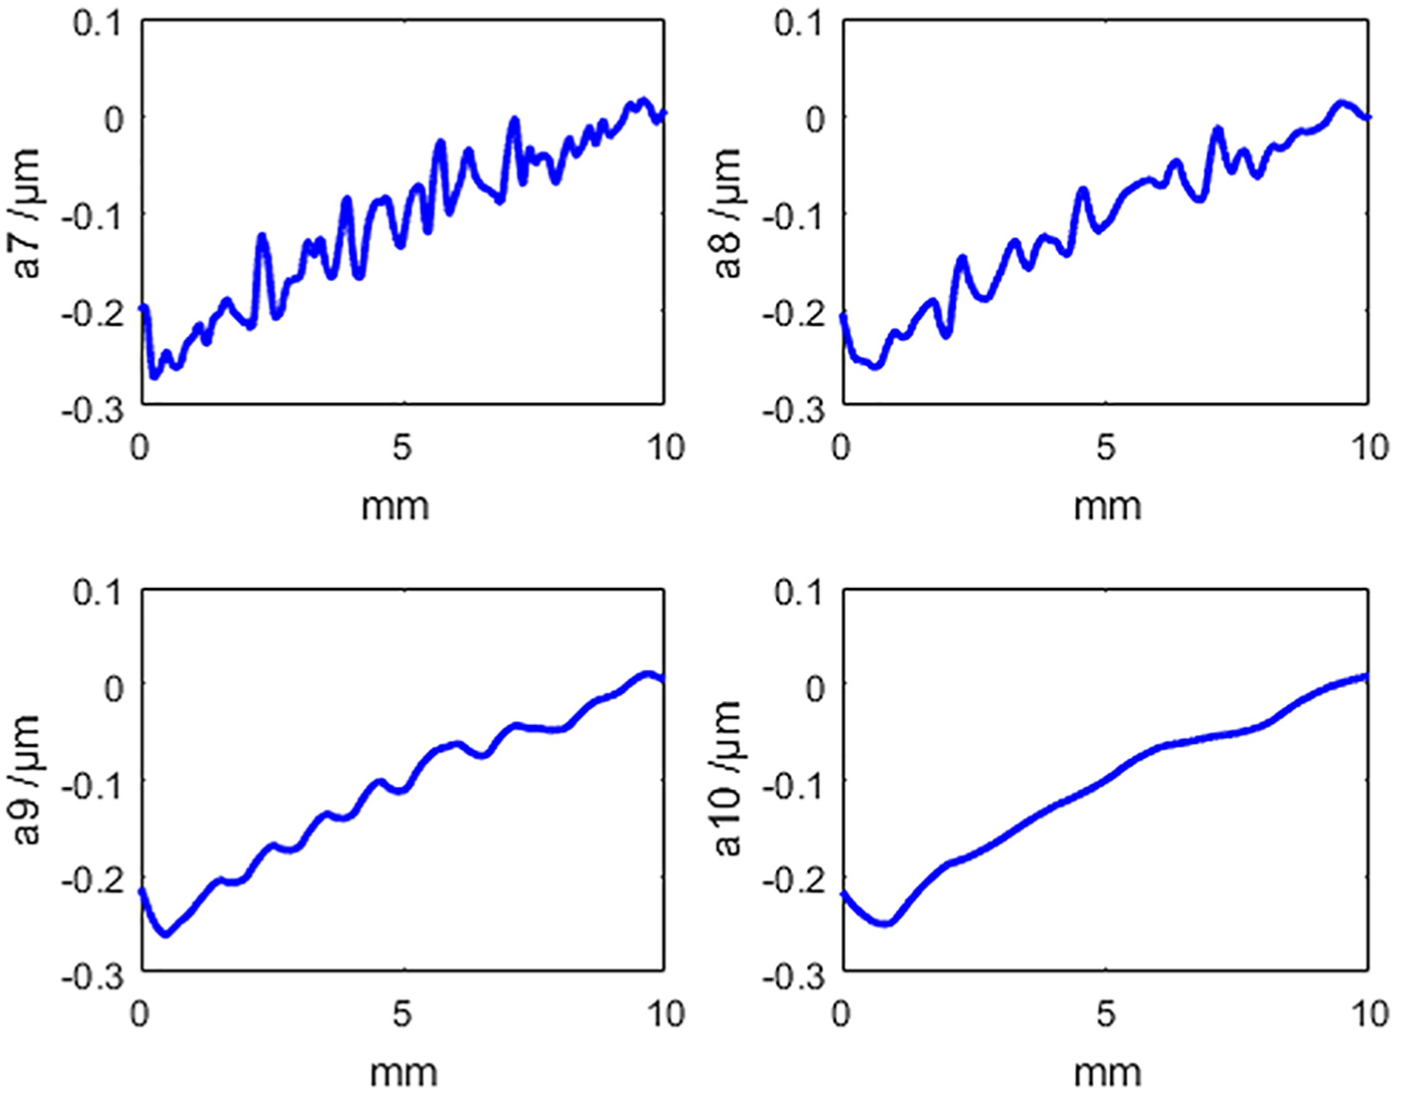
Approximation coefficients (a7–a10) of layers 7–10 after sym5 wavelet 10 layer decomposition.
Form error evaluation
According to the above analysis of the roughness and waviness, the approximation coefficients a10 of the tenth layer do not contain the high-frequency roughness information, and the periodic variation of the medium-frequency waviness signal cannot be found either. Thus, the low-frequency component contained in a10 can reflect the surface contour form of the mandrel. Keeping lr increasing continuously, the sampling signal will contain more low-frequency components, and the low-frequency information feature can be observed and extracted more obviously. Taking lr = 90 mm, the form error index with approximation coefficients a10 can be calculated. The contour form error PV value of the multiple generatrices was measured at different locations on the mandrel surface, and it is obtained as 0.43 μm by statistical calculation.
Error analysis and discussion
According to the above analysis, it indicates that the proposed method can evaluate the dimensional error, surface roughness, waviness, and form error of the Wolter-I type mandrel precisely. The measurement accuracy mainly depends on the errors caused by the adjustment of the mandrel position and the measurement error of the profilometer itself.
Position adjustment error
Before the measurement process, the mandrel position relative to the probe should be adjusted by an assistive device in order to guarantee the moving axes of the probe and the mandrel axes in the vertical plane and parallel. However, when executing the installation and adjustment, it is difficult to make the positions absolutely precise, and the installation and adjustment errors cannot be avoided. The influence of the installation and adjustment error on the measured results is the key factor for the measurement process.27,28
Tilt error
As shown in Figure 9, when the moving axes of the probe and the mandrel axes are in the same vertical plane but not parallel, the accuracy of the mandrel measurement can be greatly influenced. There are several methods of treating tilt error, but in this study, the coordinate transform method is selected to eliminate the tilt. Assuming the measurement length is l, the included angles θ0 and θ1 between the chord length (RC and RC′) corresponding to both the ideal and real contour curves of the meridian section and the direction of probe movement can be calculated and segregated. By rotating and transforming the coordinates (rotation angle Δθ = θ0 – θ1) of the measurement data with point R as the reference point, the tilt can be eliminated. Without the tilt error, the measurement and ideal data are compared to obtain the accurate dimensional error. In the experiment, when the tilt angles were θ0 = 0.8537° and θ1 = 0.7506°, the maximum dimensional error was as high as 0.16 mm before elimination of the tilt error. The diameter dimensional error curve calculated after eliminating the tilt using the coordinate transformation method is shown in Figure 10. The error is between −0.6 and 1.4 μm. After eliminating the tilt, the influence of tilt error on dimensional measurement can be ignored.
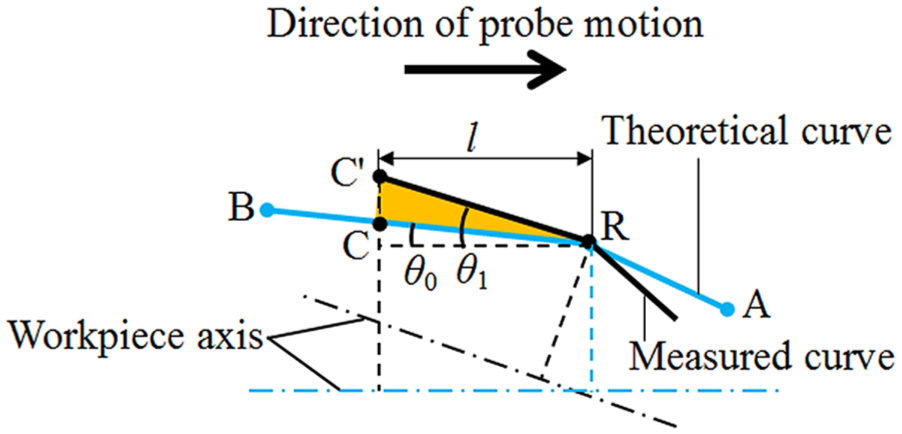
Tilt error.
The dimensional errors of the diameter after eliminating tilt.
Non-coplanar error
There are two circumstances when the moving axes of the probe and the mandrel axes are not in the same vertical plane: one is that they are segregated in two parallel planes and the other one is that they are segregated in two crossing vertical planes. Because the top point of the mandrel radial cross-section with the probe is needed to be found when installing and adjusting the mandrel, the first circumstance seldom occurs. Therefore, we focus on the circumstance in which the moving axes of the probe and the mandrel axes are segregated in two crossing vertical planes, as shown in Figure 11. When the probe motion direction departs a distance value of ε away from the mandrel meridian section, the probe moves a distance of L away. The measurement error e of the probe in the vertical direction caused by ε can be then calculated for the mandrel radial cross-section. The computational formula of e can be expressed as
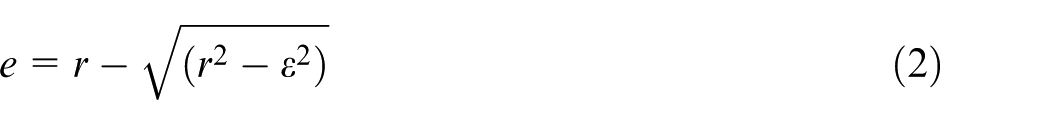
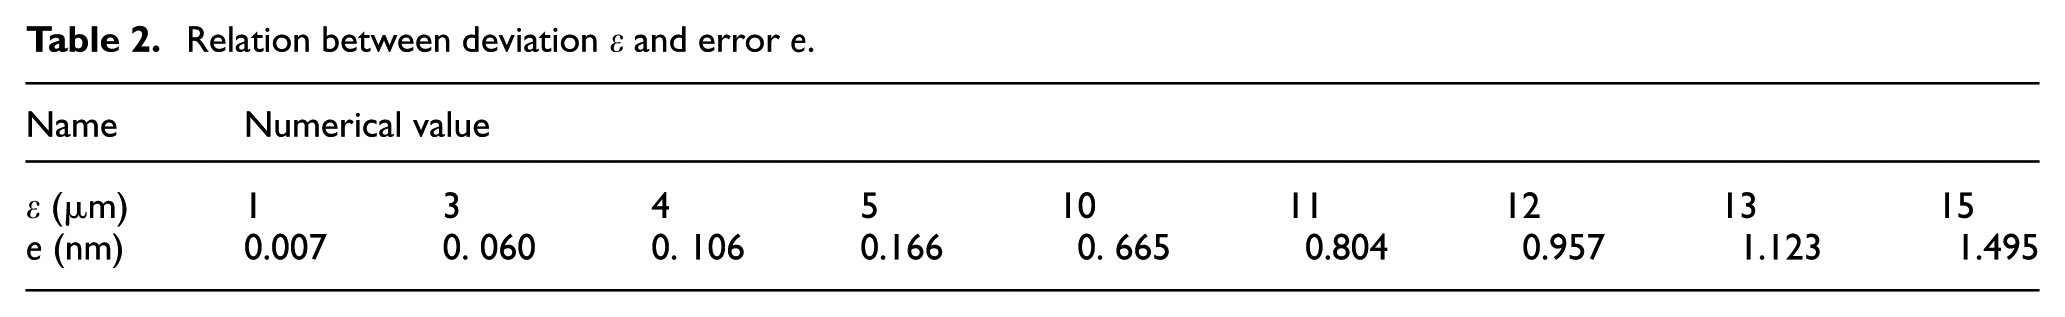
It is obvious that the smaller r is, the greater e is. The radius of the radial cross-section corresponding to point R on the ellipsoidal surface of mandrel, rR, is the smallest. Thus, r is assumed to be equal to rR in equation (2). Assuming L = 100 mm, the calculation results of the error e of different ε values are shown in Table 2. According to these results, it can be observed that within the length range of 100 mm when ε < 4 μm, then e < 0.1 nm, and the influence of surface roughness can be ignored; when ε > 12 μm, then e > 1 nm, and the influence of surface roughness cannot be ignored.
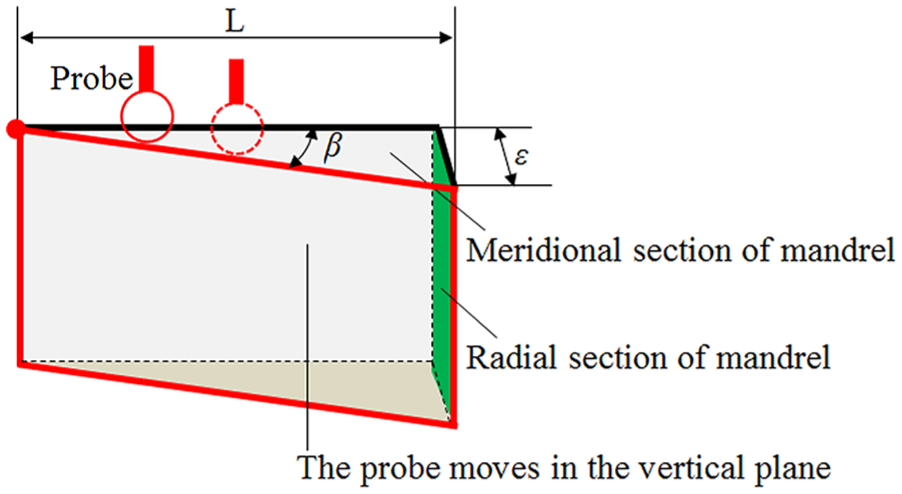
Motion direction of the probe deviates from the meridional profile of the mandrel.
Relation between deviation ε and error e.
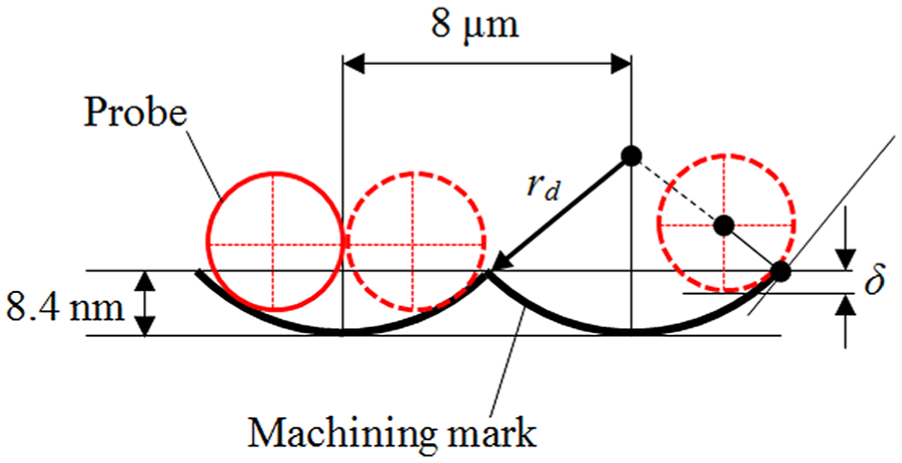
Profilometer measurement error
The measurement of the profilometer is the coordinate of the spherical center of the probe, and the probe radius is 2 μm. The influence of the probe radius should be considered when conducting the measurement process. 29 The machining parameters of the ultraprecise turning mandrel are given as follows: main shaft turning speed, 500 r/min; load of every turn of the tool, 8 μm/r; and circular arc radius of the tool, rd=0.95 mm. According to these parameters, in the worst conditions, the surface roughness can be calculated as Ra = 8.4 nm. As shown in Figure 12, the maximum error caused by the angle between the probe tip and the contact point on the workpiece surface is δ = 0.018 nm (which can be ignored). In addition, the probe radius can result in a measurement error of the mandrel dimensional in the direct measurement process. The measured value is 2 μm larger than the expected value and must be compensated. The dimensional error after the compensation (mandrel diameter) is shown in Figure 13. It can be obtained that the actual measurement of the mandrel diameter dimensional error is smaller than the theoretical value, and the error is between −4.6 and −2.6 μm.
Measurement error caused by probe radius.

Dimensional error of mandrel after compensating for probe radius measurement error.
Conclusion
In this article, contraposing the surface quality testing of a Wolter-I type mandrel after ultraprecise turning, we proposed a measuring method based on a contact-type profilometer and built an adjustment device to assist in the measurement process. This method solves the problem that the aspheric surface dimension and contour form errors of Wolter-I mandrel surface cannot be evaluated by profilometer when the aspheric reference vertex cannot be found. The following conclusions can be obtained:
Using the developed measurement adjusting stage, the relative position of both the mandrel and probe could be adjusted, and a precise measurement was realized using a profilometer to determine the curve of the mandrel surface meridian contour.
Based on the reference point R, it was easy to accurately identify the boundary point between the hyperboloid and ellipsoid from the incremental signal data corresponding to the profiler measurement signal. It indicates that this method is applicable for the measurement of the surface of the Wolter-I type mandrel, which is also suitable for measuring the combined aspheric surface with a large difference in the slope of the two adjacent aspheric meridians at the intersection.
The influence factors on the measurement errors were analyzed and compensated. The experimental measurement tests of the mandrel were conducted, and results show that the radial dimensional error of the mandrel is a negative value between −4.6 and −2.6 μm. The surface roughness of the mandrel (Rq) is 12.25 nm, and the surface contour form error of the mandrel (PV value) is 0.43 μm. This method is conducive to achieve the in situ measurement of the surface of the Wolter-I type ultra-precision mandrel.
Footnotes
Acknowledgements
The authors gratefully acknowledge Dr Wenjun Zong and Chunlei He for technical assistance in machining and measuring the workpiece.
Declaration of conflicting interests
The author(s) declared no potential conflicts of interest with respect to the research, authorship, and/or publication of this article.
Funding
The author(s) disclosed receipt of the following financial support for the research, authorship, and/or publication of this article: This work was supported by a grant from the major project of high-grade CNC machine tools.