
Abstract
This study focuses on microstructure and mechanical properties as a function of location in additively manufactured high-strength weathering steel components using gas tungsten arc as the heat source. Variations of microstructure and mechanical properties in various locations are presented and analysed. The as-deposited high-strength weathering steel is composed of columnar grain morphology with proeutectoid ferrite, acicular ferrite, side plate ferrite and a small amount of pearlite microstructure in the top region, equiaxed grains with ferrite and pearlite in the middle region, and columnar grains in the near-substrate region with the microstructure similar to that in the top region. There exist obvious layer bands in the middle region, and the forming mechanism of the bands is addressed. Microhardness measurement and tensile strength testing indicate obvious changes in different regions, depending on location and direction of testing specimens. The microhardness in the middle region is inferior to that in both near-substrate and top regions. The ultimate tensile strengths in the travel and deposition height directions are approximately 553 and 506 MPa, respectively. Different locations exhibit heterogeneous tensile strength and elongation due to various microstructures and boundaries. The results indicate the feasibility to fabricate high-strength weathering steel components with good tensile properties using gas tungsten arc–based additive manufacturing.
Keywords
Introduction
High-strength weathering steel, containing a small amount of corrosion-resistant elements Cr, has been extensively used in rail traffic, bridge, shipping and marine oil due to its excellent corrosion resistance and high tensile strength in aggressive environments. 1 Currently, to increase material efficiency and decrease production cost, manufacturing monolithic high-strength weathering steel components is a significant trend in these application fields and has been a challenge for further application due to large-scale and high manufacturing cost. Using industrial processing approaches such as casting and forging, acceptable components can be obtained. Nevertheless, high production cost and long manufacturing cycle are the main issues. Especially for highly complex components, these issues are more predominant in conventional manufacturing methods. For example, in the rail traffic field, high-strength weathering steel is the major material of bogies production for high-speed train. At present, the conventional manufacturing process for bogies fabrication is as follows: material casting, plate rolling, plate shearing, assembly, welding and polishing, which is complicated and time-consuming. Thus, there is a strong desire to produce monolithic high-strength weathering steel parts with new and simplified manufacturing techniques.
Additive manufacturing (AM), in which complex, near net-shape parts are fabricated layer upon layer, is becoming an important manufacturing technique in recent years.2,3 It is appealing to build complex and large-size monolithic components. As opposed to traditional subtractive manufacturing, AM is capable of dramatically increasing material usage efficiency and decreasing manufacturing cost, which is regarded as a promising technique for fabricating metal components. In this field, metal foil manufacturing is also an advanced method for composite metal manufacturing.4,5 In AM fusion process using heat producer, a heat source moves along predefined deposition paths and melts the metal wire or powder on the substrate in successive layers to produce components. According to the differences in heat sources, AM techniques can be classified as three groups: laser-based, electron beam–based and arc-based AM. Laser-based AM is suitable to produce components with good surface finish, whereas it requires high investment for large equipment, as presented by Zhao et al. 6 Similarly, high vacuum in electron beam–based AM limits its extensive application, as described by Baufeld et al. 7
Arc-based AM has been demonstrated to be an appealing alternative to fabricate large-scale components thanks to its high deposition rate and low-cost device. 8 Up to now, this technique has been reported in many publications in terms of forming technology, process sensing and control, and metallurgical properties.9–11 For instance, Kazanas et al. 12 investigated the forming technology of geometrical features with positional deposition using gas metal arc (GMA)-based AM and complex thin-walled parts are fabricated. In Karunakaran et al., 13 an approach in which milling process was combined with arc-based AM was proposed to enhance the surface quality of built parts. However, this method will decrease the manufacturing efficiency of components. A passive vision sensor and a closed-loop control system were designed by Xiong and Zhang 14 to improve the stability of deposition height in GMA-based AM. As described in Ma et al., 15 microstructure and mechanical properties of titanium aluminides fabricated in gas tungsten arc (GTA)-based AM was studied, finding that the microstructure and mechanical properties were different in various regions and building directions.
During arc-based AM, deposited layers experience repeated heatings and complex thermal cycles, resulting in complex microstructure variation within one component. With a view to producing parts with excellent quality and reproducibility, it is significant to understand the microstructure evolution and change in mechanical properties within one component. To the best of our knowledge, considerable publications on microstructure and mechanical properties of deposited parts are devoted to titanium and nickel alloys, such as microstructure control and grain refinement of Ti-6Al-4V parts using high-pressure interpass rolling, 16 effect of deposition strategy on microstructure and mechanical properties of manufactured Inconel 625, 17 and tensile properties of fabricated 2219-Al. 18 However, research efforts concerning microstructure and mechanical properties of high-strength steel produced by arc-based AM are extremely scarce. Skiba et al. 19 investigated the microstructure, microhardness, and tensile strength of 300 M steel parts deposited by GTA-based AM, finding that the parts exhibit a bainitic microstructure changing from distinct sheaves to homogeneous from top to bottom and the tensile strength of parts was comparable to that of parts fabricated in cast condition. Fu et al. 20 studied the microstructure and tensile properties of bainite steel produced in GMA-based AM, and a microrolling approach was employed to eliminate the ubiquitous anisotropy. Nevertheless, the effect of location on microstructure and mechanical properties within one high-strength steel part lacks thorough investigation in their work.
In this study, high-strength weathering steel components are fabricated in pulsed GTA-based AM. To understand the effectiveness of GTA-based AM in producing high-strength weathering parts with desired properties, the microstructure and mechanical properties as a function of location and orientation are investigated and analysed in detail, which is the main novelty of this research. Although the effects of deposition rate, 21 inter-layer idle time, 22 pulsed frequency 23 and deposition strategy 17 on microstructure and mechanical properties of additively manufactured metal parts were carried out, little work has been done to the affections of location and orientation on microstructure and mechanical properties of high-strength steel components. Section ‘Experimental procedures’ presents the description of experimental procedures, followed by section ‘Results and discussion’ which depicts results and discussion. The last section ‘Conclusion’ ends the article with some central conclusions.
Experimental procedures
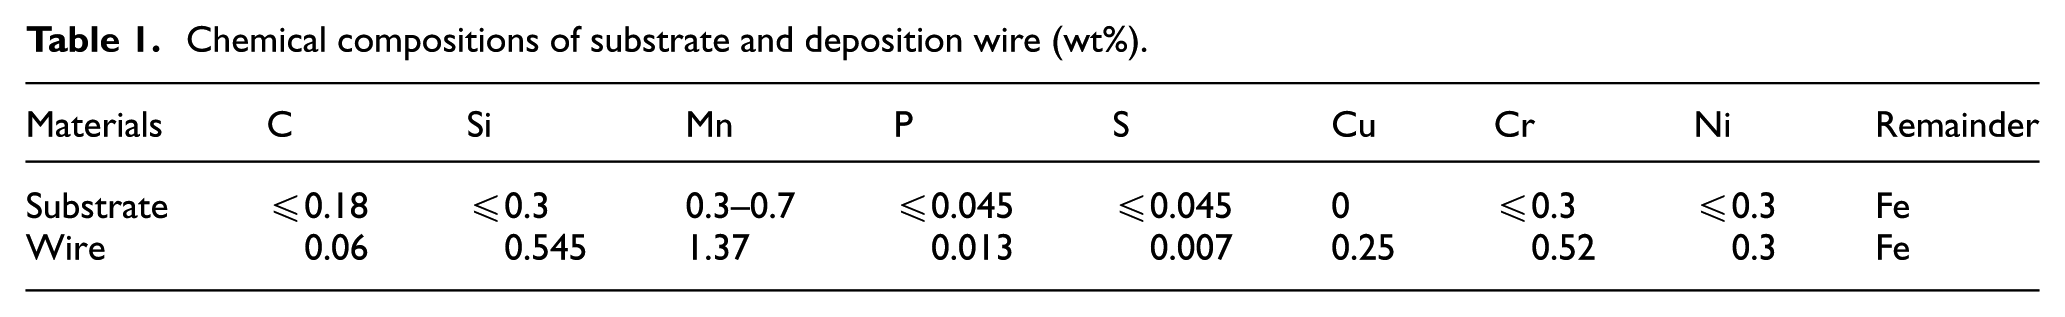
Simple high-strength weathering steel walls were fabricated using pulsed GTA heat source. Compared to the constant GTA, pulsed GTA technology manufactures parts with peak and base current, making it possible to work with peak current without increasing heat input to deposited material. Figure 1(a) shows the schematic description of the experimental system of pulsed GTA AM, which consists of a MagicWave 3000 Job G/F arc welding source, a GTA torch, a wire feeding device and a platform. The moving of the GTA torch was controlled through a six-axis MOTOMAN-MH24 robot. The detailed experimental setup is presented in Figure 1(b). High-strength weathering steel wire (JM-55II) with a diameter of 1.2 mm was used as the filler metal melt by the GTA heat source. The arc was established between a non-consumable tungsten with 3.2 mm diameter and deposited layers. The substrate was Q235B plate with dimensions of 150 mm × 50 mm × 4 mm (length × width × height). The substrate geometry was chosen by comprehensively considering the width and penetration of the deposition layer and the process stability. Table 1 lists the chemical compositions of the substrate and filler wire. Before the deposition process, the substrate was cleaned to remove the grease and oxide by sandpaper and was polished with acetone.
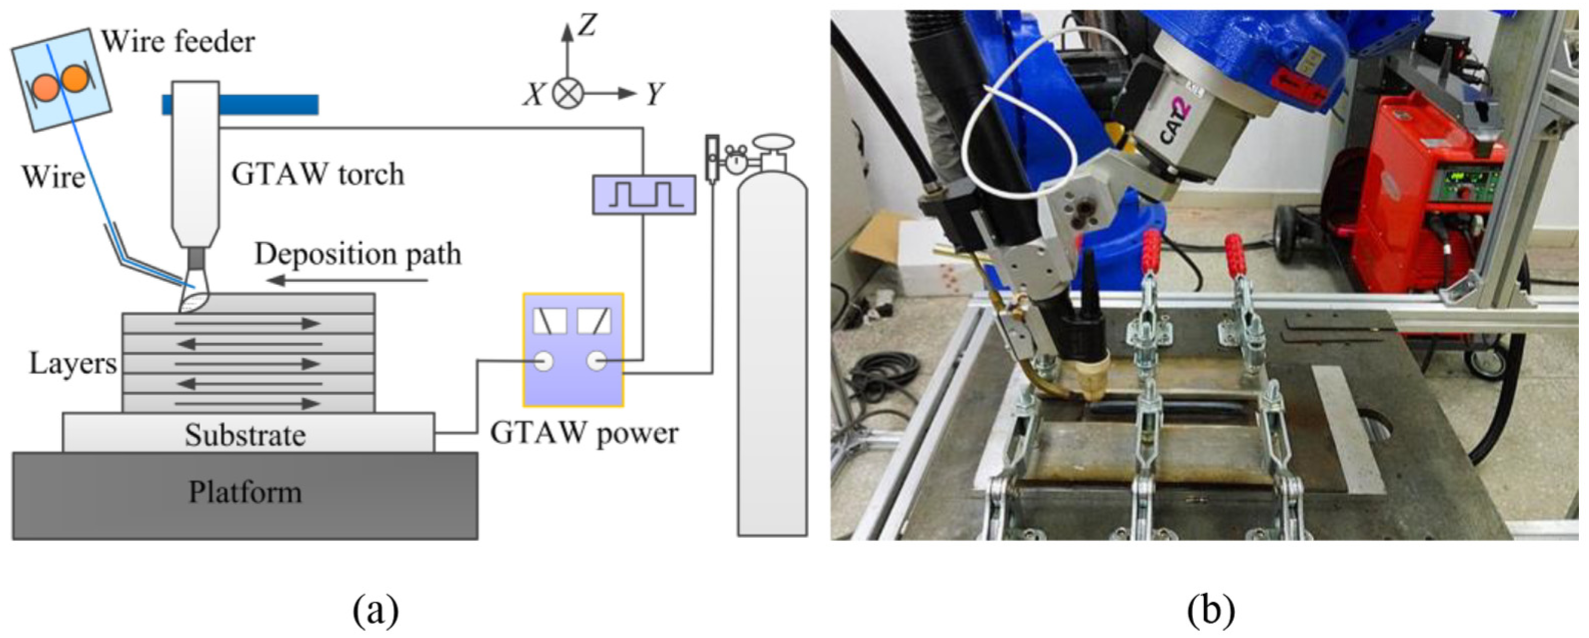
Experimental setup for pulsed GTA AM process: (a) schematic diagram of the experimental setup and (b) detailed experimental setup.
Chemical compositions of substrate and deposition wire (wt%).
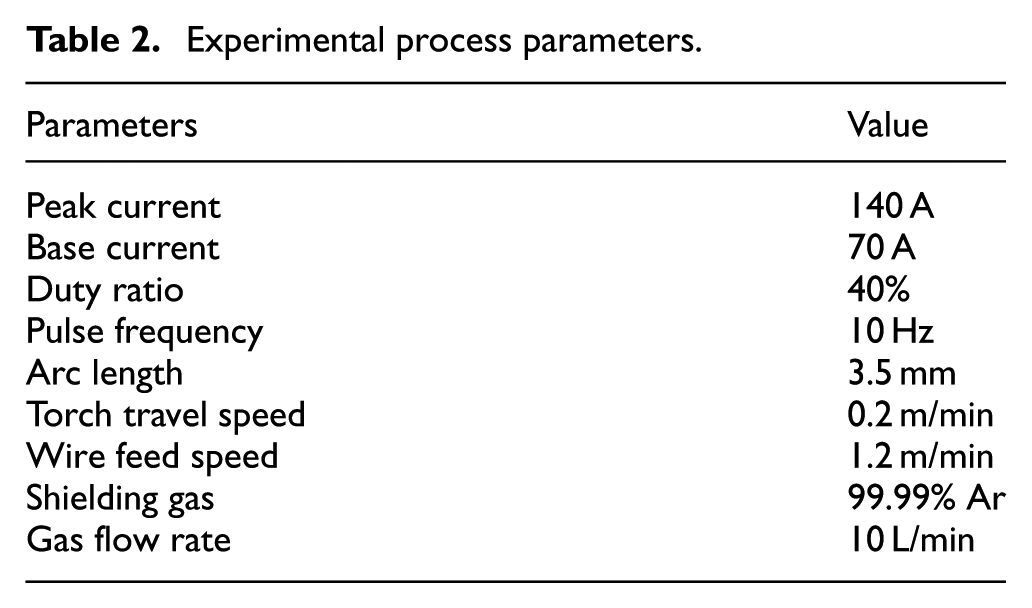
Experimental process parameters for fabricating thin-walled parts are given in Table 2. These process variables were found to be acceptable through preliminary experiments for determining the process window. The angle between the wire feed direction and the substrate plane was approximately 30°. Front feeding, in which the filler metal was fed in front of the heat source along the deposition path direction, was applied for a higher deposition rate. The wire was fed into the head of molten pool and rapidly solidified on the substrate or previous layers. As one layer was deposited, the GTA torch was made an ascent along the Z-axis. Because the experiments were performed by depositing small-size walls in our lab, a suitable inter-layer idle time should be set to prevent serious heat accumulation and even molten pool overflow. Thus, an inter-layer time interval of 300 s was performed between two consecutive layers. Furthermore, the deposition path direction of the current layer was set opposite to that of the previous layer in order to improve the forming quality of the samples. Three-dimensional walls were fabricated through a layer by layer manner.
Experimental process parameters.
As shown in Figure 2, the fabricated thin-walled parts typically have a length of 140 mm, and two build heights of 15 and 49 mm were utilized for different testing requirements, that is, metallographic analysis and mechanical properties. As presented in Figure 2(a), X-axis is the deposition width direction, Y-axis is the travel direction, and Z-axis is the deposition height direction. The part shown in Figure 2(a) was wire-cut along the deposition width direction (X) to obtain required specimens in cross-section (X–Z plane). Similarly, the part was also wire-cut along the travel direction (Y) to intercept longitudinal section (Y–Z plane). The metallographic specimens were first polished with sand papers and then etched with a mixed solution of 4 vol% nitric acid and 96 vol% alcohol. The microstructure of cross-section parts was analysed by optical microscopy (Axio Observer A1m) and scanning electron microscopy (QUANTA FEG 250).
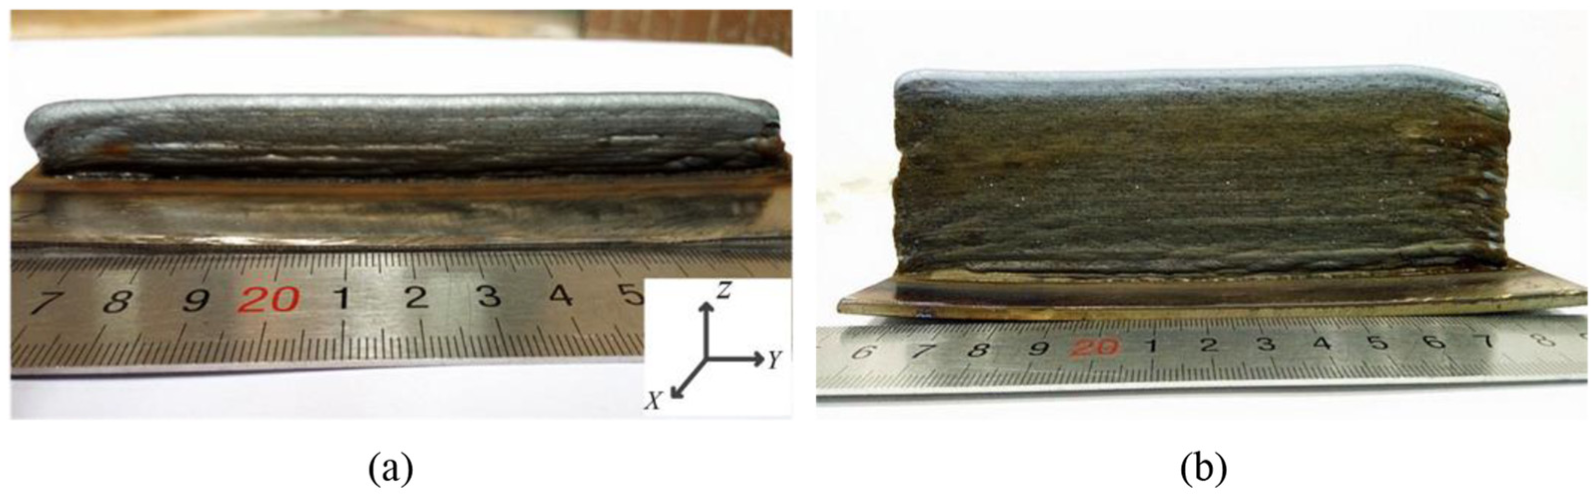
Examples of thin-walled parts: (a) thin wall with 15 mm in height and (b) thin wall with 49 mm in height.
Vickers microhardness testing of the part shown in Figure 2(a) was measured at a load of 98 N with a dwell time of 10 s by a Vickers hardness machine (HVS-30). To investigate distribution characteristics of the microhardness in different regions, the indentations were carried out from the intersection between the substrate and deposited layers and were performed along the vertical centerline parallel to the deposition height direction (Z) in cross-section (X–Z plane), as presented in Figure 3(a). Microhardness in the deposition width direction (X) perpendicular to the vertical centerline was also determined in the near-substrate, middle and top regions. Moreover, microhardness testing was also performed parallel to the travel direction (Y) in longitudinal section (Y–Z plane). The orientations and locations of the indentations are presented in Figure 3(b). All indentations in Figure 3 were measured with an interval of 0.5 mm. Furthermore, the microhardness of each point was determined for three times.
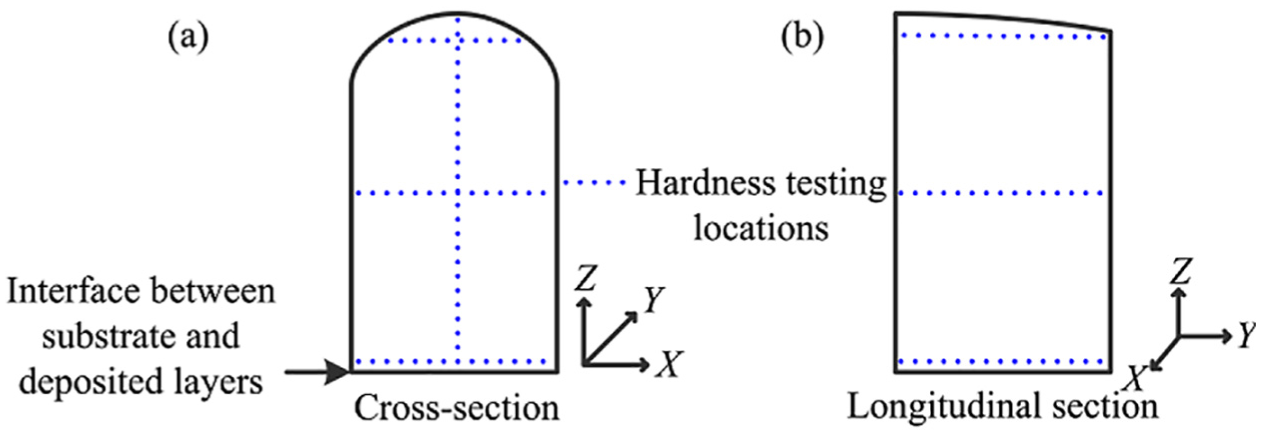
Schematic description of testing location of microhardness in different regions: (a) cross-section (X–Z plane) and (b) longitudinal section (Y–Z plane).
Tensile properties at room temperature of the deposited walls were measured in both the deposition height direction (Z) and travel direction (Y). Figure 4 gives the location, direction, section shape and geometrical size of the testing specimens. At first, the tensile properties between the travel direction (Y) and deposition height direction (Z) were compared. The locations of specimens are in the middle region of the wall, as shown in Figure 4(a). The tensile specimens in each orientation were prepared for three times. Second, to reveal the nonuniform tensile properties within the deposited part, tensile specimens were prepared in the travel direction (Y) from the near-substrate region to the top region with an interval about 10 mm, as indicated in Figure 4(c) and (d). To reduce experimental errors, the tensile specimens in the same layer were prepared for three times in the travel direction (Y), and the tensile testing values were averaged. To study the mechanical properties as a function of location and orientation in detail, especially as shown in Figure 4(d), we must design a new and small dimension of tensile specimens due to a small width of the thin-walled part presented in Figure 2(b). Thus, the geometrical size of the tensile specimens was designed according to the standard of GB/T228-2002 in China; however, the width was set at a relatively small value. Based on the testing standard of GB/T228-2002, room temperature testing was conducted using an electronic universal testing machine (CMT4304) at an extension rate of 0.5 mm/min.
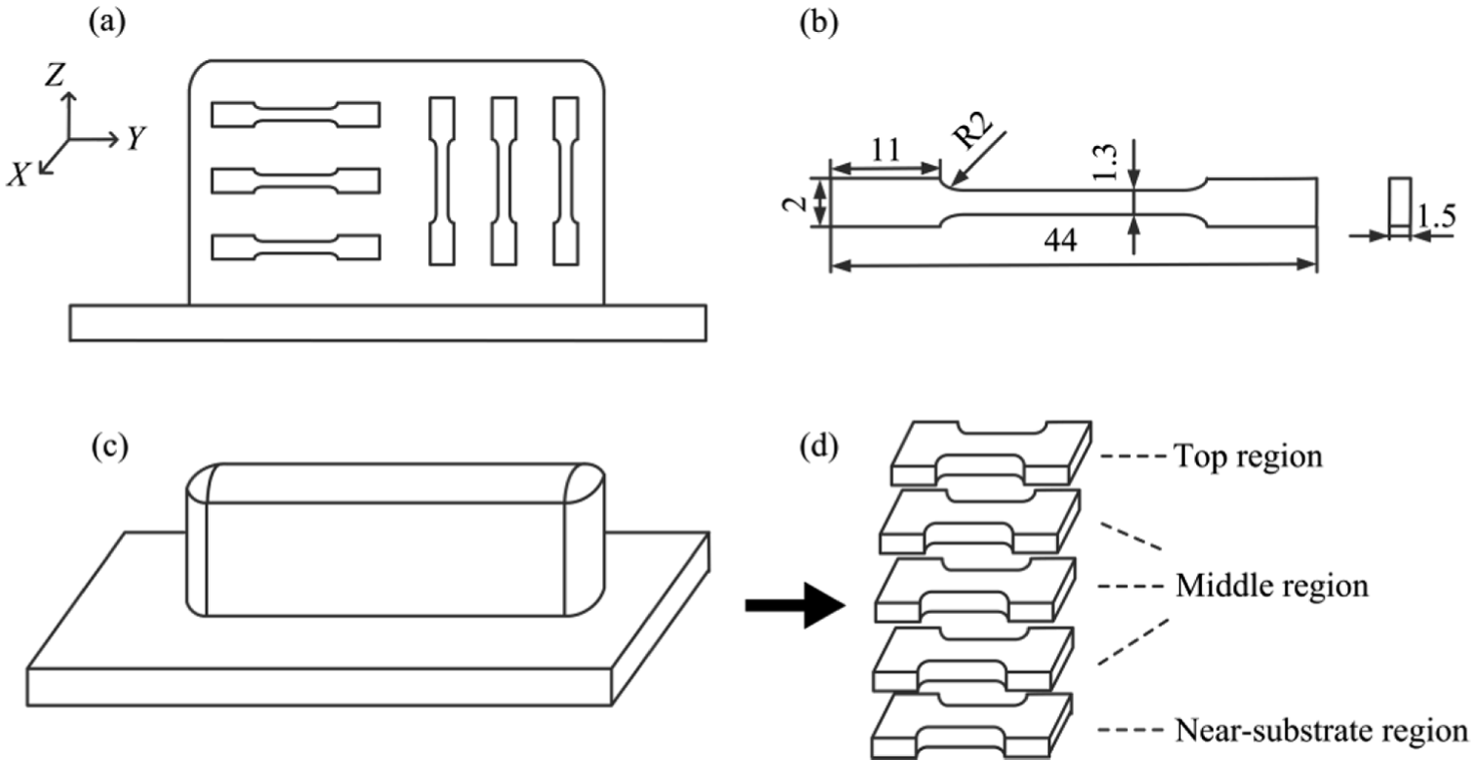
Schematic configuration of specimen orientations and dimensions of room temperature tensile tests: (a) position of tensile specimens, (b) dimension of tensile specimens in mm, (c) deposited wall and (d) tensile specimens in different areas.
Results and discussion
Morphology and microstructure
Figure 5 shows the typical macrostructure of a cross-section (X–Z plane) in the deposited wall. It is seen that fusions in adjacent layers are excellent and no obvious defects can be observed. The deposited widths in the first several layers are small, and those in the middle and top layers are large. The reason is that the substrate is at a lower temperature as the first several layers are deposited. Heats in the molten pool can be passed through the substrate quickly due to a short heat transmitting path, and the molten pool solidifies easily. When fabricating the middle and top layers, the main heat conduction direction is from up to down, 6 and the path of heat transmitting to the substrate increases, resulting in an increased heat accumulation of the molten pool. 24 Thus, the widths in the middle and top layers are larger than those in the near-substrate region. Based on different microstructure changes in Figure 5, the cross-section (X–Z plane) can be classified as three regions, that is, top region, middle region and near-substrate region.
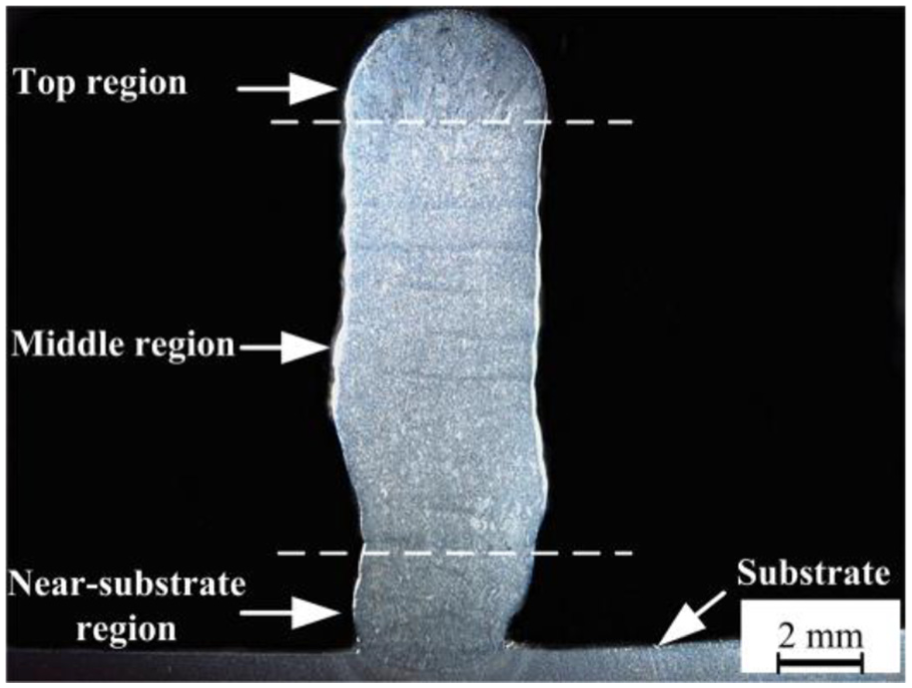
Macrostructure of cross-section of the manufactured part.
The microstructure in the top region is shown in Figure 6. It displays strong columnar grains oriented upwards, as presented in Figure 6(a). The columnar grains are inclined along the steepest temperature gradient during the deposition process. As described in Zhao et al., 6 the main heat conduction direction is from up to down. The serious heat accumulation in the top layer is beneficial to the growth of columnar grains. Moreover, the top layer is not subjected to subsequent heat effects. Thus, columnar grains are easy to be generated in the top layer.
Microstructure at the top region: (a) low magnification and (b) high magnification.
It can be seen in Figure 6(a) that the grain size in the bottom is apparently smaller than that in the top. In the bottom of the top region, the temperature of the previously deposited layer reaches just above the Ac1 line, that is, the austenitic region. In this region, fine austenitic grains are produced during the heating cycle, and they change to fine pearlite grain structure when cooling below the eutectoid temperature. Figure 6(b) shows the microstructure of the coarse column grains presented in Figure 6(a). Bulk and fine proeutectoid ferrite are distributed along the grain boundary of the columnar grains. The side plate ferrites grow along the grain boundary and their growth direction are almost parallel within the columnar grains. Acicular ferrite and a small amount of pearlite are presented in the columnar grains.
Figure 7 presents the microstructure in the middle region of the deposited wall. The microstructure exhibits equiaxed grains consisting of ferrite and pearlite. During the layer upon layer deposition process, one layer will experience heat treatments similar to normalizing effects from subsequent layers. In the middle region, depending upon the location, metal from the previous layer will undergo remelting, full and partial austenization, and heating to a temperature below the austenitizing temperature.
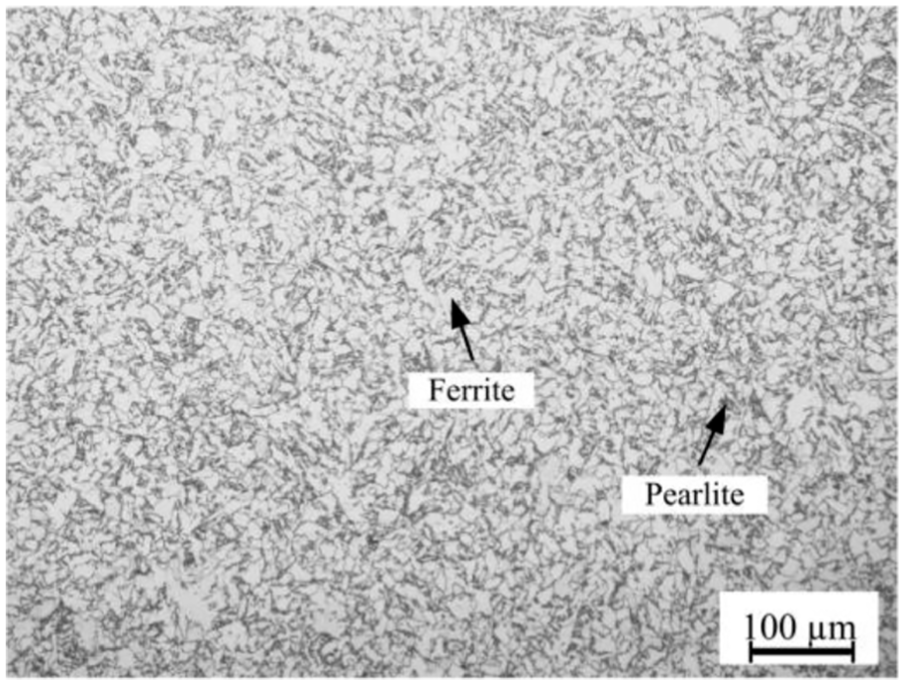
Microstructure at the middle region.
During depositing the middle region, a slow cooling rate and a small undercooling can be generated due to massive heat accumulation, leading to a small driving force of phase transformation between the new and parent phase. However, pearlitic transformation belongs to a typical diffusion transformation and can be produced at high temperatures, and the iron and carbon atoms in overcooling austenite can easily diffuse at a long distance due to the high transition temperature of pearlite. 25 Meanwhile, pearlite mainly nucleates at the grain boundary and needs less driving force. Therefore, the microstructure shown in Figure 7 exhibits pearlite transformation. In addition, the deposition material is hypoeutectoid steel. The bulk proeutectoid ferrite precipitates before the pearlite transformation.
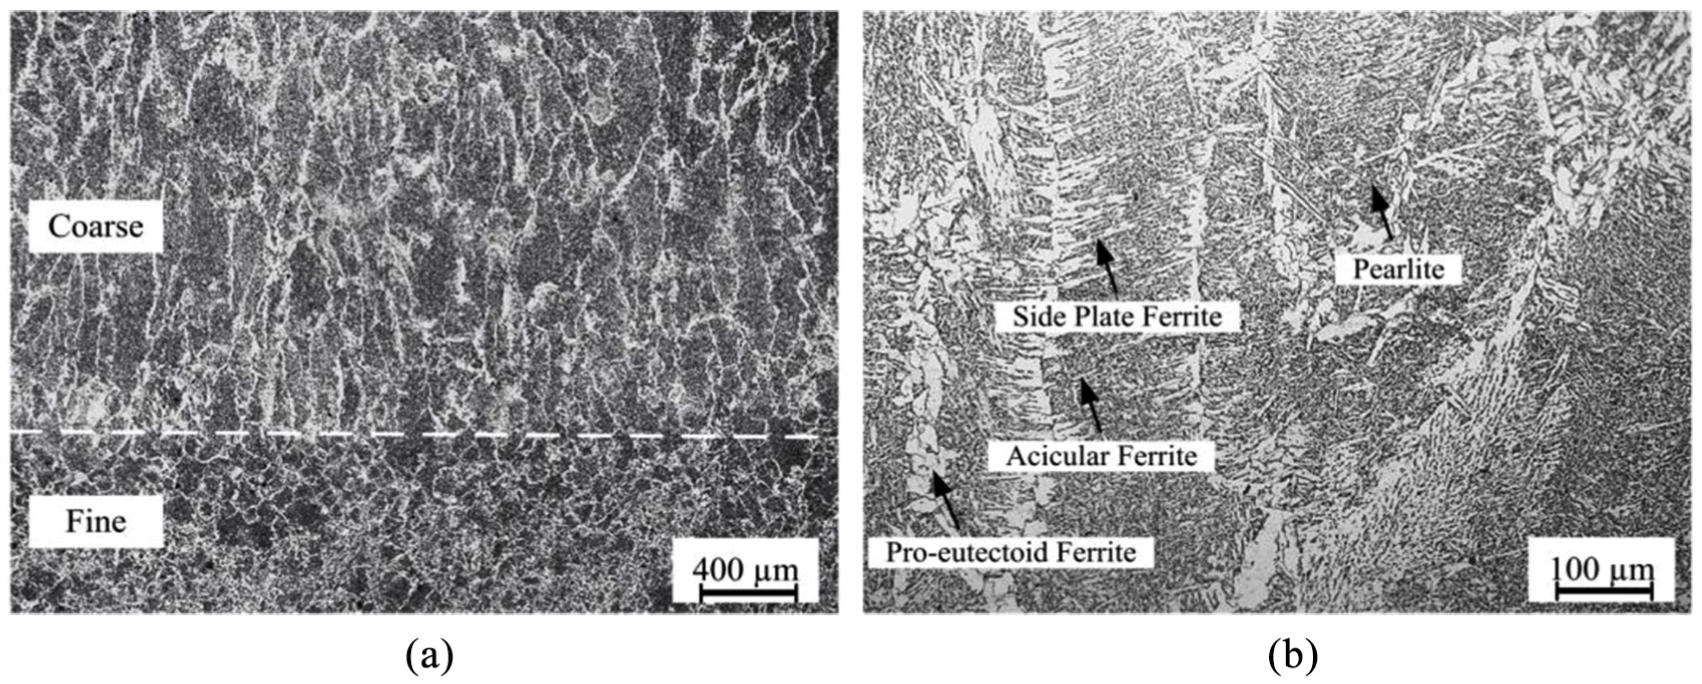
White parallel bands can be clearly seen in the middle region of the deposited layers, as presented in Figure 8(a). Figure 8(b) shows the microstructure of layer bands observed by scanning electron microscopy (SEM). The layer bands exhibit ferrite and a small amount of pearlite. As seen in Figure 8(a), the average grain size of ferrite in the layer bands is apparently larger than that in both sides of the layer bands.
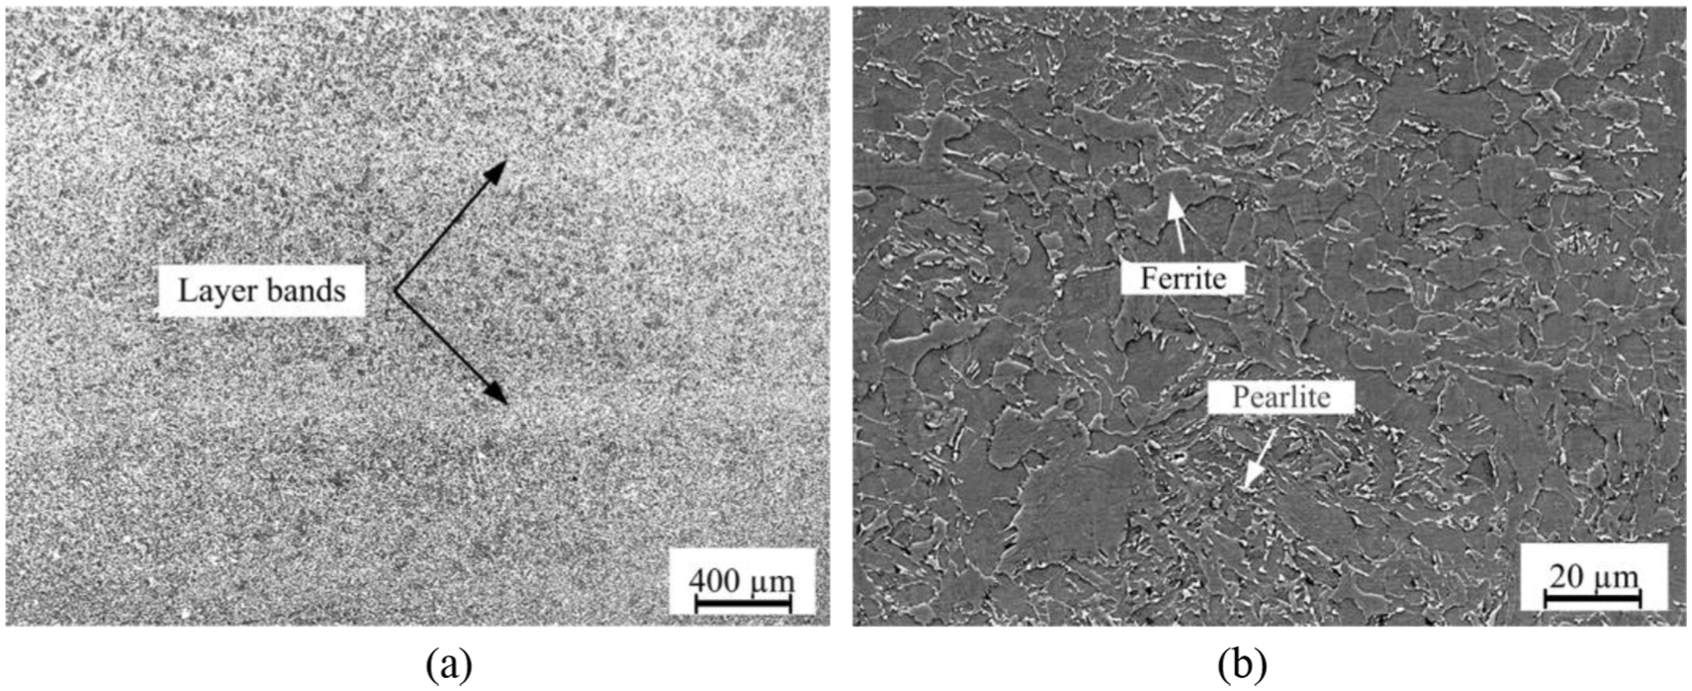
Microstructure of layer bands in the middle region: (a) low magnification by optical microscopy and (b) high magnification by SEM.
Figure 9 shows the schematic diagram of forming mechanism for the layer bands. When depositing the (n + 1)th layer, the microstructure in the top of the nth layer is remelted, while the rest which is not remelted in the nth layer will experience the heat effect by the heat source of the (n + 1)th layer. The unmelted microstructure close to the molten pool is heated to a high austenization temperature over 1100 °C 25 and is in over-heating state, resulting in the serious growth of austenite grains. As cooling to room temperature, the over-heating microstructure presents large grain size. However, the unmelted microstructure in the nth layer away from the molten pool is subjected to the low temperature austenization in various degrees. Therefore, the microstructure recrystallization is produced, and the grain sizes of the ferrite and pearlite are further refined, forming fine equiaxed grains. As the deposition process proceeds, the above procedure is repeated, thus exhibiting the phenomenon of fine grains on both sides and coarse grains in the layer bands. When fabricating subsequent layers, a layer band can be generated at interval of a certain distance. The production of the layer bands results from the partial remelting and complex thermal effect, which is a special characteristic in GTA-based AM. This feature can also be observed in GTA-based additively manufactured titanium and aluminium alloys.7,18
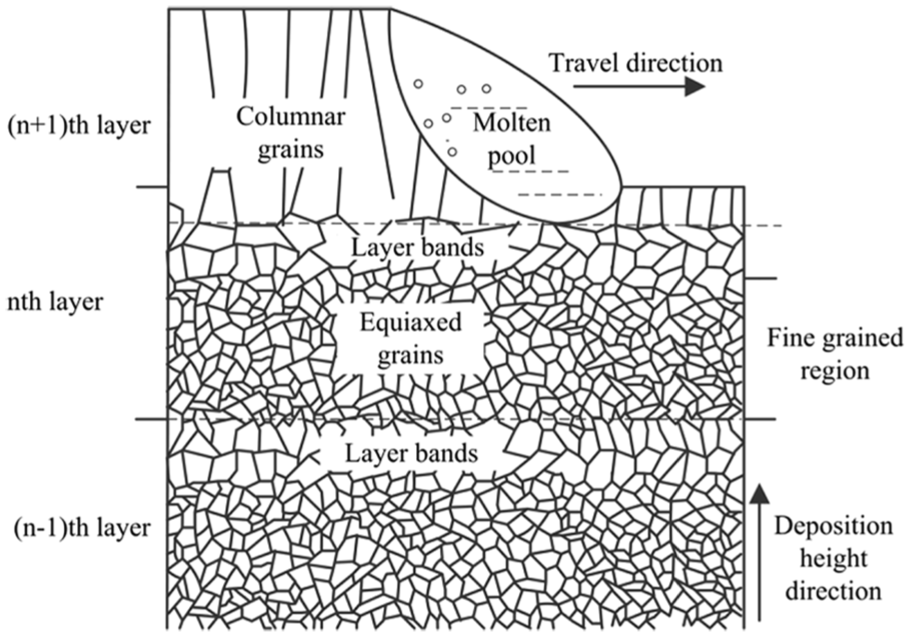
Schematic diagram of forming mechanism for layer bands.
The microstructure in the near-substrate region is shown in Figure 10. The average size of this region displaying columnar grain appearance is apparently smaller than that in the top region. The microstructure in the near-substrate region is composed of massive ferrite, acicular ferrite, grain bainite and a spot of pearlites. During the multi-layer deposition process, the disappearance degree of columnar grains is dependent on the heating temperature and time. The columnar grains that are disrupted seriously are associated with the increased heating temperature and time. Although the microstructure in the near-substrate region also experiences heating effects from subsequent layers, the cooling rates of the deposited layers near the substrate are rapid due to the excellent heat conduction condition. Consequently, the near-substrate region exhibits columnar grains.
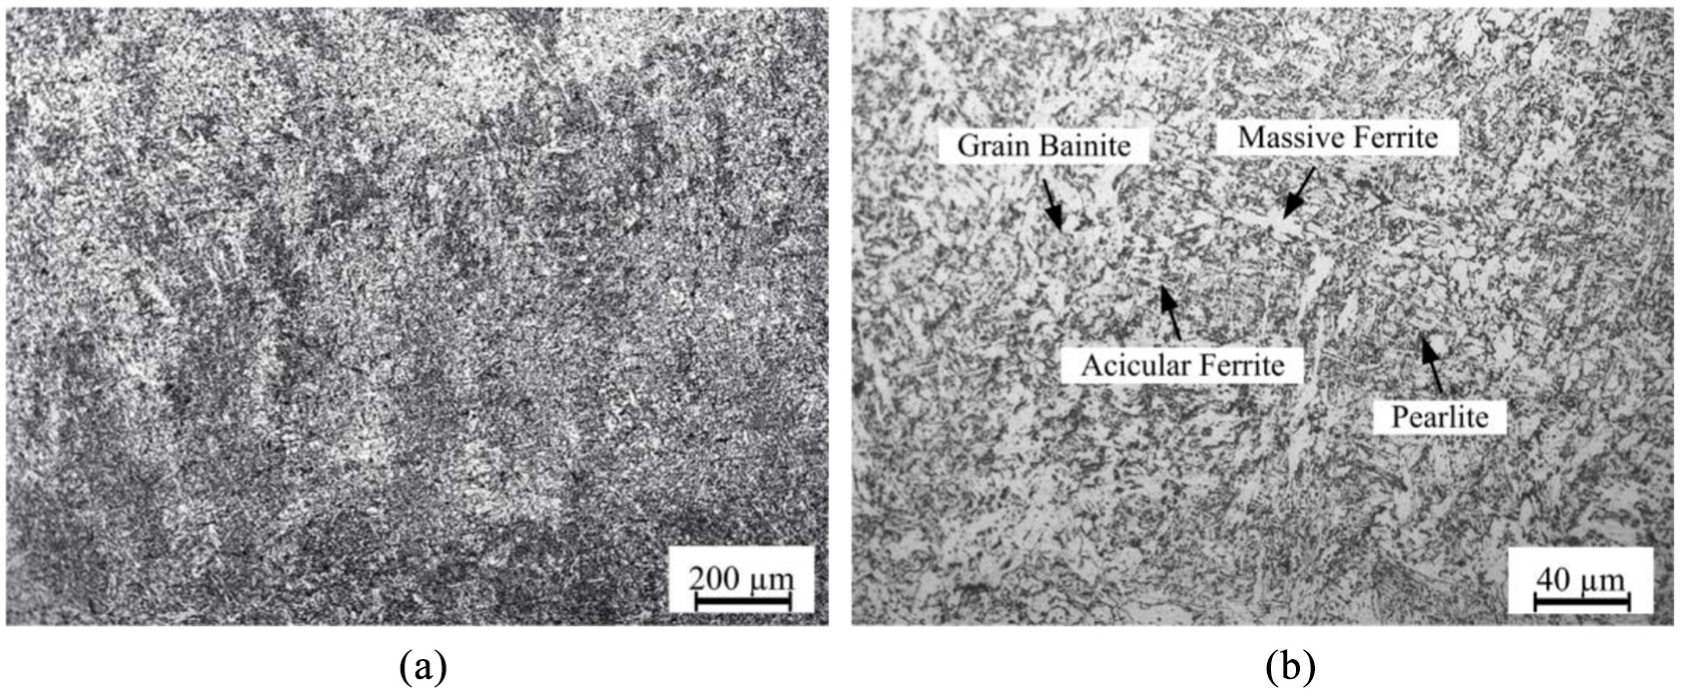
Microstructure in the near-substrate region: (a) low magnification and (b) high magnification.
Hardness measurements
Microhardness values at various locations are presented in Figure 11, and the schematic description of testing location of microhardness in different regions is displayed in Figure 3. Figure 11(a) shows the microhardness profile along the deposition height direction (Z) in cross-section (X–Z plane) part. The microhardness ranging from 170 to 220 HV appears to be inhomogeneous in various regions and the plot curve presents ‘U shape’. The top and near-substrate regions are much harder than the middle region. Figure 11(b) shows the microhardness values along the deposition width direction (X) in cross-section (X–Z plane) part, and Figure 11(c) gives those along the travel direction (Y) in longitudinal section (Y–Z plane) part. It can be seen in Figure 11(b) and (c) that microhardness values in three regions are distributed relatively homogeneous. Along the deposition width direction (X), microhardness in the top region ranges from 212 to 216 HV, and that in the near-substrate region varies from 182 to 187 HV. Along the travel direction (Y), the microhardness in the top region ranges from 209 to 220 HV and changes from 192 to 204 HV in the near-substrate region.
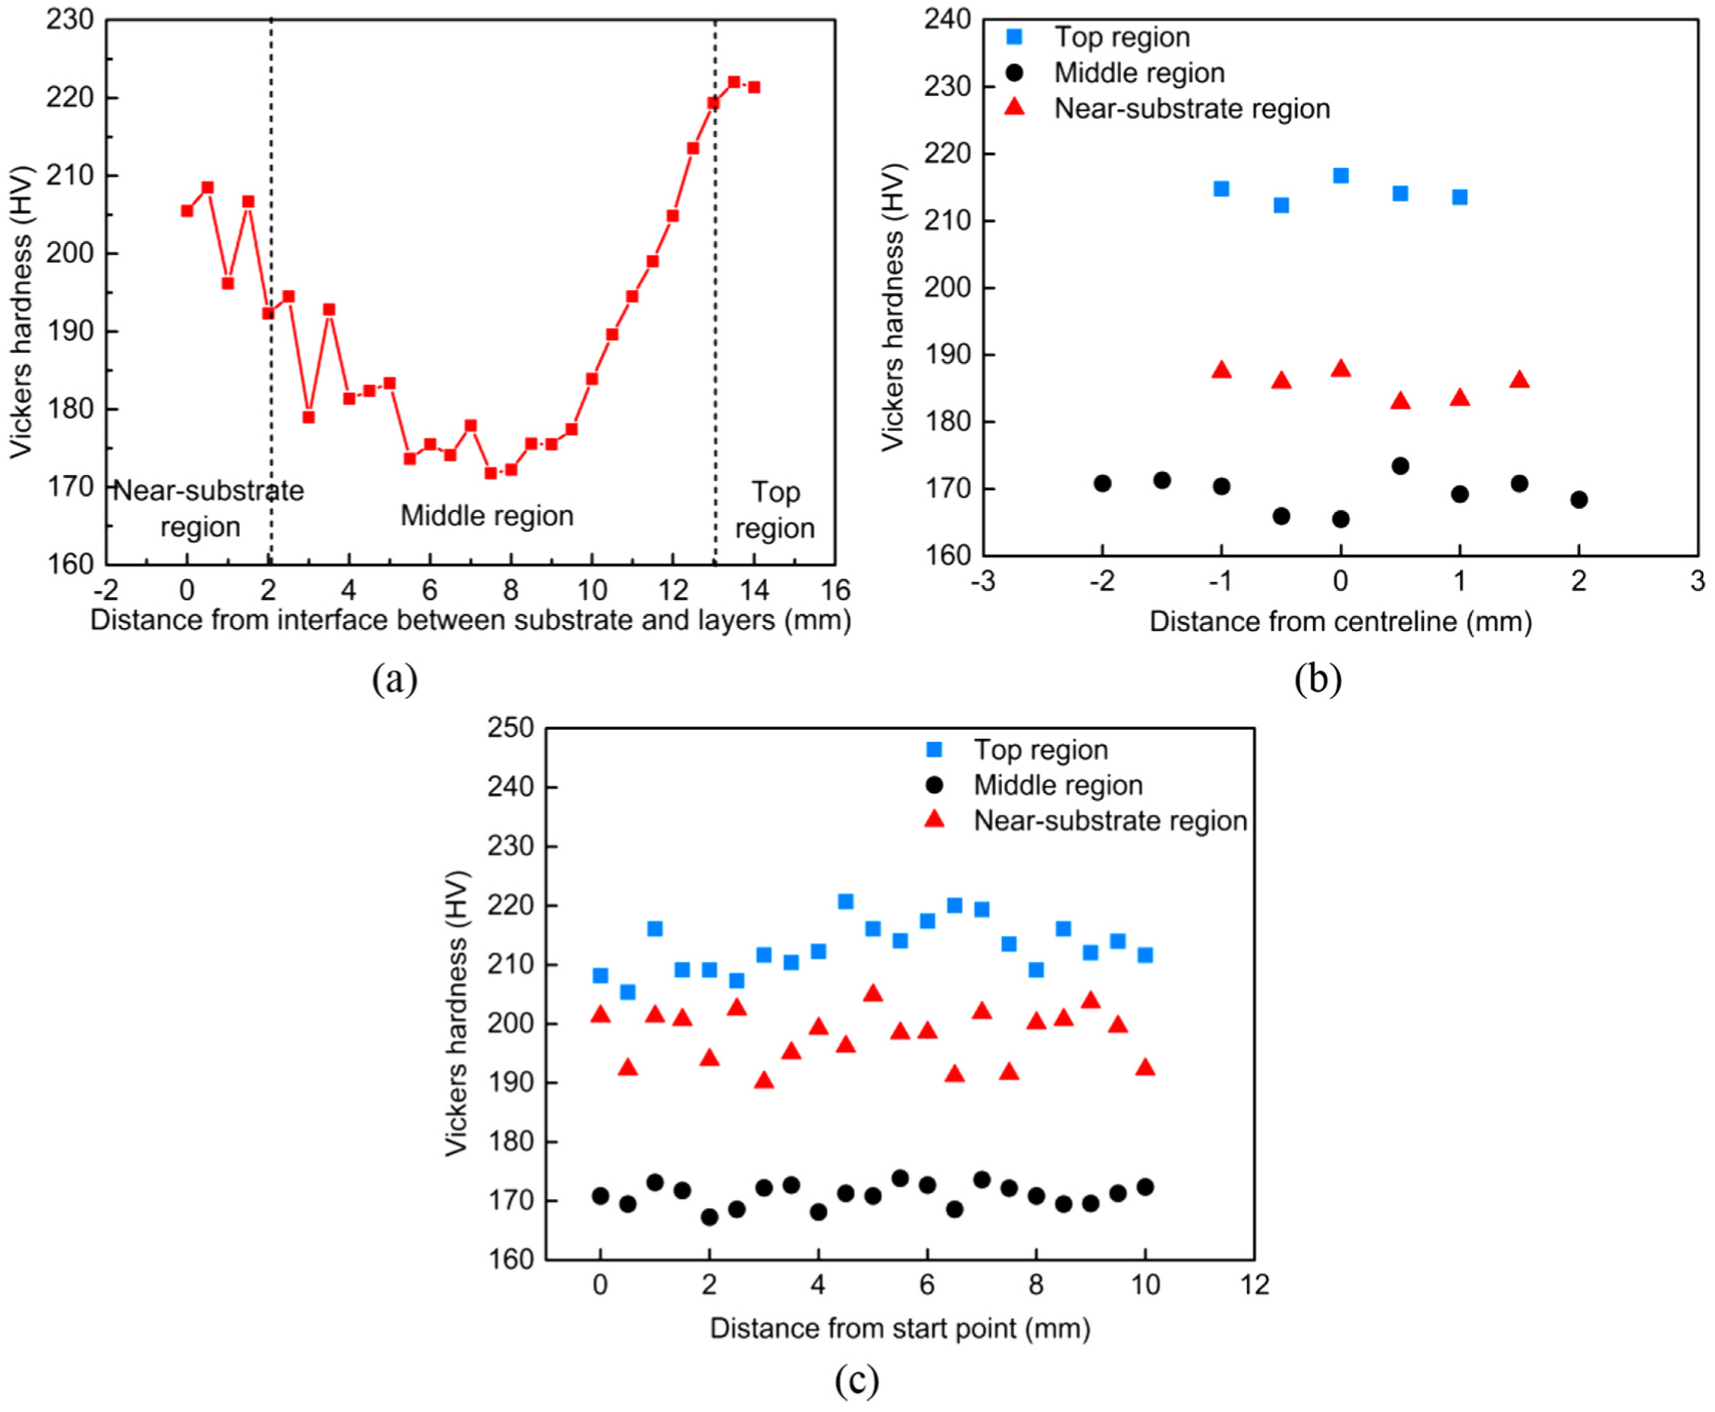
Microhardness distribution as a function of location in cross-section (X–Z plane) and longitudinal section (Y–Z plane): (a) microhardness distribution along the travel direction (Y) in cross-section (X–Z plane), (b) microhardness distribution along the deposition width direction (X) in cross-section (X–Z plane) and (c) microhardness distribution along the travel direction (Y) in longitudinal section (Y–Z plane).
Based on the microstructure analysis in section ‘Morphology and microstructure’, the near-substrate region retains a certain columnar grain morphology. There exist many high-density dislocation intersections and tangles in the acicular ferrite, and the number of dislocations increases in the grain boundaries as the plastic deformation occurs, leading to an increased metallic plastic deformation resistance and a relatively higher hardness. Furthermore, the microstructure in the near-substrate region includes lots of granular bainites which also display high microhardness. In the middle region, each layer is subjected to repeated heat treatment effects similar to normalizing, giving rise to a certain softening in the microstructure. In addition, the grain size in partial area becomes coarse, as shown in Figure 9. According to the plastic deformation theory, keeping the part volume constant, the number of grains, the volume fraction of grain boundaries and the dislocation obstacles decrease with the increasing grain size, resulting in the decreased metallic plastic deformation resistance and microhardness. In the top region, the microstructure consisting of granular bainite and acicular ferrite presents hardness without the heating effects from subsequent layers.
Tensile properties
Figure 12 shows the room temperature tensile properties of the walls in the deposition height direction (Z) and travel direction (Y). Three test specimens were applied for each direction, as displayed in Figure 4(a), and the error bar is given in Figure 11(a). Even three same positions for each direction are obtained by fabricating three walls deposited with same process parameters, and the tensile strength results are impossible to be the same due to inevitable measuring error from machining accuracy of specimens or electronic universal testing machine. It is shown that the ultimate tensile strength of deposited layers in the travel direction (Y) is slightly larger than that in the deposition height direction (Z). The average elongation in the travel direction (Y) is 34.67%, and that in the deposition height direction (Z) is decreased by 4.45%.
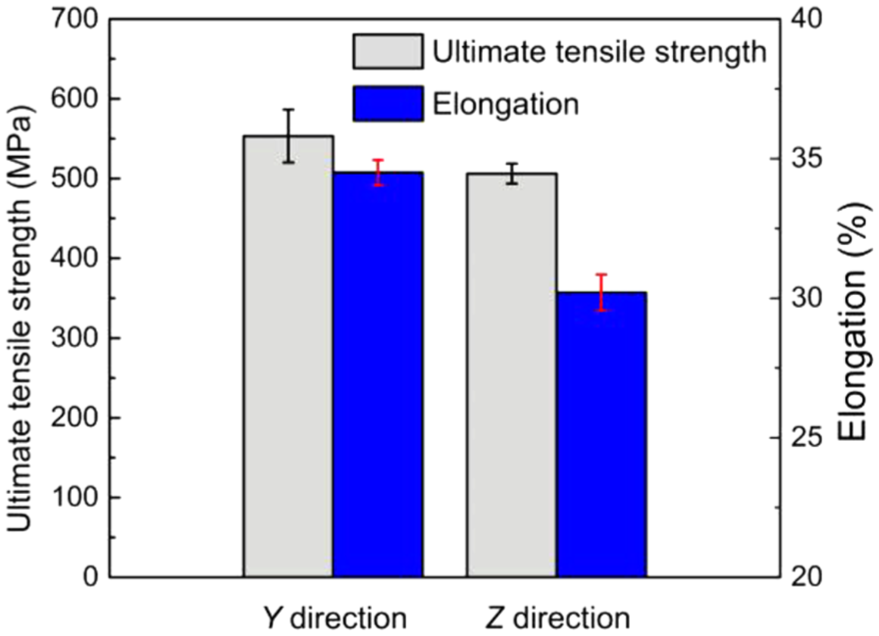
Comparisons of ultimate tensile strength and elongation in the deposition height direction (Z) and travel direction (Y).
To reveal the mechanical properties in various regions within one component, three test specimens in different areas were also employed to evaluate the influence of vertical location on the mechanical properties determined in the travel direction (Y), as shown in Figure 13. The top region displays the highest ultimate tensile strength and the lowest elongation, whereas the middle region exhibits the lowest ultimate tensile strength and the highest elongation. The ultimate tensile strengths and elongations at various locations in the middle region are almost identical, thanks to similar microstructure. The values of ultimate tensile strength and elongation span 558.5–578.9 MPa and 31.7–33.9%, respectively. The average ultimate tensile strength and elongation of the three locations are approximately 568.9 MPa and 33.0%, respectively.
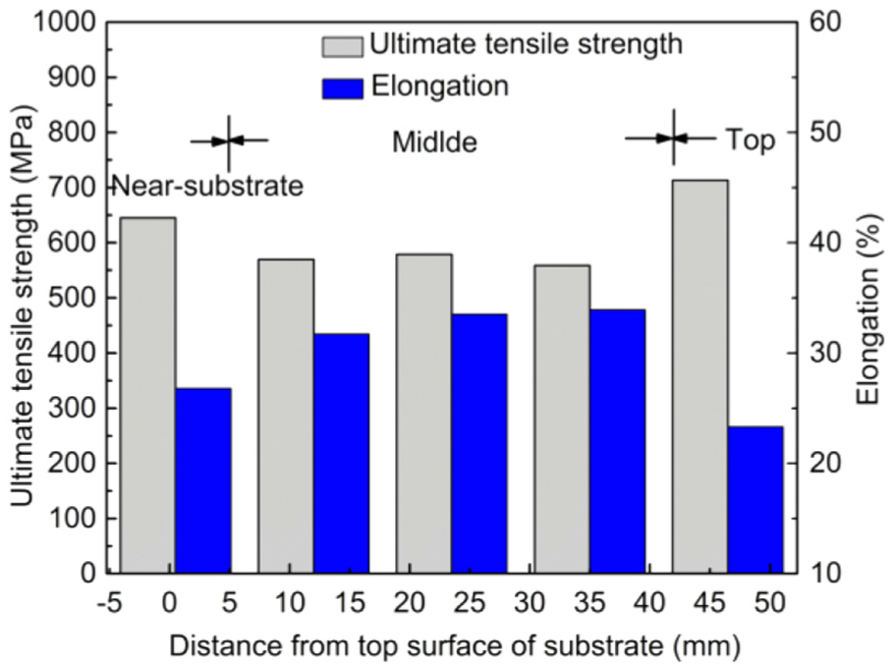
Influence of vertical location on ultimate tensile strength and elongation in various regions.
In general, the tensile properties can be affected by a series of factors, such as alloying elements, precipitates, grain size and grain boundary. 26 In this study, crack nucleation tends to occur at more interfaces of adjacent layer microstructure, giving rise to poorer tensile strength in the deposition height direction (Z) than that in the travel direction (Y). Considering the influence of vertical location on the tensile strength in the travel direction (Y), the columnar grain sizes in the top and near-substrate regions are larger than equiaxed grain size in the middle region. However, the tensile strength in the middle region is lowest. Normally, larger grains show poorer strength thanks to the decreased number of grain boundaries or dislocations in the grain. As mentioned in section ‘Morphology and microstructure’, the microstructure including granular bainite and acicular ferrite in the top and near-substrate regions is beneficial to improving the tensile strength. In addition, coarse columnar grains in the top and near-substrate regions result in a bad plasticity, and equiaxed grains with ferrite and pearlite microstructure in the middle region exhibit lower tensile strength and superior elongation.
The tensile strength of additively manufactured high-strength weathering steel ranges from 506 to 578.9 MPa, which is slightly lower than that of the deposition wire with a maximum tensile strength of 590 MPa. However, the minimum requirement for forged bogie plates (SMA490BW) reaches to 490 MPa. In order to obtain better tensile properties, more work will be dedicated to study the effects of process parameters on the tensile properties of components in future.
Representative fracture surfaces of the tensile specimens in the travel direction (Y) and deposition height direction (Z), as described in Figure 12, are given in Figure 14. Obvious necking can be observed in Figure 14(a). The fracture surface is composed of shear lip, radiation area and fibre area, as shown in Figure 14(b). Intensive equiaxed dimples can be seen in the fracture surfaces both in the travel direction (Y) and in the deposition height direction (Z), and there are apparent thin tearing ridges around the dimples, showing representative ductile fracture characteristics, as presented in Figure 14(c) and (d).
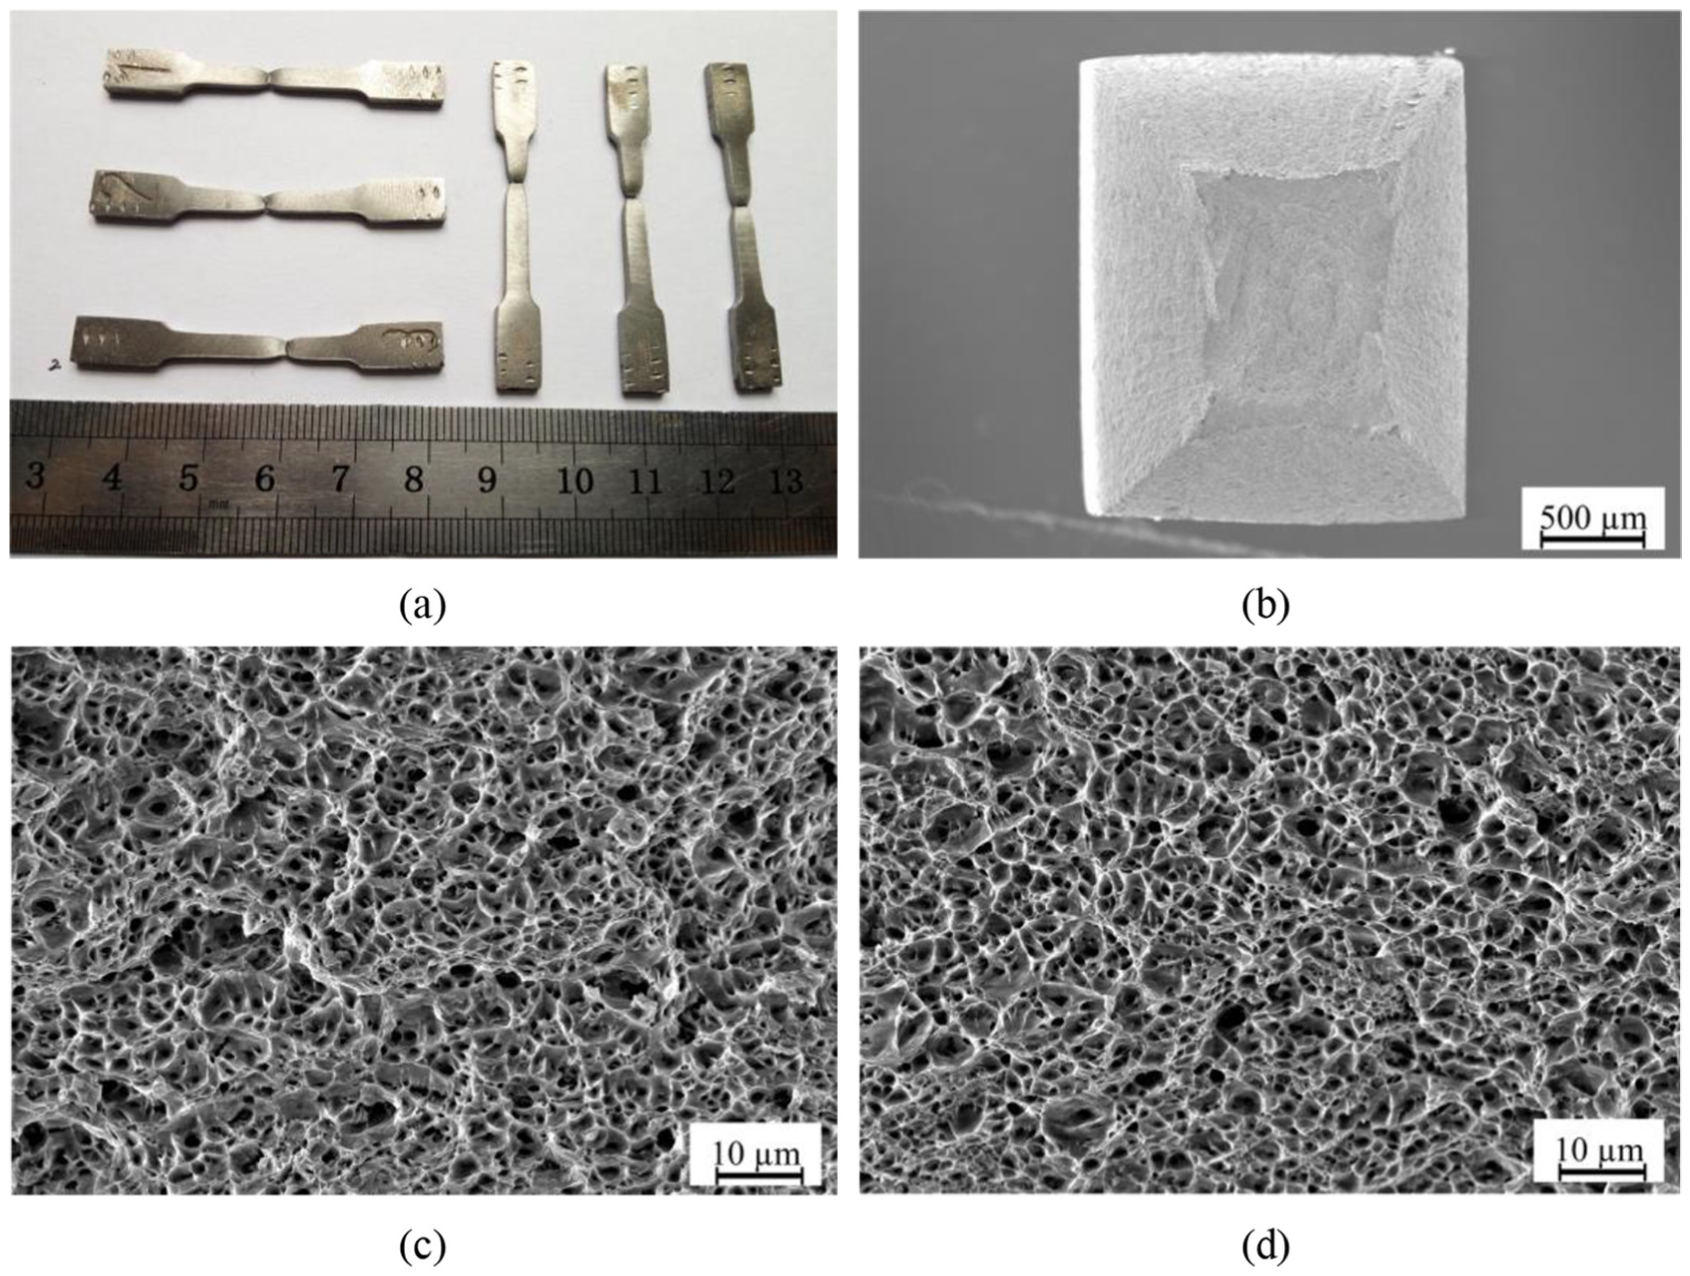
SEM fracture morphology of the tensile specimens in travel direction (Y) and deposition height direction (Z): (a) cracked tensile specimens, (b) fracture morphology, (c) SEM fracture morphology in travel direction (Y) and (d) SEM fracture morphology in deposition height direction (Z).
During the tensile tests, dislocation gathering is easy to be formed at the grain boundary and second phase, resulting in the stress concentration. Furthermore, stress concentration can provoke the initiation and growth of microporous structures, giving rise to the necking and fracture of the tensile specimens.
Conclusion
In this study, high-strength weathering steel components are fabricated by AM using GTA. The morphology, microstructure and mechanical properties in various locations of additively manufactured high-strength weathering steel walls are investigated in detail. The major conclusions can be drawn as follows:
Thin-walled high-strength weathering steel parts have been produced in pulsed GTA-based AM by adding high-strength weathering wire. No obvious defects, such as pores and cracks, can be observed in the macrography.
Based on microstructure characteristics, the deposited thin walls can be divided into three regions, that is, the top, middle and near-substrate regions. The top region exhibits columnar grain morphology, consisting of proeutectoid ferrite, lath ferrite, acicular ferrite and a spot of pearlite. The middle region subjected to repeated heating effects from subsequent layers presents equiaxed grains with ferrite and pearlite. Due to a high cooling rate and a short holding time at high temperature, the near-substrate region retains columnar grains, and the microstructure in this area is similar to that in the top region. Particularly, obvious layer bands can be formed in the middle region.
Microhardness profile along the deposition height direction of the cross-section exhibits ‘U shape’ distribution, ranging from 170 to 220 HV. Microhardness values in the top and near-substrate regions are higher than those in the middle region. Along the travel and deposition width directions, microhardness distributions are uniform in various regions.
The mechanical properties show heterogeneity in different building directions, and the ultimate tensile strength in the travel direction is superior to that in the deposition height direction. The effect of vertical location on the ultimate tensile strength in the travel direction shows that the ultimate tensile strength in the top region is highest, next the near-substrate region and then the middle region.
Footnotes
Declaration of conflicting interests
The author(s) declared no potential conflicts of interest with respect to the research, authorship and/or publication of this article.
Funding
The author(s) disclosed receipt of the following financial support for the research, authorship, and/or publication of this article: This work was funded by the National Natural Science Foundation of China (No. 51505394 and No. 61573293) and National Key Research and Development Program (No. 2018YFB1105804).