
Abstract
Laser additive manufacturing processes melt the powder particles using laser beam energy to form solid three-dimensional objects. This article mainly focuses on numerical analysis and experimentation of laser melting of commercially pure titanium powder. Numerical solutions to moving heat source problems were developed, and their influences on process parameters were validated. The energy density has a significant role in laser melting process. The numerical investigation demonstrates the significant effect of laser energy density on laser tracks. The laser power, distribution of powder particles, the absorptivity, density, and chemical constitution of powder materials are the main factors which influence the laser energy penetration. The absorptivity plays a vital role in consolidation phenomena of the powder layer which helps to get a denser part or layer. The experimental result clearly indicates that at lower laser speed the powder compaction is better. Temperature distribution, depth, and width of laser track were compared in this article. By investigating the observations from optical microscopic images and scanning electron microscopic images, the surface characteristics of laser-melted tracks were studied. The study on numerical and experimental results shows that the optimum condition for better laser track is laser power 45 W, laser speed 20 mm/s, and laser diameter 2.5 mm. This study provides important insights into laser parameters in the melting of commercially pure titanium powder.
Keywords
Introduction
Due to high strength to weight ratio, excellent formability and resistance to corrosion, the commercial pure titanium (CP-Ti) has been widely used and attracted more and more applications. CP-Ti is specially used to manufacture components with lightweight structures mainly in biomedical, aerospace, and aviation.1–5 Using conventional processing methods, modern CP-Ti components are difficult to manufacture because of their complex configurations. In order to achieve this, laser melting process has been used. One of the unique additive manufacturing techniques is selective laser melting (SLM) process, in which parts with complex shapes can be developed based on computer-aided design (CAD) Files.6,7 This method is now increasingly being used to fabricate products for automotive industry, aerospace industry, and medical implants.8,9
The SLM/sintering is a periodically recurring manufacturing process and can be subdivided mainly into three phases. During the first phase, the platform containing substrate plate is lowered up to one layer thickness. Then a new layer of powder is applied to the substrate with the aid of coater. The powder is scanned by the laser in the third phase.5,6 The scanned areas absorb energy from the laser beam, and the particles will be fused. This process will be repeated until the whole part is made. The developer gets a huge degree of freedom concerning the part geometry without being limited by restrictions of conventional manufacturing methods.10,11 As a result of the layer-by-layer building process, the SLM allows the manufactured parts with hollows and undercuts. Due to high thermal gradient and directional heat flux, the selective laser-melted parts show strong-textured microstructure. 12 In the laser melting process, the new layer of powder applied over the substrate is not compressed mechanically in order not to destroy the underlying parts. So, it has high porosity. When the porosity changes, the absorptivity in the powder particles also changes.13,14 The absorptivity, energy density, and energy penetration ensure obtaining functional parts with high mechanical properties.15,16 The relation between energy density and laser parameters is given by the equation (1)
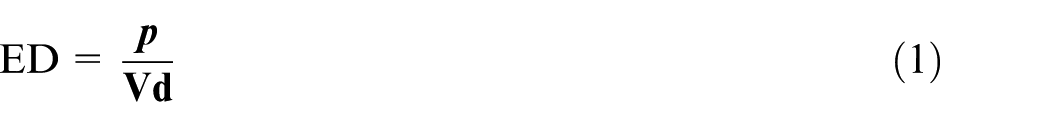
where ED is the energy density (J/mm2);
AV Gusarov et al. 13 also reported that the laser melting manufacturing process is sensitive to laser parameters such as the power, the laser beam diameter, scanning velocity of laser, and thickness of the powder layer. However, some defects such as spatter, balling phenomenon, curling, cracks due to thermal stresses can happen in laser melting process because of its physicochemical complexity. 18 Experiments with single line track show that an interval of laser velocities exists where re-melted tracks are uniform. If the laser velocity is not within this interval, the tracks become broken and referred to as the balling effect. 13 With high laser speed, the temperature gradient in the powder bed changes abruptly. Due to this, within a very small time period, solid-liquid-solid phase transformation occurs. This quick transformation is accompanied by a large interfacial force. Also, if the processing parameters are not properly selected, there may be a chance of distortion.19–21 The article published by P Hanzl et al. 6 describes that varying combinations of processing parameters can produce a different range of properties ranging from the uniform homogeneous surface, to a porous structure, to the balling phenomenon and also influence the structure and material properties. The melting of CP-Ti powder using the energy laser and successful mastering of this manufacturing process needed complex management because multiple variables influence the laser melting process. 22 Therefore, significant research works are required to study the absorptivity, thermal behavior during laser melting, and microstructure with varying parameters.
In this work, the numerical model for energy penetration was considered. The article discusses the absorptivity of CP-Ti powder, since the relations between absorptivity, porosity, and optical depth have not been studied in detail for CP-Ti powder. A finite element model was created. Based on the finite element model different laser tracks are generated at different process parameters by varying power (30, 45, and 75 W), speed (20, 25, and 30 mm/s), and diameter (2, 2.5, and 3 mm) of the laser. Experimentation of SLM of CP-Ti powder at three different laser parameters with a combination of this range of values, to our best knowledge, has not been reported previously. The influence of these parameters on the microstructure, width, and depth of track, defects like porosity, crack, balling effect, and so on were investigated. The comparison of numerical and experimental analysis was also made using finite element model, optical microscope, and scanning electron microscope (SEM). The findings of this research give important insights into the role of laser parameters in the laser melting of CP-Ti powder.
Laser melting model
Thermal model
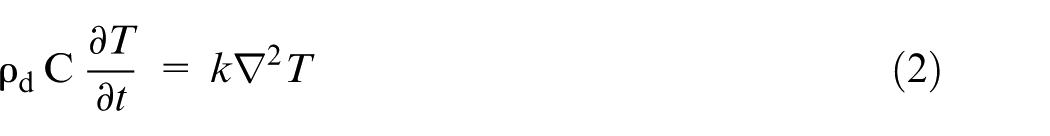
The equation of classical transient heat conduction describes the heat transfer behavior in the powder which is given by 20
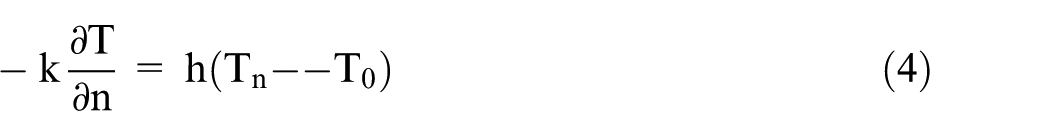
where the initial conditions are T (t) = T0 at t = 0, and boundary conditions as follows
on all sides except the top and bottom surface.
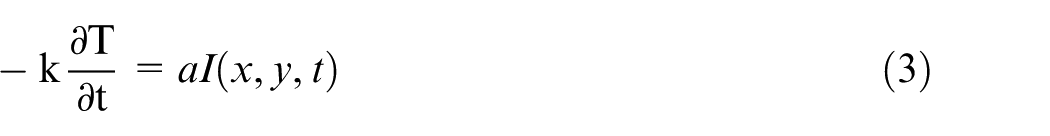
To model the moving heat source over the powder bed surface, Gaussian heat distribution was applied and is described in equation (5)
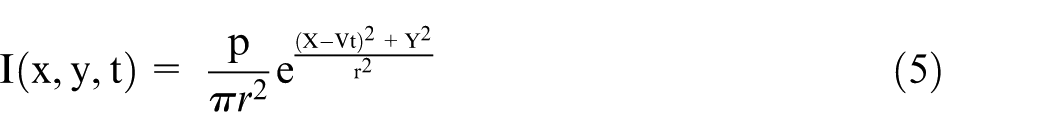
where p is the laser power, r is the radius of the laser beam, V is the speed of laser, t is the travel time, k is the thermal conductivity, and C and ρd are the heat capacity and the density, respectively. The initial temperature of powder bed which is usually less than the melting temperature of the titanium powder material and above the recrystallization temperature is denoted by T0. Tb indicates the bulk temperature, and Tn stand for the temperature of the area without laser heating. The convection heat transfer coefficient is denoted by h, the laser power intensity is I(x, y, t), and the direction cosine of the boundary is represented by n. 21
The thermal characteristics of specific heat capacity and thermal conductivity are temperature dependent. Figure 1(a) and (b) represents variations in the thermal conductivity and specific heat capacity of CP-Ti with temperature. 23
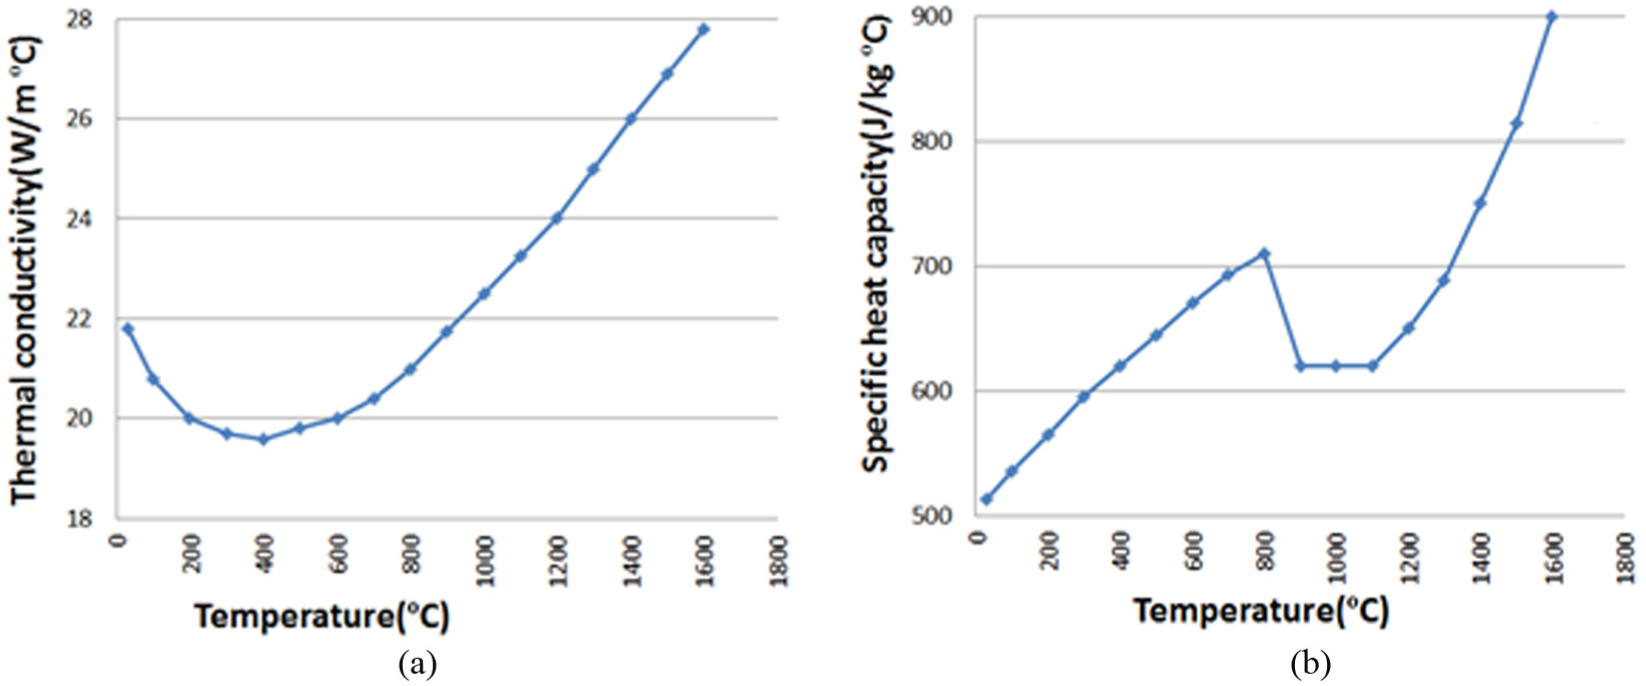
(a) Thermal conductivity and (b) specific heat capacity of CP-Ti. 23
Finite element model
The finite element analysis is used for finding the temperature distribution of laser on CP-Ti powder. For computational precision, brick 8 node 70 solid tetrahedron meshes with element edge length 0.0001 were adopted as shown in Figure 2. The physical properties of CP-Ti and laser processing parameters are listed in Table 1.
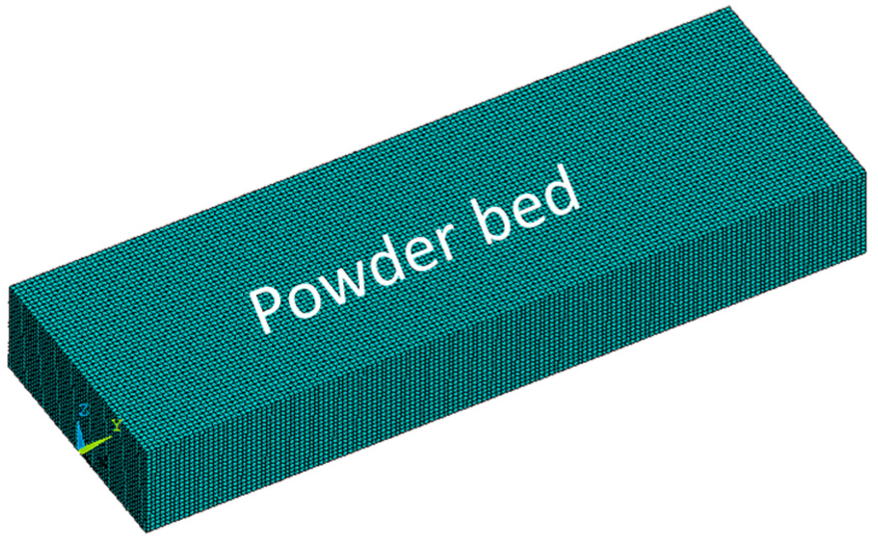
Finite element model of CP-Ti powder bed.
Parameters for finite element simulation.
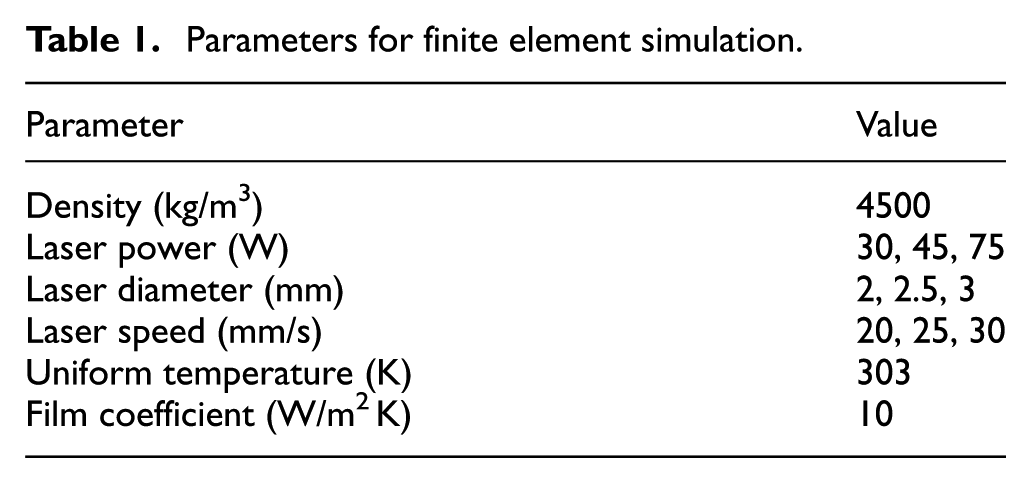
The finite element model was created by the assumptions that the whole CP-Ti powder is continuous and homogeneous medium. The density is 4500 kg/m3. Specific heat capacity and thermal conductivity are temperature dependent which is shown in Figure 1(a) and (b). The coefficient of convection between powder bed and the environment was taken as constant. The uniform temperature is 303 K, and film coefficient is 10 W/m2 K. The laser heat input is modeled as Gaussian heat distribution. The convection is given to whole areas except the top surface where heat input is given. Since the heat flux and convection boundary conditions are mutually exclusive.
Energy penetration
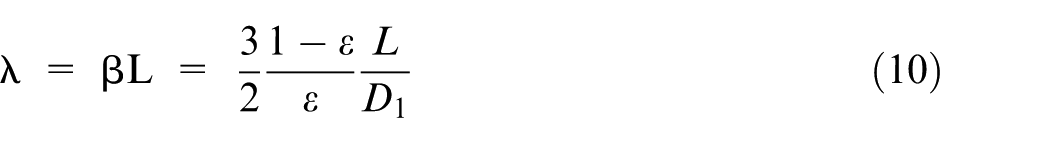
Laser melting is a layer-by-layer process which includes scattering and absorption of laser radiation in the powder. To protect the underlying parts, the powder is not compressed mechanically during the deposition of the layer. So, the powder bed has a porosity ranging of 40%–60% which is a high porosity level. Through these pores, multiple reflections occur, and the laser radiation penetrates into several particle diameters which is comparable to the layer thickness of the powder. The absorptivity of the titanium powder material, power of the laser, and powder density were also helped to penetrate the heat energy into the powder bed.24–26 The powder is taken as a medium of absorbing and scattering homogeneous region. The homogenized radiation transfer equation (RTE) from the article14,27 reveals the relation between universal absorptance function when the powder bed at normal incidence versus the absorptance of the dense form material. The energy balance equations from equation (6)–(10) gave clarifications to heat transfer through the layer of porous powder which is stated by Yadroitsev et al. 28
The dimensionless number
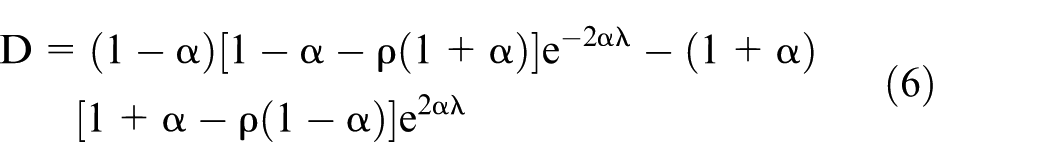
The absorptivity of the system powder-substrate (Aps) is represented as the fraction of the incident radiation passing the powder surface 28
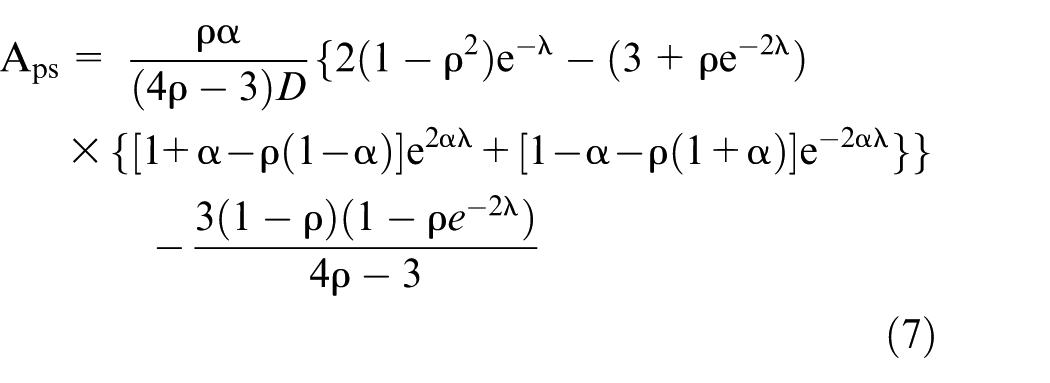
The fraction of incident radiation absorbed by the substrate (As)
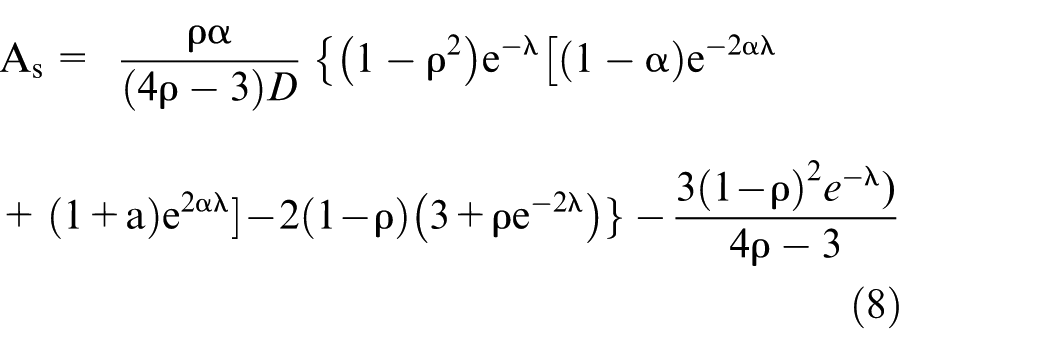
The absorptivity of the powder (Ap)

The reflectivity of CP-Ti is taken as ρ = 0.56 and
Experimentation
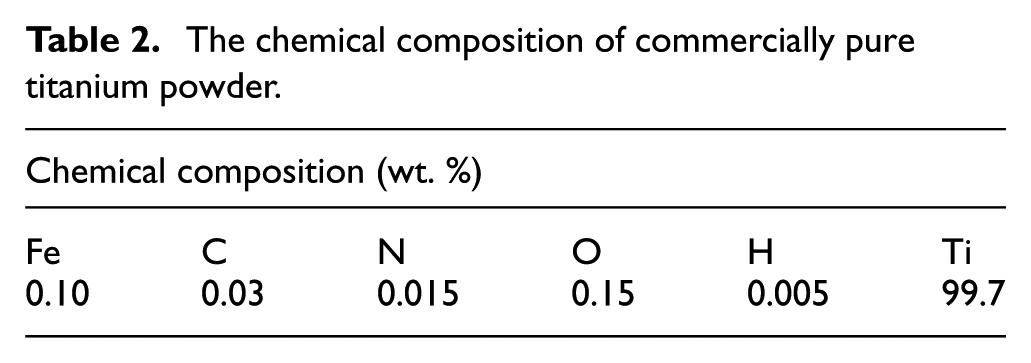
Spherical particle–shaped CP-Ti powder of average particle size of 45 µm was used for experimentation. The chemical composition is shown in Table 2.
The chemical composition of commercially pure titanium powder.
The substrate for the powder bed was cut from the titanium plate using an abrasive cut off the machine to the dimension of 15 mm × 5 mm × 2 mm. The plate was polished using emery paper. With the aid of scrapper blade, CP-Ti powder was spread over the substrate. Then this specimen was preheated in vacuum furnace up to a temperature of 1173 K. After preheating, the powder was properly stuck to the substrate.
The experimental set up consists of neodymium-doped yttrium aluminum garnet (Nd-Yag) laser source and scanner with a maximum output power of 300 W which was used for laser melting of CP-Ti powder as shown in Figure 3.
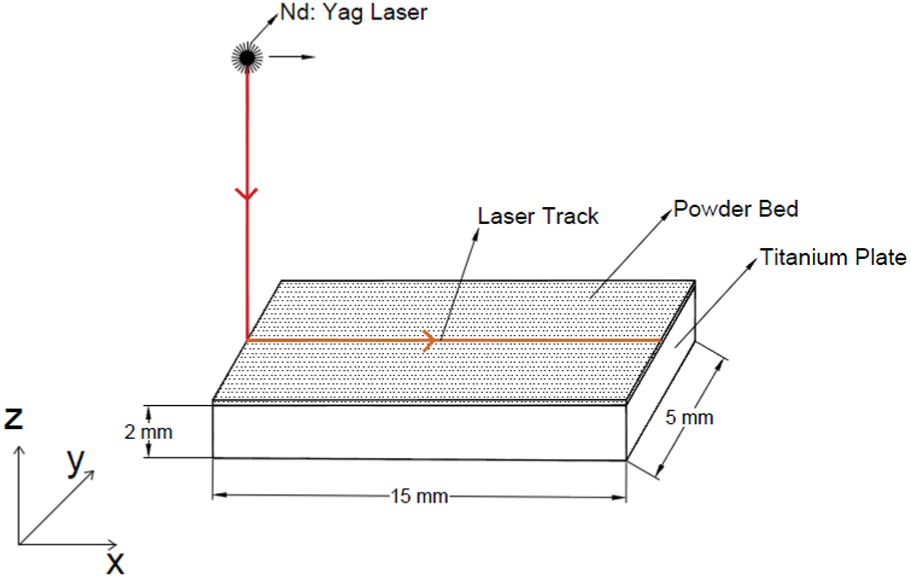
Diagram of selective laser melting process.
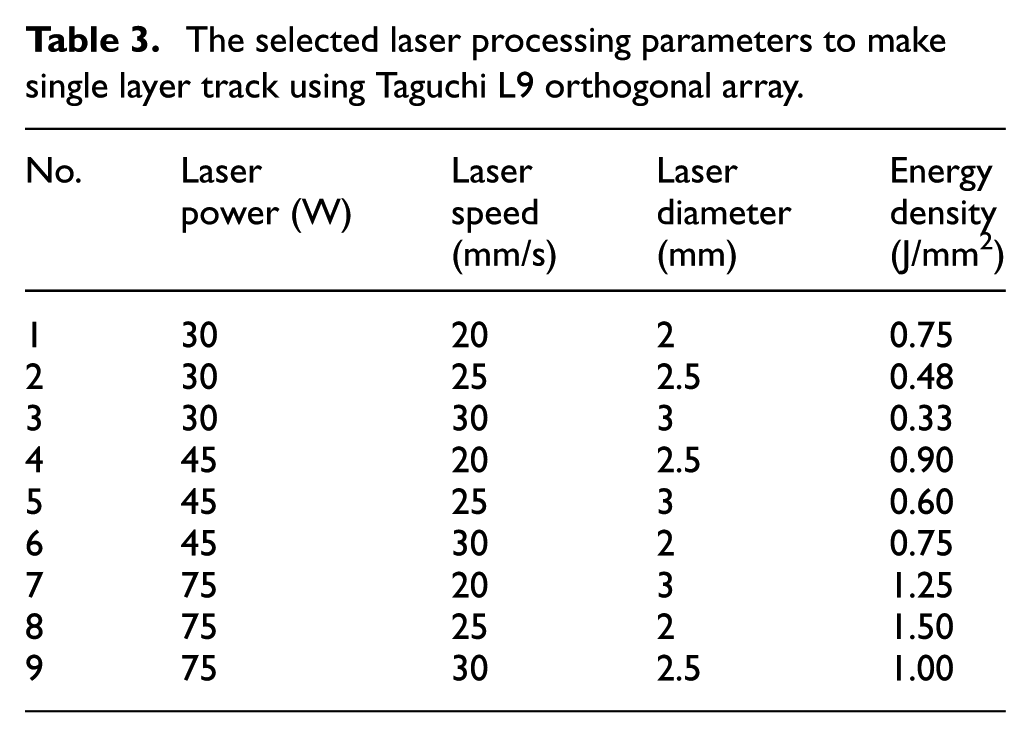
The experiment consists of three different independent variables such as laser power, laser speed, and laser diameter with each variable having three set of values. Instead of conducting full factorial experiments, Taguchi L9 orthogonal array method was used, which produces full information of all the factors that affect the performance parameter with a minimal number of experiments. Nine different single tracks were formed using this method as shown in Table 3.
The selected laser processing parameters to make single layer track using Taguchi L9 orthogonal array.
Investigation of track width and depth was done by the Celestron digital microscope. Using SEM, the surface characteristics of laser tracks were observed.
Results and discussions
Absorptivity
In additive manufacturing processes, the powder layer on the top has large porosity generally in the range of 40%–60% for typical metallic powders. 19 The absorptivity of the powder-substrate (Aps), the fraction of incident laser radiation absorbed by the substrate (As) and absorptivity of the powder (Ap) are calculated from the equations (7)–(9). The optical depth versus absorptivity graphs are plotted for different percentage of porosity and are represented in Figures 4–8. The fraction of incident radiation absorbed by the substrate (As) decreases with optical depth of the powder layer, while the fraction absorbed in the powder (Ap) increases. Scattering of laser light in the powder bed mainly leads to absorption. But at higher optical depth scattering of laser light does not happen, so the light escapes without scattering. When the porosity is higher, the void spaces in the powder bed are higher, so the powder particles will absorb more laser energy. It is noticed that in all the range of porosity (40%–60%), the maximum absorptivity of powder is less than 0.9.
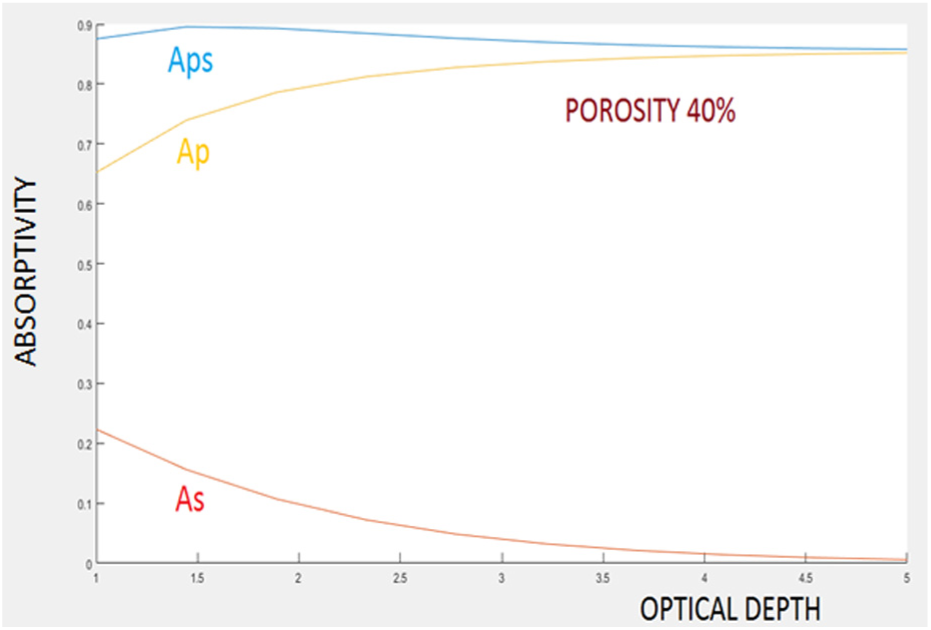
Total absorptivity versus optical depth at porosity 40%.
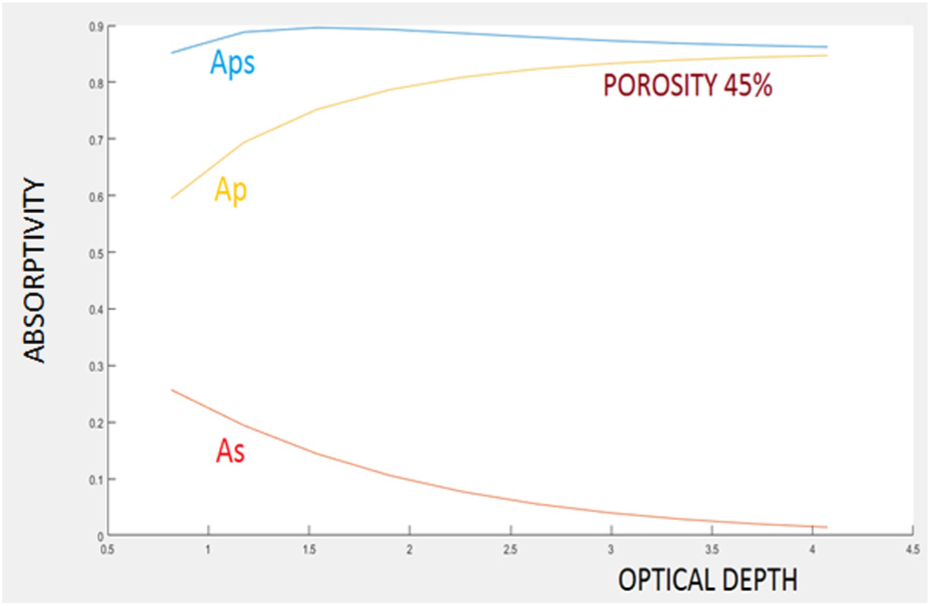
Total absorptivity versus optical depth at porosity 45%.
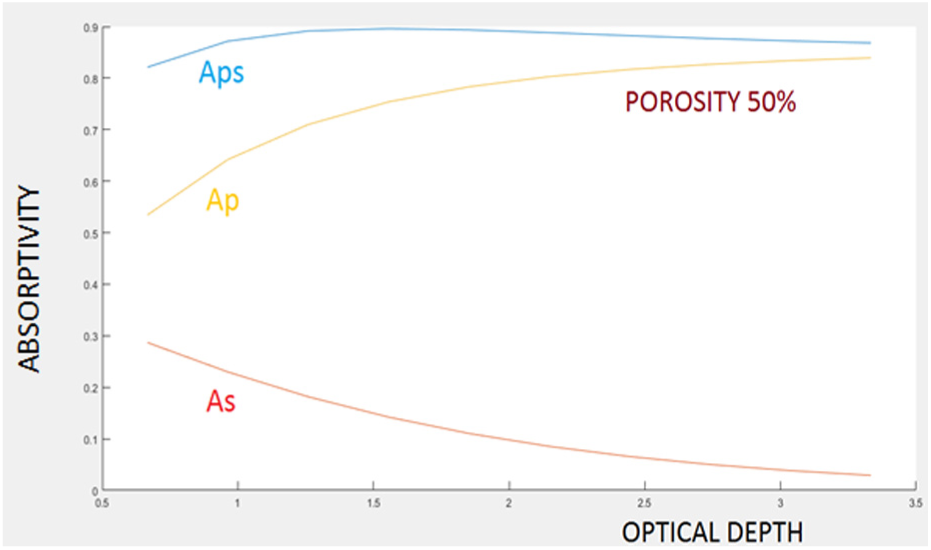
Total absorptivity versus optical depth at porosity 50%.
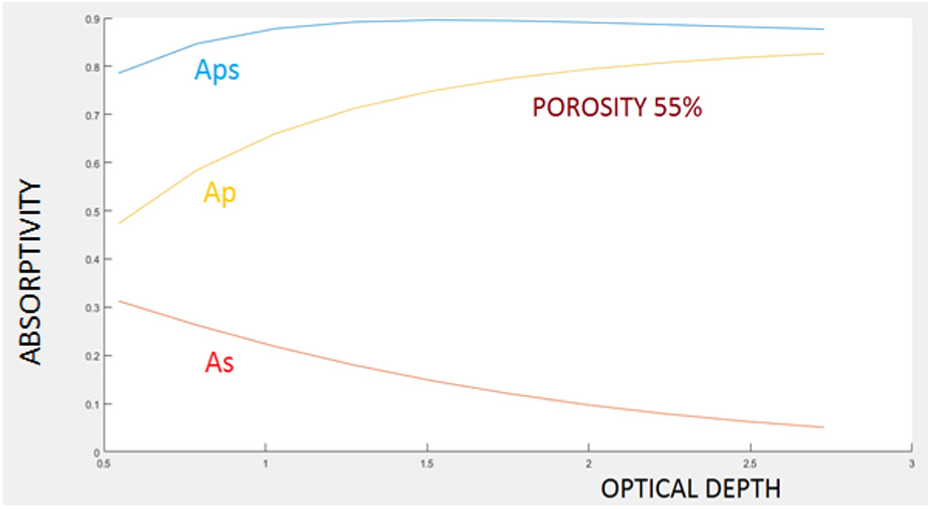
Total absorptivity versus optical depth at porosity 55%.
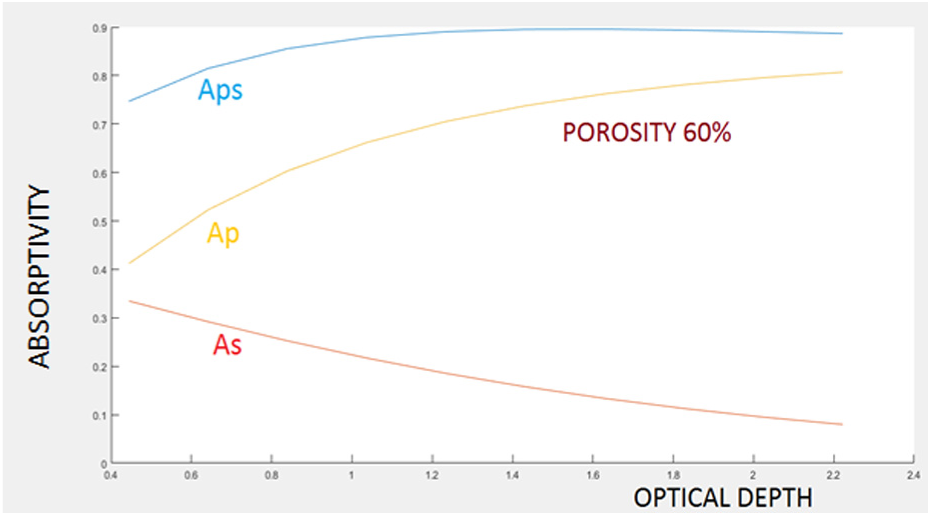
Total absorptivity versus optical depth at porosity 60%.
Temperature distribution
In this section, numerical model is analyzed and discussed. The temperature distribution of laser keeping power 30 W, laser speed of 20 mm/s, and diameter 2 mm is shown in Figure 9(a)–(c).
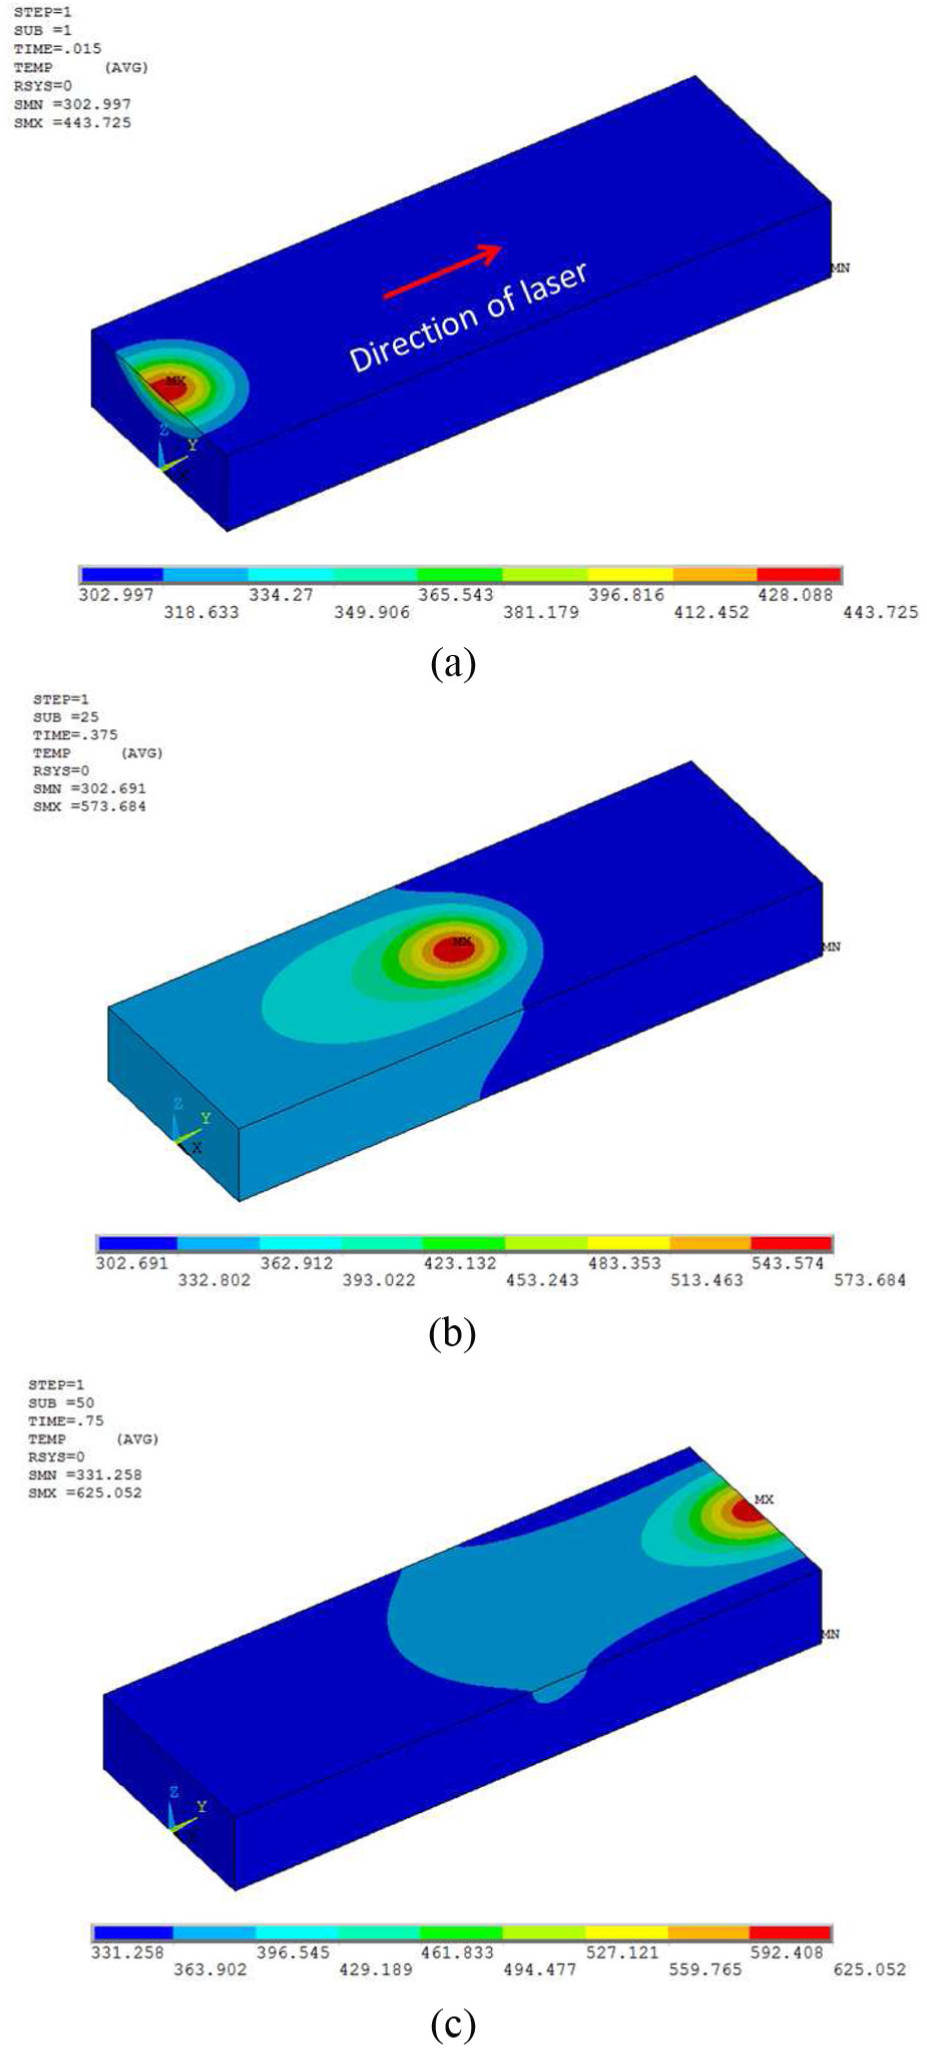
Temperature distribution for laser power 30 W, laser speed 20 mm/s, and laser diameter 2 mm: (a) at first point, (b) at middle point, and (c) at final point.
In the first point, the maximum temperature 443.72 K is at the laser center which decreases outwards. When the laser moves further, the temperature at the center is increased to 573 and 625 K at the middle and last point, respectively.
Figure 10(a)–(c) represents the temperature distribution of laser parameter with power 45 W, speed 20 mm/s, and diameter 2.5 mm.
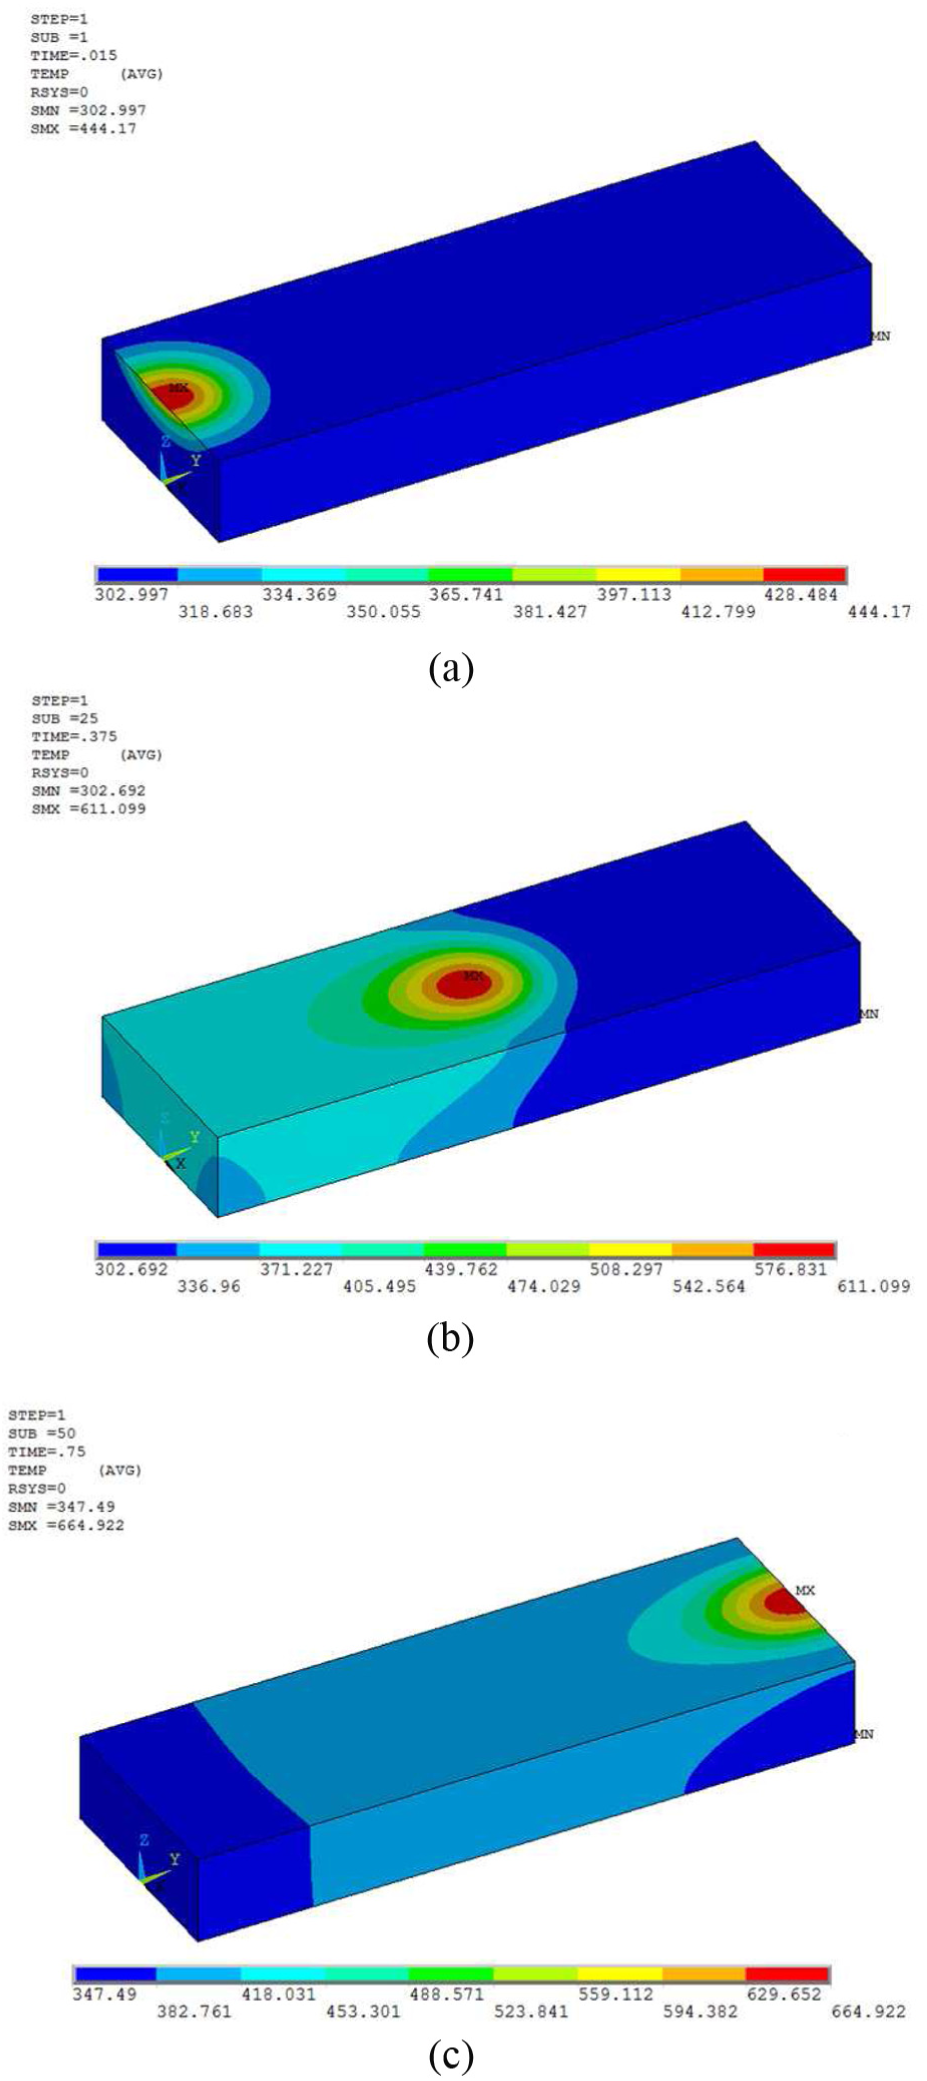
Temperature distribution for laser power 45 W, laser speed 20 mm/s, and laser diameter 2.5 mm: (a) at first point, (b) at middle point, and (c) at final point.
In the first point, the maximum temperature at the center is 444 K, and the temperature increased to 611 K at the middle point and 664 K at the final point.
The temperature gradient keeping laser power 75 W, laser speed 30 mm/s, and laser diameter 2.5 mm is shown in Figure 11(a)–(c).
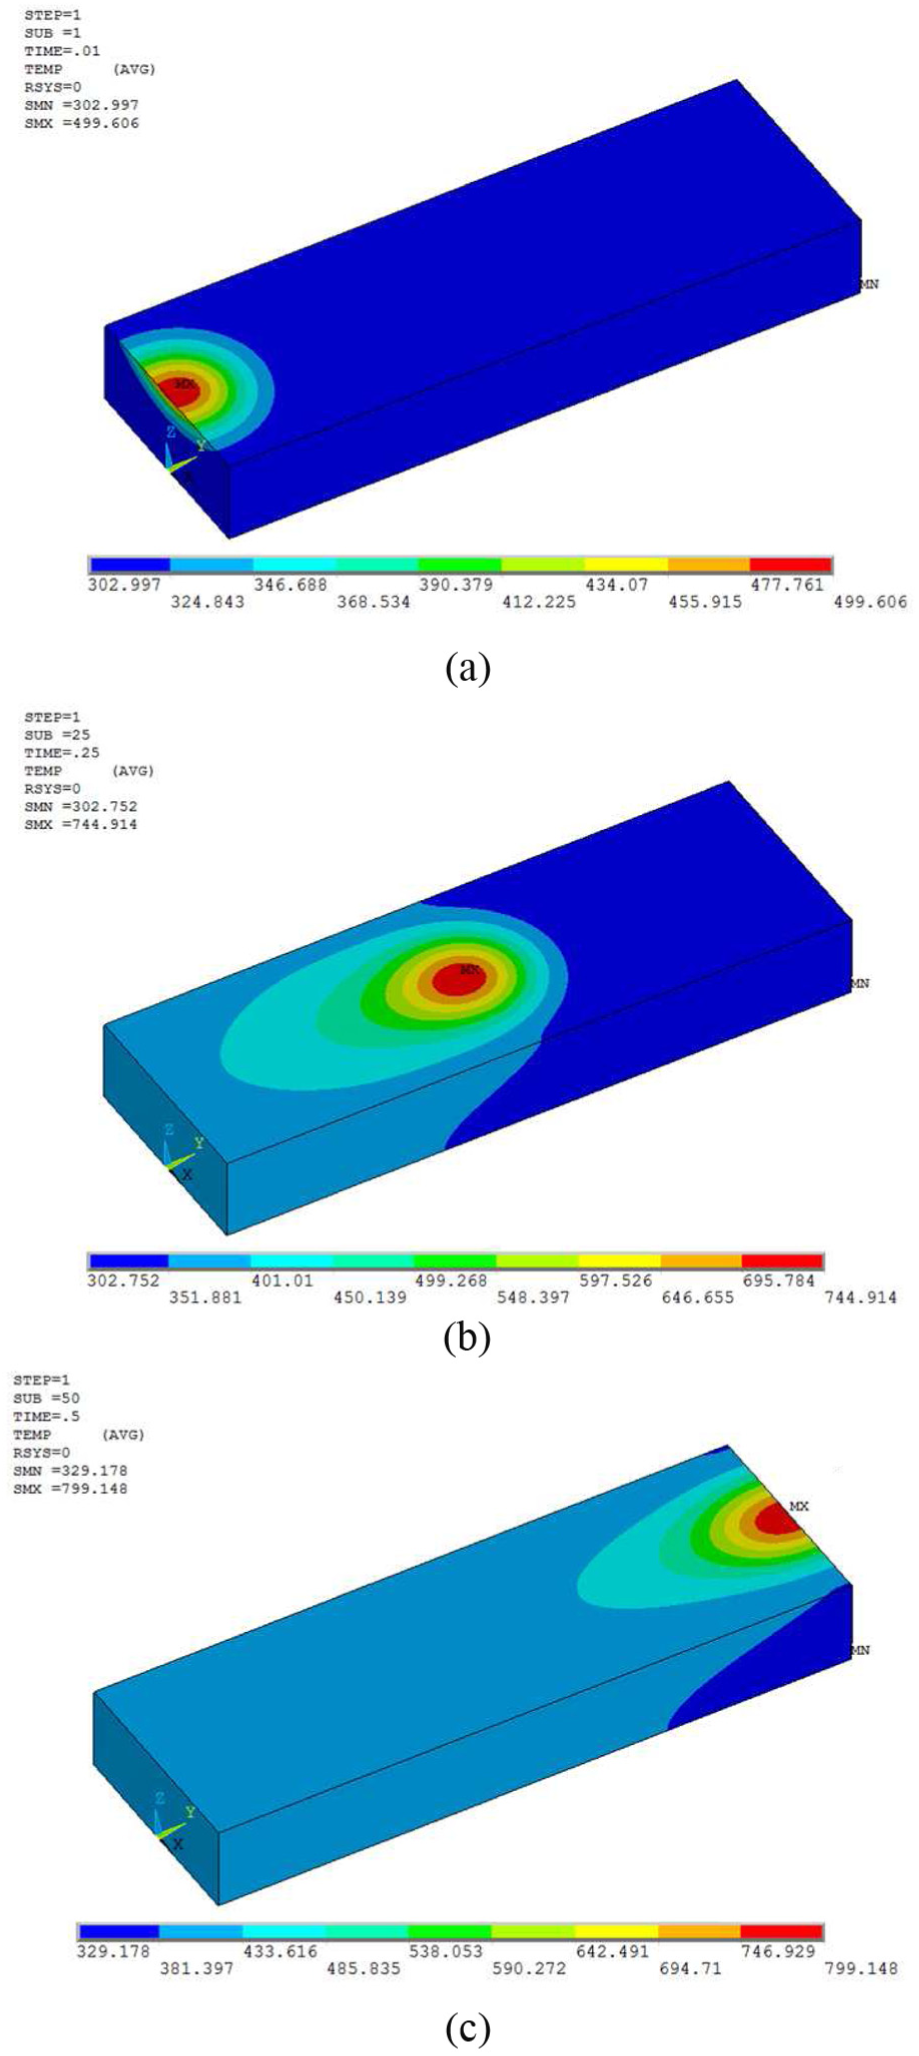
Temperature distribution for laser power 75 W, laser speed 30 mm/s, and laser diameter 2.5 mm: (a) at first point, (b) at middle point, and (c) at final point.
For the first point in this parameter, the maximum temperature is 499 K which is also at laser center. The maximum temperature increases to 744 K in the middle point. At the final point, the temperature reached maximum to 799 K.
All these conditions, the maximum temperature is at the laser center because of higher energy density, and then temperature decreases outwards. This is due to heat loss by conduction and convection. When laser moves from the first point to final point, the temperature and the heat distribution gradually increases for all nine parameters. This is due to heat generated by the laser in the previous point influence the next point, resulting in heat accumulation effect. So, the maximum heat accumulation will be for the last point. The longer interaction time also lead to a higher temperature for the final point. When the laser track begins, the shape of the laser is circular, and the powder bed had more air gaps between them. This air gap causes lesser conductivity for the powder bed and circular shape of the laser beam which was also described by Alkahari et al. 29 But when the track solidifies, the air gap is eliminated and the conductivity increases. The heat transfers through the solidified track and the laser beam becomes an elliptical shape.
Variation of temperature with laser parameters
Figure 12 shows the graph between the maximum temperature at laser center and three different points in the laser track keeping the same laser speed (20 mm/s).
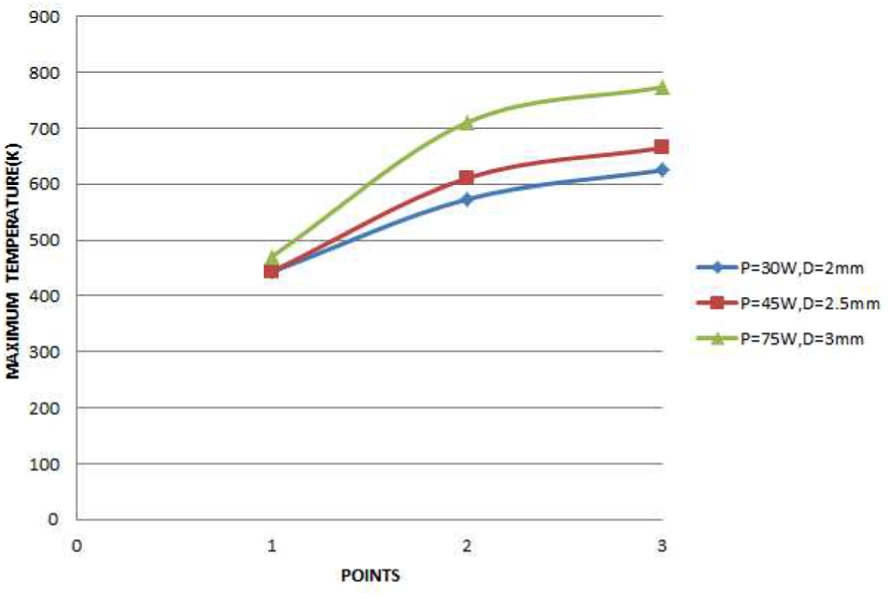
Maximum temperature at different power keeping laser speed of 20 mm/s.
The initial temperature is almost same and then gradually increases to 573 and 611 K for 30 and 45 W power, respectively, at the second point. When power further increases (75 W), the maximum temperature reaches 710 K at the second point. At the third point, the temperature for 30 W power is 625 K, 45 W power is 664 K, and for 75 W is 773 K. So, from the equation (1), it is clear that the power is proportional to energy density. Figure 12 also shows this proportionality. At the third point at the 30 W power, the temperature is 625 K, which is a lower temperature than that of 75 W power (773 K).
The graph between maximum temperature and three points in the laser track for varying laser speed maintaining same power (45 W) is shown in Figure 13.
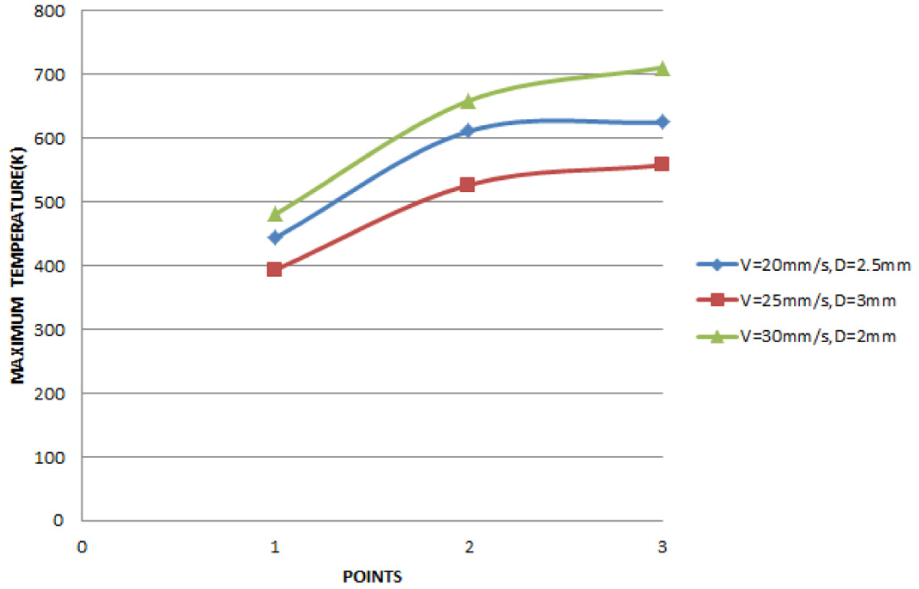
Maximum temperature at different laser speed keeping power 45 W.
For laser speed of 20 mm/s, the temperature at first point is 444 K, and it increases to 625 K to the third point. The maximum temperature at first point for laser speed 25 and 30 mm/s are 393 and 481 K, respectively. Then the increased maximum temperatures at the third point are 557 (25) and 710 K (30 mm/s). The laser speed is inversely proportional to energy density. So, compared to 20 and 25 mm/s laser speed, the maximum temperature should be lesser for 30 mm/s speed theoretically. But there is a variation, due to the change in laser diameter.
From the Figure 13, the maximum temperature for 2 mm diameter is increasing from 481 to 710 K. Compared to 2 mm laser diameter, the maximum temperature is less for 3 mm laser diameter, which is increasing from 393 to 557 K. This is due to the lower energy density for larger laser diameters. The simulation result also shows the increases in temperature with decrease in laser diameter.
The temperature of the powder bed is influenced by laser power, laser speed, and laser diameter. Comparing the numerical results and graphical representations, it is revealed that the laser power has more significant influence on the temperature of the powder bed. The temperature gradient is more sensitive to laser power than laser speed and laser diameter. The change in temperature gradient for different laser speed is due to the change in interaction time between powder bed and laser beam. At relatively lower laser speed, the powder bed will be heated for more time, and high laser energy is absorbed to yield higher temperature. For smaller laser diameter, energy input is higher which results in higher temperature gradient.
Microscopic features
The digital microscopic images of Figure 14(a)–(c) show the laser-melted samples produced at the 30 W power of varying laser speed and laser diameter.
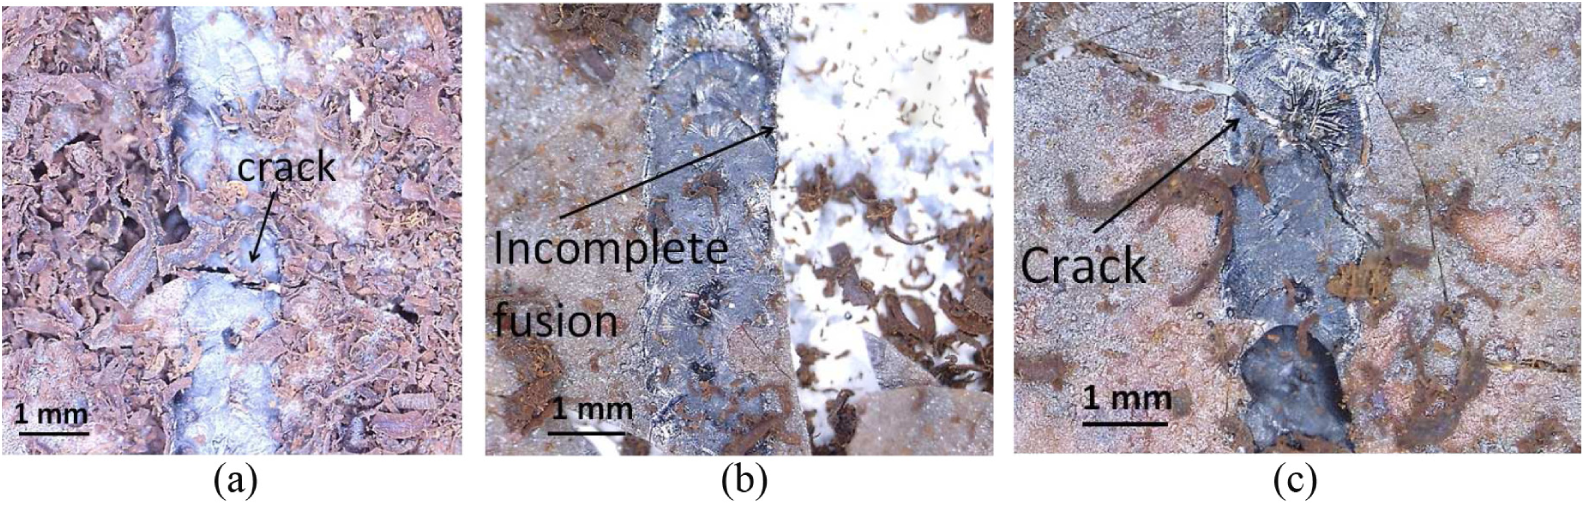
Laser-melted track with laser parameters: (a) P = 30 W, V = 20 mm/s, D = 2 mm; (b) P = 30 W, V = 25 mm/s, D = 2.5 mm; and (c) P = 30 W, V = 30 mm/s, D = 3 mm.
At relatively lower laser power of 30 W, the CP-Ti powder was not completely fused to the substrate as shown in Figure 14(a)–(c). The main cause of this defect is due to insufficient heat produced at lower laser power. Transverse cracks were also found in the substrates (Figure 14(a) and (c)), which is perpendicular to the direction of laser tracking. Generally, transverse cracks are the consequence of longitudinal shrinkage stresses.
When the laser power was increased to 45 W, a properly fused laser track is obtained for the samples which are shown in Figure 15(a)–(c).
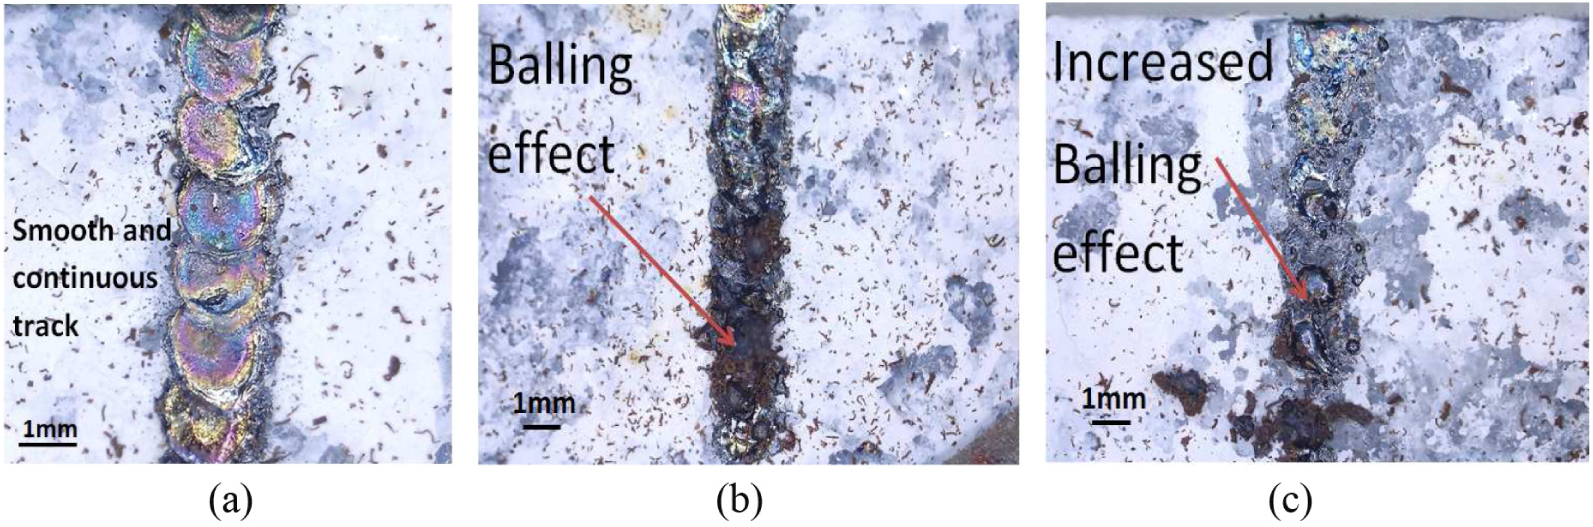
Laser-melted track with laser parameter (a) P = 45 W, V = 20 mm/s, D = 2.5 mm; (b) P = 45 W, V = 25 mm/s, D = 3 mm; and (c) P = 45 W, V = 30 mm/s, D = 2 mm.
Adequate power of 45 W and the laser speed of 20 mm/s result in better fusion of powder with the substrate as shown in Figure 15(a), but defects such as balling phenomenon were found in the laser track of speed 25 and 30 mm/s. Hence, at lower laser speed, the smooth and continuous track was observed. Due to the lower laser speed, the powder will stick on to the substrate, and proper melting occurs, whereas in higher laser speed, the powder will fly off from the substrate.
At higher power of 75 W, the laser energy density increases, the maximum temperature also increases which results in overheating and thermal distortion. Figure 16(a) indicates that due to higher laser power and lower laser speed, more heat will be produced over the powder which will burn the powder.
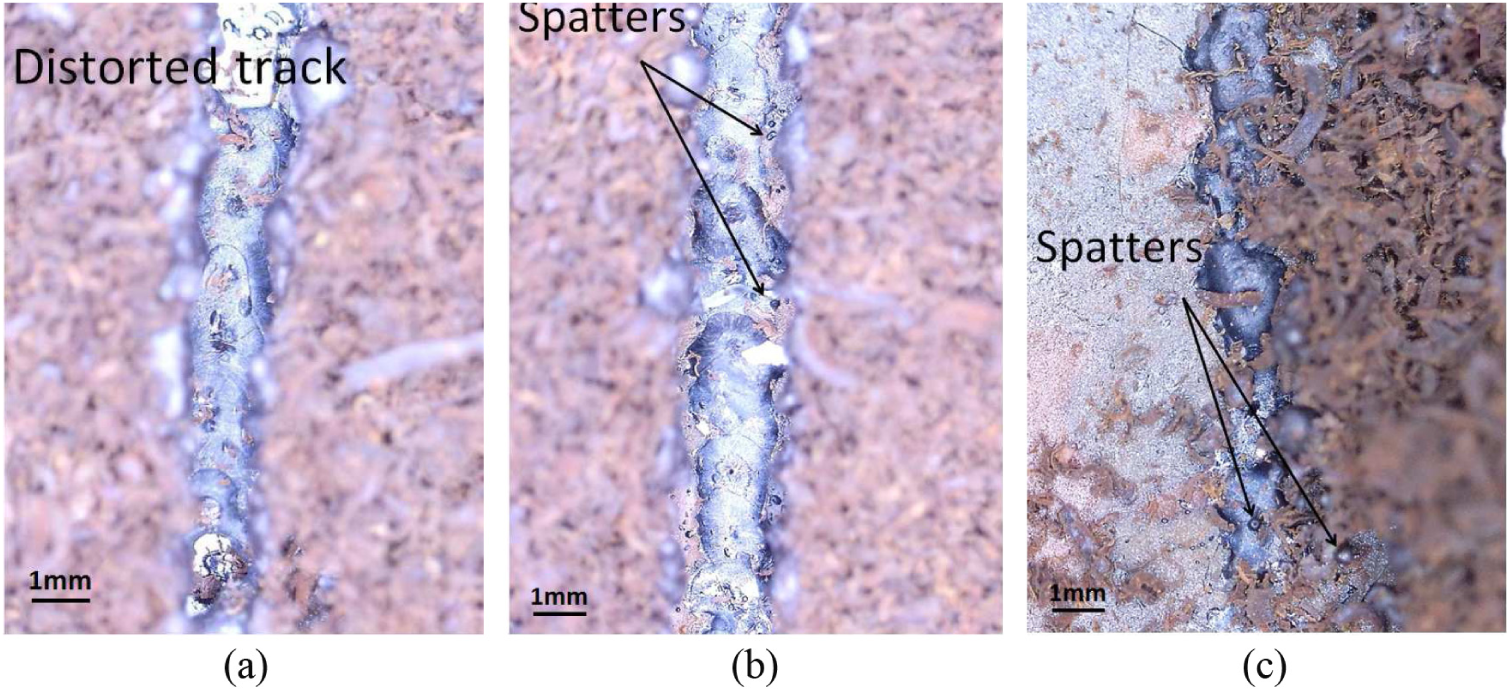
Laser-melted track with laser parameter (a) P = 75 W, V = 20 mm/s, D = 3 mm; (b) P = 75 W, V = 25 mm/s, D = 2 mm; and (c) P = 75 W, V = 30 mm/s, D = 2.5 mm.
Figure 16(b) and (c) at laser speed 25 and 30 mm/s, spatters occurs which is caused by the higher laser speed. Spatters are molten material droplets that are developed at or near the laser track which was also stated by Wang et al. 30 In higher laser speed, the powder will fly off from the substrate due to the higher energy density of the laser.
For 30 W power and 20 mm/s speed, incompletely fused laser track with crack was obtained. This is mainly due to the insufficient laser energy density caused by lower laser power. However, in laser power of 45 W and minimum laser speed of 20 mm/s, smooth and continuous tracks were observed. This was obtained due to the adequate laser energy density produced by the process parameters. When the power is 75 W, which is relatively higher, the samples were overheated and distorted, and discontinuous track was observed because of higher laser energy density.
Variation of width and depth with laser parameters
Width
The numerical analysis predicts the influence of power on the width of laser tracks maintaining same laser speed (20 mm/s) as shown in Figure 17(a)–(c). Figure 18 represents the graph of variation between experimental width and laser power.
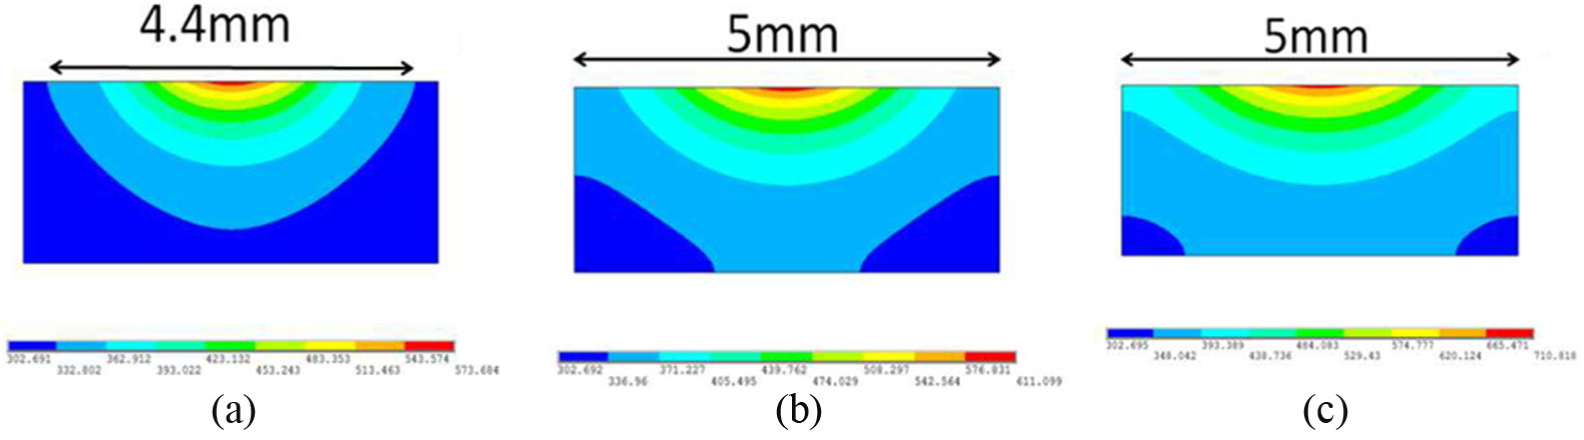
Width of temperature gradient for parameter (a) P = 30 W, V = 20 mm/s, D = 2 mm; (b) P = 45 W, V = 20 mm/s, D = 2.5 mm; and (c) P = 75 W, V = 20 mm/s, D = 3 mm.
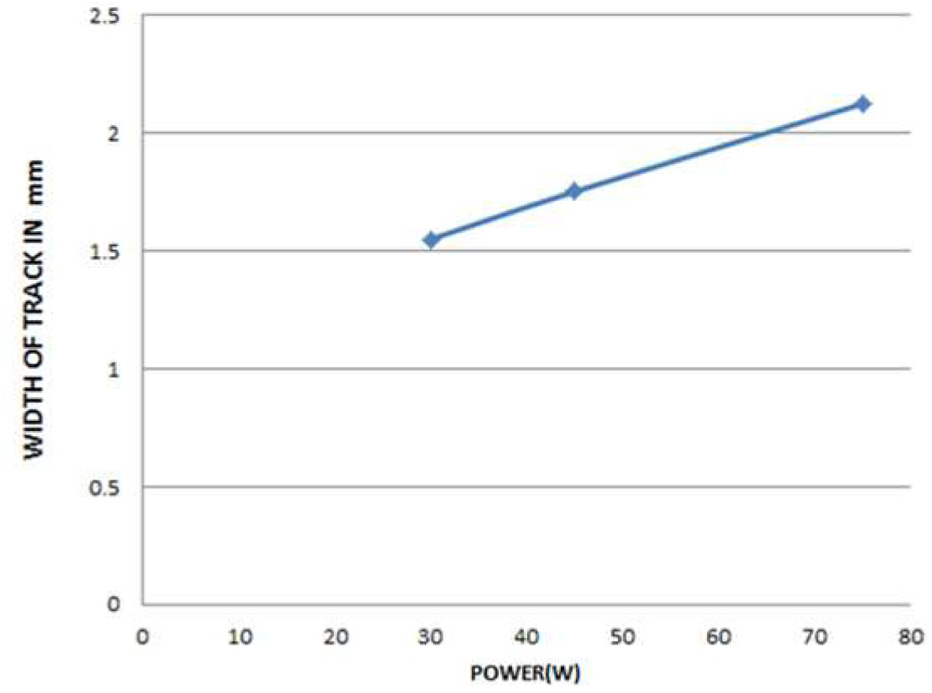
Graph between the experimental width of laser track and laser power.
When the power was increased from 30 to 75 W, the temperature distribution along the width has been increased from 4.4 to 5 mm (Figure 17(a)–(c)). The experimental results (Figure 18) also indicate that the width of the track is more for high laser power which increases from 1.55 to 2.125 mm. At higher energy density, the more heat transfer will occur over the powder. Thus, the width of the track increases linearly with laser power which validates the numerical results.
The variation of temperature gradient and width of laser track with different laser speed keeping laser power (45 W) constant is shown in Figure 19(a)–(c).
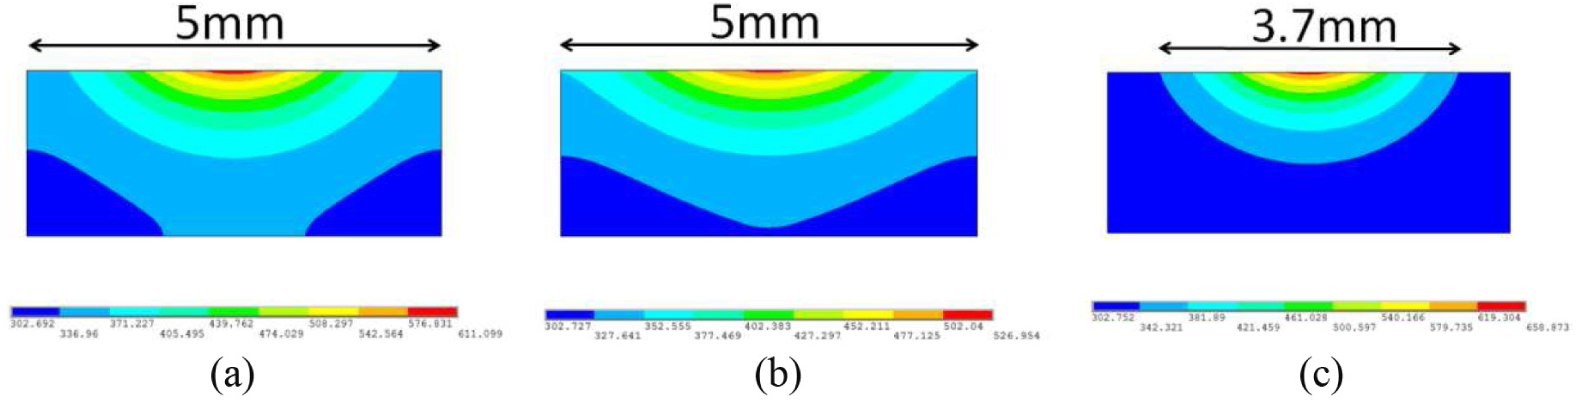
Width of temperature gradient for parameter (a) P = 45 W, V = 20 mm/s, D = 2.5 mm; (b) P = 45 W, V = 25 mm/s, D = 3 mm; and (c) P = 45 W, V = 30 mm/s, D = 2 mm.
When the laser speed was increased from 20 to 30 mm/s, the width of temperature gradient decreases from 5 to 3.7 mm, respectively (Figure 19(a)–(c)). For the experimental result, the width first increases and then decreases (Figure 20). The high-speed traveling of laser leads to decrease in heat input, and less volume of powder will be melted. Consequently, the width of laser track is less at high laser speed.
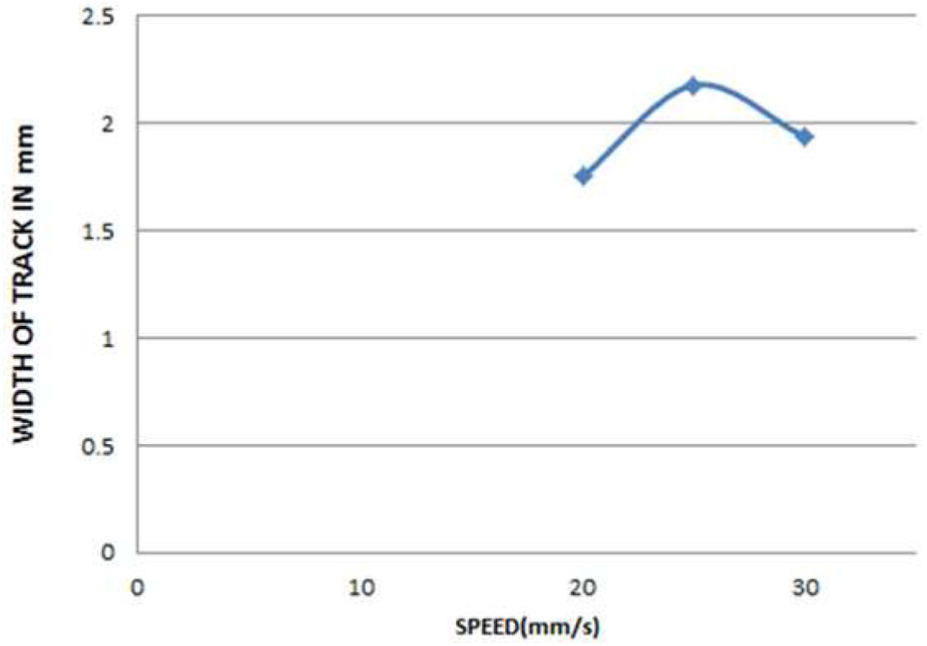
Graph between the experimental width of laser track and laser speed.
Observing the Figure 21, it is noted that for 2 mm laser diameter, the laser track width is 1.93 mm, and for 3 mm laser diameter, the laser track width increases to 2.17 mm. So, high laser diameter leads to the broader track width.
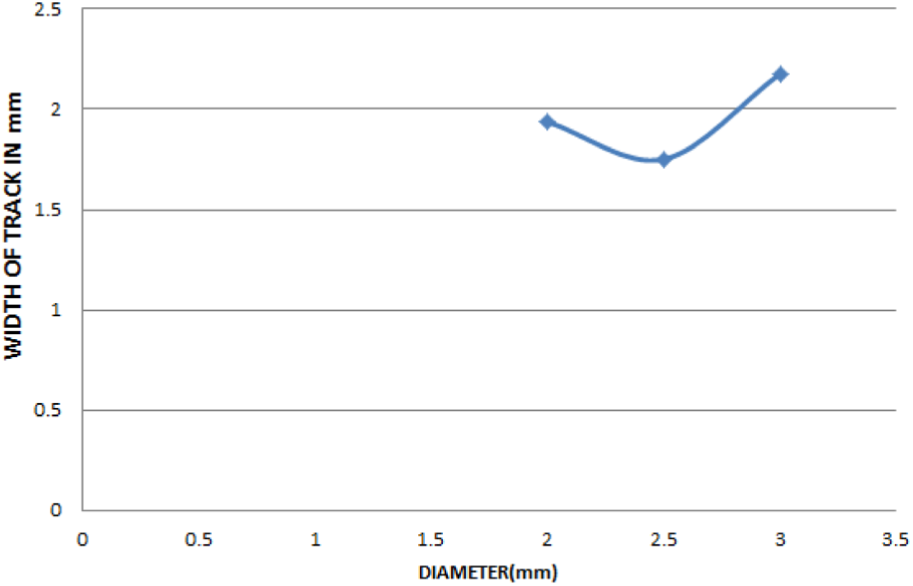
Graph between the experimental width of laser track and laser diameter.
Depth
In this section, the numerical analysis of the temperature distribution along the thickness and the depth of laser track with the varying parameter is described. Figure 22(a)–(c) shows the variation of depth of temperature gradient with different laser power for the same laser speed.
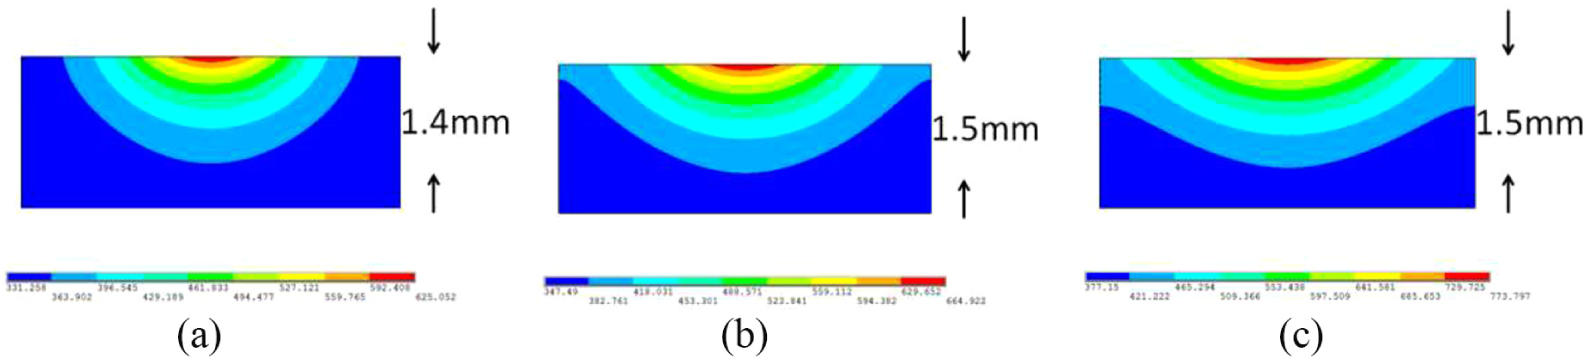
Depth of temperature gradient for parameter (a) P = 30 W, V = 20 mm/s, D = 2 mm; (b) P = 45 W, V 20 mm/s, D = 2.5 mm; and (c) P = 75 W, V = 20 mm/s, D = 3 mm.
From the Figure 22(a) it is observed that for lower power, smaller temperature-distributed area is obtained. The lower laser power provides lesser heat energy which leads to a lesser depth of penetration to the powder bed of 1.4 mm. At high laser power of 45 and 75 W (Figure 22(b) and (c)), the temperature is distributed to more areas and depth of penetration increased to 1.5 mm. These effects are due to the increase in laser power, which leads to increase in higher laser heat input energy. Therefore, the more molten powder will be formed and higher penetration occurs. So, thicker laser track can be obtained at high laser power.
By varying the laser speed and keeping power constant (45 W), the temperature distribution of powder bed is shown in Figure 23(a)–(c).
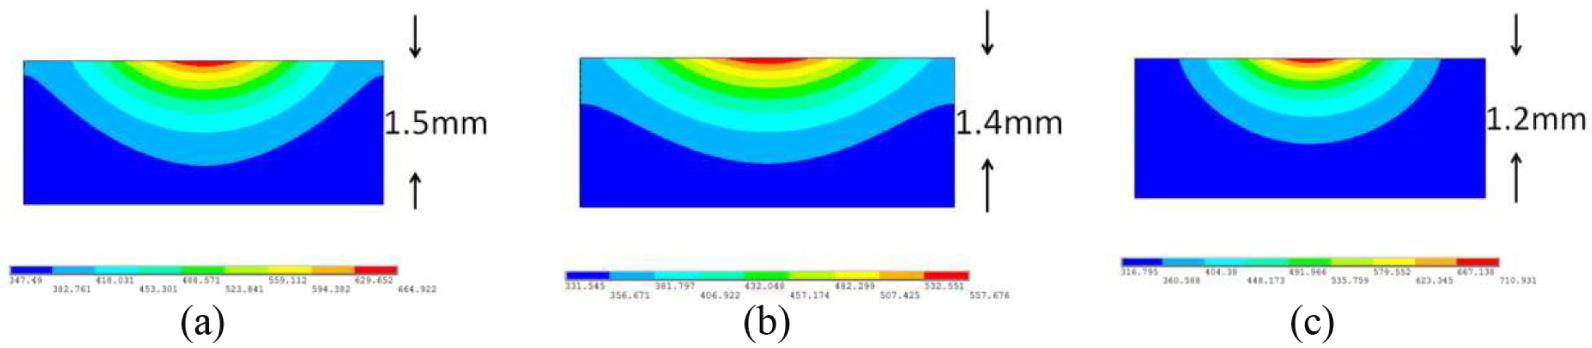
Depth of temperature gradient for parameter (a) P = 45 W, V = 20 mm/s, D = 2.5 mm; (b) P = 45 W, V = 25 mm/s, D = 3 mm; and (c) P = 45 W, V = 30 mm/s, D = 2 mm.
When the speed was increased, the depth of penetration of heat energy decreases from 1.5 to 1.2 mm at laser speed 20 and 30 mm/s, respectively (Figure 23(b) and (c)). The experimental results also validate the same from the Figure 24(a)–(d).
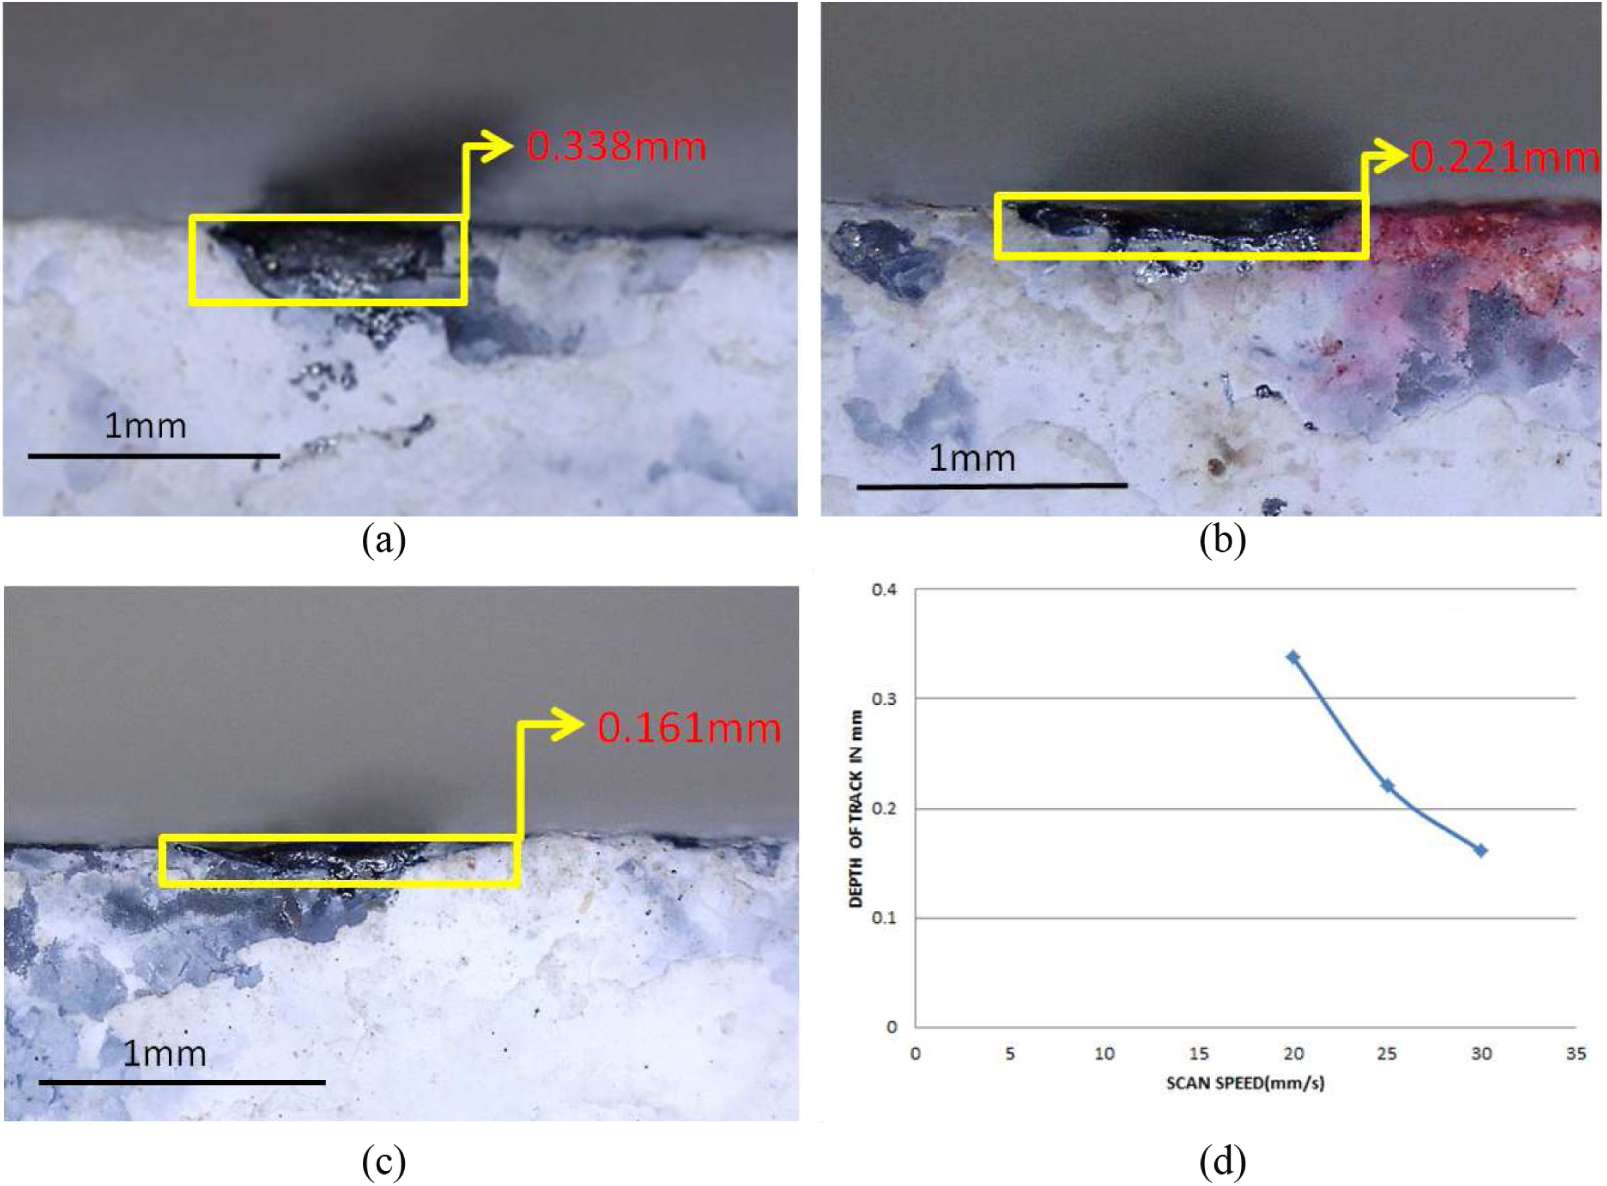
Depth of laser track for parameter (a) P = 45 W, V = 20 mm/s, D = 2.5 mm; (b) P = 45 W, V = 25 mm/s, D = 3 mm; (c) P = 45 W, V = 30 mm/s, D = 2 mm; and (d) graph between the depth of track and laser speed.
From the Figure 24(d), the depth of track at 20 mm/s speed is 0.338 mm and for 30 mm/s speed the depth decreased to 0.161 mm. When the power increases, the depth of track increased. However, the depth is decreased with laser speed. As laser speed increases, the amount of time in which the laser energy affecting over the powder is comparatively lesser which results in lower penetration. Hence, the laser speed directly influences the depth of penetration of laser tracking.
The variation of depth with laser diameter is shown in Figure 25. It is noted from the Figure 25 that at lower laser diameter due to the lesser area of exposure to laser energy, improper melting occurs which results in a lesser depth of penetration of laser tracking. In a medium laser diameter, proper melting occurs, and higher depth of penetration can be obtained. Moreover, in higher laser beam diameter, exposure of laser beam energy is very high which will burn the powder. Hence, the depth of penetration will be lower.
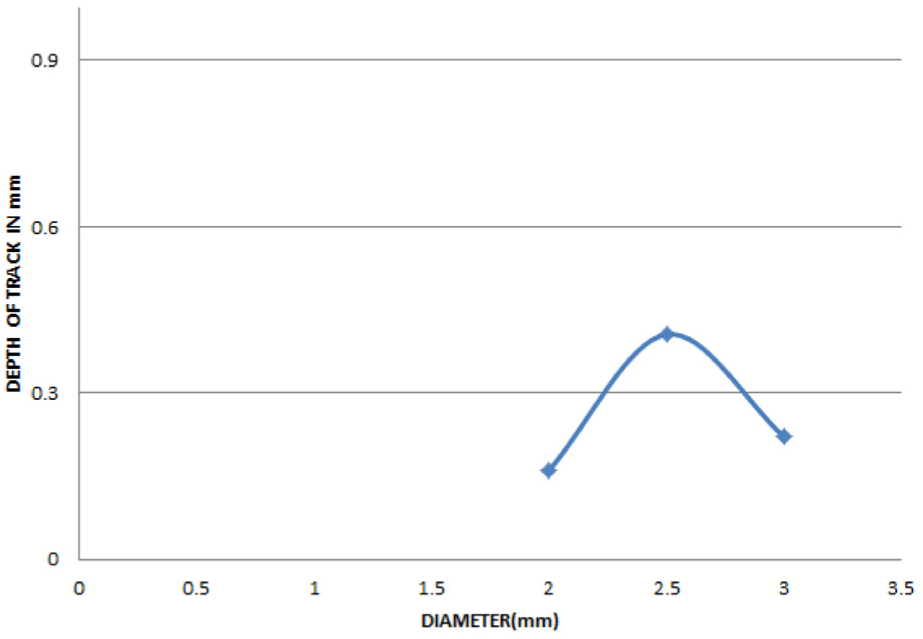
Graph between the depth of track and diameter.
SEM microstructural analysis
Figure 26(a) and (b) shows typical surface characteristics of laser track produced at different laser power.
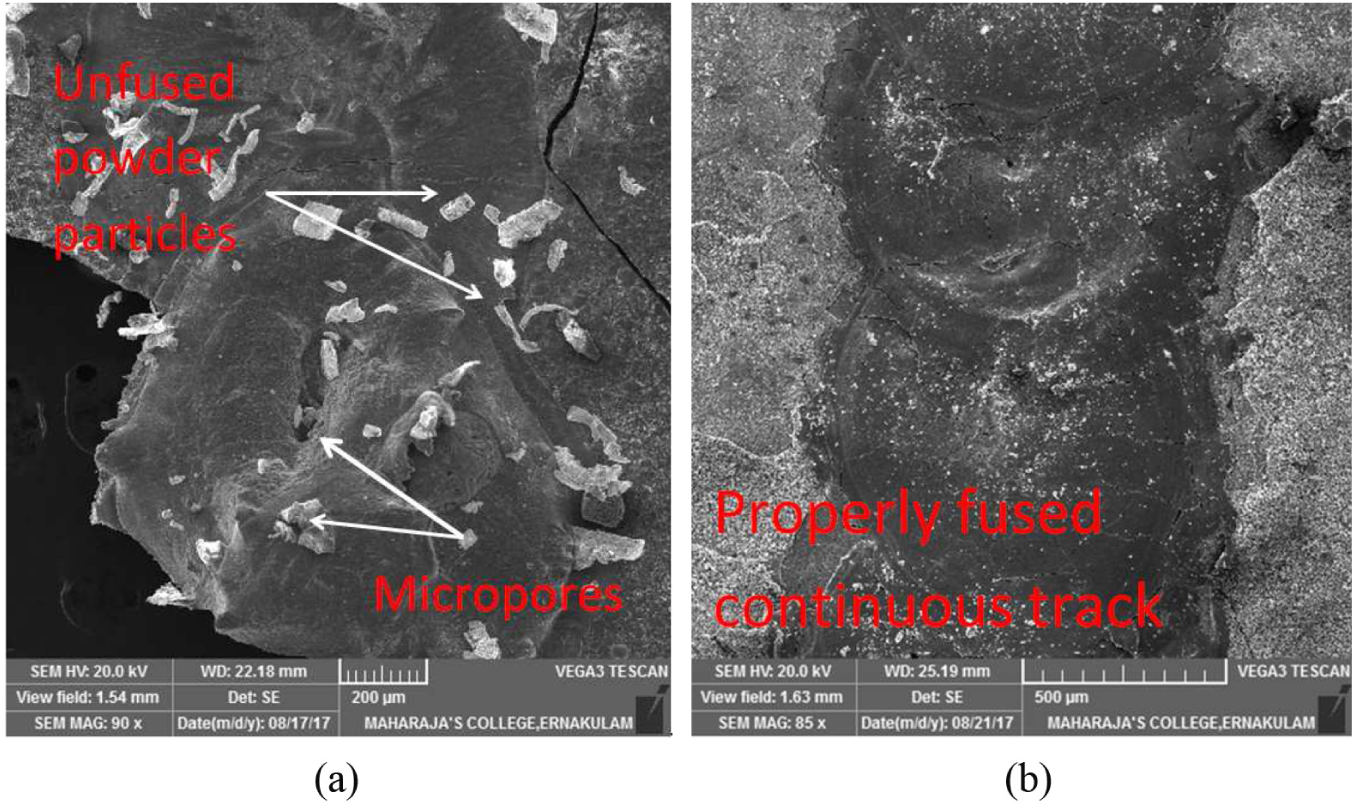
SEM images of samples at (a) power 30 W and (b) power 45 W.
Observing the SEM image of 30 W power, it is seen that the powder is not properly fused to the substrate, and also, the presence of micropores are detected at low power as observed by many researchers. 31 At 45 W power, the powder was correctly bonded to the substrate which is shown in Figure 26(b). At this power, the porosity is minimum. Hence, 45 W has been selected as optimum power for laser melting process.
Maintaining power of 45 W, the laser speed was varied, and some other defects are found in the samples. Figure 27(a)–(c) indicates surface characteristics of samples at different laser speeds.
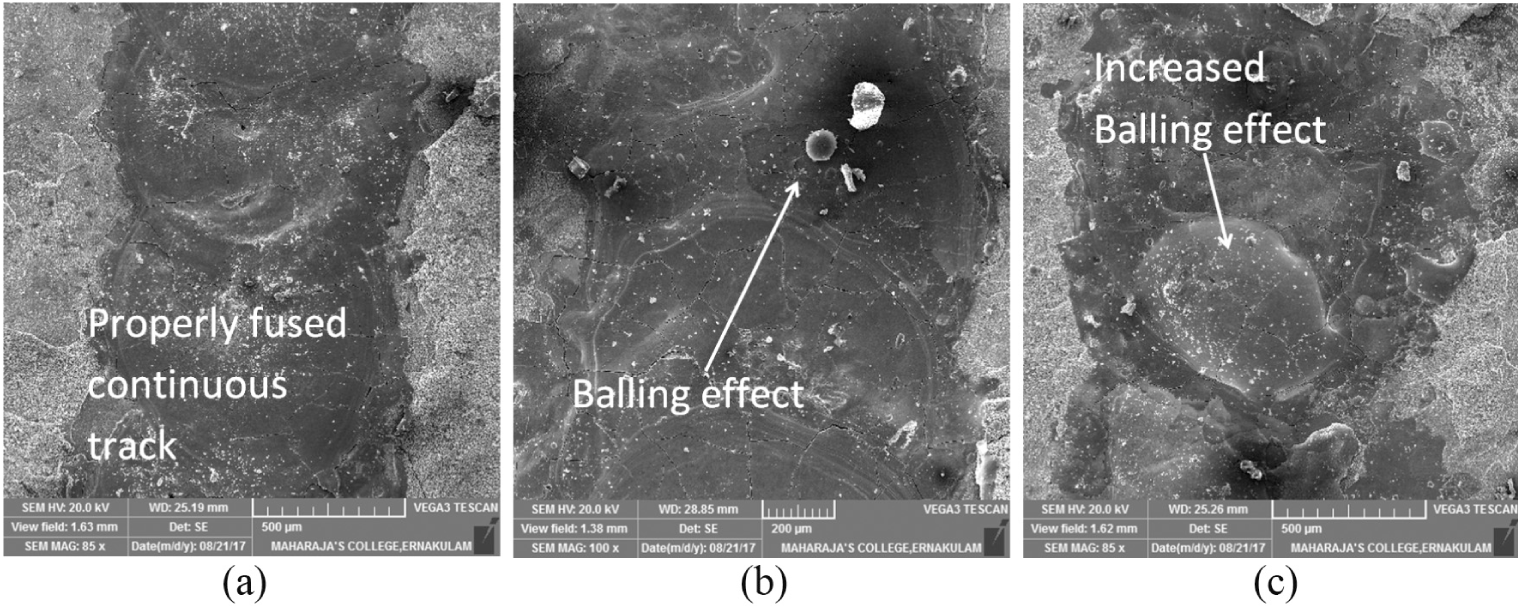
SEM images of samples with laser parameter (a) P = 45 W, V = 20 mm/s, D = 2.5 mm; (b) P = 45 W, V = 25 mm/s, D = 3 mm; and (c) P = 45 W, V = 30 mm/s, D = 2 mm.
The substrate with laser speed of 20 mm/s is shown in Figure 27(a). The surface of the sample is defect free, and continuous track is formed without micropores. Figure 27(b) and (c) shows the samples at 25 and 30 mm/s laser speed, respectively. The balling phenomenon is identified in these two samples. The balling effect is observed as coarsened balls or as micrometer-scaled balls. When the power is low, due to the lower energy input, the viscosity of the melted powder will be considerably higher. So, the particles in the area where laser beam was applied, aggregate into individual spheres and no bonding will be formed between these spheres. This phenomenon is called coarsened balling due to the limited liquid formation as observed by various researchers.
The next type of balling causes due to the variation in laser speed. The relation between linear energy density and laser speed is given by the equation (11)
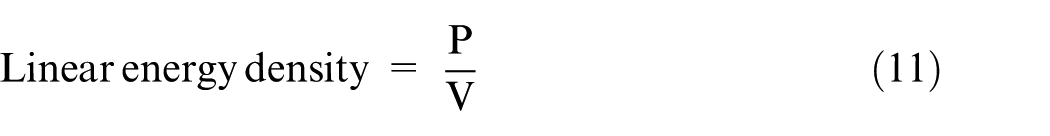
When the laser moves fast, the temperature and laser diameter decreases. During this condition, small-sized liquid droplets will be formed, which is the micrometer-scaled balls as explained by D Gu and Y Shen. 32 From the Figure 27(b) and (c), it is noticed that at 25 and 30 mm/s laser speeds, the balling phenomenon increases due to the increase in speed. The balling effect is related to linear energy density, which is further influenced by the laser power and speed. Comparing the numerical and experimental results, the optimum parameter for the better quality laser-melted track was found when keeping the laser power at 45 W, laser speed 20 mm/s, and the laser diameter at 2.5 mm/s.
Conclusion
A detailed numerical study was done considering the Gaussian heat distribution, and a finite element model was designed to study the temperature distribution. In the numerical model, the factors like energy penetration and absorptivity were also considered. By varying the laser process parameters, an experimental study was conducted and following conclusions are drawn.
The density of the part depends on the absorptivity of the powder. When the optical depth has increased, the absorptivity of substrate decreases and powder absorptivity increases.
The maximum temperature at the laser center increases for all parameters when the laser moves from starting point to the final point due to the influence of laser heat energy in the previous track.
When the laser power increases from 30 to 75 W, the maximum temperature also increases from 625 to 773 K, respectively.
When the laser speed increases from 20 to 30 mm/s, the maximum temperature rises from 625 to 710 K, respectively.
By comparing the numerical and experimental investigations, it was found out that the width of the laser track increases at higher laser power and higher laser diameter. But the width of track decreases with increase in laser speed.
The depth of the laser track increases with higher laser power. Whereas, the depth of laser track decreases with increase in laser speed and laser diameter.
The microstructural study shows that at lower laser power, micropores are present. Whereas, in higher laser speed of 30 mm/s, the balling effect is apparently visible.
A better smooth continuous track was obtained at 45 W power, 20 mm/s laser speed, and 2.5 mm diameter. The powder was fused properly, and it is the optimum laser process parameter at 45 µm powder layer thickness.
Footnotes
Declaration of conflicting interests
The author(s) declared no potential conflicts of interest with respect to the research, authorship, and/or publication of this article.
Funding
The author(s) disclosed receipt of the following financial support for the research, authorship, and/or publication of this article: The authors thank the Science and Engineering Research Board (SERB), Government of India, for their financial and technical support of this project (Grant No.: YSS/2015/001100).