
Abstract
In this article, geometrical distortions of steel structures due to laser beam welding were analyzed. Two 700-mm-long U-beam structures were welded in overlap configurations: a double U-beam structure and a U-beam/flat structure. The structures were in different material combinations from mild steel to ultrahigh-strength steel welded with different process parameters. Different measures of distortions of the U-beam structures were evaluated after cooling. Significant factors of the welding process and the geometry of the structures were identified. Furthermore, welding distortions were modeled using two predictive finite element simulation models. The previously known shrinkage method and a newly developed time-efficient simulation method were evaluated. The new model describes the effects of expansion and shrinkage of the weld zone during welding and material plasticity at elevated temperatures. The new simulation method has reasonable computation times for industrial applications and improved agreement with experiments compared to the often used so-called shrinkage method.
Keywords
Introduction
Lightweight design has been a trend in the automotive industry for several years to reduce environmental impact of its products. 1 Numerous variants of high-strength steels have been introduced in the car body, making thinner structures possible without renouncing important properties such as strength, stiffness, and crashworthiness in order to reduce weight. 2 Ultrahigh-strength steel (UHSS) is suitable for several applications within the automotive industry such as front and rear bumper beams, door reinforcements, windscreen upright reinforcements, B-pillar reinforcements, floor and roof reinforcements, and roof and dash panel cross members.
Laser beam welding (LBW) is a high-productivity welding method suitable for joining the mentioned UHSS components. Resistance spot welding (RSW) has historically been the dominating joining method for body-in-white, but LBW may offer advantages in respect of productivity, precision, strength, visual quality, and new design opportunities. 3
Due to the introduction of thermal strains into the material and due to the asymmetry of the sheet structures, welding will cause expansion and shrinking during welding which results in geometrical distortions. As described in a study investigating LBW of thin-sheet aluminum, due to the very nature of the process, LBW induces highly non-uniform residual stress and distortion into the structure. 4 It is necessary to minimize these distortions and keep them within given tolerances for industrial production. If not, geometrically important points for assembly can be displaced several millimeters resulting in gaps causing low product quality and risk of costly post-welding adjustments. 5 Compared to thick-section welding (thickness > 5 mm), which has been studied extensively, thin-sheet welded structures are more sensitive to distortions due to their lower stiffness. 6 A compilation work shows that one research focus in the field during the first decade of the 21st century has been to predict the distortions. 7 The compilation also shows that distortions in thin-sheet structures mainly have been studied for materials for aeronautical applications, such as aluminum and Ni-base steels, 7 or other joining methods, such as laser–arc hybrid welding, 8 RSW, 9 and self-piercing riveting 10 but seldom for thin-sheet automotive applications and LBW. In addition, attempts have been done to predict residual stresses after welding. 11
An early analytical model of the welding process was published by Rosenthal, 12 which described the temperature field near the weld using a moving point source. The model was later refined by Swift-Hook and Gick 13 using a moving line source, more accurate for deep penetration laser welding. Goldak et al. 14 developed a heat source model named the double ellipsoid which today is common method to model arc welding heat sources. However, for deep penetration methods, such as LBW, the model has been seen to be insufficient. In recent articles, a conical Gaussian heat source has been used to model the moving LBW heat source to predict distortions in butt-joint specimens in steel 15 and titanium alloys 16 and lap-joint specimens in stainless steel 17 and aluminum alloys. 18 Research efforts have also been made to reduce welding distortions in butt-welded joints by optimizing welding sequence. 19
While more recent welding models include advanced material modeling 20 and transient behavior of the specimens, they are extremely time and computer-power demanding. 21 Meanwhile, another parallel research trend has been to simplify and rationalize models to reduce computation time and material data requirements to model larger structures.
One often used assumption is that cooling contraction is the dominant source of distortions, as early proposed by Okerblom. 22 The so-called shrinkage model was proposed to predict distortions based on this assumption. 23 Another similar model to increase efficiency is the inherent strain method. 24 The shrinkage model applies an instant reduction of temperature in the region near the weld during one computation step, modeling the cooling contraction. The reduction of temperature is equal to the temperature difference from the solidification temperature to ambient temperature. The model was used for both simple idealized geometries 25 and more complex geometries 26 albeit with post-welding calibration.
However, the shrinkage model includes several simplifications, which reduces the accuracy of the model; it uses ambient temperature material data and only takes the cooling contraction into account but not the heating expansion. As material softening and austenitization take place during heating and significant thermal strains are also introduced during heating, it is of interest to investigate refinements of the shrinkage model to improve accuracy.
As explained above, a large proportion of the work on distortion due to welding is applied to thick plate structures. In such applications, different distortion behaviors occur and certain approximations can be suitable to reduce computation time but still maintain prediction accuracy. This article is however focused on thin-sheet structures, and the target is to find suitable approximations for such applications.
In this article, the traditional shrinkage method has been compared to a new local–global (LG) model which combines detailed local thermal modeling of the laser’s interactions with two sheets with efficient global mechanical modeling of the structural response. The entire welding sequence will be considered including heating, melting, solidification, and cooling. The model will also take into account the variation of mechanical properties such as flow stress during the welding process. The main assumption is that the temperature field can be applied to the entire weld length instantaneously. In this way, a significant reduction in computational effort can be obtained compared to a full description of the successive laser welding process with a detailed description of the time evolution of the thermal and mechanical response of the entire structure.
This article will apply the LG model to three different material grades, two different component geometries, and three different heat input levels from the laser welding process, in total 18 different configurations. Welding was done on hat profile beams resembling the geometry of A-pillars and B-pillars in automotive body-in-white structures. The predictive capacity of the LG model will be compared to that of the shrinkage model by agreement to the experimental results. Furthermore, the computation times of the two models will be evaluated.
Experimental methods
In this study, three steel materials were used: a mild steel of tensile strength of approximately 200 MPa, a dual phase DP800 steel of tensile strength of approximately 800 MPa, and a press hardened boron alloyed 22MnB5 steel with a tensile strength of approximately 1500 MPa. The maximum alloying contents of the materials are shown in Table 1. The sheet thickness of all materials was 1 mm.
Chemical composition of investigated steels.
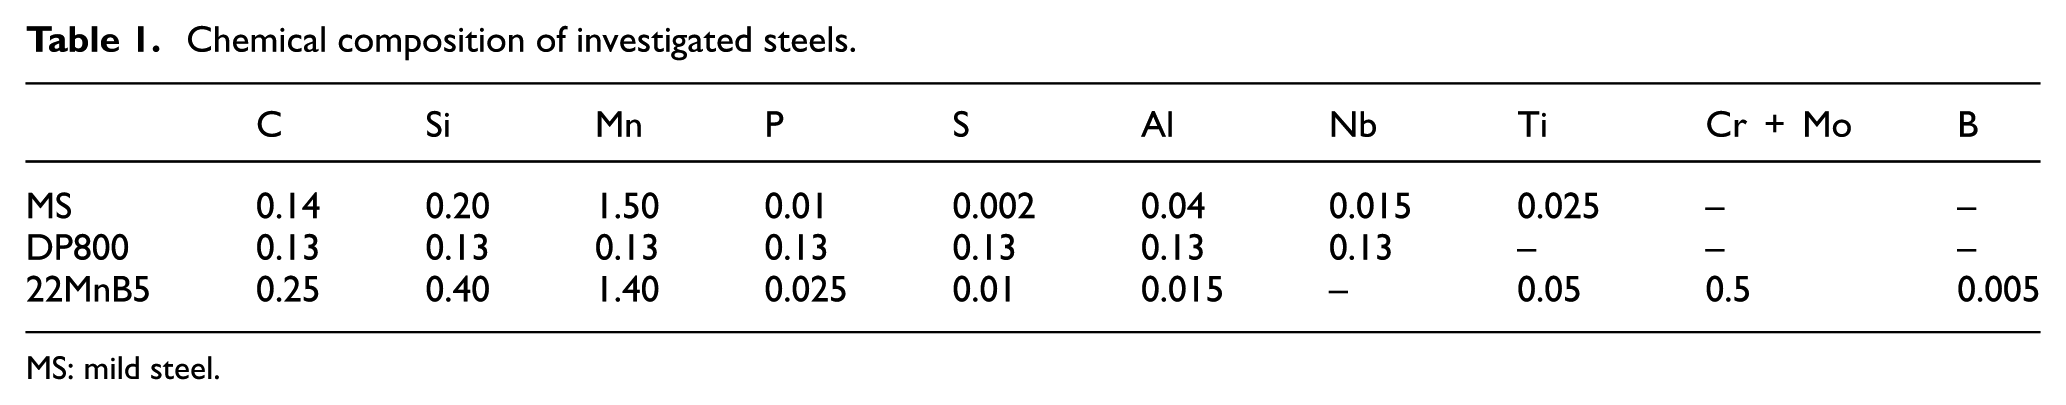
MS: mild steel.
The two lower grade steels were cold formed into U-beam shapes, while the higher grade steel was hot-formed into U-beam shapes. By combining a U-beam, as seen in Figure 1, and a flat sheet, two geometries were generated. First, the U-beam combined with the flat sheet, henceforth referred to as the single hat profile and second, two U-beams, henceforth referred as the double hat profile. The U-beam length was 700 mm. The same steel grade was used for both sheets in each case.
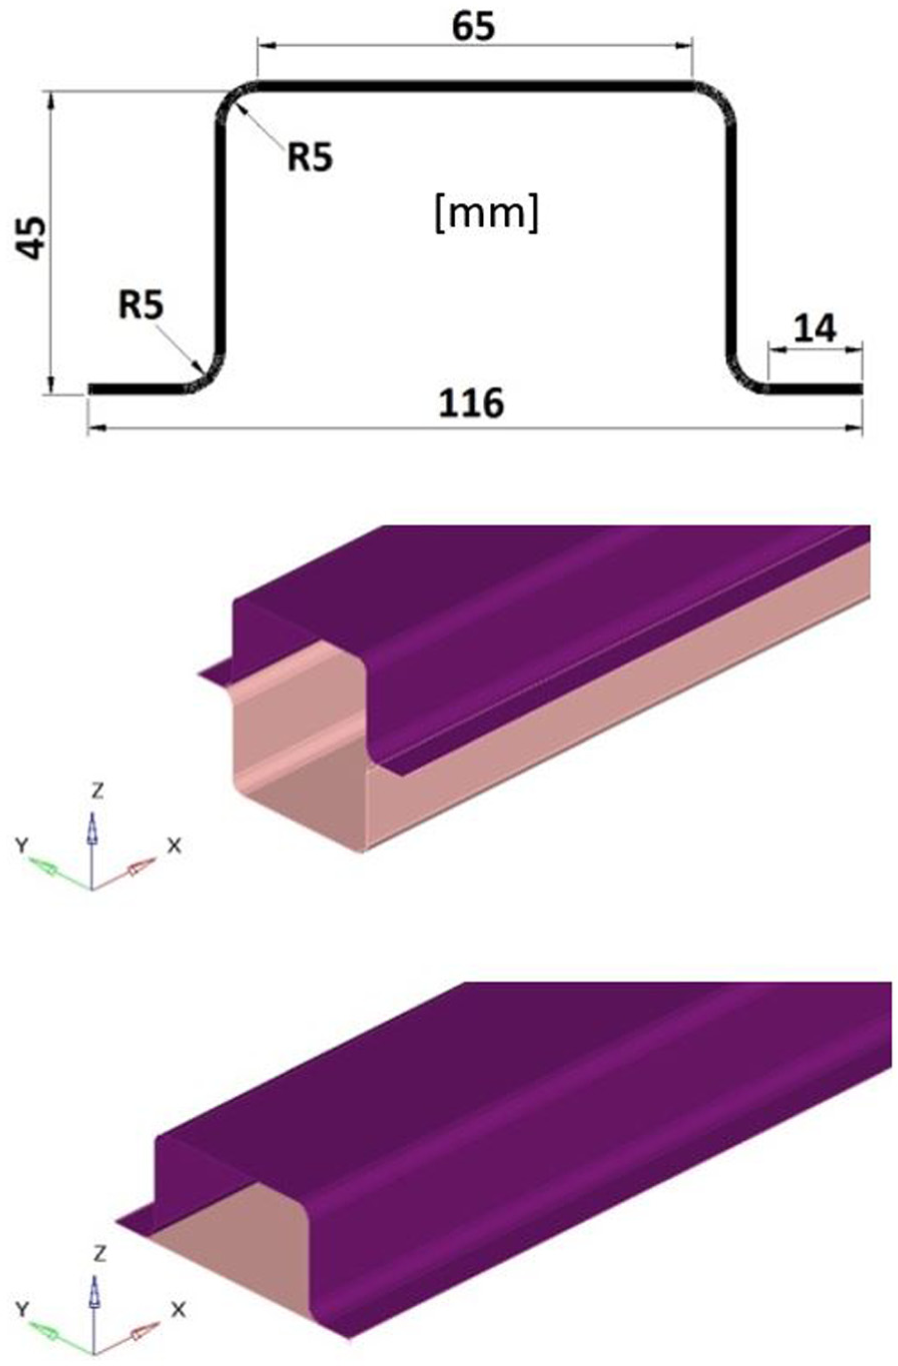
Cross-sectional data (top) and single hat (bottom) and double hat (middle) geometries.
The profiles were mounted in a specially designed pneumatically controlled fixture, shown in Figure 2. In the fixture, the beam flange edges were resting on a wall, which hindered downward vertical displacement. Furthermore, five clamps, 40-mm-wide, on each flange held the flange edge with a downward vertical pneumatic pressure of 4 bar. The clamp details are shown in Figure 2. The beams were welded along the center of the flanges in a pattern indicated by the red arrows in Figure 2, with a Trumpf HL4006D Nd:YAG laser with a spot size of 0.6 mm focused at the upper surface of the top sheet. Compressed air with a lateral flow of 25 L/min was used as shielding gas. The total weld length per flange was 690 mm. Three welding velocities were used: 1.5, 3.5, and 7.5 m/min all at a nominal peak power of 4000 W resulting in heat inputs per length of 32, 69, and 160 J/mm.
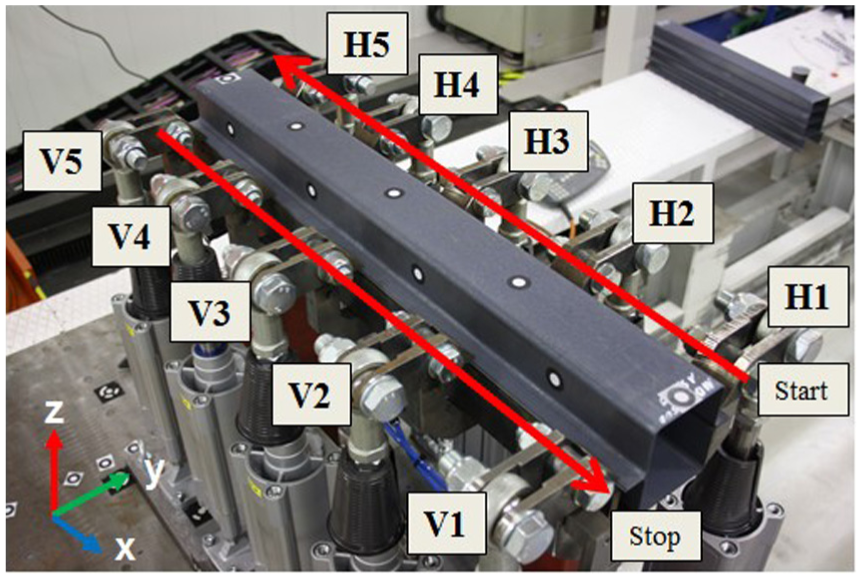
Welding fixture with beam, welding directions, measurement points, and clamping.
After welding was finished, the clamps H5 and V5 were released after 180 s. After another 10 s, the clamp pairs HV4-HV2 were released in sequence. Finally, H1 and V1 were released after 30 s.
After the welding, cooling and unclamping the beam geometries were measured and compared to measurements before clamping. For the single hat geometry, where longitudinal bending was the dominant distortion mode, the shorter edge was clamped to a flat surface and the deflection of the opposite end was measured using a digital caliper. For the double hat geometry, where transversal distortions (widening and narrowing of the beam width) were dominant, the total width of the profile was measured using a digital caliper at both shorter edges and at the beam center. The measurement methods are illustrated in Figure 3. The specimens were measured before and after welding to isolate the geometrical change due to welding. Each welding case was duplicated three times with dimensional measurements. Both mean values and deviations were used for analysis.
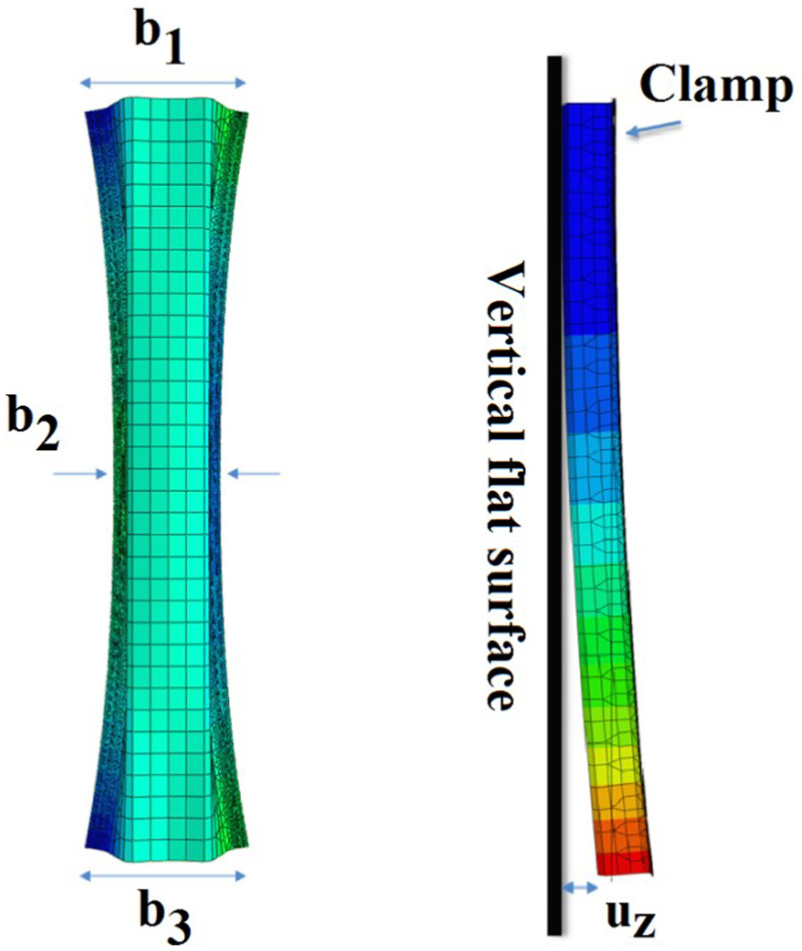
Measurement of deflection of single hat beam (right) and transversal distortions of double hat beam (left).
Finite element models
In the simulation study, two models were developed, investigated, and compared in terms of predictive capability and computation time. The two models deviate in terms of modeling of weld heat source and material data, as described in more detail below. All computations were performed in Abaqus using a 16-core Intel Itanium 1.6 GHz hardware setup.
Shrinkage model
The shrinkage model replaces the moving conductive heat source of a full transient model with a reduction in temperature near the weld line. The reduction in temperature is imposed by reducing the temperature of the nodes in the shell elements near the weld during one computation step. This temperature gradient during the computation step imposes thermal strains to the elements which results in deformations in the model. The length of the temperature field in the welding direction is equal to the weld line. The width of the temperature field in the transversal direction is equal to the width of the plasticized zone. The plasticized zone is assumed to be twice as wide as the molten zone, according to software support by email (Uings R, 6 March 2013). Thus, the width is dependent of physical post-welding examination of the weld results. The weld width was obtained from metallographic sections and measurement at the mid-thickness of the sheets from different heat input levels.
The temperature gradient applied to the plasticized zone is equal to the difference between the solidification temperature of the materials and the ambient temperature (ΔT = –1490 K).
The clamping is modeled by constraining displacements in all directions at the nodes near the clamps. After the temperature gradient has been imposed, the boundary conditions of the clamps are released to model the unclamping sequence. At the weld line, 6-degree-of-freedom (DOF) beam elements are used to connect the upper and bottom sheets in the overlap weld.
The shrinkage model consists of quadrilateral shell elements (type: Q4S), and the simulations are performed in steps corresponding to clamping, cooling, and unclamping. In an additional final step, a boundary condition, which imposes a similar situation as the measurement situation is imposed.
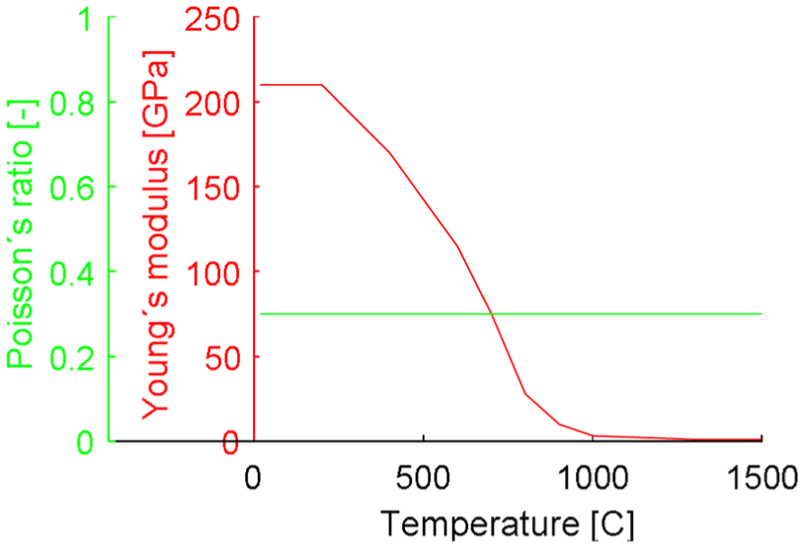
The material model of the shrinkage model is defined by the elastic and plastic material data at ambient temperature in Figures 4 and 5. The thermal expansion coefficient is set to 1.2e–5 K−1.
Elastic material data.
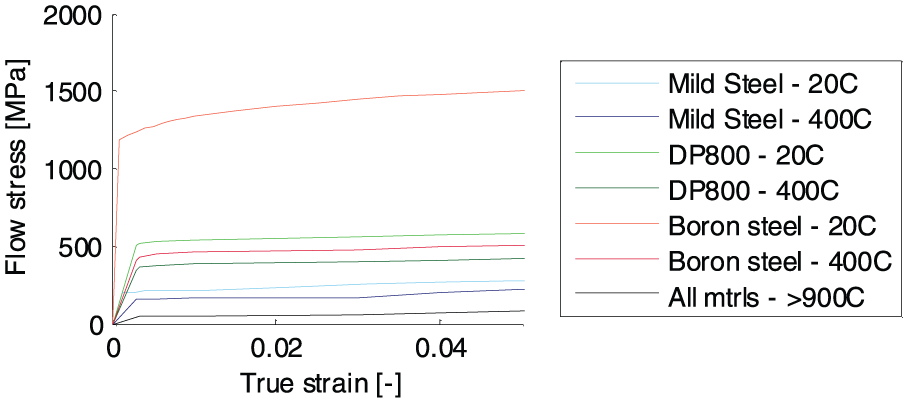
Plastic material data.
LG model
The second model, the LG model, is a refinement of the shrinkage model but is still computationally efficient compared to a full transient analysis. It is a further development in terms of weld heat source modeling and material modeling as explained below.
A thermal model was developed to compute the temperature history near the weld region. In addition, a global static mechanical model was used to find geometrical distortions of the structures due to the thermal strains imposed by the weld heat source. The two sub-models are described separately below.
Local thermal model
As explained above, the shrinkage model applies a reduction in temperature near the weld by applying a negative gradient to nodes in elements near the weld during one computation step. However, the temperature reduction approximation relies on physical testing and does not take the actual continuous temperature field into account. In the LG model, a more refined temperature field has been used.
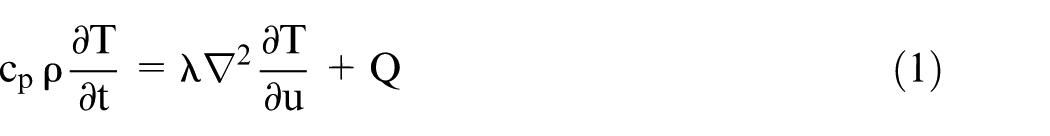
In the local thermal model, a 100-mm-wide and 100-mm-long plate was considered, composed of solid C4DQ heat transfer elements. The heat transfer problem (equation (1)) was solved
The external heat source, Q, is modeled as a moving cylindrical heat source, a phenomenological model of the keyhole created during laser welding, which is approximated to have no variations in the thickness direction as defined below
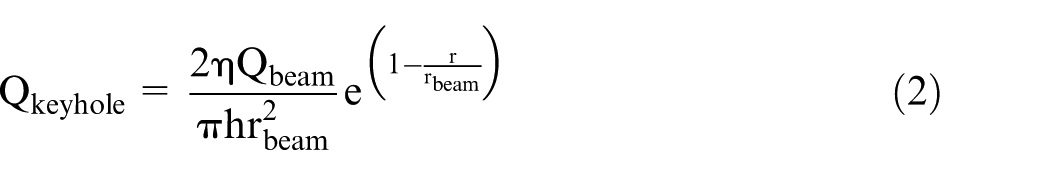
where η is the beam efficiency (assumed to be 70% 15 ); Qbeam is the nominal power output of the laser beam (4 kW); h is the total thickness of the sheets, assuming full penetration of the weld (2 mm); rbeam is the beam radius at the focus position (0.3 mm); and r is the radial coordinate, which is moving across the center of the plate sheet at a velocity of 1.5, 3.5, or 7.5 m/min, respectively.
The thermal boundary conditions of the problem are defined by the Stefan–Boltzmann law for radiation (using Stefan–Boltzmann constant, σ = 5.67e–8 W m−2 K−4 and surface emissivity, ε = 0.8) and a thermal convection of 10 W K−1m−2 at the sheet surfaces and an ambient temperature of 20 °C. The parameters of the thermal boundary conditions were adopted from the work of Van der Aa. 27
The thermal material data can be seen in Figure 6 and were identical for all steels. The density and specific heat data were obtained by the software Thermo-Calc,
28
and the conductivity was obtained by the software
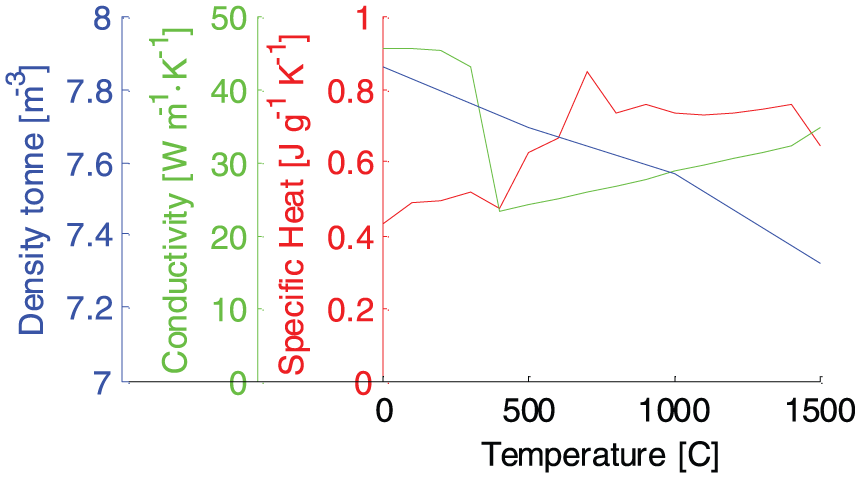
Thermal material data.
The transient temperature solution to the heat transfer problem gives the temperature as the laser source moves along the sheet. The peak temperatures perpendicular to the weld, see Figure 7, are used to define a new temperature field. This temperature field, as opposed to the shrinkage model, captures the continuously varying temperature at a distance from the weld. Temperatures above the solidus temperature are treated as solidus temperature as no thermal strains are imposed in the liquid phase.
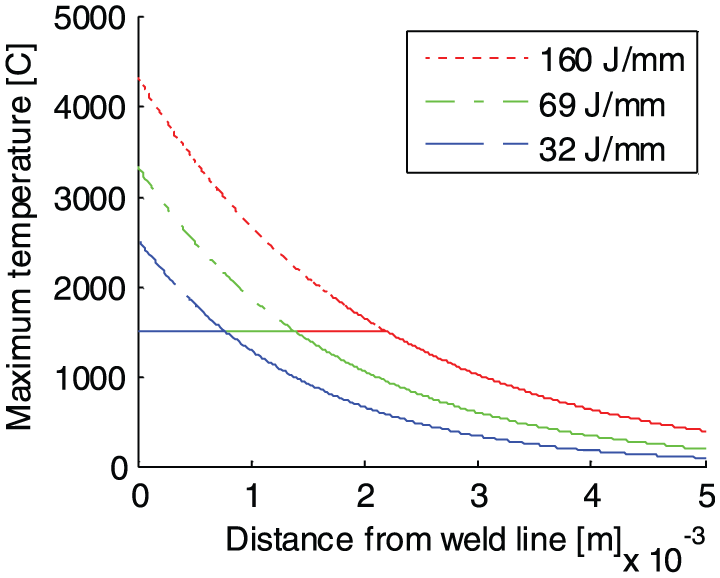
Maximum temperature profiles (dashed) and temperature field for global model (solid).
Global mechanical model
The temperature fields of the local model in Figure 7 were translated to the mechanical model. The temperature gradient is assumed to be identical along the laser weld. This means that the successive movement of the laser is not described. The temperature field is applied to a global Q4S shell element model, which modeled the entire geometry of the beam. In contrast to the shrinkage model, the temperature field in the first mechanical step is positive and followed by a second computation step where the temperatures are retracted to ambient initial state. In other words, the model simulates both the heating and the cooling during welding. The simulations show that both steps generate plastic strains, which underpins the need for modeling a full temperature cycle including both heating and cooling. The clamping, the overlap weld connection, and the measurement state are modeled identically as in the shrinkage model.
The material model of the mechanical model uses temperature-dependent elastic and plastic data at elevated temperatures as seen in Figure 5. As in the shrinkage model, the thermal expansion coefficient is uniformly set to 1.2e–5 K−1.
Distortion results
The hat profiles were welded according to the experimental campaign described above. A number of factors, which significantly affect the mode and magnitude of the final distortions have been identified, namely, structure geometry, weld heat input, and sheet material grade. These factors are treated separately below.
Effect of structure geometry
As described above, the single hat and double hat behave geometrically different after welding. The single hat was dominated by significant longitudinal bending, whereas the double hat profile was dominated by significant global transverse distortions, resulting in a characteristic hourglass-shaped profile.
The longitudinal bending distortion mode is created due to axial shrinkage forces. As the weld lines are not on the neutral plane of the cross section, a bending moment is created due to the shrinkage forces as the weld is cooling down. On the contrary, in the double hat profile, the weld line is on the neutral plane of the cross section resulting in negligible bending stresses.
Additionally, the flat sheet of the single hat profile adds extensive transversal stiffness to the structure hindering transverse shrinkage or expansion, which was noticed to be negligible throughout the profile length. Consequently, the formed sheets of the double hat profile are considerably more prone to transversal distortions, and the hourglass shape is clearly noticed after welding and cooling.
Effect of weld heat input
A common method of mitigating welding distortions is by reducing heat input, by increasing welding velocity, which also reduces cycle times. In the experiments, three weld velocities were tested for all materials, 1.5, 3.5, and 7.5 m/min, translating to heat input per length of 160, 68.6, and 32 J/mm. As a general rule, lower heat input creates smaller distortions but reduces weld strength and production tolerances due to the risk of lower weld penetration at the faying interface. A full penetration weld is desirable from a verification point of view since the weld penetration can be visibly observed at the bottom surface. However, only partial penetration is necessary for bonding at the faying surface and to achieve interfacial strength at the joint. A partial penetration weld also results in a smaller size of the heat affected zone which will reduce the thermal impact on the material.
As seen in Figures 8 and 9, the proportional relation between heat input and maximum deflection is clear for both single and double hat profiles and all materials show a near linear relation. The results support the argument that with higher heat input, a larger zone near the weld generate thermal strains leading to plasticity and add to the forces creating the final distortions as explained above.
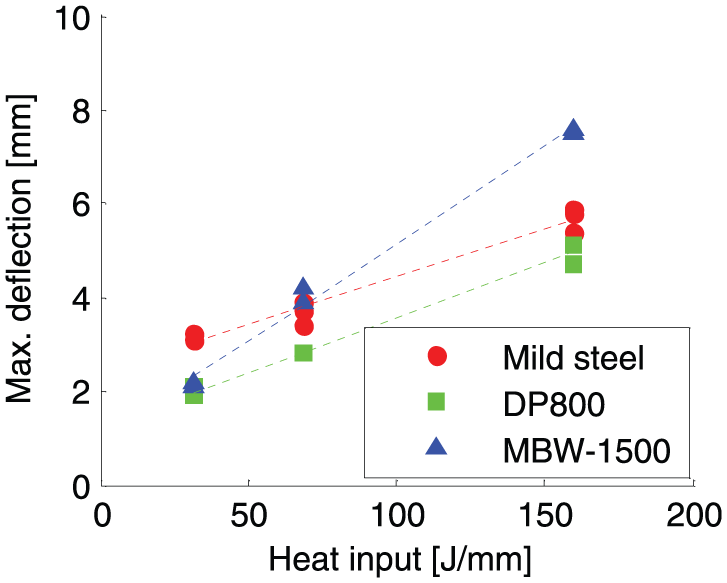
Distortions due to variations of heat input in the single hat geometry.
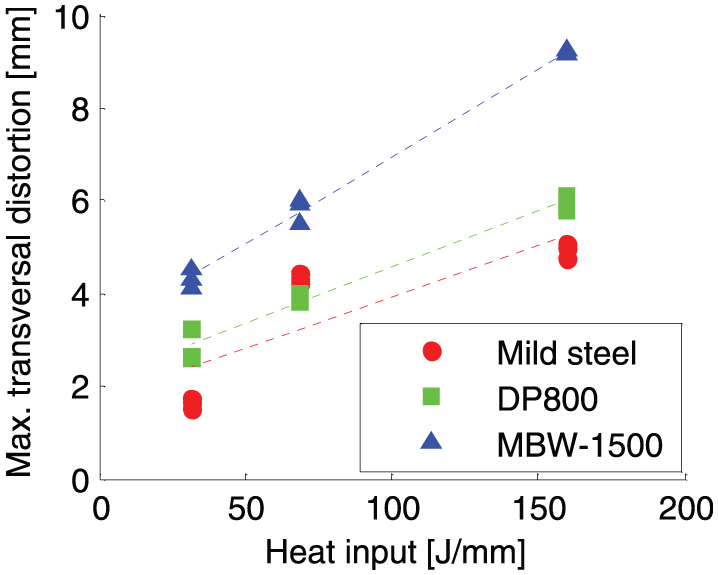
Distortions due to variations of heat input in the double hat geometry.
Effect of sheet material grade
The results of Figures 10 and 11 do not show a clear proportional relation between distortion magnitude and tensile strength, which suggest that other mechanisms are significant to the distortional behavior.
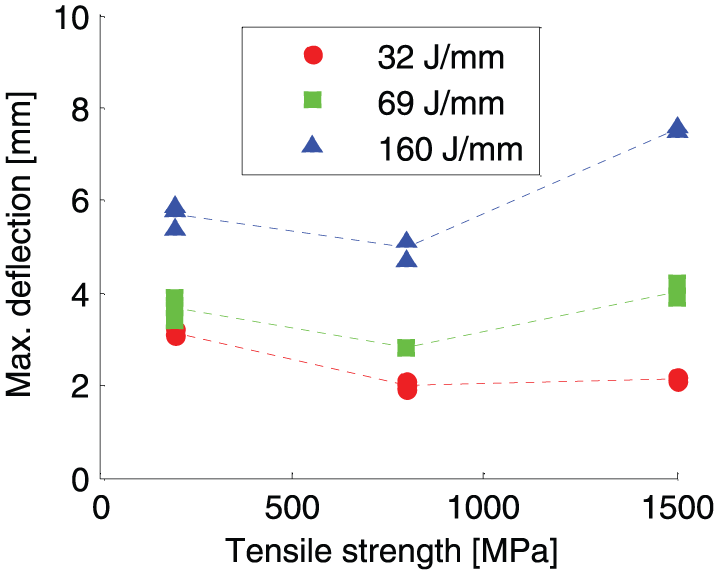
Distortions due to variations in tensile strength in the single hat geometry.
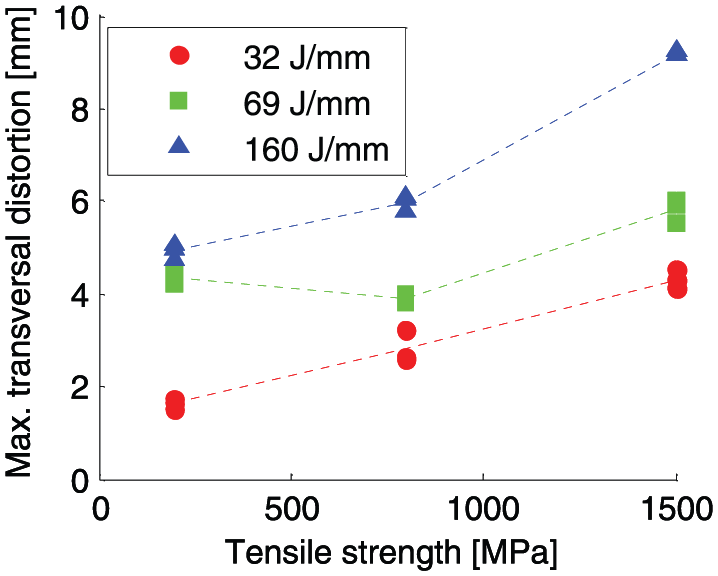
Distortions due to variations in tensile strength in the double hat geometry.
In the single hat geometry, the DP800 steel shows that lowest deformations while both the weaker and the stronger materials display larger deformations. However, in the double hat geometry, a more linear relation between distortions and tensile strength is apparent. The results suggest that tensile strength plays different roles depending on the distortion mode. In the single hat geometry, where longitudinal bending is dominant, the tensile strength has a small effect on distortions, while for the double hat geometry, where transversal deformations are dominant, the tensile strength plays a more dominant role on the magnitude of deformations.
During laser welding, the temperature drastically rises near the weld. Consequently, large thermal strains are imposed to the material, and the yield limit is significantly reduced, resulting in plastic deformations near the weld. In a higher strength material, a larger amount of elastic and smaller of plastic strains are obtained. This produces a smaller plasticized zone at the weld for a higher strength material. This difference is however less apparent at the high temperatures close to the weld since flow properties are rather similar for the different steels at high temperature, see Figure 5. During cooling, the elastic strains are relaxed and mainly the plasticized areas contribute to distortions except for remaining residual stresses. These stresses can of course be higher in the higher strength material. This argument shows that no simple relation between distortion and strength can be expected as seen in Figures 10 and 11.
Finite element model capability
As described above, two methods of predicting welding distortions by finite element (FE) modeling has been evaluated. The results for the two methods are presented below. Both methods rely on a simplified method of modeling the heat generated by the laser beam source. The models use the approximation that a superimposed temperature field can describe the dynamic temperature cycles during the heating and cooling mechanisms during the welding process.
In the present simulations, all weld seams are applied in the same computation step, due to the relatively short weld seams and the uniform geometries. However, if the effect of welding sequence is of interest, the increasing and decreasing temperature fields of different weld seams can be applied in a multi-step simulation to model the continuous distortions during the welding process.
Shrinkage model
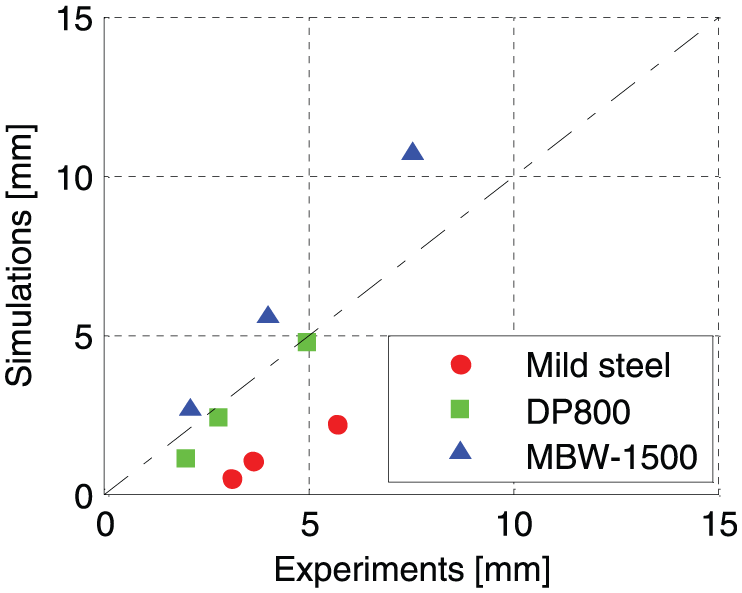
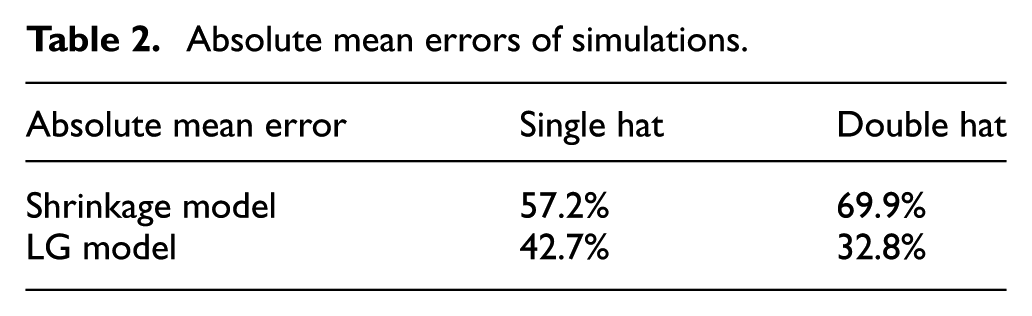
The first model, the shrinkage model, assumes that a zone at solidification temperature cooled down to ambient temperature can describe the welding process. The zone of elevated temperature is applied to the weld line with twice the weld width in the transversal direction. Hence, the size of the zone and the model as a whole are dependent on destructive testing of equivalent weld specimens. The capacity of the shrinkage model is presented by the correlation plots in Figure 12 for the single hat case and in Figure 13 for the double hat case. The absolute mean errors for the single and double hat results are 57.2% and 69.9%, respectively. The shrinkage model has simulations times in the order of 10 min.
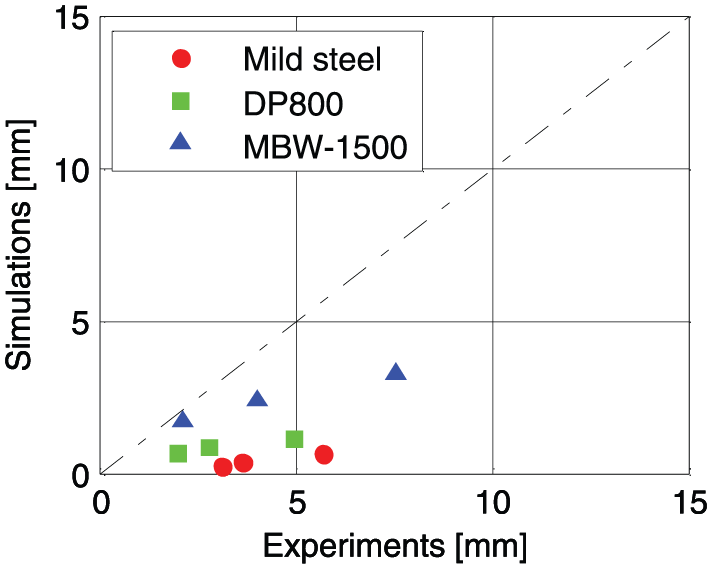
Correlation plot of maximum deflection distortion for shrinkage model for the single hat geometry.
Correlation plot of maximum transversal distortion for shrinkage model for the double hat geometry.
LG model
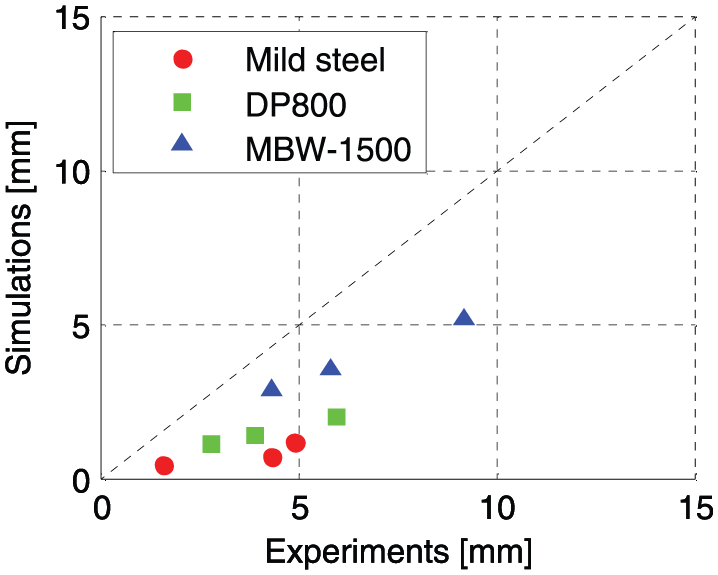
The second, LG model applies a continuous temperature field away from the weld line, which is generated from a local FE model. The LG model also differs from the shrinkage model as it models both heating and cooling of the specimen by the applied temperature field. Thus, it allows for plastic deformations and geometrical mismatches both during heating and cooling. The capacity of the LG model is presented by the correlation plots in Figure 14 for the single hat case and in Figure 15 for the double hat case. The absolute mean errors for the single and double hat results are 42.7% and 32.8%, respectively. The thermal part of the model has simulation times in the order of 3 h, and the mechanical part of the models has simulation times in the order of 20 min due to the additional computation step compared to the shrinkage model.
Correlation plot of maximum deflection distortion for LG model for the single hat geometry.
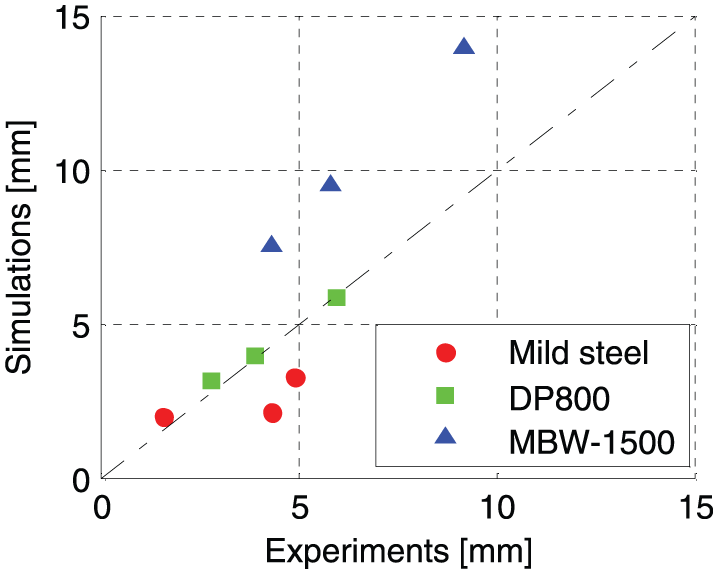
Correlation plot of maximum transversal distortion for LG model for the double hat geometry.
Both FE models capture the general behavior of the two geometries: the longitudinal bending of the single hat profile and the hourglass shape of the double hat profile. Furthermore, both models can capture the general effect of variations in heat input.
As Table 2 shows, the LG model has a higher accuracy than the simpler shrinkage method. The results suggest that a higher detail than the simple temperature reduction used in the shrinkage model must be used in order to accurately model the effect of the laser heat source and the resulting thermal strains. The results also suggest that the deformations during both heating and cooling should be considered in order to accurately predict the geometrical changes during the weld cycle.
Absolute mean errors of simulations.
Regarding sheet material, the difference between the models is more apparent. At higher temperature, the steel types behave more similarly compared to room temperature. Thus, during welding, where the material plasticizes at high temperatures near the weld at high temperatures, the definition of the plastic behavior at high temperatures is critical to model the distortions accurately.
Both simulation models have computation times which are significantly shorter than an equivalent transient model, which may take much longer time to complete. The shrinkage model and the mechanical part of the LG model take in the order of 10 and 20 min, respectively, for a typical computation. The local part of the LG model takes typically approximately 3 h of computations. The relatively short computation times increase the engineering usefulness of the modeling approach. It should also be noted that the local part of the LG model is only necessary to perform once for each welding parameters setup. Thus, for example, the results of thermal analysis can be reused for each welding sequence in a welding sequence optimization study, which increases its industrial readiness.
Conclusion
In this article, both experiments and simulations were used to investigate distortions of thin-sheet structures of steel due to overlap LBW. The simulation study covered two modeling approaches, of which one was developed in this article. The conclusions of this article are summarized as following:
Overlap LBW of beam structures create significant distortions in out-of-plane or transverse directions depending on the geometry of the structure. If the weld line coincides with the neutral plane of the structure, as in the symmetrical case, longitudinal bending distortions are negligible. If the structures includes a flat sheet, as in the asymmetrical case, the transverse distortions are minimal compared to the longitudinal bending distortions.
The effect of welding heat input is significant to the magnitude of distortions. However, no clear significance of tensile stress of the sheet material on distortion magnitude was seen. The results suggest that a combination of several effects which are dependent on tensile strength take place during welding which affect distortions.
Simplified FE models can be used to accurately predict welding deformations. In this article two models were evaluated. The previously known shrinkage model and a new extended and improved shrinkage model, a LG model, was developed which improved simulation accuracy. The LG model allows for time-efficient simulations to predict distortions due to welding. The LG model approach is general for any welding method and not limited to LBW. The LG model has somewhat longer simulations times compared to the shrinkage model but is still significantly faster compared to a full transient analysis. Implementation of the LG model would be appropriate for engineering use in industry where the demands for fast results and little pre-processing work are high. The authors suggest that the LG model’s feasibility for large scale (e.g. body-in-white or sub-assembly geometries) would be of interest to investigate.
Footnotes
Declaration of conflicting interests
The author(s) declared no potential conflicts of interest with respect to the research, authorship, and/or publication of this article.
Funding
The author(s) disclosed receipt of the following financial support for the research, authorship, and/or publication of this article: Financial support for this work was provided by the Swedish Agency for Innovation Systems through the project LaserLight (Grant No. 2012-03656).