
Abstract
Piezoelectric force sensors are widely used in precision measurement and machining applications. Sensitivity is one of the significant parameters determining the precision of these sensors. The influence of factors, such as the piezoelectric coefficient, sensor structure, and temperature on sensitivity had previously been studied except the roughness of sheets. For design optimization, the effect of roughness on the sensitivity of piezoelectric force sensors was investigated. A sensitivity model was built based on the electromechanical relationships and measurement systems. Fractal theory and classic statistics model were used to define the roughness of the sheets. The stiffness effect and thickness effect were used to probe the relationship, and two types of experiments with sheets of different roughness were performed to verify the models. The results indicated that the roughness of the sheets affected the sensitivity of the piezoelectric dynamometers due to the stiffness effect and thickness effect. In terms of the thickness effect, rough sheets induced high sensitivity; however, in terms of the stiffness effect, as the roughness decreases, the sensitivity first improved and then decreased. A method was proposed to optimize the roughness of the sheets to improve the sensor performance.
Introduction
Multi-component dynamometers are widely used in precision measurement and machining processes, such as the six-component piezoelectric balance, 1 measurement of the dynamic thrust vector of an attitude/orbit rocket, heavy force measurement in extreme situations, 2 and real-time cutting force measurements.3,4 Piezoelectric force sensors are the main transducers in multi-component measurement systems. Sensitivity is a significant parameter that not only determines the measurement precision but also affects the calibration and use in multi-component measurement systems. Therefore, it is important to investigate the sensitivity of piezoelectric force sensors.
To date, several methods were used to describe the sensitivity of piezoelectric force sensors. Typically, the piezoelectric coefficients of crystals, measured by the resonance method,
5
are used to qualitatively compare the sensitivity. For example, sensors with double sheets have double sensitivity. Additionally, langasite La3Ga5SiO4 (LGS) sheets have triple the sensitivity of quartz, as the piezoelectric coefficient
It is well known that sensitivity is affected by factors, such as the piezoelectric material, 8 temperature,9,10 preload, precision of installation, and direction of the tangential load. 11 However, the relationship between the surface topography of the sheets and sensitivity has not yet been determined. Guideline for choosing the surface roughness of the sheets is still ambiguous in the design of piezoelectric dynamometers. Therefore, the influence of the roughness of the sheets on the sensitivity of the piezoelectric dynamometers is investigated in this article.
The roughness of surface topography has a strong influence on phenomena, such as the conduction of electricity,12,13 conduction of heat,14,15 wear 16 and lubrication. 17
In resistance spot welding of aluminium alloys, the contact resistance of joints is one of the main factors that influence the quality of weldments. A contact resistance model 18 was constructed to analyse the quality and fractal parameters of joints. However, the current (10 A) through the joints is too large for piezoelectric dynamometers.
In a two-dimensional electron gas heterostructure, electron transportation and mobility are influenced by the roughness of the joint surfaces. 19 It was also found that the sheet electron density changes the electron mobility. However, the electron was transported via semiconductors while, in the piezoelectric effect, charges were induced at the electrodes.
Resistive pressure sensors must also be considered.
20
A contact resistance equation was proposed in which the resistance is inversely proportional to the square root of the load. Increasing the roughness of the electrodes improved the sensitivity. However, the contact resistance was less than
The surface roughness has a strong effect on the quartz crystal microbalance (QCM). 21 However, a QCM is based on the frequency shifts of the quartz sheets whereas piezoelectric dynamometers utilize the direct piezoelectric effect. This model was not found to be suited to the analysis of the sensitivity of piezoelectric dynamometers.
Due to the above-mentioned reasons, for a single piezoelectric dynamometer, there is a great need to build a mathematical model that links the roughness of the sheets and sensitivity.
This article presents an innovative model relating the sensitivity of piezoelectric force sensors to the influence of roughness. Measurement systems supported by charge amplifiers are utilized to modify the model. Fractal theory and classic statistics method are used to analyse the roughness of the sheets. Experiments based on quartz are carried out to verify the model.
The sensitivity model of the piezoelectric force sensors
A normal force sensor and a measurement system using charge amplifiers are shown in Figure 1. 22 The mechanical system is represented on the left, and the measurement system is represented on the right.
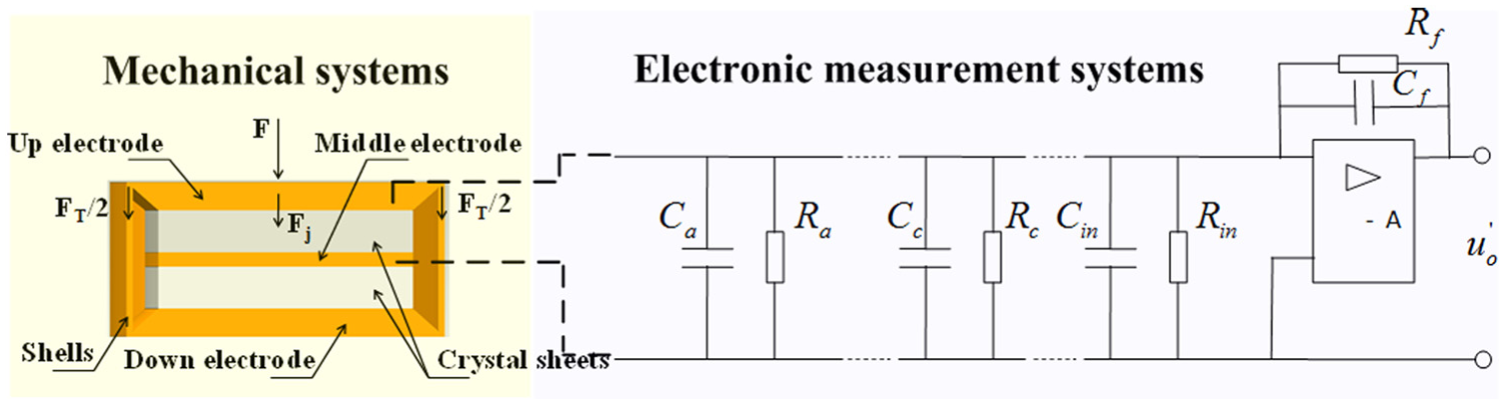
Sensors and measurement systems.
In the mechanical system,
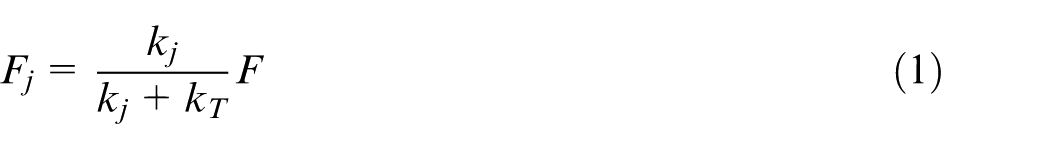
where
In the measurement system, the sensor is equivalent to a charge source with an induced charge Q. The piezoelectric crystal sheets and electrodes were considered to be the plate condensers.
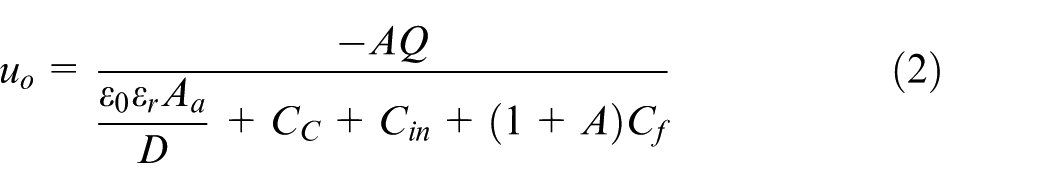
where
Assuming that
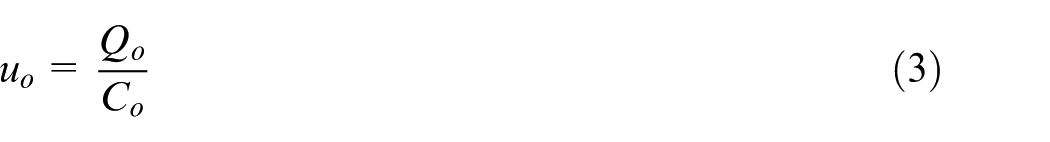
where
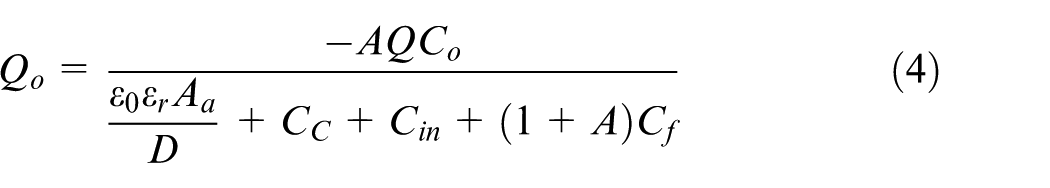
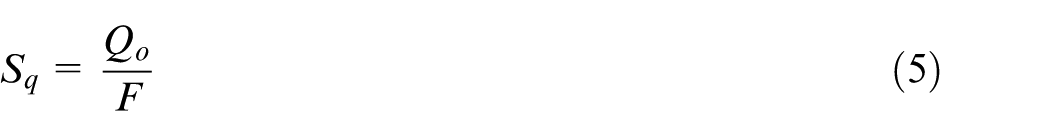
For piezoelectric force sensors, the charge sensitivity is expressed as equation (5)
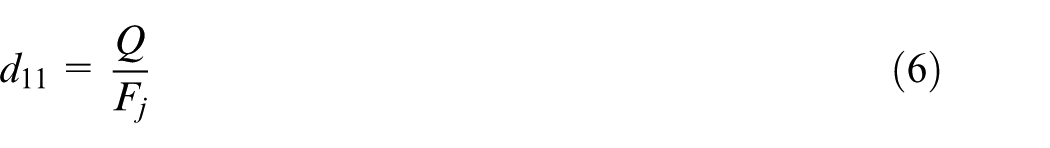
For the crystal sheets, the piezoelectric effect is shown in equation (6)
Substituting equations (1), (2), (4), and (6) into equation (5), the sensitivity model is expressed as
where

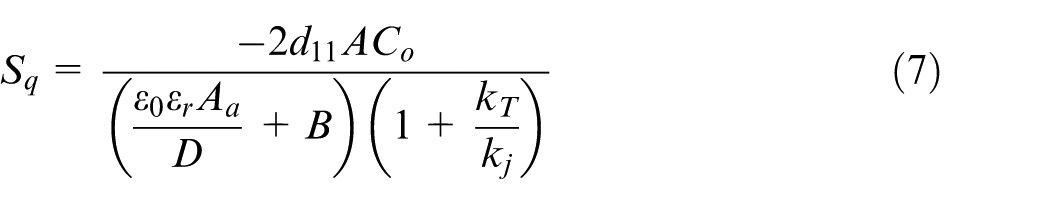
Therefore, the sensitivity of the sensors can be expressed using equation (7) where the piezoelectric coefficient
The influence of the roughness of the sheets on the sensitivity lies in the parameters
Influence of sheet roughness on the sensitivity based on stiffness effect
In piezoelectric force sensors, crystal groups consist of sheets and electrodes. The structure of the crystal group is shown in Figure 2(a). The stiffness composition, which is shown in Figure 2(c), is mainly determined by the contact stiffness of the joint surfaces (nearly 60%); the sheet roughness affects the contact stiffness. As shown in equations (1) and (7), the stiffness
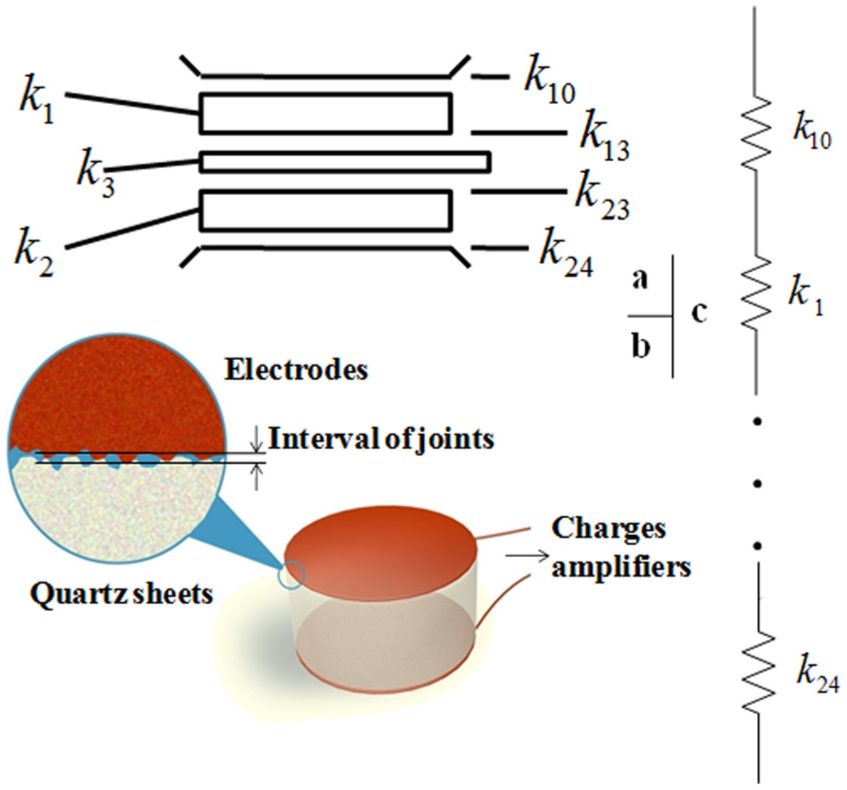
Analysis of the effect of sheet surface topography.
For one joint, the stiffness
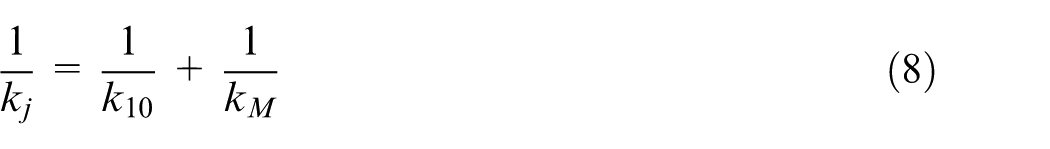
where
Therefore, the influence of the sheet roughness on the sensitivity of the piezoelectric force sensors is illuminated based on the stiffness effect.
Influence of sheet roughness on the sensitivity based on thickness effect
The stiffness effect is based on load sharing, while the thickness effect is related to the measurement systems. As shown in equation (7), the thickness of sheet D is related to
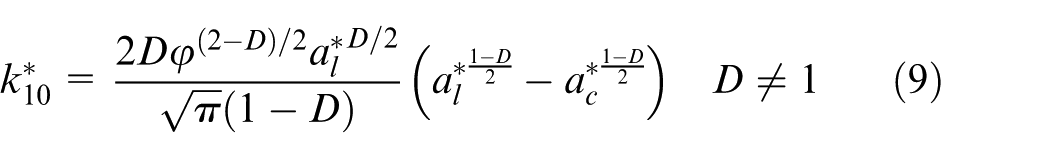
When two nominally smooth surfaces are pressed together, the joint surfaces can be represented by an equivalent model that contains a rough surface and a smooth surface. Figure 3(a) depicts the contact of two rough surfaces where asperities can be observed. Equivalent joint surfaces are shown in Figure 3(b).
Simulated structure of contact surfaces: (a) joint surface of two rough surfaces with asperities and (b) equivalent joint surface.
Asperities experience elastic and plastic deformations with load increases as the interference
where
The relationship between the mean asperity height and the mean surface height for the contact of a single asperity with a rigid smooth surface is shown in Figure 4, where R is the radius of the asperity, Z is its height, and d is the interval of the joints based on the mean asperity height. The relation of the two reference flats was as follows


where
The relationship between the mean asperity height and the surface height.
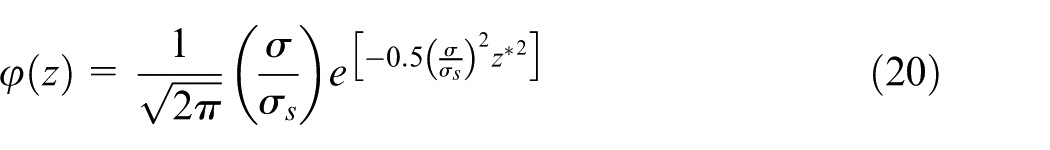
Normalizing length units by
the distribution of asperity heights is assumed to be Gaussian and is expressed as
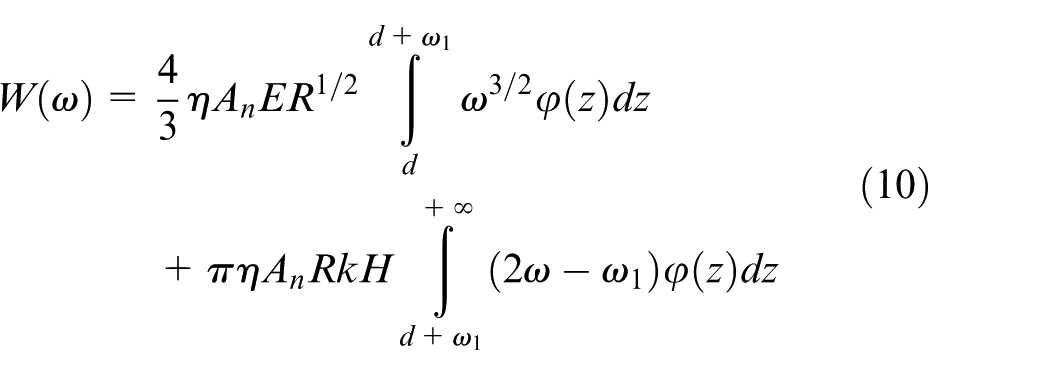
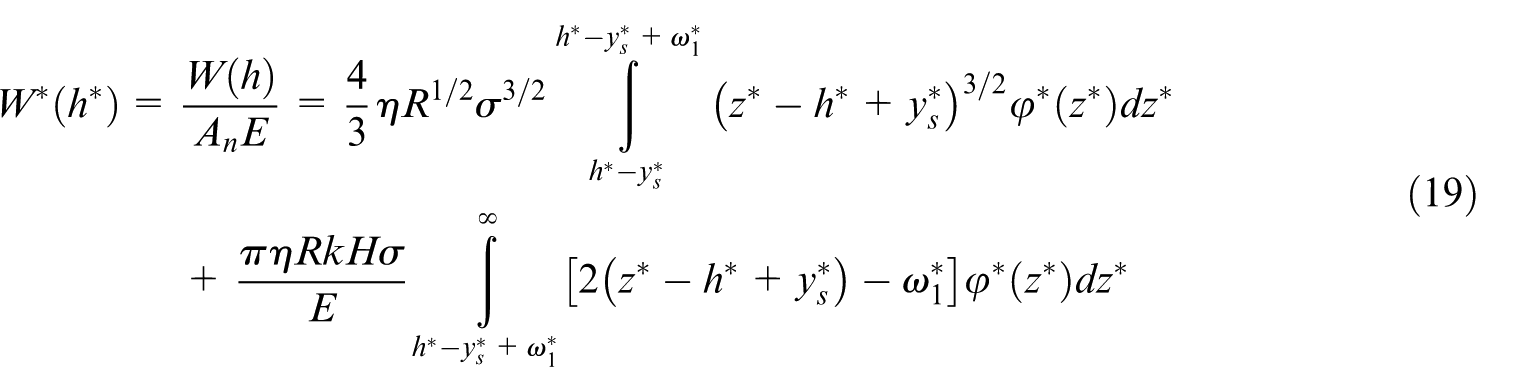
Note that equation (19) is an integral with a variable upper limit including a Gaussian function; no analytical solution could be obtained. An approximation exponential model 25 as an alternative to the Gaussian distribution is used, as shown in equation (21). Furthermore, the first integral in equation (21) could be expanded in a power series, and the solution of equation (19) could be obtained
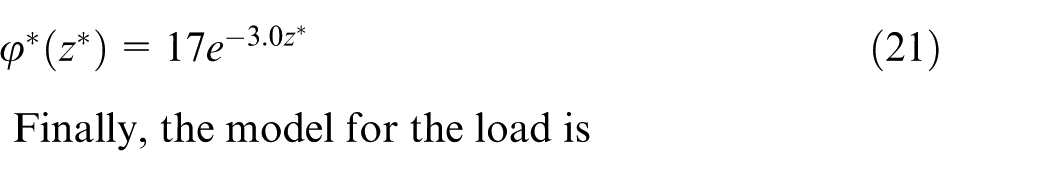
Finally, the model for the load is
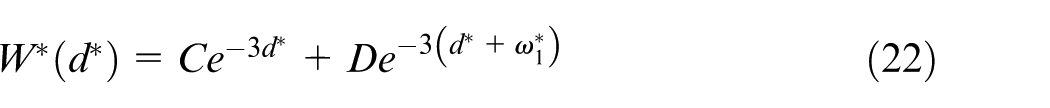
where
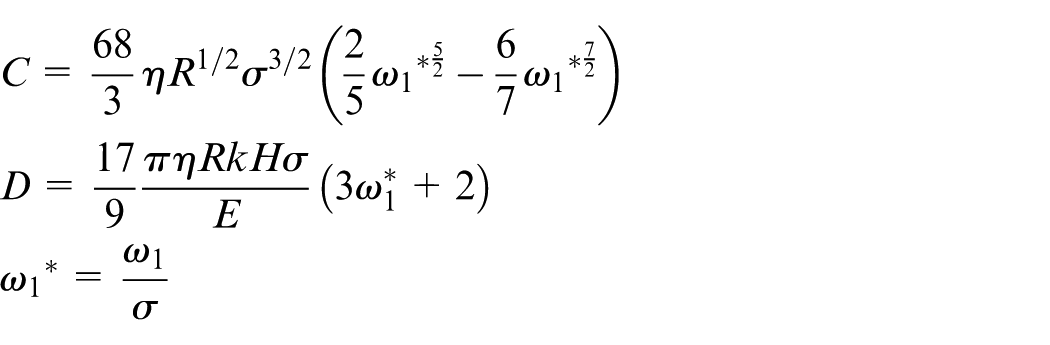
In conclusion, the relationship between the roughness and the interval of joint surfaces is summarized according to equation (22). The thickness effect model is built from a combination of this equation with equation (7).
Thickness effect experiments
The apparatus is shown in Figure 5. The top and bottom electrodes are made of stainless steel 304, and the centre electrode is made of copper. The measurement systems used charge amplifiers (5018A; Kistler, Winterthur, Switzerland). Forces are loaded using a testing machine manufactured by the Changchun Mechanical Design and Research Institute Co. Ltd, as shown in Figure 5(b).
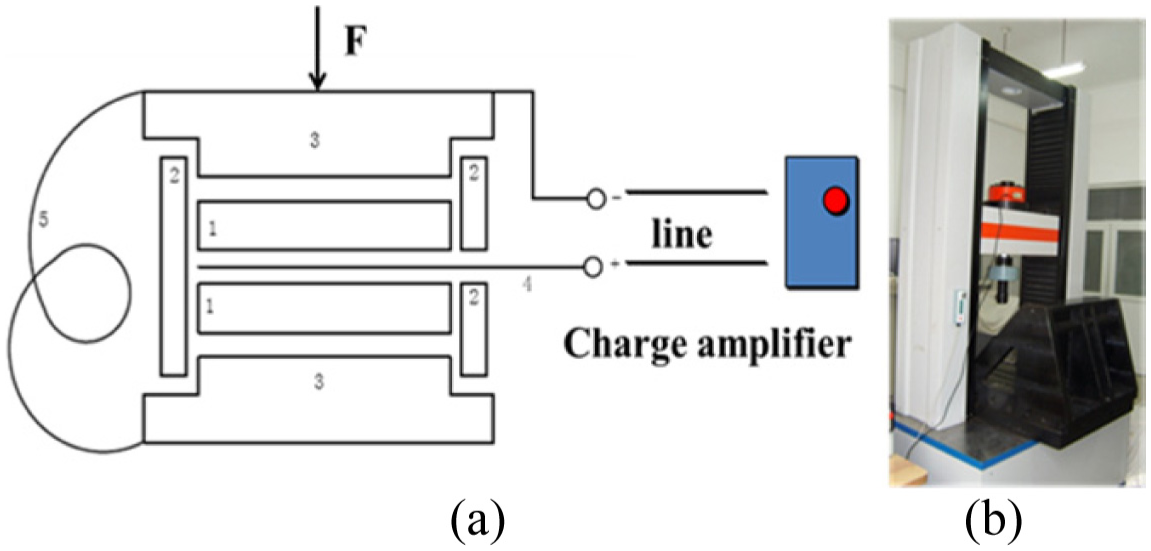
Details of the experimental setup: (a) section of the force sensor: 1: crystal sheets, 2: teflon rings, 3: vertical electrodes, 4: centre electrode, and 5: wire and (b) testing machine.
The structure simulating sensors are prepared as shown in Figure 5(a). Note that there is no outside shell. Different thicknesses of quartz sheets are machined 26 using a reciprocating diamond wire-sawing machine (STX202; MTI corp., Shenyang, Liaoning, China). The thickness is measured using coordinate measuring machines (PRISMO; Zeiss, Jena, Germany).
To verify the theory at the macro-scale, a thickness-focused experiment was performed. Quartz crystals sheets of five different thicknesses and the same roughness were prepared. The reload force is 3 kN loading with the speed of 6 mm/min, and the load is 200 N loading in 1 s. The results are shown in Figure 6. According to the piezoelectric effect, the theoretical results are the same because the load is invariant. However, the results indicate that as the thickness of the sheets increases, the measured charge increases. According to equation (7), if Q is kept invariant and the thickness of the sheets increases, the output voltage
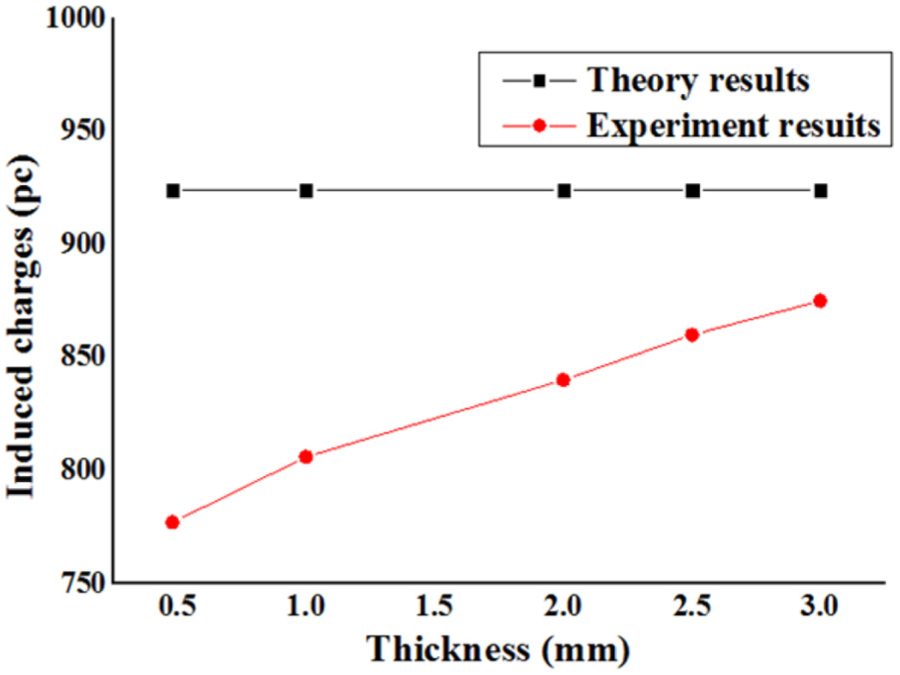
The thickness of quartz sheets and sensitivity of sensors.
The theoretical data are calculated by the resonance method, and the experimental results are measured by force-electric method. In addition, the differences between the theoretical and experimental data are also caused by loading sharing and machining error.
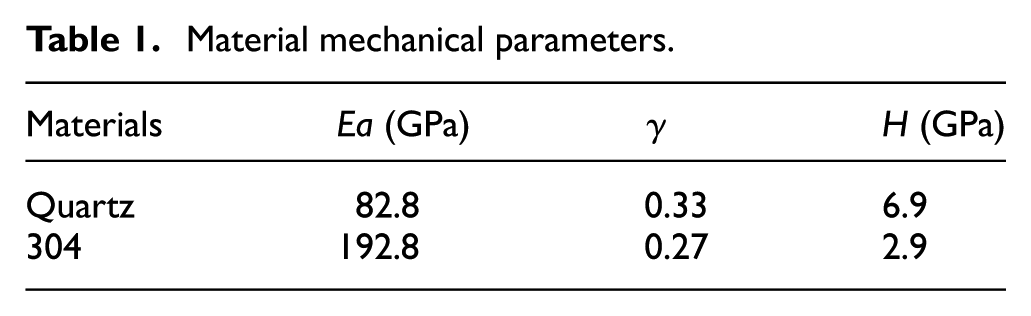
In the micro-topography field, quartz sheets are ground using sandpaper with a diameter of 20 mm and a thickness of 1 mm. Teflon rings are used to maintain the sheets aligned, meaning that their nominal area is constant. The mechanical parameters of the sheets and electrodes are measured using a nanoindenter (100BA-1C; MTS, Eden Prairie, MN, USA) and are shown in Table 1.
Material mechanical parameters.
The roughness (Ra) and the average interval of asperities (RSM) are measured using a profilometer (UPI 840; Taylor Hobson, Leicester, UK), and measurement data are shown in Table 2. The average radius of the asperities is calculated from the measurement data using the least squares method, as shown in Table 2.
Sheet roughness.
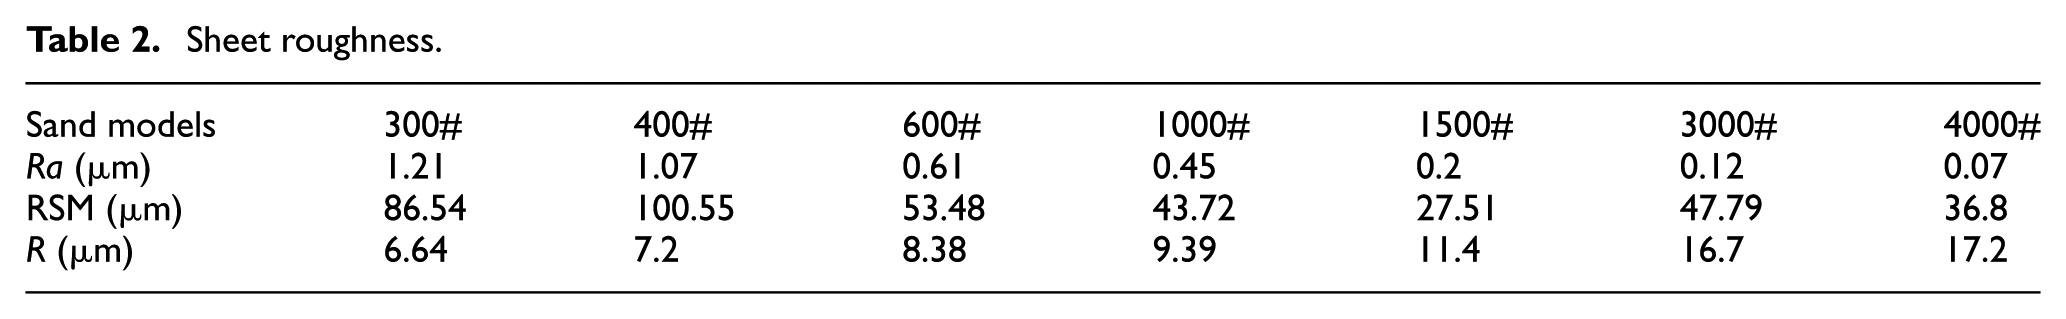
The waviness of surfaces, which indicates the asperity interval of the scanning track, is also shown in Table 2. The real density of asperities
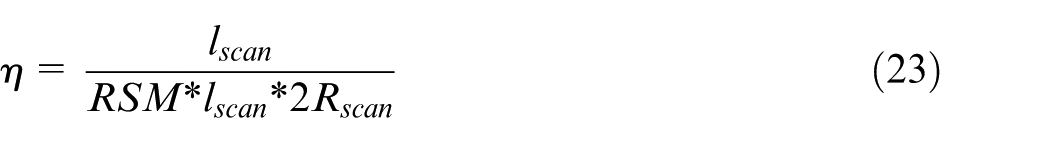
where
As the roughness of the sheets is the focus of this study, the roughness of the electrodes is not considered, and sheets of the same thickness were chosen. The thickness was also measured using PRISMO navigators (PRISMO; Zeiss).
According to equation (22), the mean interval of the joint surfaces is calculated for different roughness as shown in Figure 7. As Ra increases, the mean interval becomes larger, indicating that the sensitivity increases as the roughness increases. The induced charges are measured, and, then, the sensitivity is calculated. It is clear that a high sensitivity is obtained using the rough surface sheets. The experimental results indicate that the predicted value of the sensitivity of sensors is in good agreement with the experimental results.
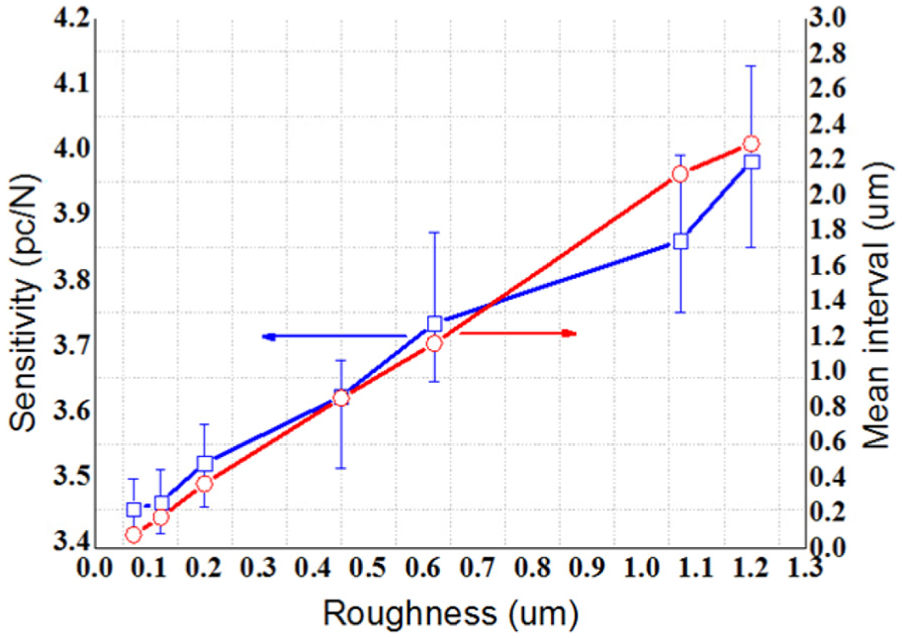
The relationship of the roughness and the mean interval and the charges induced for materials of different roughness.
In conclusion, the roughness of sheets directly affected the sensitivity of piezoelectric dynamometers through changing the micro-contact conditions and joint intervals.
Stiffness effect experiments
Several piezoelectric force sensors are assembled using 304 shells and Cu electrodes. The sheets, electrodes, and shells are shown in Figure 8(a). Normal force is loaded by the testing machine shown in Figure 5(b). To reduce the error induced by loading, two sensors are stacked in the normal direction as shown in Figure 8(a). One sensor is used as a standard, and the other sensor follows the same pattern. In the experiments, the mean stiffness of the sensors is calculated using equation (24), and the sensitivity is calculated using equation (5)
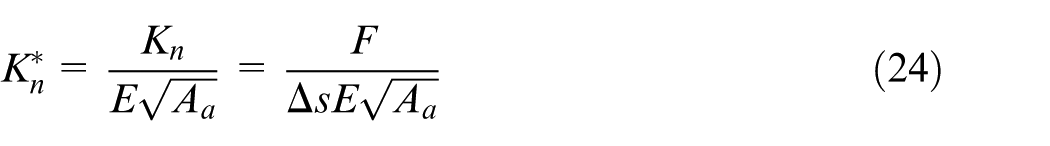
where
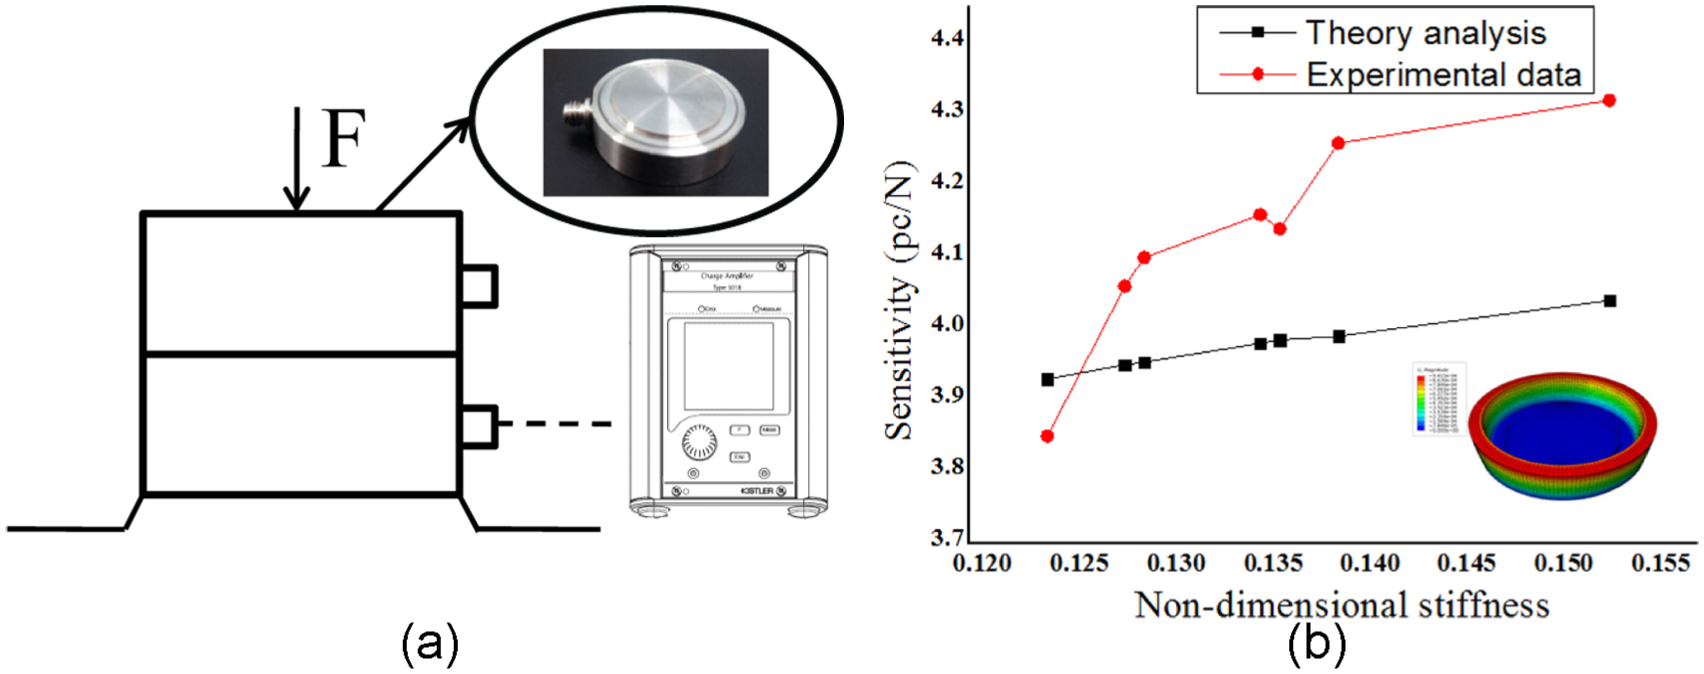
Stiffness effect experiments and results.
The theory stiffness of the shell is calculated by a Fourier transform method, as shown in Figure 8(b). The theory sensitivity of sensors is calculated using equation (7). The results are shown in Figure 8(b). The theory stiffness of the shell is bigger than measured data, as there is an electric hole at the shell. So, the error of theory results and experiment results is shown. It is concluded that the sensitivity increases as the contact stiffness improves.
Their relationship between the contact stiffness and sheet roughness is shown in Figure 9. The contact stiffness first improves and then decreases, achieving an optimal value. Therefore, optimizing the sheet roughness can be achieved using the relationship established in Figure 9. There are some errors between theory analysis and experimental data. It is speculated that the error is originated from the fractal parameters of sheet surfaces.
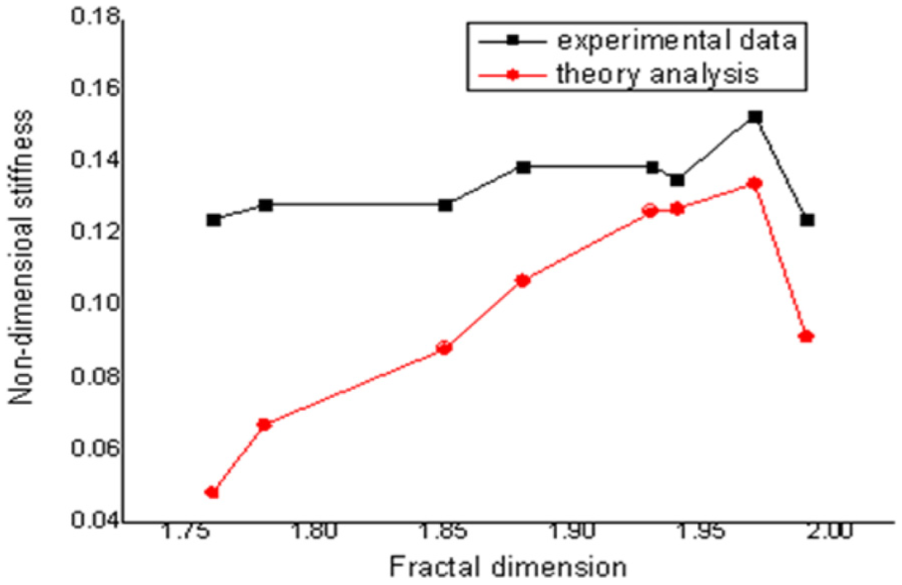
Roughness and contact stiffness.
Conclusion
In this study, the influence of the sheet surface topography on sensitivity was extensively examined. The influence of the stiffness effect and thickness effect is first proposed. A model of the sensor sensitivity is constructed based on the two effects. The relationship between the sheet roughness and the piezoelectric dynamometer sensitivity is presented. Some conclusions are as follows:
The roughness of the sheets affects the sensitivity of the piezoelectric force sensors, an effect typically neglected in the past. A model is proposed based on the following two elements: thickness effect and stiffness effect.
The thickness effect, which is used to analyse the crystal groups, influences the measurement system and selecting rough sheets can lead to a high sensitivity.
The stiffness effect is based on load sharing between the shell and the crystal group. The relationship between roughness and sensitivity is conical.
This research provides an effective method for the optimization of sheet roughness to improve sensitivity.
Further research will focus on an optimization method based on the stiffness effect.
Footnotes
Declaration of conflicting interests
The author(s) declared no potential conflicts of interest with respect to the research, authorship, and/or publication of this article.
Funding
The author(s) received no financial support for the research, authorship, and/or publication of this article.