
Abstract
Interfacial burrs of metal stack drilling deteriorate quality and require significant cost of time and labor to deburr. An analytical model is proposed to predict interfacial burr height in double-layered stack drilling, which can be used to control the interfacial burrs by adjusting the clamping force and pressure foot sizes. In this model, the deflections of top and bottom metal sheets are investigated under complex drilling conditions to provide an analytical model. The effect of interlayer compression was clarified and an iterative method was utilized to determine the interlayer contact region and its effect on the deflections during drilling. Experiments were conducted to drill stacked 7075T6 and 2024T3 Aluminum alloy sheets under different clamping forces. The total burr height measured from experimental results agrees well with the gap predicted by the analytical model.
Introduction
Drilling and riveting are primary methods in assembling large structures, which are often composed of sandwich configurations of metal, composite, and sealant. 1 To improve assembly precision and efficiency, single shot drilling of through-holes of stacked materials is widely applied. 2 Several investigations have been carried out to improve the drilling quality, especially on burr control. 3 Burrs are a source of dimensional errors, jamming, and misalignment, which may reduce the fatigue life of components acting as crack initiation point. 4 Due to the existence of interlayer gap between adjacent metal sheets during drilling process, burrs are induced at the entrance and exit of each layer. After completing the drilling operation, deburring has to be performed to eliminate the burrs, especially for the interfacial burrs located inside the multilayer materials where stacked sheets have to be dissembled before deburring and reassembled again afterward. These non-necessary operations not only require significant cost of time and labor but also cause some difficulties to satisfy the assembly precision.
Many studies have been conducted about burr formation and minimization in drilling single-layered materials.5–7 Several major approaches have been followed: burr formation modeling based on analytical or numerical methods, optimization of drilling process parameters, tool wear and tool geometry optimization, online monitoring of burr formation, and so on.8–10 By collecting the existing information about the relationship between the process parameters and burr type, drilling burr control chart, which is material specific, is utilized to decide the optimized cutting speed and feed rate for burr minimization.4,11 These approaches have laid solid foundation for burr control. However, the interlayer gap contributes more to the interfacial burr formation than other factors, and these results make less difference to minimize the interfacial burr than expected. Choi et al. 12 investigated the effect of interlayer gap. They presented detailed descriptions for typical interfacial burrs and conducted finite element simulations. They indicated that the interlayer gap is significant to generate interfacial burr. Hellstern 13 applied a simple clamping equipment during drilling experiments, and it has been qualitatively observed that clamping force suppresses the interlayer gap and interfacial burr formation effectively. Hence, compared to traditional burr minimization techniques, clamping force controlling is more universal and efficient. 14 Jie 15 simplified the deformation of thin rectangular plates into deformation of beams and conducted experiments on stack drilling to study the interlayer gap formation. Gao et al. 16 investigated the interlayer gap and non-coaxiality in stack drilling. A special stacked structure with edge-shared broad and thin plates was developed to imitate typical aircraft assembly structures with drilling experiments and numerical simulations. The effect of extra fastener or rib instead of clamping force was investigated, which would be meaningless considering the reassembling complexity. Tian et al. 17 proposed an interlayer gap model to investigate the deformation of stacked materials under the action of thrust force. However, little attention has been paid to developing a model with clamping force to predict the interfacial burr height for metal stack drilling, since the distribution of interlayer compression is complicated. Besides, various automatic drilling systems with industry robots or crawl robots have already been developed in aircraft manufacturing.18,19 Many of them contain pressure foot to stabilize the workpiece and reduce the interlayer gap formation during drilling process. 20 While selection of the clamping force is usually empirical, its actual effect on interfacial burr reduction is rarely known. 21 This lack of knowledge of interfacial burr control technique could result in enormous preparatory experiments to obtain the favorable clamping force in different manufacturing conditions. It is necessary to develop an analytical method to predict the interfacial burr height efficiently.
The presented work is greatly concerned with the interlayer gap model and relationship between interlayer gap and interfacial burr. Furthermore, we focus on efficient prediction of interlayer gap and interfacial burr height, which would help to find the favorable clamping force for the automatic drilling systems. First, an analytical model is proposed to investigate the quantitative formation of interlayer gap. Then, experiments are conducted to verify the model and analyze the primary principles of the interlayer gap and the resulting interfacial burr formation.
Interlayer gap and interfacial burr formation
The interfacial burr growth is significantly influenced by the interlayer gap formation. At every stage of metal stack drilling process, clamping force and thrust force cause different elastic bending of each layer which results in different interlayer gap and interfacial burr formation. Without clamping force, interlayer gap develops freely with terrible interfacial burr. Figure 1 presents the process of interlayer gap formation in drilling of stacked metal plates without clamping force. This process can be decomposed into three stages. First, as shown in Figure 1(a), the drill bit engages in cutting of the upper layer, and the thrust force is totally applied on the upper layer, so the stacked plates bend as a whole without interlayer gap. Then, as shown in Figure 1(b), the drill bit breaks through the exit surface of the upper layer and the chisel edge reaches the lower layer. In this stage, interlayer gap is initiated due to a small part of the thrust force applied on the lower layer. The interfacial burr is generated along with the formation of interlayer gap. At last, as shown in Figure 1(c), as the drill bit moves forward, the contact between the major cutting edge of the drill bit and lower layer increases gradually. The interlayer gap develops further since the thrust force component applied on lower layer becomes larger. When the thrust force is exclusively applied on the lower layer, the upper layer endures a negligible drilling force, which results in the maximum interlayer gap size during the whole drilling process. Because burr height is the most representative and persuasive index that characterizes the burr quality of a hole, a key objective of interfacial burr control is thus to minimize the interfacial burr height. 10 Generally, the interlayer gap is greater than or equal to the total interfacial burr height, considering the moment of drill exit from upper layer and the rebound of lower layer after the retreating of drill bit. Therefore, diminishing the interlayer gap could be an efficient method to minimizing the interfacial burr height.
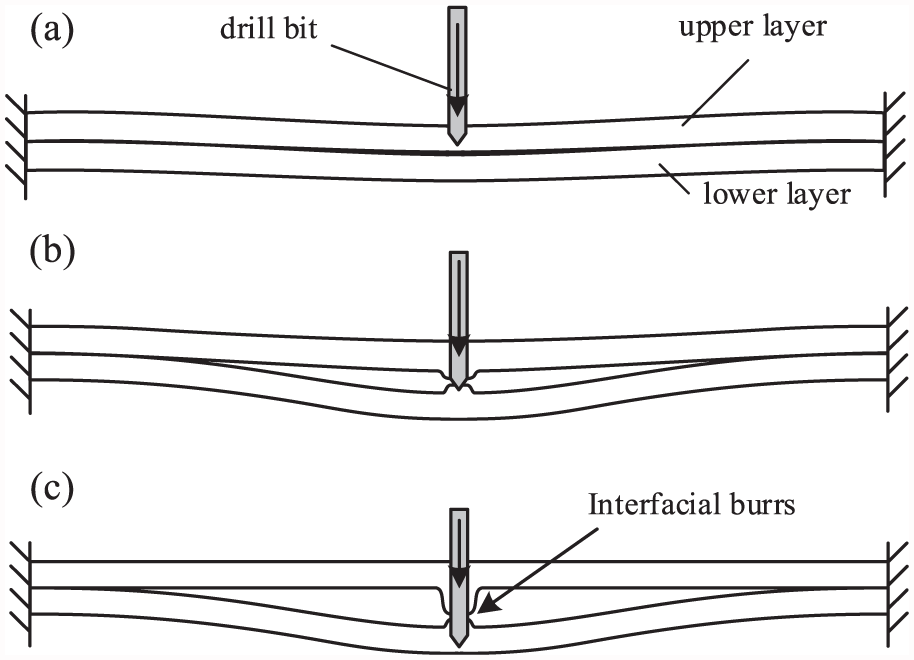
Interfacial burr formation without clamping force: (a) drilling in the upper layer, (b) interlayer gap and interfacial burr initialization, and (c) maximum interlayer gap.
In automatic drilling systems, pressure foot is utilized to exert clamping force around the drilling area to reduce workpiece vibration, and more importantly, diminishing the interlayer gap size. Figure 2 presents a schematic of drilling assisted by the pressure foot. As shown in Figure 2, the two layers are pushed closer together under the clamping force, thus reducing the gap between two layers. The dimension of the pressure foot (inner radius R1 and outer radius R2, R1 must be larger than the radius of drill bit) and the magnitude of the clamping force Fc are two major factors influencing the gap formation. Because the drilling force can be considered as a concentrated force at the center, the stacked sheets can be regarded to be in the pure bending state near the drilling position. Furthermore, clamping load exerted by pressure foot during drilling also ensures steady surface contact of the stacked metal layers. Therefore, without considering the contact behavior far away from the drilling position, the assumption of surface contact around the interlayer gap as shown in Figure 2 is reasonably for the following analytical modeling.
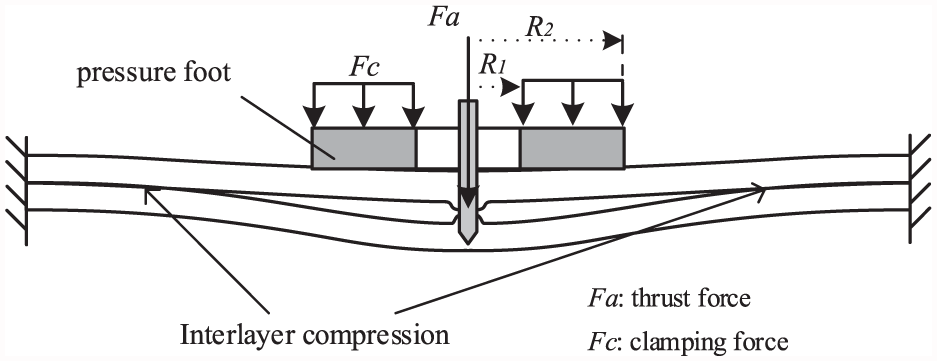
Double-layered stack drilling model with clamping force.
Analytical modeling
Stack drilling model
In drilling practice, the geometry and clamping conditions of multilayer materials could be various. Even though workpieces in aircraft assembling are mostly broad and narrow plates to be riveted together, the hole size is still much smaller than the width of narrow plate. Since then, the boundary type of the plates would make less difference in the results, and the modeling of circular plates is much more concise than that of rectangular plates and has been widely utilized by other researchers. 15
In stack drilling process, the effect of thrust force and clamping force applied by the drill bit and pressure foot, respectively, exists in the area around the hole. Under the thin plate hypothesis, the simplified model as shown in Figure 3(a) is proposed, in which multilayer circular plates with peripheral built-in edge are affected by thrust force and clamping force.
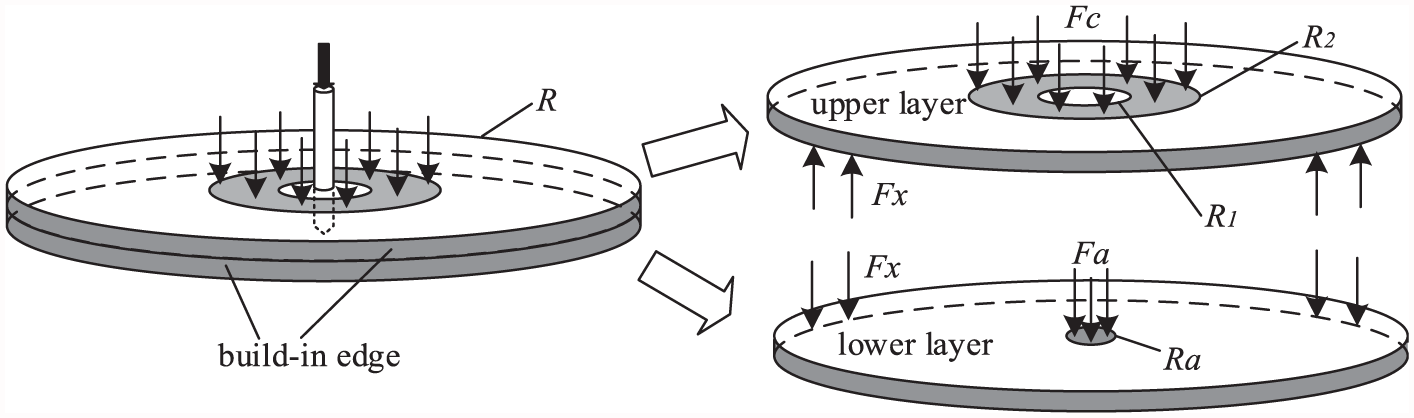
Simplified model of double-layered stack drilling.
As mentioned in section “Interlayer gap and interfacial burr formation,” the interlayer gap of the double-layered stack reaches its maximum when drilling process of the upper layer hole is completed and the lower layer is being drilled. Therefore, as shown in Figure 3(b), it is assumed that the only external force acting on the upper layer is the clamping force Fc, and the lower layer exclusively endures the drilling force Fa, regardless of the friction between the two layers. Since the pressure foot of drilling machines is mostly annular shaped and driven by air cylinders, the clamping force would remain unchanged, and the distribution of clamping force Fc is assumed to be uniform in an annular acting region with inner radius R1 and outer radius R2. Because of the negligible size of the drilling area compared to the dimension of the plates, we can also assume that the thrust force distribution is uniform in a circular area with radius Ra on the lower layer, representing same radius of the drill bit.
Furthermore, when the clamping force is large enough, it may cause interlayer contact and resulting interlayer compression force Fx. The interlayer compression force Fx is assumed to be applied on an annular area with inner radius Rx and outer radius R, since the interlayer contact is always initiated from the built-in boundary
Considering the axis-symmetry of all the loads and built-in boundary, the model shown in Figure 3 could be simplified as shown in Figure 4. As shown in Figure 4, the distribution of clamping force Fc is qc within an annular area with inner radius R1 and outer radius R2, and the distribution of thrust force Fa is qa within a circular area with radius Ra.
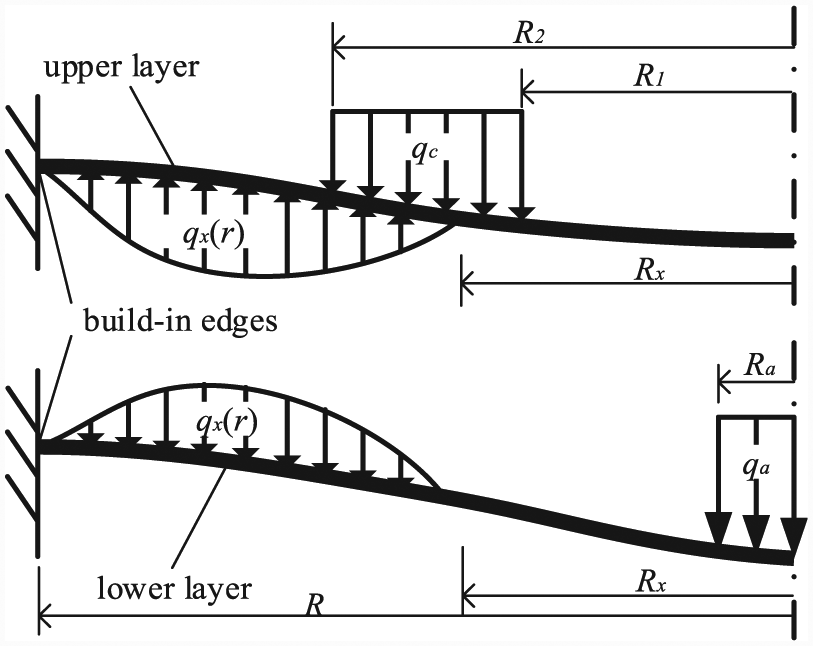
Double-layered stack drilling model with interlayer compression force.
Under the hypothesis of small elastic deformation, we can calculate the deflection of each layer by superposing the value under each load. Also, the deflection with uniform load applied on annular area could also be obtained by superposing the value under two loads applied on circular areas with inner and outer radius, respectively. The effect of Fc is supposed to be equal to the effect of two loads: uniform load applied on circular area with radius R2 and uniform load with same magnitude but opposite sign applied on circular area with radius R1. More specifically, the deflection of the upper layer, denoted wu(r), and that of the lower layer, denoted wl(r), are both composed of two parts: the component contributed by interlayer compression force and the component resulted from external forces. The decomposition of wu(r) and wl(r) are represented as
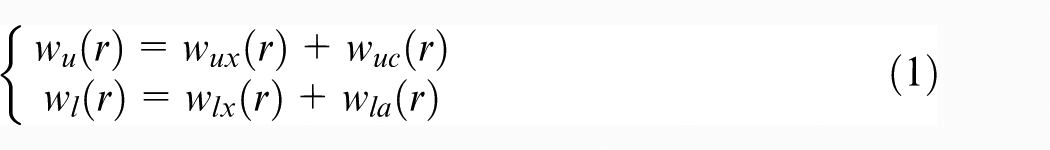
where wux(r) and wlx(r) denote the deflection caused by the interlayer compression force qx(r), wuc(r) represents the upper layer deflection under the clamping force qc(r), and wla(r) represents the lower layer deflection resulted from the thrust force qa(r).
Deflection under single thrust load
As mentioned in section “Stack drilling model,” the total deflection could be calculated by superposing all the deflection components caused by each load. Therefore, it is necessary to develop the deflection model of single plate drilling with single axis-symmetric thrust load. Figure 5 presents the simplified model of a circular plate with built-in edge and axis-symmetric load applied on its surface. Similarly, considering the axis-symmetry, the model shown in Figure 5(a) could be simplified as a beam model shown in Figure 5(b).
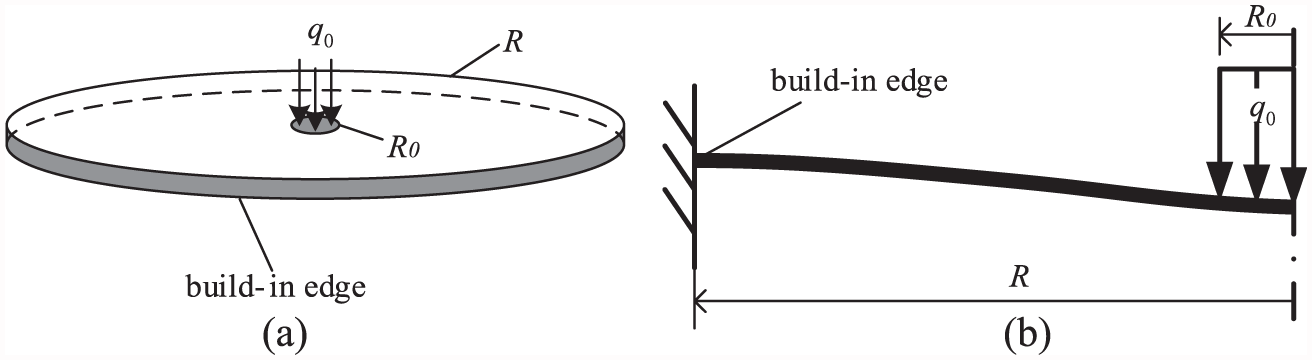
Deflection model under single thrust load: (a) plate with axis-symmetric load and boundary and (b) simplified model as a beam with built-in edge.
Under the hypotheses of thin plate with small elastic deformation, 22 the deflection w(r) of a circular plate with built-in edge and uniform load q(r) is calculated according to the following differential equation
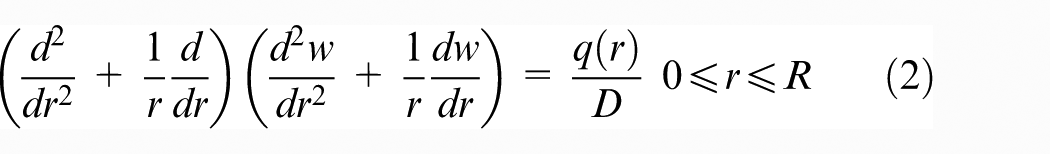
where R is the radius of the circular plate, and
The distribution load q(r) applied on the plate’s top surface is represented as
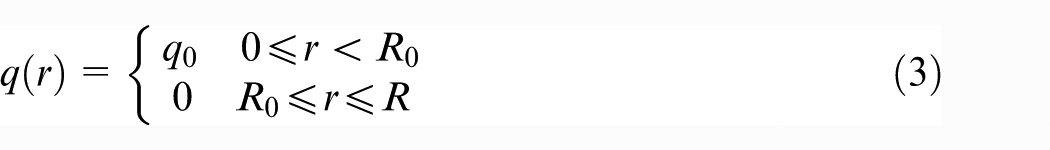
where R0 is the radius of the acting region.
According to equation (2), the deflection of plate w(r) at given radius r is calculated by equation (4)
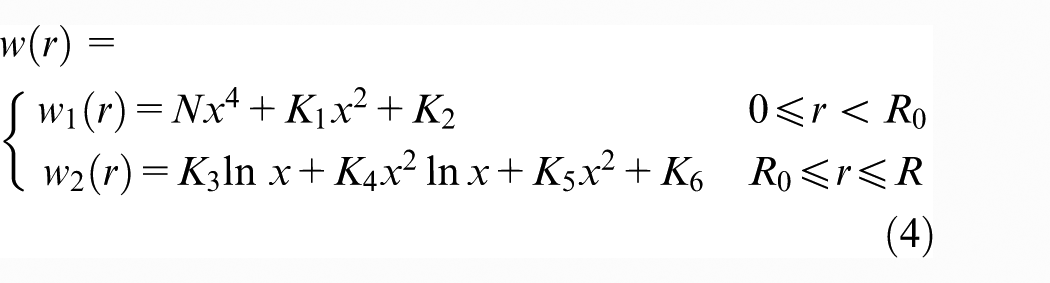
where
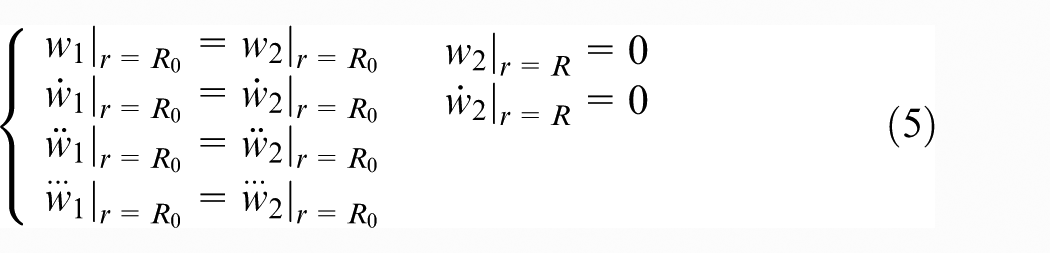
The circular plate is supposed to be continuous at any radius regardless of the local force distribution. C3 continuity is required to realize stress continuality in all directions. Ki (i = 1, 2, &, 6) are constants to be determined with the following boundary conditions
Therefore, according to equations (2)–(5), the deflection components wuc(r) and wla(r) could be calculated, respectively.
Interlayer contact determination
The distribution of interlayer compression force, qx(r), is supposed to be nonlinear relative to radius r, and the value of Rx remains undetermined. Thus, it requires further to obtain the interlayer compression force, which is necessary to calculate wux(r) and wlx(r). In this section, this problem is solved with the help of the deformation compatibility equation. Under the hypothesis of elastic deformation, the deflections of both layers are always supposed to be same in the interlayer contact region; otherwise, there would be gap or intersection of two layers. Then, wux(r) and wlx(r) could be obtained without knowing the distribution qx(r) of interlayer compression force.
The deflection of a circular plate under the uniformly distributed load q0 derived from equation (2) is given as 64Dw(r) = q0(a2 − r2) in Timoshenko and Woinowsky-Krieger, 22 where a is radius of a circular plate. We define flexural rigidity of each layer in equation (2) by Du and Dl for the two layers, respectively. Since the interlayer compression force is applied on both layers with the same magnitude but opposite sign, and the boundary conditions is also same for both layers, according to equation (2), the relationship between wux(r) and wlx(r) is expressed as follows without considering the variation of interlayer compression force

The deformation compatibility equation in interlayer compression region

According to equations (1), (6), and (7), the deflection function at the region Rx ≤ r ≤ R is
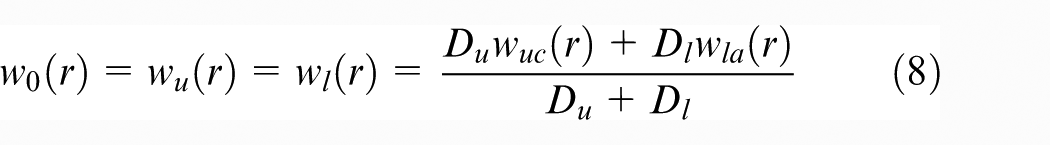
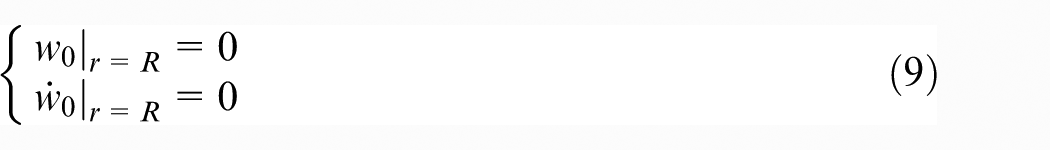
where w0(r) satisfies the constraint equation
Because the thrust force qa already guarantees the complete separation of the upper and lower layer even if Rx is exactly equal to R1, the inner radius of compression region, Rx, must be greater than R1. Therefore, two possibilities of compression region are analyzed: R2 < Rx ≤ R and R1 < Rx ≤ R2.
In the first case of R2 < Rx ≤ R, according to equations (4)–(9), the deflection functions of the two layers are calculated by equations (10) and (11), respectively
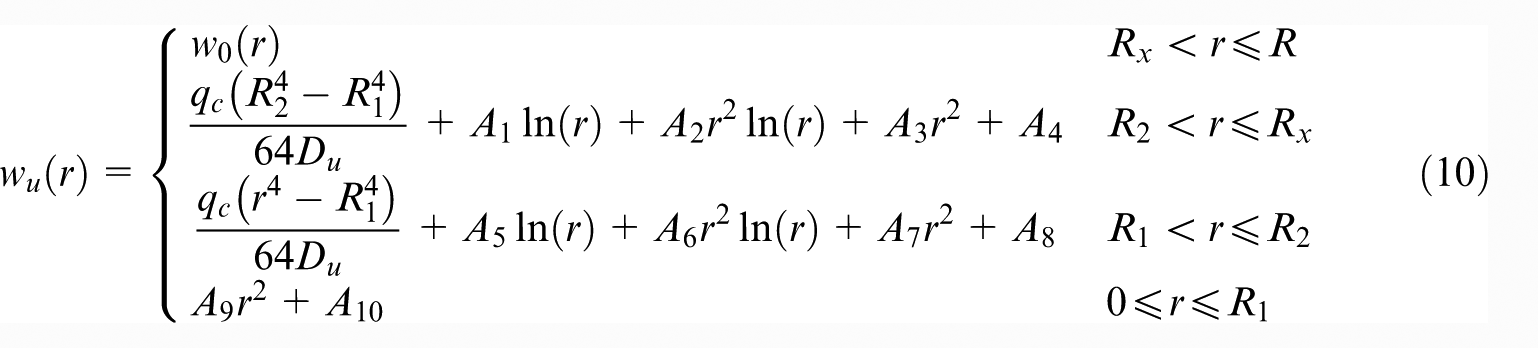
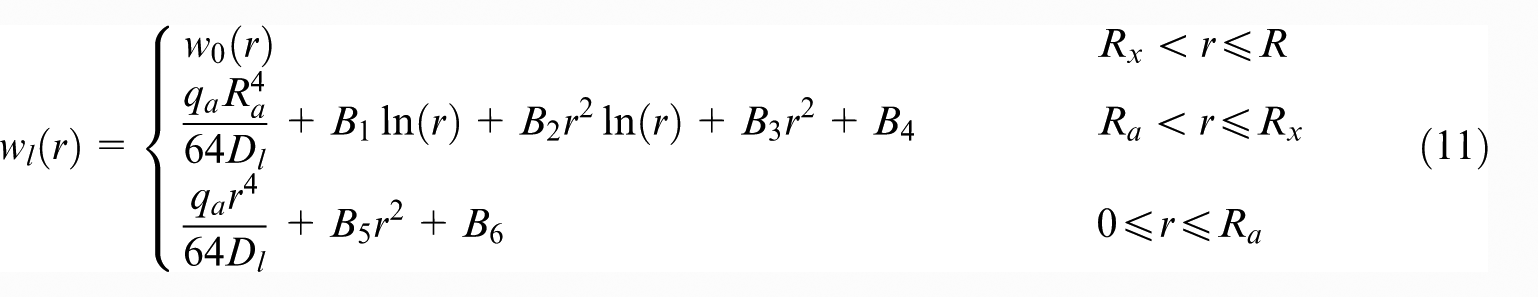
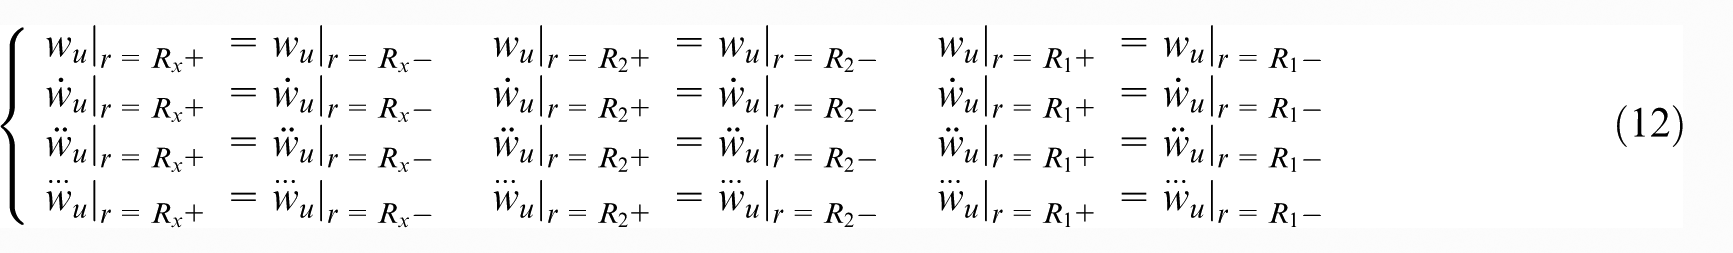
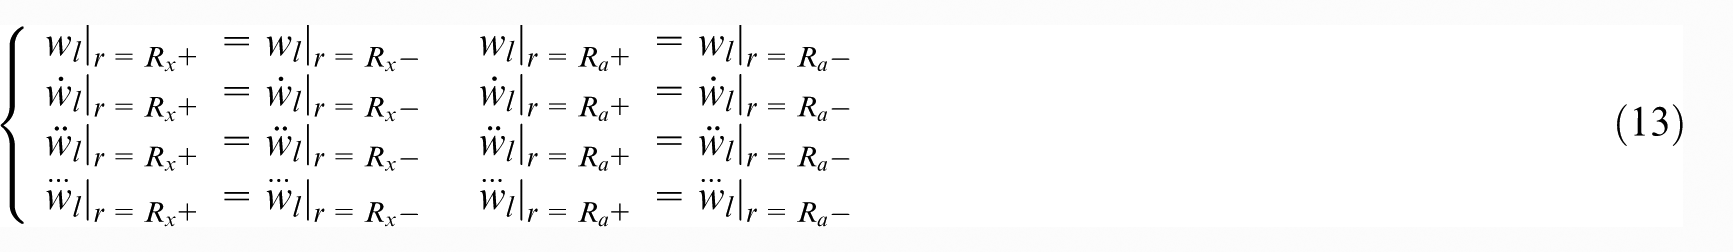
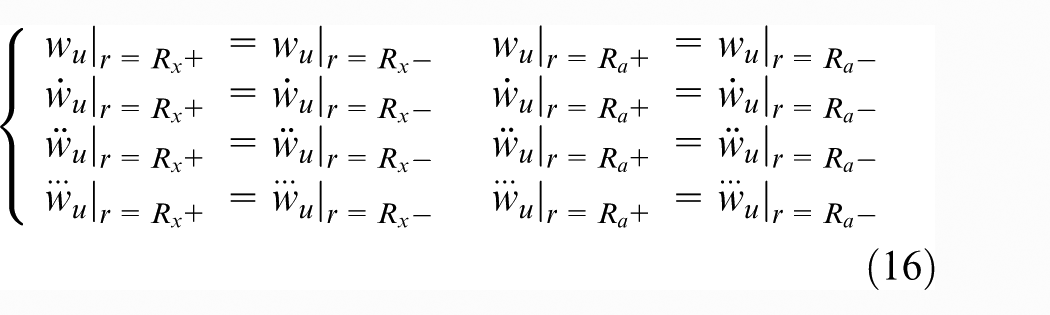
Similar to equation (5), C3 continuity is necessary to be guaranteed at any radius of both layers. And the coefficients Ai (i = 1, 2, &, 10) and Bi (i = 1, 2, &, 6) in equations (10) and (12) are determined according to the following boundary conditions
Similarly, in the second case of R1 < Rx ≤ R2, the deflection functions are
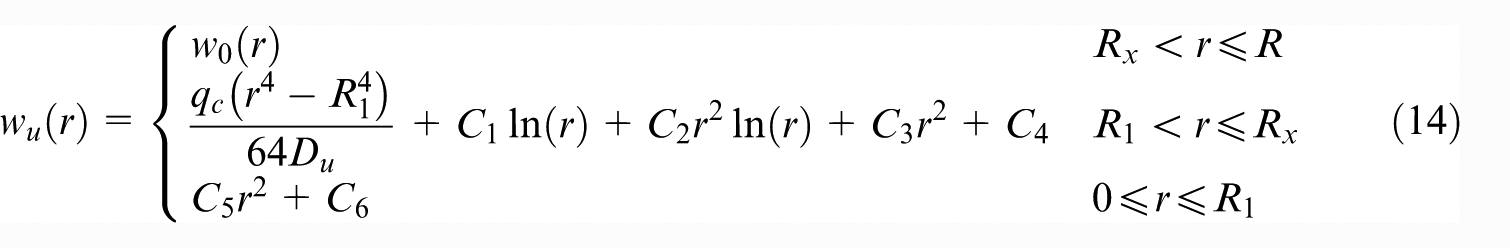
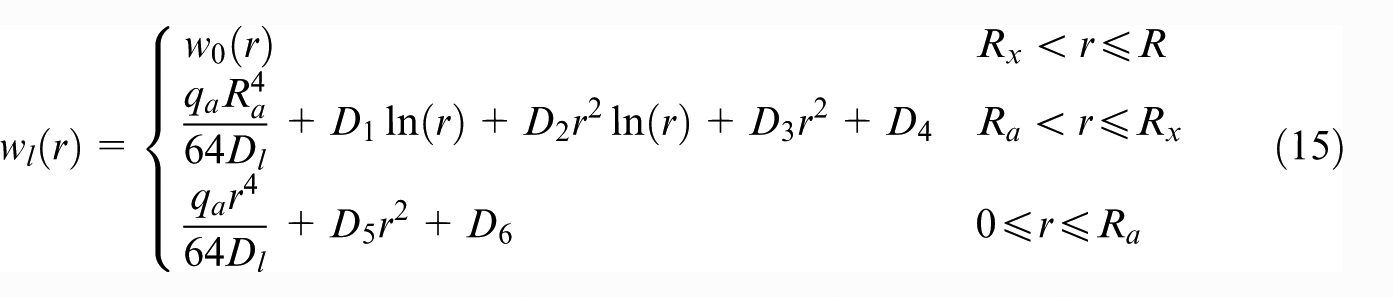
The coefficients Ci (i = 1, 2, &, 6) and Di (i = 1, 2, &, 6) in equations (14) and (15) are determined according to the boundary conditions as equations (9), (13), and (16)
As mentioned in section “Deflection under single thrust load,” only if the initiated radius Rx for given load conditions is correct, we could utilize the proper equations to get the deflection results. To obtain a credible Rx, an iterative method is proposed. As shown in Figure 6(a), we first assign R − ΔR to the guess value of Rx, denoted Rx-guess, where ΔR is very small comparing to R. We assume that the real Rx is smaller than Rx-guess. Then, if Rx-guess is substituted for R in equations (8)–(16), overlapping of the calculated deflection curves of the upper and lower layer occurs since the corresponding compression area is insufficient to separate the two layers. Then, a smaller value R − 2ΔR is assigned to Rx-guess and the previous process is repeated. As shown in Figure 6(c), as the Rx-guess decreases, the compression area is expanded with the decreasing overlapping of two deflection curves. Rx-guess is progressively decreased until, at a certain value denoted R − nΔR, as shown in Figure 6(d), no overlapping appears for the two curves. Finally, R − nΔR is assumed to be the credible estimation of Rx.
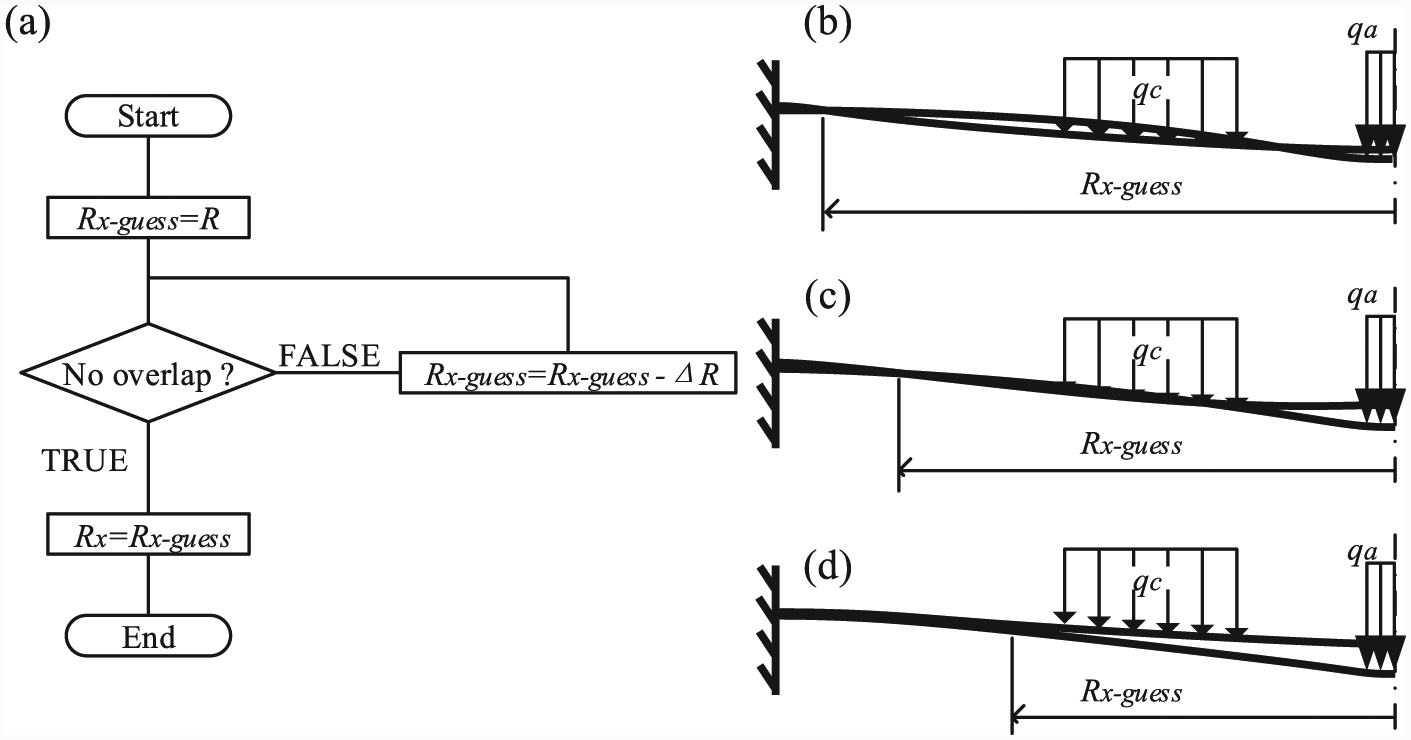
An iterative method to identify interlayer compression region: (a) algorithm, (b) R − ΔR is assigned to Rx-guess, (c) overlapping reduction with decreasing Rx-guess, and (d) no overlapping appears with credible Rx.
By substituting the credible estimation of Rx into equations (8)–(16) and obtaining the deflection functions of both layers, the predicted interlayer gap size g(R1,R2,Fc) is consequently given by

where wu(0) and wl(0) are the deflection at r = 0 of the upper layer and lower layer, respectively.
Criteria to determine the elastic deformation state
Furthermore, the previous analytical model is based on the hypothesis of elastic deformation of both layers. Under thin plate hypothesis, only plane tensile stresses, denoted σr and σθ, are existent for both layers, and the von Mises stress of a material is represented by
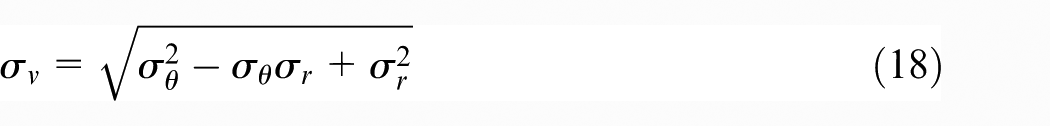
where σr and σθ of a circular plate at any radius are calculated by
The deformation of each layer is within the elastic hypothesis only if the maximum value of σv of each plate is less than the yield strength of the corresponding material.
Stack drilling experiments
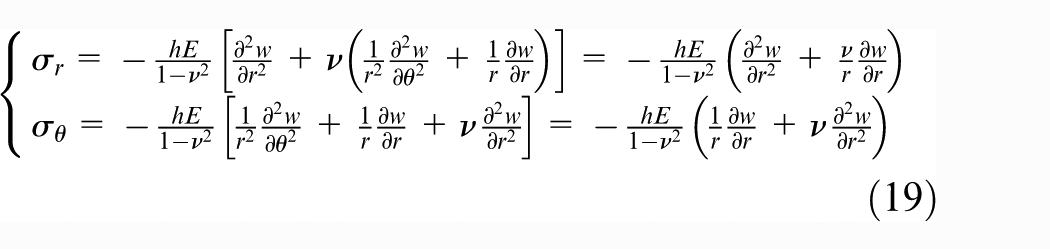
Aluminum alloys 7075T6 and 2024T3 with the thickness of 2.286 and 2.540 mm, respectively, were used for double-layered stack drilling experiments. They are widely used in aeronautic skin structures. Both layers of the double-layered material were 200 mm × 200 mm square-shaped sheets. φ6 mm HSS Co8 drill bits, with 135° point angle and 33° spiral angle, were utilized for drilling. Figure 7(a) provides the schematic of the experimental setup. As shown in Figure 7(a), the stacked sheets were placed on a 200 mm × 200 mm platform with a 130 mm × 130 mm hollow area at the center. As shown in Figure 7(b), common C-clamps were utilized to fix the edges of the sheets, which allows to satisfy the built-in boundary conditions. The clamping force was exerted by a compression spring connected to the top surface of pressure foot. The inner and outer radius of the annular pressure foot were 10 and 20 mm, respectively. With the assistance of the dynamometer located below the platform, by adjusting the spring’s length, the clamping force is regulated to a specific magnitude before each drilling experiment.
Experimental setup for stack drilling: (a) schematic of fixture and (b) picture of fixture.
In all the following experiments, same drilling parameters of 2000 r/min and 0.15 mm/rev were selected to obtain the same drilling force on the two layers. Clamping force Fc was the only variable in the drilling experiments. Tests were repeated eight times with different magnitudes of clamping force Fc varying from 0 to 700 N with a fixed interval of 100 N. One single through-hole was drilled at the center of new stacked sheets at each test.
The global morphology of the drilled hole is observed by a Zeiss Stemi 2000-C stereo microscope. The exit burr height of upper layer and the entrance burr height of lower layer were hereafter measured with a Zeiss Axio CSM 700 confocal light microscope, which has been proven an effective choice for burr height measurement. 23
Results and discussion
Model prediction
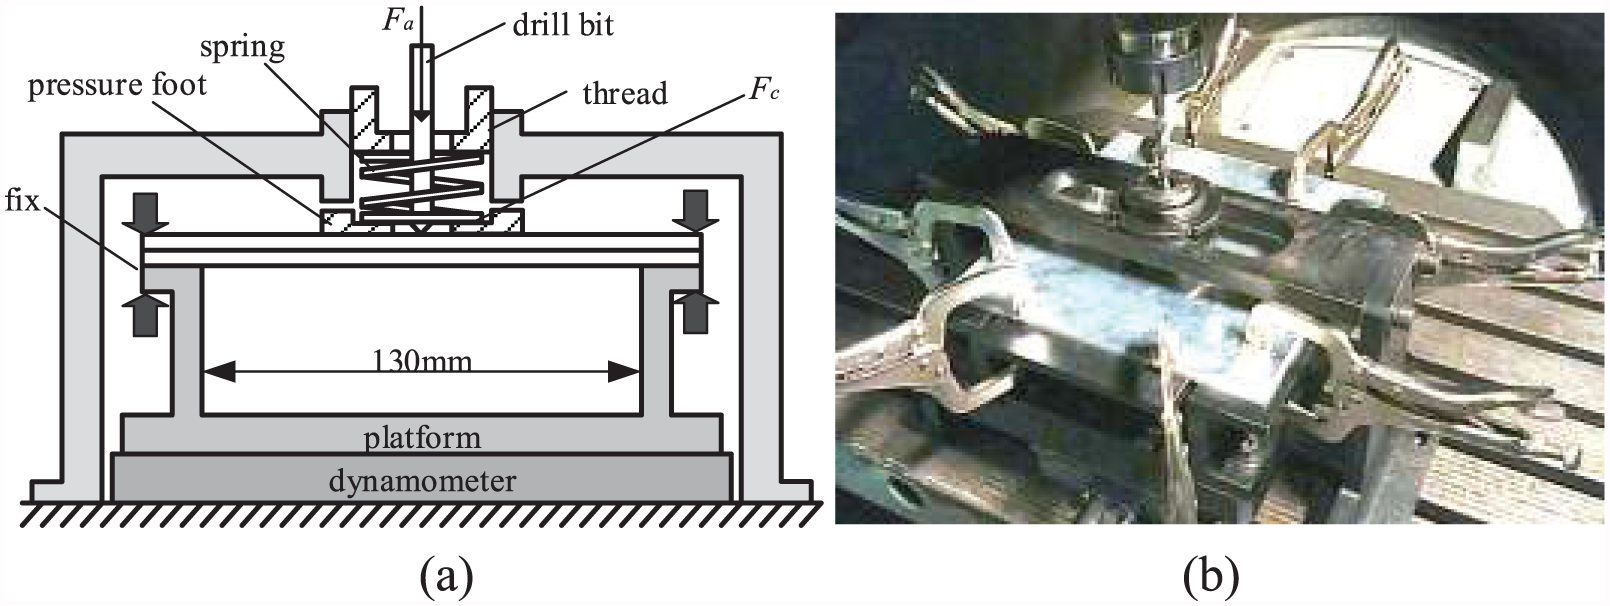
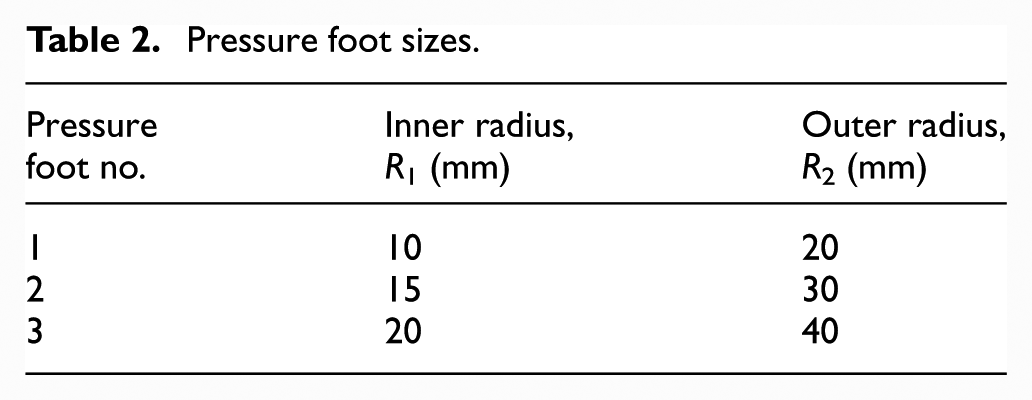
According to the experiments, the radius of the circular plates in stacks drilling model is assumed as 65 mm. 2.286-mm-thick 7075T6 Aluminum sheet and 2.540-mm-thick 2024T3 Aluminum sheet were selected as the upper layer and lower layer materials in the simulation, respectively. And the material properties are given in Table 1. As shown in Table 2, three sizes of pressure foot are used to calculate the gap based on the mathematical derivations of equations (1)–(19).
Material parameters for both layers.
Pressure foot sizes.
The drilling force Fa at the center of the lower layer is set to be 380 N, which was measured from the experiments. The maximum Mises stress of each layer is given in Figure 8. It can be observed that the maximum Mises stresses of the two layers are both below their yield strengths and the elastic hypothesis is guaranteed. The calculation results of g(Fc) for different pressure foot sizes are given in Figure 9. As shown in Figure 9, each g(Fc) curve is obviously composed of two parts: the linear part for smaller Fc and the nonlinear part for larger Fc. When the clamping force Fc is relatively small and interlayer contact occurs insufficiently between the upper and lower layer, g(Fc) decreases linearly and rapidly with the augmentation of Fc. When Fc enters the nonlinear region, because of the sufficient interlayer contact, further increase in Fc results in much less reduction of the interlayer gap. It can also be observed that smaller pressure foot is more effective in reducing the interlayer gap. However, as shown in Figure 9, comparing to larger pressure foot, smaller pressure foot could cause larger stress on both layers and this may bring about undesired plastic deformation in the materials.
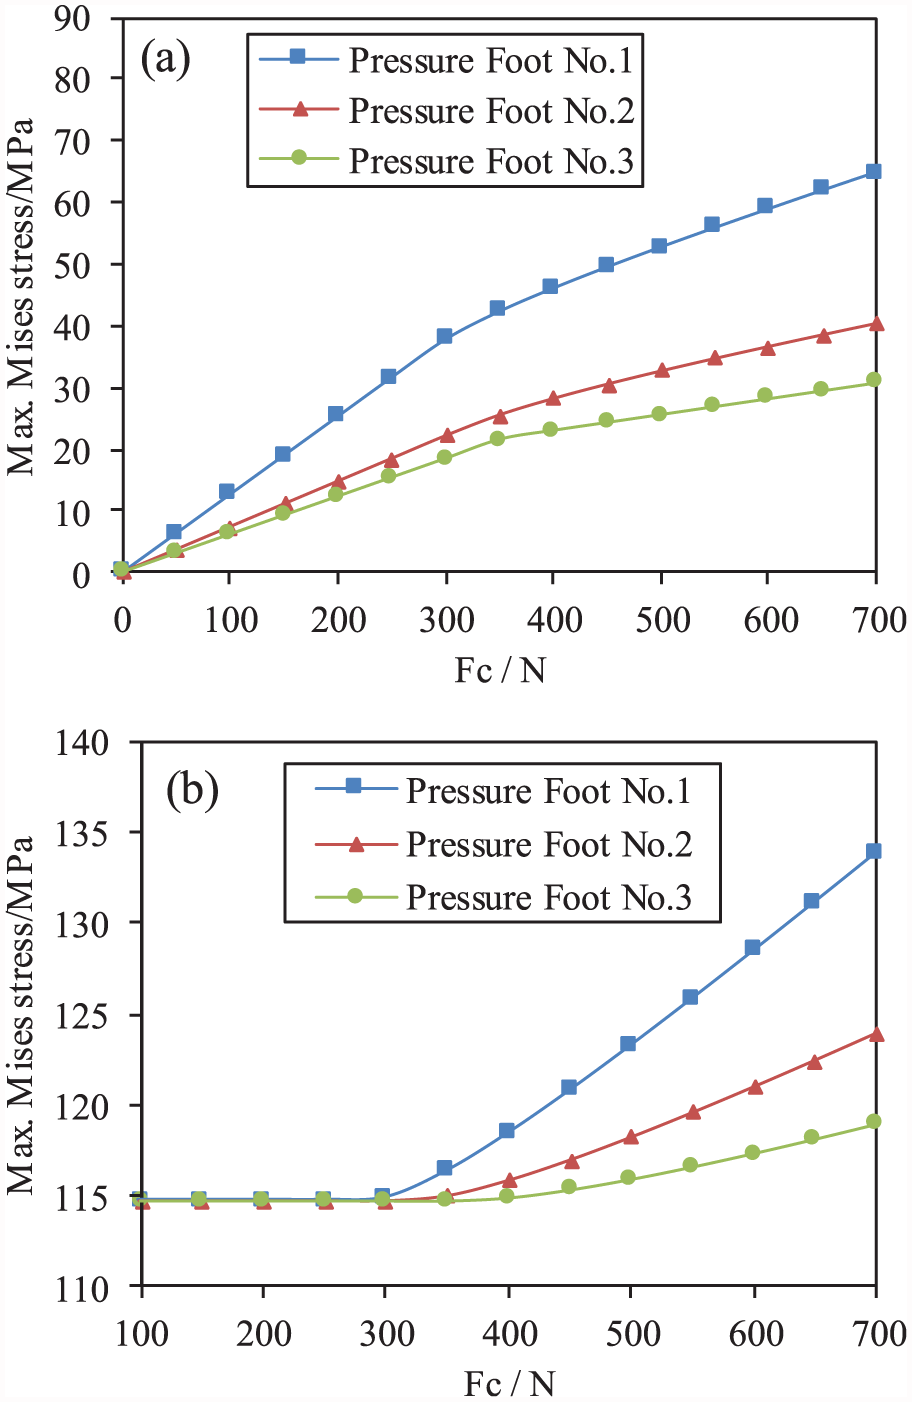
Maximum Mises stress of the multi-layered material: (a) upper layer and (b) lower layer.
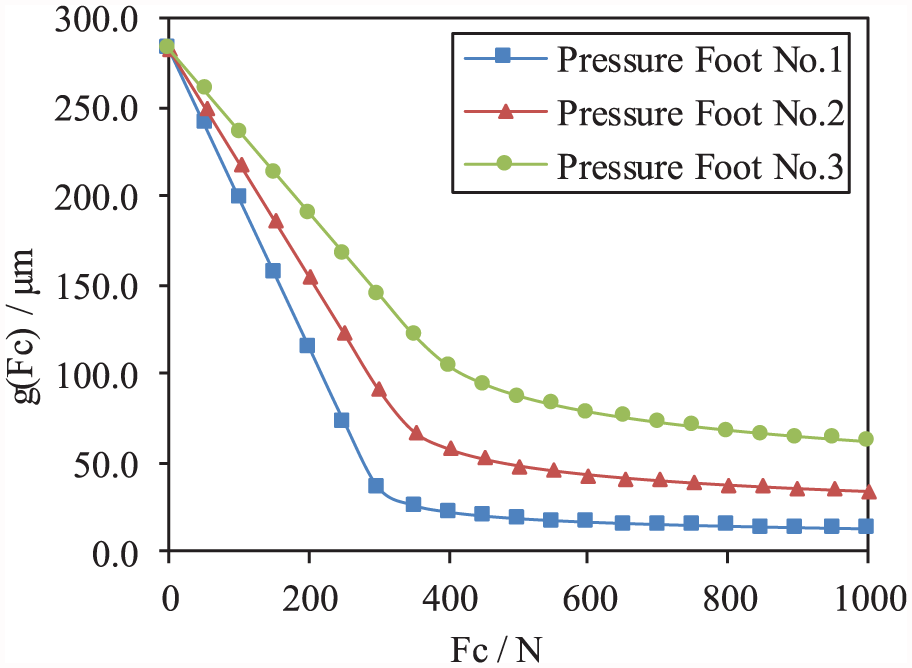
Interlayer gap size versus clamping force with different pressure foot sizes.
Model validation
Figure 10(a) and (b) presents the morphology of the exit burr of upper layer and entrance burr of lower layer. Greater magnitude of clamping force induces smaller burr size for both layers, and the clamping force’s burr-minimization effect is more significant on upper layer’s exit burr than on lower layer’s entrance burr. Each drilled hole was scanned at four stationary points by the confocal light microscope as shown in Figure 10(c). It also presents the measured burr profile at the exit side of upper layer under the clamping force of 300 N. The burr height can be determined conveniently from the characterized profile data.
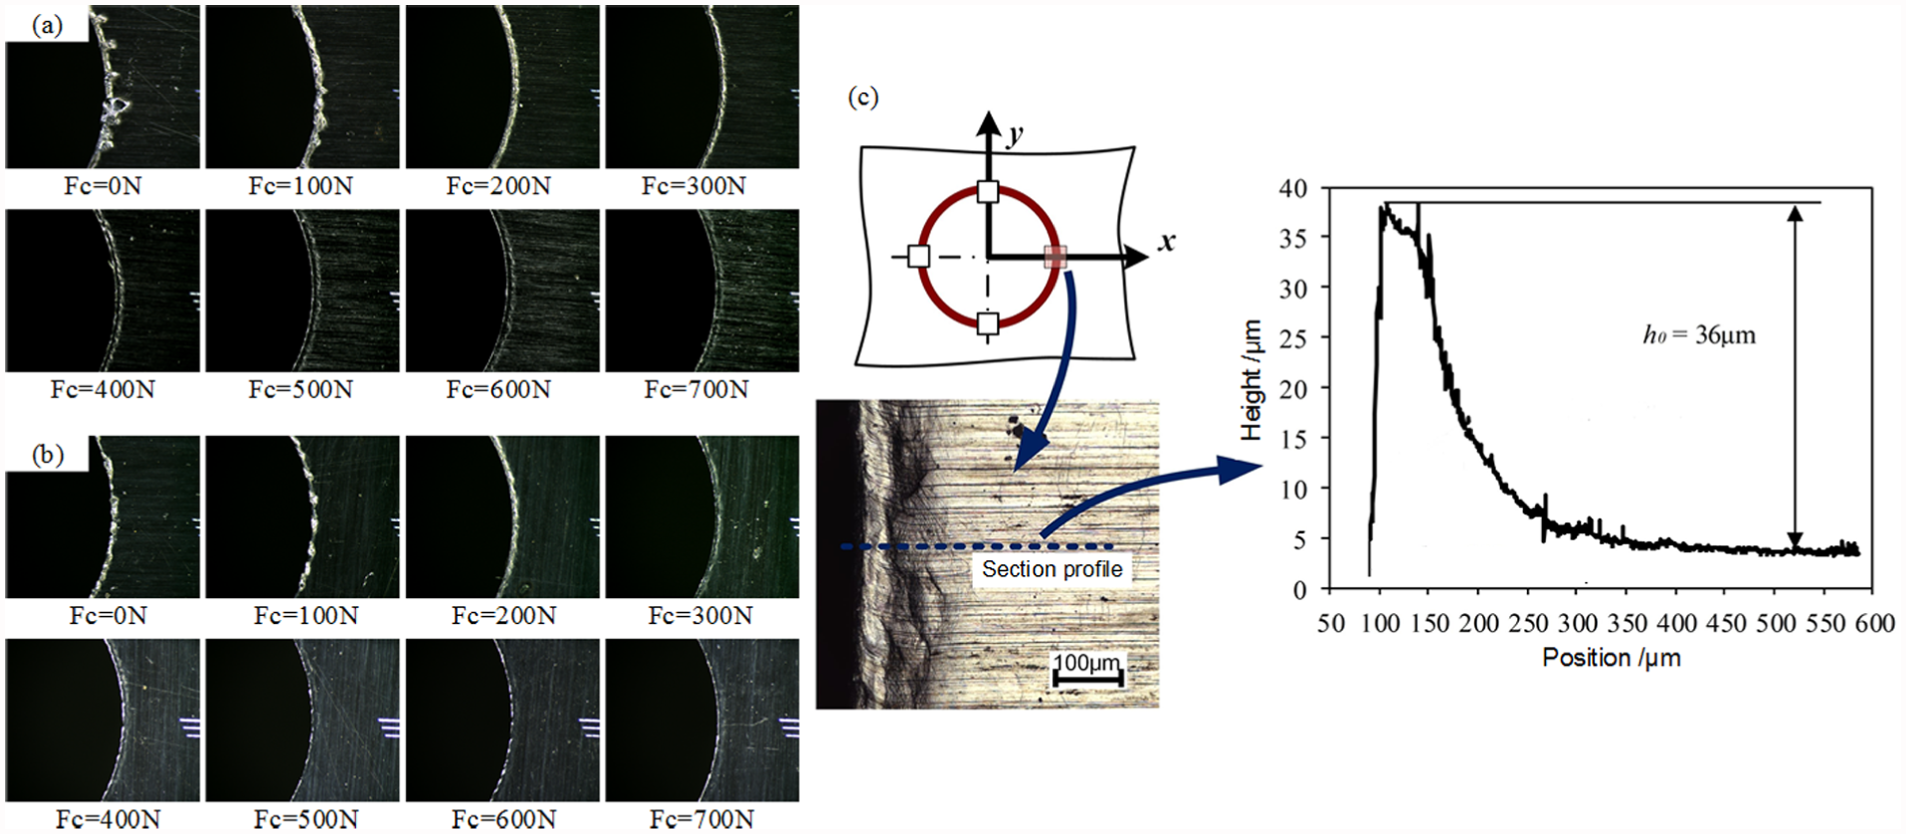
Morphology of interfacial burr: (a) exit burr of upper layer, (b) entrance burr of lower layer, and (c) burr height measurement (exit burr of upper layer, Fc = 300 N).
Figure 11 provides the burr height measurement results of both the exit burr of upper layer and entrance burr of lower layer. And the comparison between the above results and the predicted g(Fc) curve is also shown in Figure 11. By summing the upper layer and lower layer’s burr height at each pair of corresponding scanning points, the total interfacial burr height values are also plotted. Compared to the lower layer’s entrance burr, the upper layer’s exit burr height is more uniform at the four scanning points. The burr heights of both layers are all confined below the prediction curve. In addition, the total burr height agrees very well with the model prediction. The linear and nonlinear zone of g(Fc) are also observed in the experimental results. For the tests of Fc = 0 N and Fc = 100 N, the growth of the interfacial burr is less efficiently restricted by the large interlayer gap, resulting in a more arbitrary burr height distribution along the hole edge. When the magnitude of Fc turns much more significant, the burr size becomes confined by the limited interlayer space, and the burr height is more uniform along the hole edge.
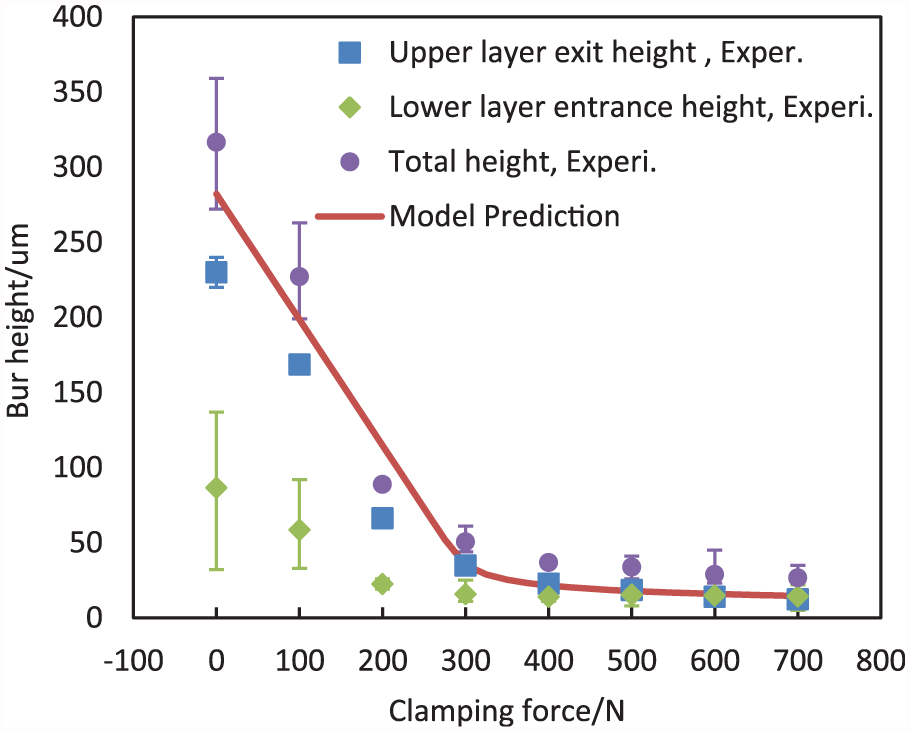
Interfacial burr height measurement results to compare with model prediction.
Conclusion
An analytical model is proposed to predict the interlayer gap in double-layered stack drilling. By superposing the deflections under each load component, the total deflection of each plate could be obtained. The effect of interlayer compression was clarified and an iterative method was utilized to determine the interlayer compression region and then the deflection caused by the interlayer compression force was successfully obtained. Experimental works were effectuated with different clamping forces and the interfacial burr heights were measured to be compared with the interlayer gap prediction from the analytical model. Fine agreement between the interlayer gap prediction and total burr height is obtained, which has shown the validity of the analytical model. Based on this analytical model, the optimized pressure foot size and clamping force could be selected according to different burr height requirement of automatic drilling systems, which could provide an efficient method to control the interfacial burr.
Footnotes
Declaration of conflicting interests
The author(s) declared no potential conflicts of interest with respect to the research, authorship, and/or publication of this article.
Funding
The author(s) disclosed receipt of the following financial support for the research, authorship, and/or publication of this article: The authors would like to acknowledge the support from National Science and Technology Major Project of China (Grant No. 2014ZX04015-021) and the Science and Technology Commission of Shanghai Municipality (Grant No. 14DZ1100403).