
Abstract
A cutting force model, based on a predictive model for orthogonal cutting, is developed for force predictions in end milling of titanium alloy Ti6Al4V. The model assumes a semi-stationary process for the serrated chip formation. The Johnson–Cook material model that couples strain hardening, strain rate sensitivity and thermal softening effects is applied to represent the material strength. A thermal model considering the tool thermal properties is integrated to account for the high temperature rise due to the low thermal conductivity of Ti6Al4V. To extend the predictive model to milling, the end mill is discretised into several axial slices, and an equivalent cutting edge is used to include the end cutting edge effect caused by the first axial slice. The model is assessed by comparing its prediction with the experimental results and a mechanistic model for verification. The results show that the proposed model outperforms the mechanistic model with higher accuracy in force prediction.
Introduction
Titanium alloys have been widely used in the aerospace, power generation and biomedical industries due to their excellent mechanical and chemical properties. However, these alloys are difficult to machine due to the low thermal conductivity, low elastic modulus, high rigidity and strong affinity with tool materials. The high cutting temperature, chatter vibration and tool wear are the major issues which reduce the productivity in titanium alloy machining. Milling is a common material removal process for machining titanium alloys such as Ti6Al4V in the manufacturing industry. To control and optimise the titanium alloy milling process, it is necessary to be able to predict the cutting forces. The knowledge of cutting forces is of importance for tool condition monitoring 1 and chatter stability prediction/detection.2,3 It has been used as an indicator for the cutting temperature estimation. 4
Mechanistic models are commonly used approaches for force prediction in the milling operations, in which the forces are evaluated using the force coefficients obtained from a series of cutting tests for a tool–workpiece couple with a given tool geometry. Kline and DeVor 5 predicted the milling forces from average force coefficients which ignored the dependence of the force coefficients on the cutting conditions. Uriarte et al. 6 introduced an average force coefficient model for force prediction in the micro end milling, with consideration of the effect of the tool deflection on the uncut chip thickness. Landers et al. 7 applied a mechanistic force model with the average coefficients to select the optimal cutting conditions in milling thin titanium plates. To improve the model accuracy, instantaneous force coefficients are used instead of the average force coefficients for force prediction in the milling process. Yucesan and Altintas 8 developed a three-dimensional (3D) mechanistic model for peripheral milling of a titanium alloy by taking into account the effects of the instantaneous chip thickness and rake angle on the force coefficients. Lamikiz et al. 9 used the linear, quadratic and cubic polynomials to describe the dependence of the force coefficients on the axial position of the ball end mill. To apply the mechanistic model to the milling operation with any tool geometry, Budak et al. 10 modelled the instantaneous force coefficients as functions of the shear angle, friction angle and shear yield stress using an orthogonal cutting database, and the instantaneous force coefficients and the oblique cutting analysis associated with the milling process were applied to force prediction in milling of Ti6Al4V. Despite the improvement developed by Budak et al., the predictive capability of the mechanistic models still depends on the empirical force coefficients determined for each tool–workpiece material pair. Large amounts of cutting tests are still needed, which are costly and inconvenient for tool designers and process planers.
Another approach for force predictions in machining of titanium alloys is the finite element (FE) method, which can include the thermo-mechanical effect on the simulated chip formation and cutting forces. Dhanorker and Ozel 11 substituted the experimental tests using the virtual orthogonal cutting process simulated by the two-dimensional (2D) FE method to extract the cutting force coefficients. The thermo-mechanical effect on the cutting force coefficients was described using the Johnson–Cook material model. 12 Gonzalo et al. 13 used either the virtual orthogonal or oblique tests to extract the cutting force coefficients. Although the two methods provided the same precision for calculation of milling forces, the method based on the oblique tests costed much longer computation time than that based on the orthogonal tests. In addition to the extraction of the cutting force coefficients, Wang et al. 14 used a hybrid model of 2D FE simulation and Oxley’s theory 15 to predict the cutting forces in milling Ti6Al4V. The 2D FE simulation was worked as a precursor to evaluate the constants in Oxley’s theory. Although FE models can include complex thermo-mechanical effects, they are laborious and are not easy to be directly applied to 3D machining operations. To extend FE methods to 3D machining operations, a series of 2D FE simulations are still required to evaluate the constants (e.g. cutting force coefficients) that are related to the machining process.
Analytical models are alternatives for force predictions. These models include the thermo-mechanical effect on the material strength, giving more insight into the physical mechanics in metal machining than the mechanistic models. Matsumura and Tamura 16 employed an analytical model to investigate the effect of the material anisotropy on the cutting forces in milling of a titanium alloy. However, this model used several empirical equations that were derived from orthogonal cutting. Moufki et al. 17 extended their thermo-mechanical oblique cutting model to milling of Ti6Al4V. This model simplified the chip formation as a narrow shear band only in the primary shear zone. Becze and Elbestawi 18 applied an analytical model for force predictions in ball end milling of a hardened steel which is also well known for the serrated chip formation. This model required extra orthogonal cutting tests and empirical parameters to estimate the strain and strain rate in the primary and secondary shear zones. Oxley’s predictive machining theory is an analytical model that combines the effects of strain hardening, strain rate sensitivity and thermal softening. 15 Li and Li 19 extended Oxley’s predictive theory to helical end milling of medium carbon steel. Although Oxley’s theory was developed for a steady-state cutting process with continuous chips, it is still applicable to the serrated chip formation by assuming the serrated chip formation as a semi-stationary process according to Manyindo and Oxley’s observations. 20 Furthermore, Vyas and Shaw 21 suggested that the segmentation frequency was high up to 10–100 kHz and a range of force fluctuation relative to the mean was 6%, implying an insignificant variation in cutting forces due to chip segmentation.
It should be noted that Oxley’s theory is independent on the tool material. However, the low thermal conductivity of titanium alloy Ti6Al4V causes the fact that most heat is dissipated from the tool. To account for the heat dissipation, the authors 22 introduced an improved thermal model by including the tool thermal conductivity and incorporated the Johnson–Cook material model 12 for the thermo-mechanical effects. This article presents an extension of the authors’ previous work for orthogonal cutting into milling operations. A 3D cutting force model is developed by considering the end cutting edge effect and is verified under various cutting conditions in end milling of Ti6Al4V.
Model development
Modelling of orthogonal cutting process
The orthogonal cutting force model proposed by the authors 22 is briefly introduced in this section. The basic assumption for the orthogonal cutting theory is that the serrated chip formation of titanium alloys is semi-stationary. Oxley’s theory predicts the average values of the cyclic forces generated by the serrated chip formation. The chip formation for orthogonal cutting is shown in Figure 1. The deformation is concentrated in two zones: a primary shear zone centred at the plane AB and a secondary shear zone along the tool–chip interface.
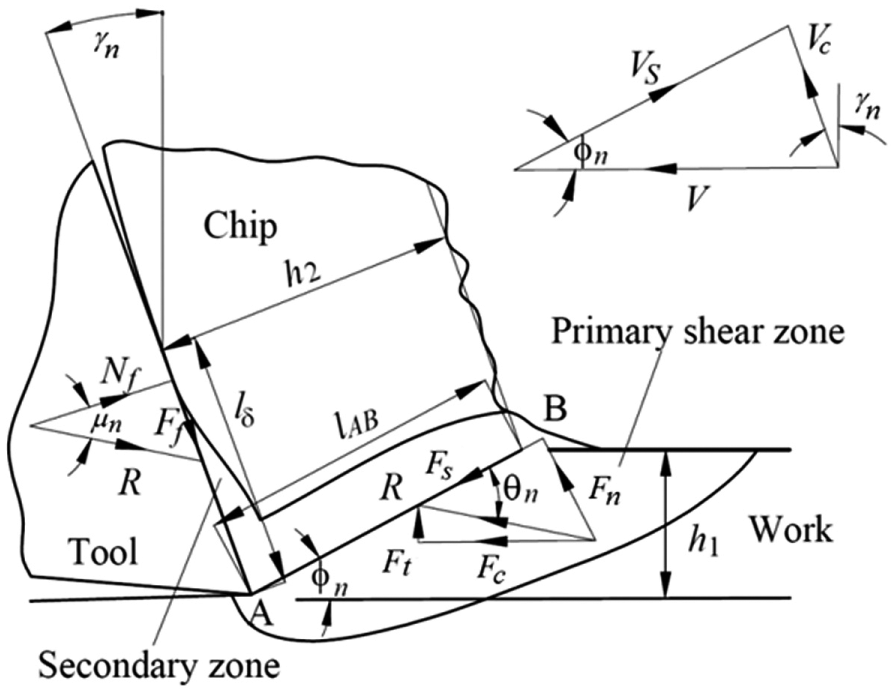
Chip formation in orthogonal cutting.
In the primary shear zone, the equivalent strain
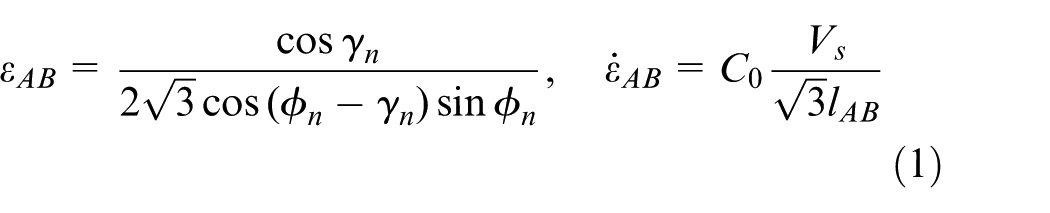
where γn, ϕn,
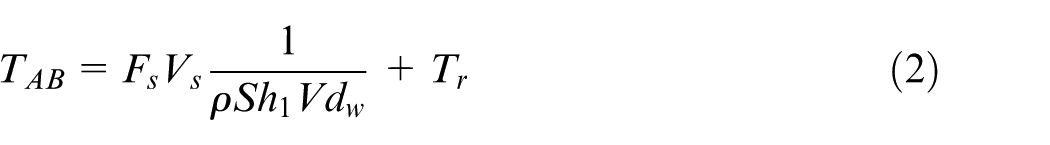
where Fs is the shear force, V the cutting speed,
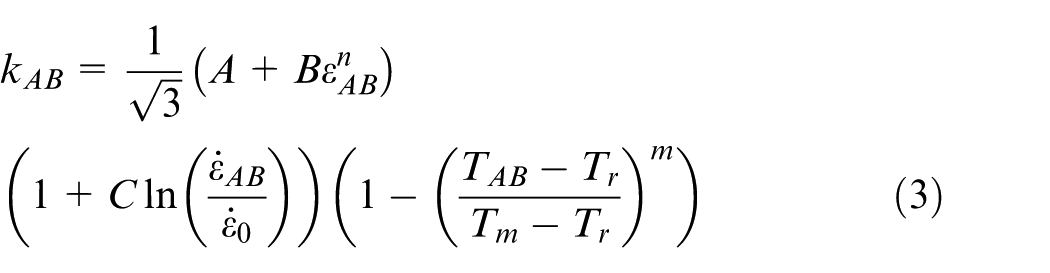
where A, B, C, m and n are the Johnson–Cook material constants, and
In the secondary shear zone, the shear flow stress kchip at the tool–chip interface is also evaluated using the Johnson–Cook material model
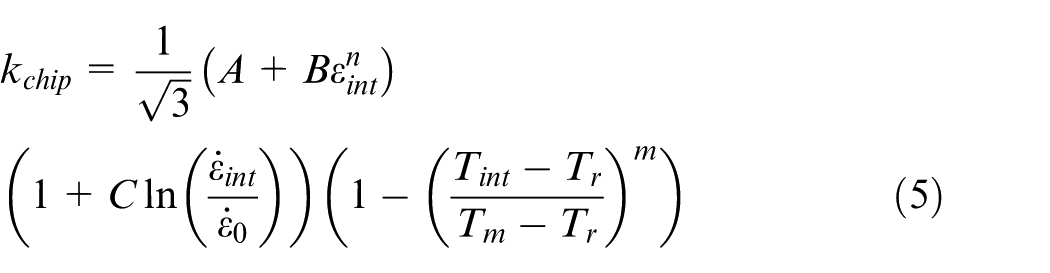
The equivalent shear strain
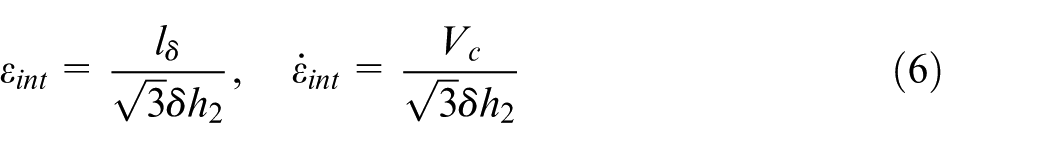
The average temperature
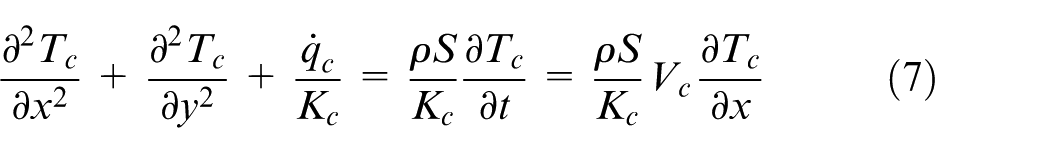
where Tc,
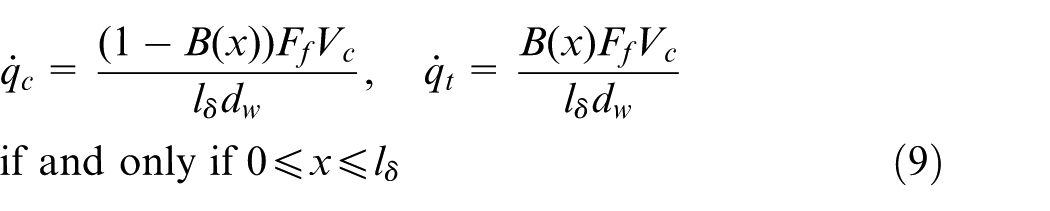
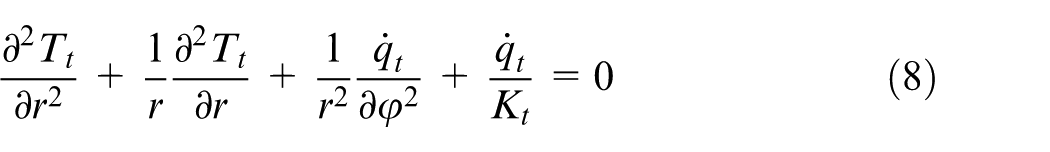
where B(x) represents the proportion of the friction heat flowing into the tool at x position along the tool–chip interface. The heat proportion B(x) is solved using a finite difference method (Figure 2) to guarantee the equal temperatures at the interface on the tool side and the chip side. The average temperature
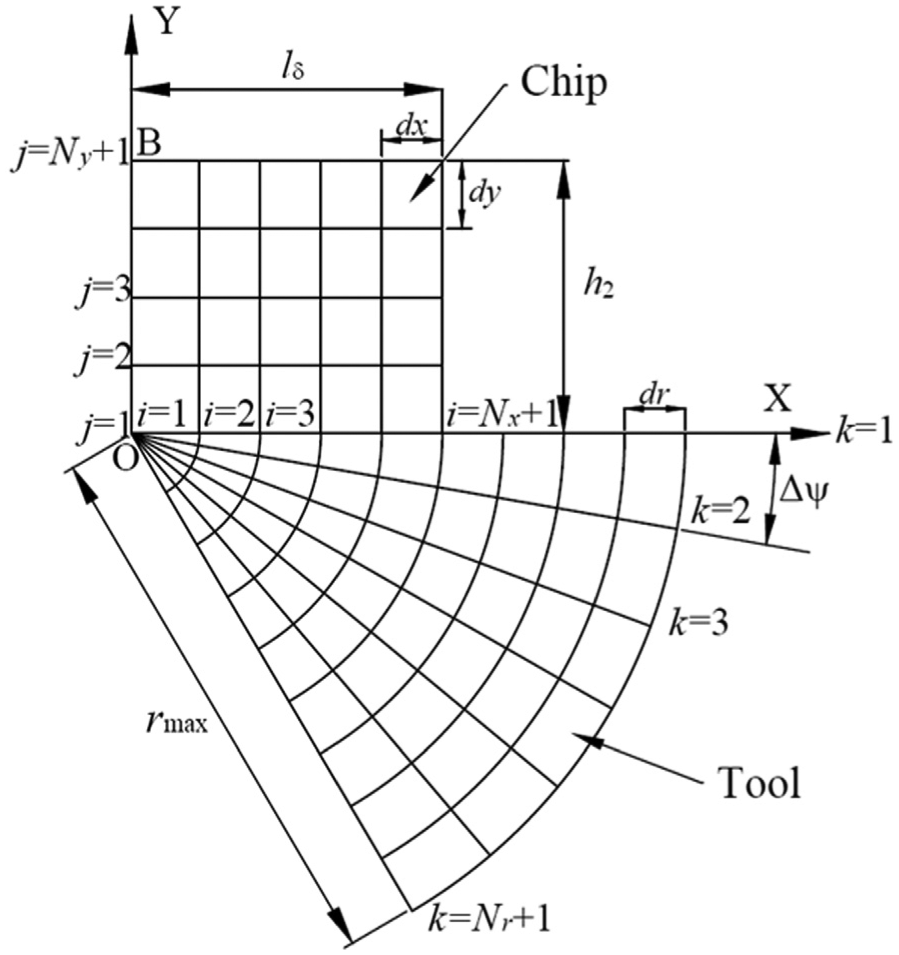
Chip and tool meshing for the finite difference method.
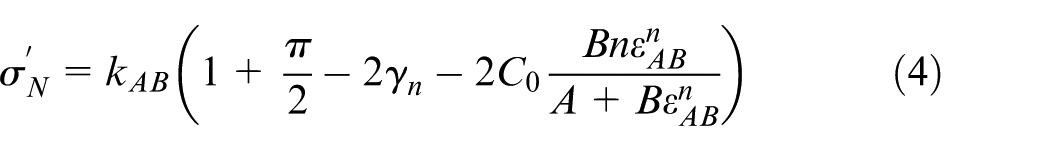
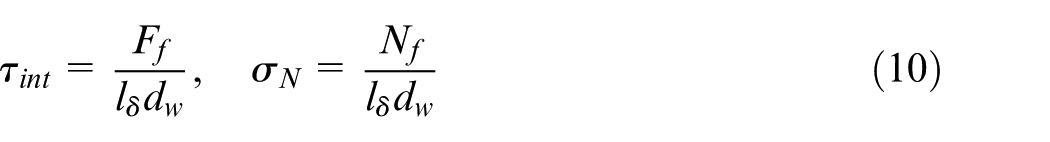
Assuming a uniform stress distribution over the tool–chip interface, the average shear stress
The shear angle ϕn and the constant C0 are determined from the stress equilibrium that kchip = τint and
Modelling of milling process
The proposed force model from orthogonal cutting is extended to milling in this section. Figure 3 shows a milling process with a helical end mill. The end mill with Nt teeth rotates at a rotation speed Ω (r/min) and advances at a feed ft (mm/tooth) or a feed rate fr (m/s). The end mill is discretised into several axial slices along its rotation axis in the z direction. Each slice is equivalent to an oblique cutting process with an elementary axial depth of cut Δz and an inclination angle λs. It is noted that a distinct difference exists between the first axial slice and the rest of the axial slices in their cutting actions as demonstrated by Li and Li. 19 The axial slices, except the first one, have only the peripheral cutting edges in cut. For the first slice, its end cutting edge, besides its peripheral cutting edge, is also involved in cut, which produces additional forces. When the axial depth of cut is small, the end cutting edge of the first slice considerably influences the chip flow angle and cutting forces. In order to allow for the multiple cutting edges, an equivalent edge that combines the peripheral and end cutting edges 24 is applied to evaluate the chip flow angle and cutting forces.
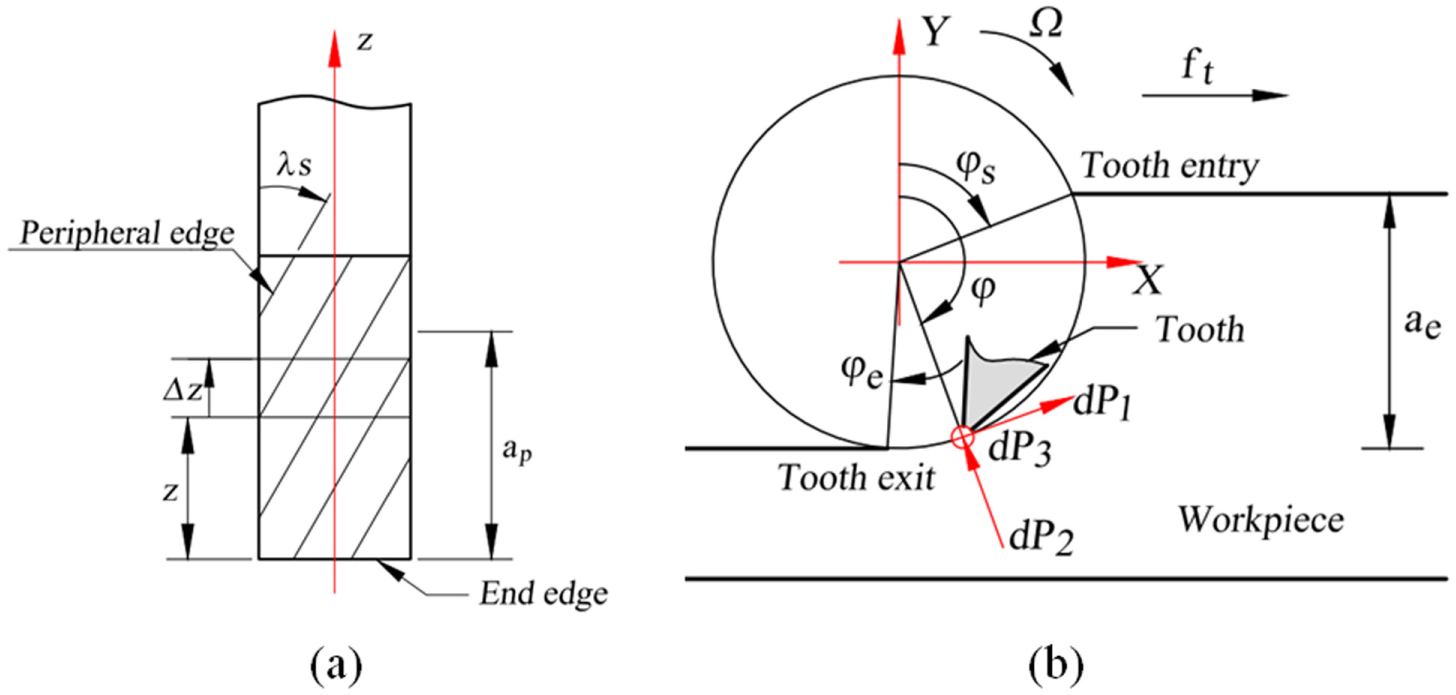
End milling process: (a) discretisation of helical end mill and (b) cross section of the end mill process.
Equivalent oblique cutting
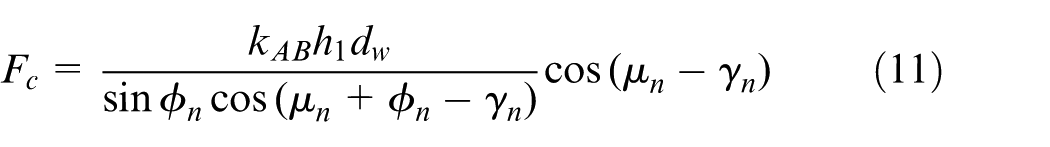
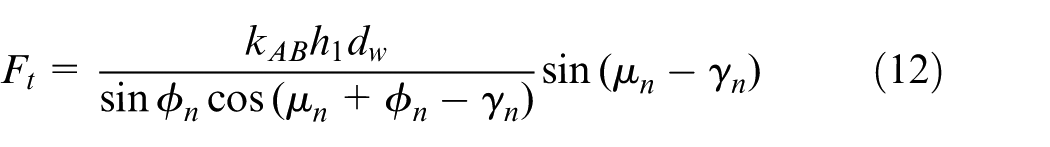
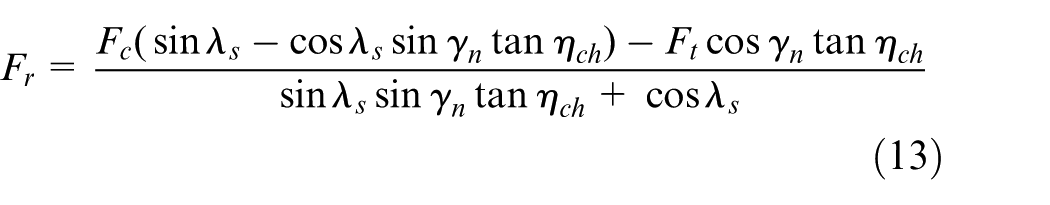
The equivalent oblique cutting for the axial slices except the first one is shown in Figure 4. The inclined cutting edge results in an additional force Fr along the tool rotation axis in the z direction. As the experimental results revealed an independent relationship between the inclination angle and the cutting forces Fc and Ft, Lin et al.
25
predicted the cutting forces Fc and Ft from the orthogonal theory by taking the inclination angle λs equal to 0 irrespective of its true value with a normal rake angle
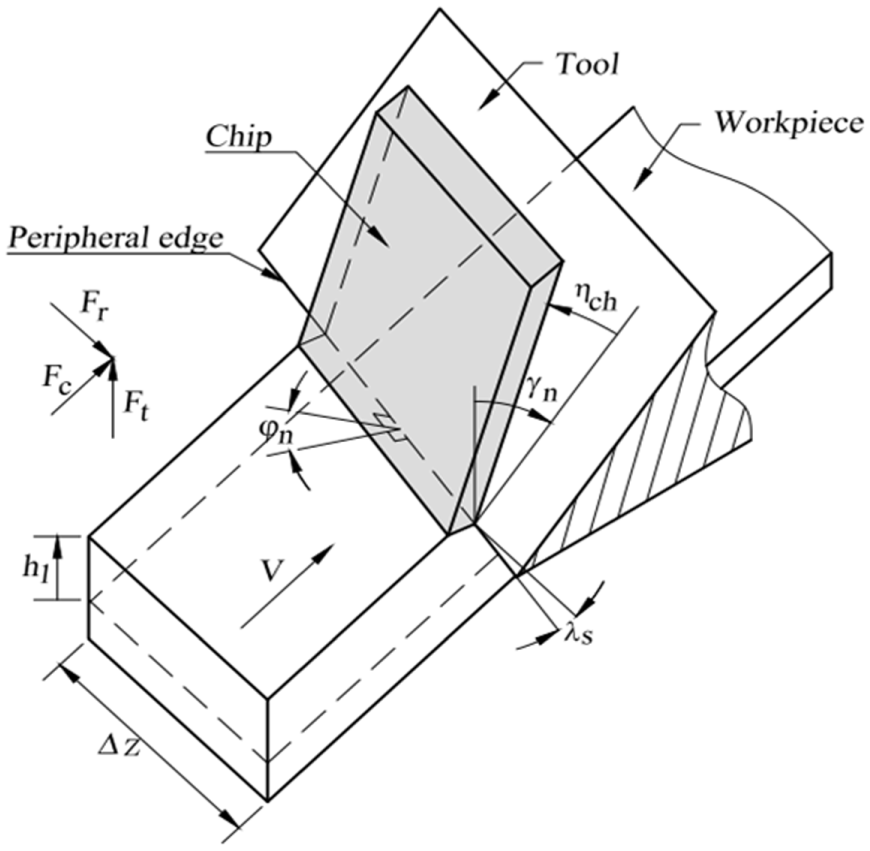
Equivalent oblique cutting for slices excluding the first one.
The chip flow angle ηch is determined according to Stabler’s flow rule which approximates the chip flow angle ηch equal to the inclination angle λs. 26
In order to allow for the end cutting edge effect for the first slice, the equivalent cutting edge developed by Hu et al.
24
is applied. Figure 5 shows the first axial slice presented in the tool-in-hand coordinate system.
27
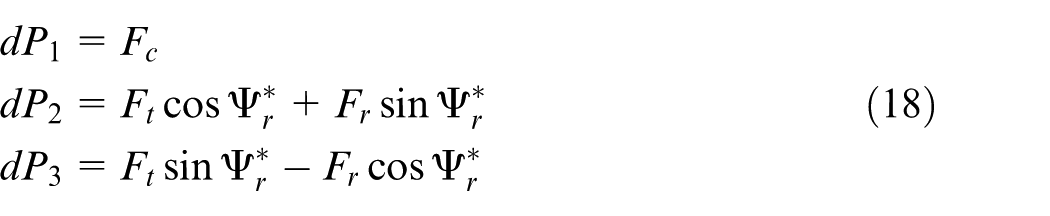
The X-axis is along the cutting speed V, the Y-axis is along the direction of feed motion and the Z-axis is along the elementary axial depth of cut Δz. There are three basic planes
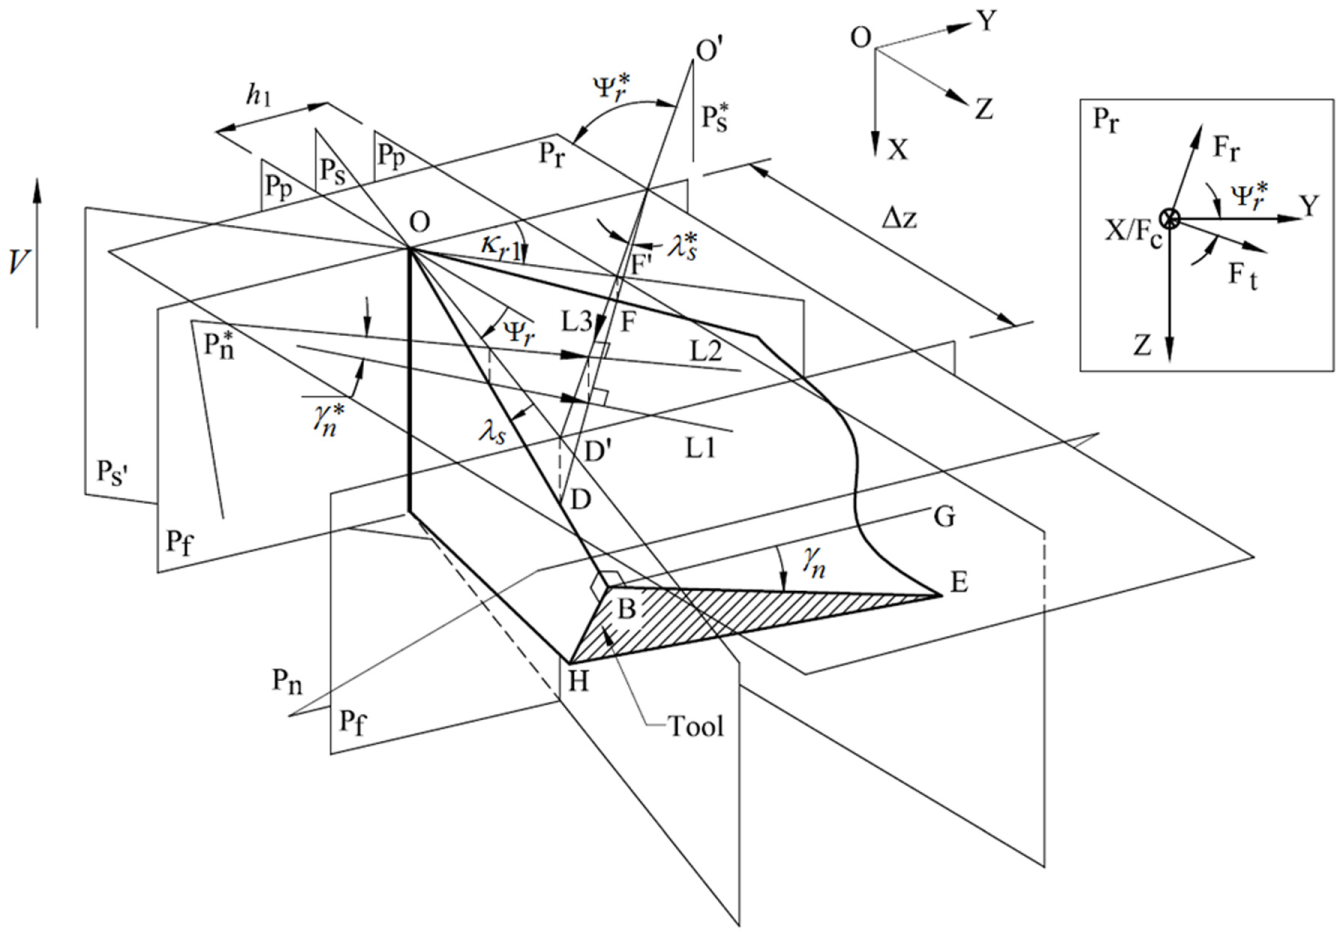
Equivalent cutting edge model for the first axial slice.
The equivalent cutting edge FD is such that the distance of point F to the plane


where
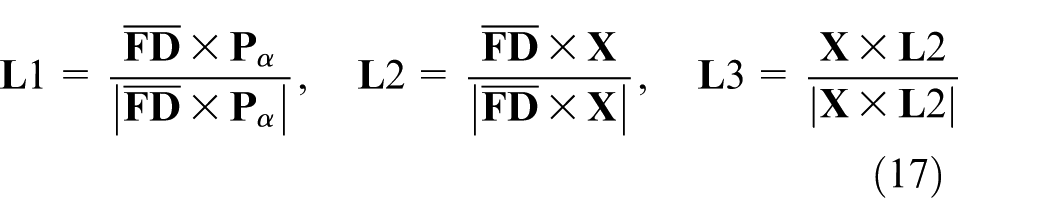
where
For the axial slices except the first one, the approach angle
It is noted that by applying the orthogonal theory for evaluations of Fc and Ft to the case that the approach angle is not zero, the uncut chip thickness and axial depth of cut should be modified as
Chip thickness model
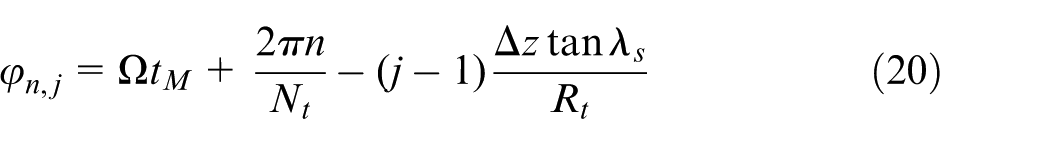
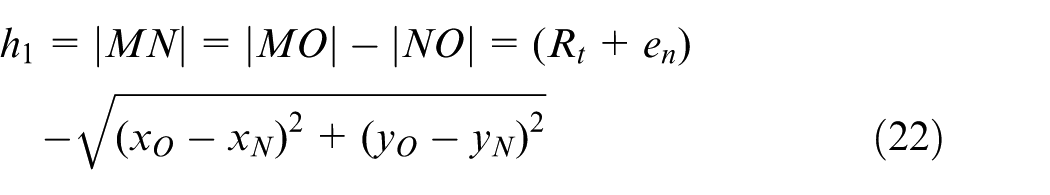
The uncut chip thickness is evaluated using a method proposed by Li et al. 28 This method considers the trochoidal tooth trajectory generated by the rotational and translational motions of the tool, as well as the static radial run-out of teeth. The radial run-out is supposed to influence the entry angle φs and exit angle φe of flutes (Figure 3(b)). However, as the radial run-out is usually far smaller than the tool radius, such an effect on the entry and exist angles is usually negligible and is ignored in this study. The uncut chip thickness |MN| at the time tM is shown Figure 6, where Point M is the tool tip of the jth axial slice at the current nth tooth, and point N is the intersection point of the previous (n+1)th tooth trajectory and the line OM passing through the current tool tip and cutter axis. Points O(xO, yO), M (xM, yM) and N (xN, yN) are expressed, respectively, as
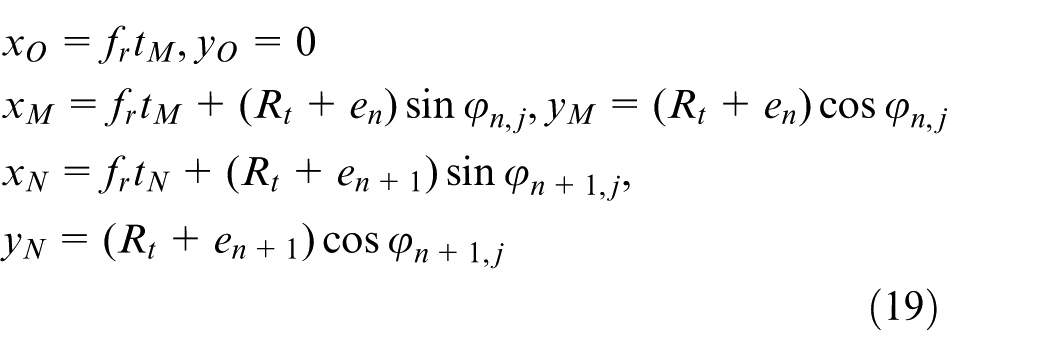
where
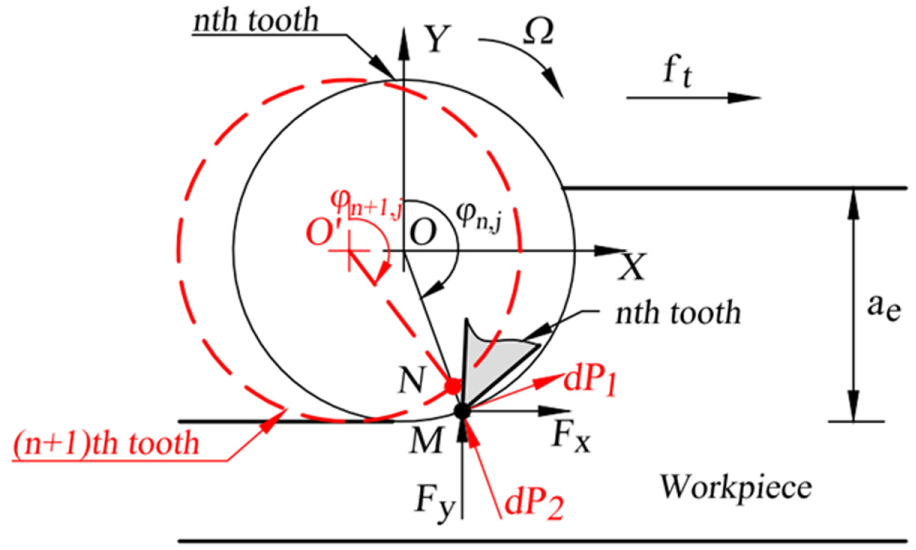
Trajectories of two consecutive teeth.
Points O, M, and N are in the same line, which gives
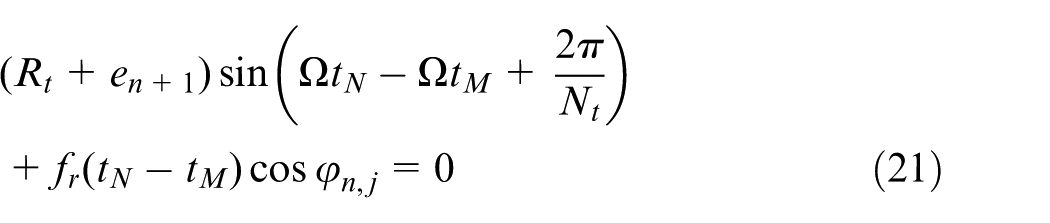
Equation (21) is solved using the Newton–Raphson method 29 to determine the time tN. Substituting tN into equation (19), the uncut chip thickness is evaluated as
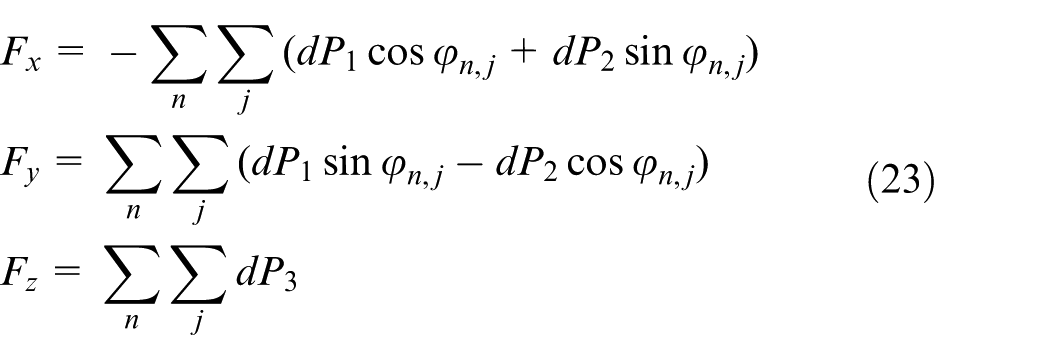
The total milling forces are evaluated by summing the elementary forces contributed by the axial slices of all teeth (Figure 6)
Model verification
Milling tests have been conducted on a Deckel Maho 5-axis computer numerical control (CNC) milling centre under dry cutting conditions. The titanium alloy Ti6Al4V workpiece was mounted on the top of a Kistler 9257B dynamometer which measured the cutting forces in three directions. The x direction is the feed direction. The detailed workpiece properties can be referred to the authors’ work.
22
An end mill Azstar E2S0600L13S06F with two flutes and a helix angle of 30° was used. The end mill has a nominal diameter of 6 mm, and its measured normal radial rake angle
Cutting conditions of selected milling tests (ae = 1.5 mm).
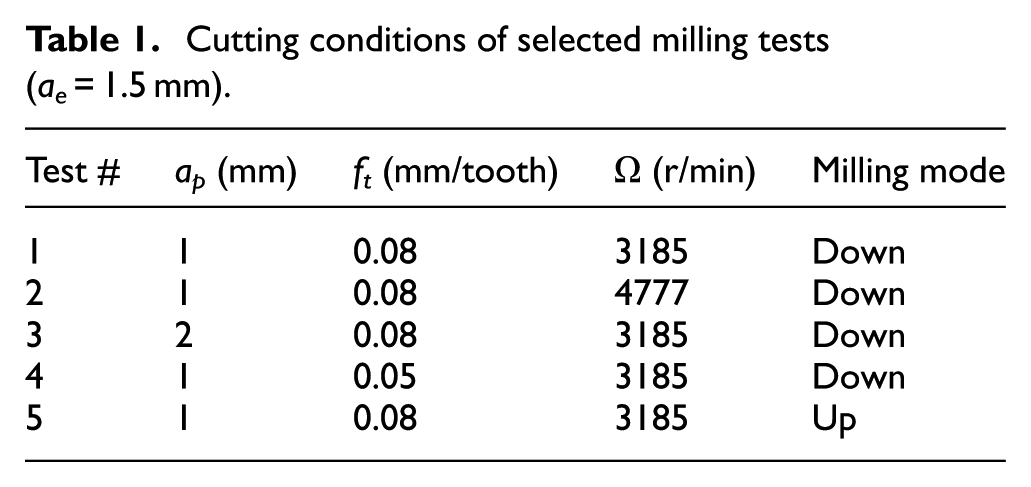
The static radial run-out was measured after each cutter was clamped onto the spindle. A laser displacement sensor with a resolution of 0.01 µm was used to measure the relative distance between the tool tip and the laser sensor as shown in Figure 7. Once the tool was rotated for one revolution, a trajectory of the tool tip relative to the laser sensor was recorded. A sample trajectory is shown in Figure 8. The relative distance between points 1 and 2 is the static radial run-out as defined by Jin and Altintas. 32 Taking flute 2 as the reference flute with the nominal radius of 3 mm, the radial run-out for flute 1 was 10 µm.
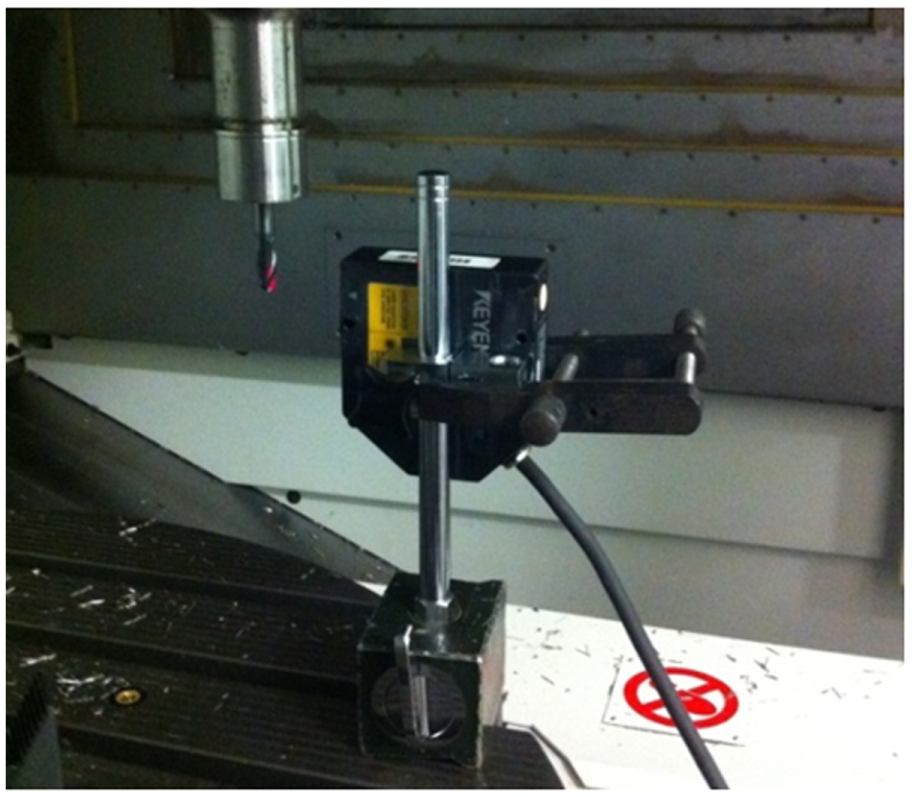
Radial run-out measurement.
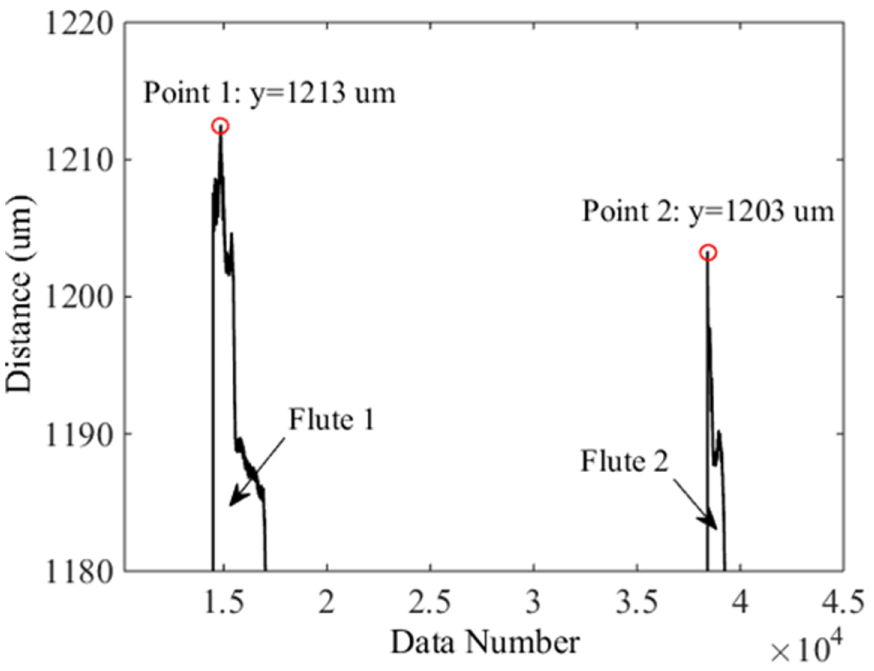
Trajectory of the tool tip relative to the laser sensor.
Although no chatter has been identified in all these tests, the measured forces still have some high-frequency components around the natural frequency of the workpiece because of free vibrations during the no-cut portion, which distorts the force waveform. Therefore, a low-pass filter with a fixed cut-off frequency 800 Hz is applied to remove the high-frequency components. The measured and predicted forces are compared in Figure 9. Although a low-pass filter has been applied to the measured forces, there are still continuous ripples on the measured forces. However, the predicted results are smooth as the vibration of the machine system is ignored. Figure 9(a)–(d) compares the measured and predicted forces from down milling tests at different cutting speeds, feeds and axial depths of cut. A good agreement between the measured and predicted results is observed. It can be seen that the cutting speed has marginal effect on the peak forces as revealed by both the measured and predicted forces. However, when the cutting speed increases (Tests 1 vs 2), the measured force waveforms show large-amplitude oscillations. A fast Fourier transform (FFT) spectral analysis of the measured forces reveals that this is caused by the larger magnitudes of high-order harmonics of the tooth passing frequency for Test 2 than those for Test 1. In addition, a higher axial depth of cut or feed gives higher peak forces because of the increased chip load and thus the material removal rate.
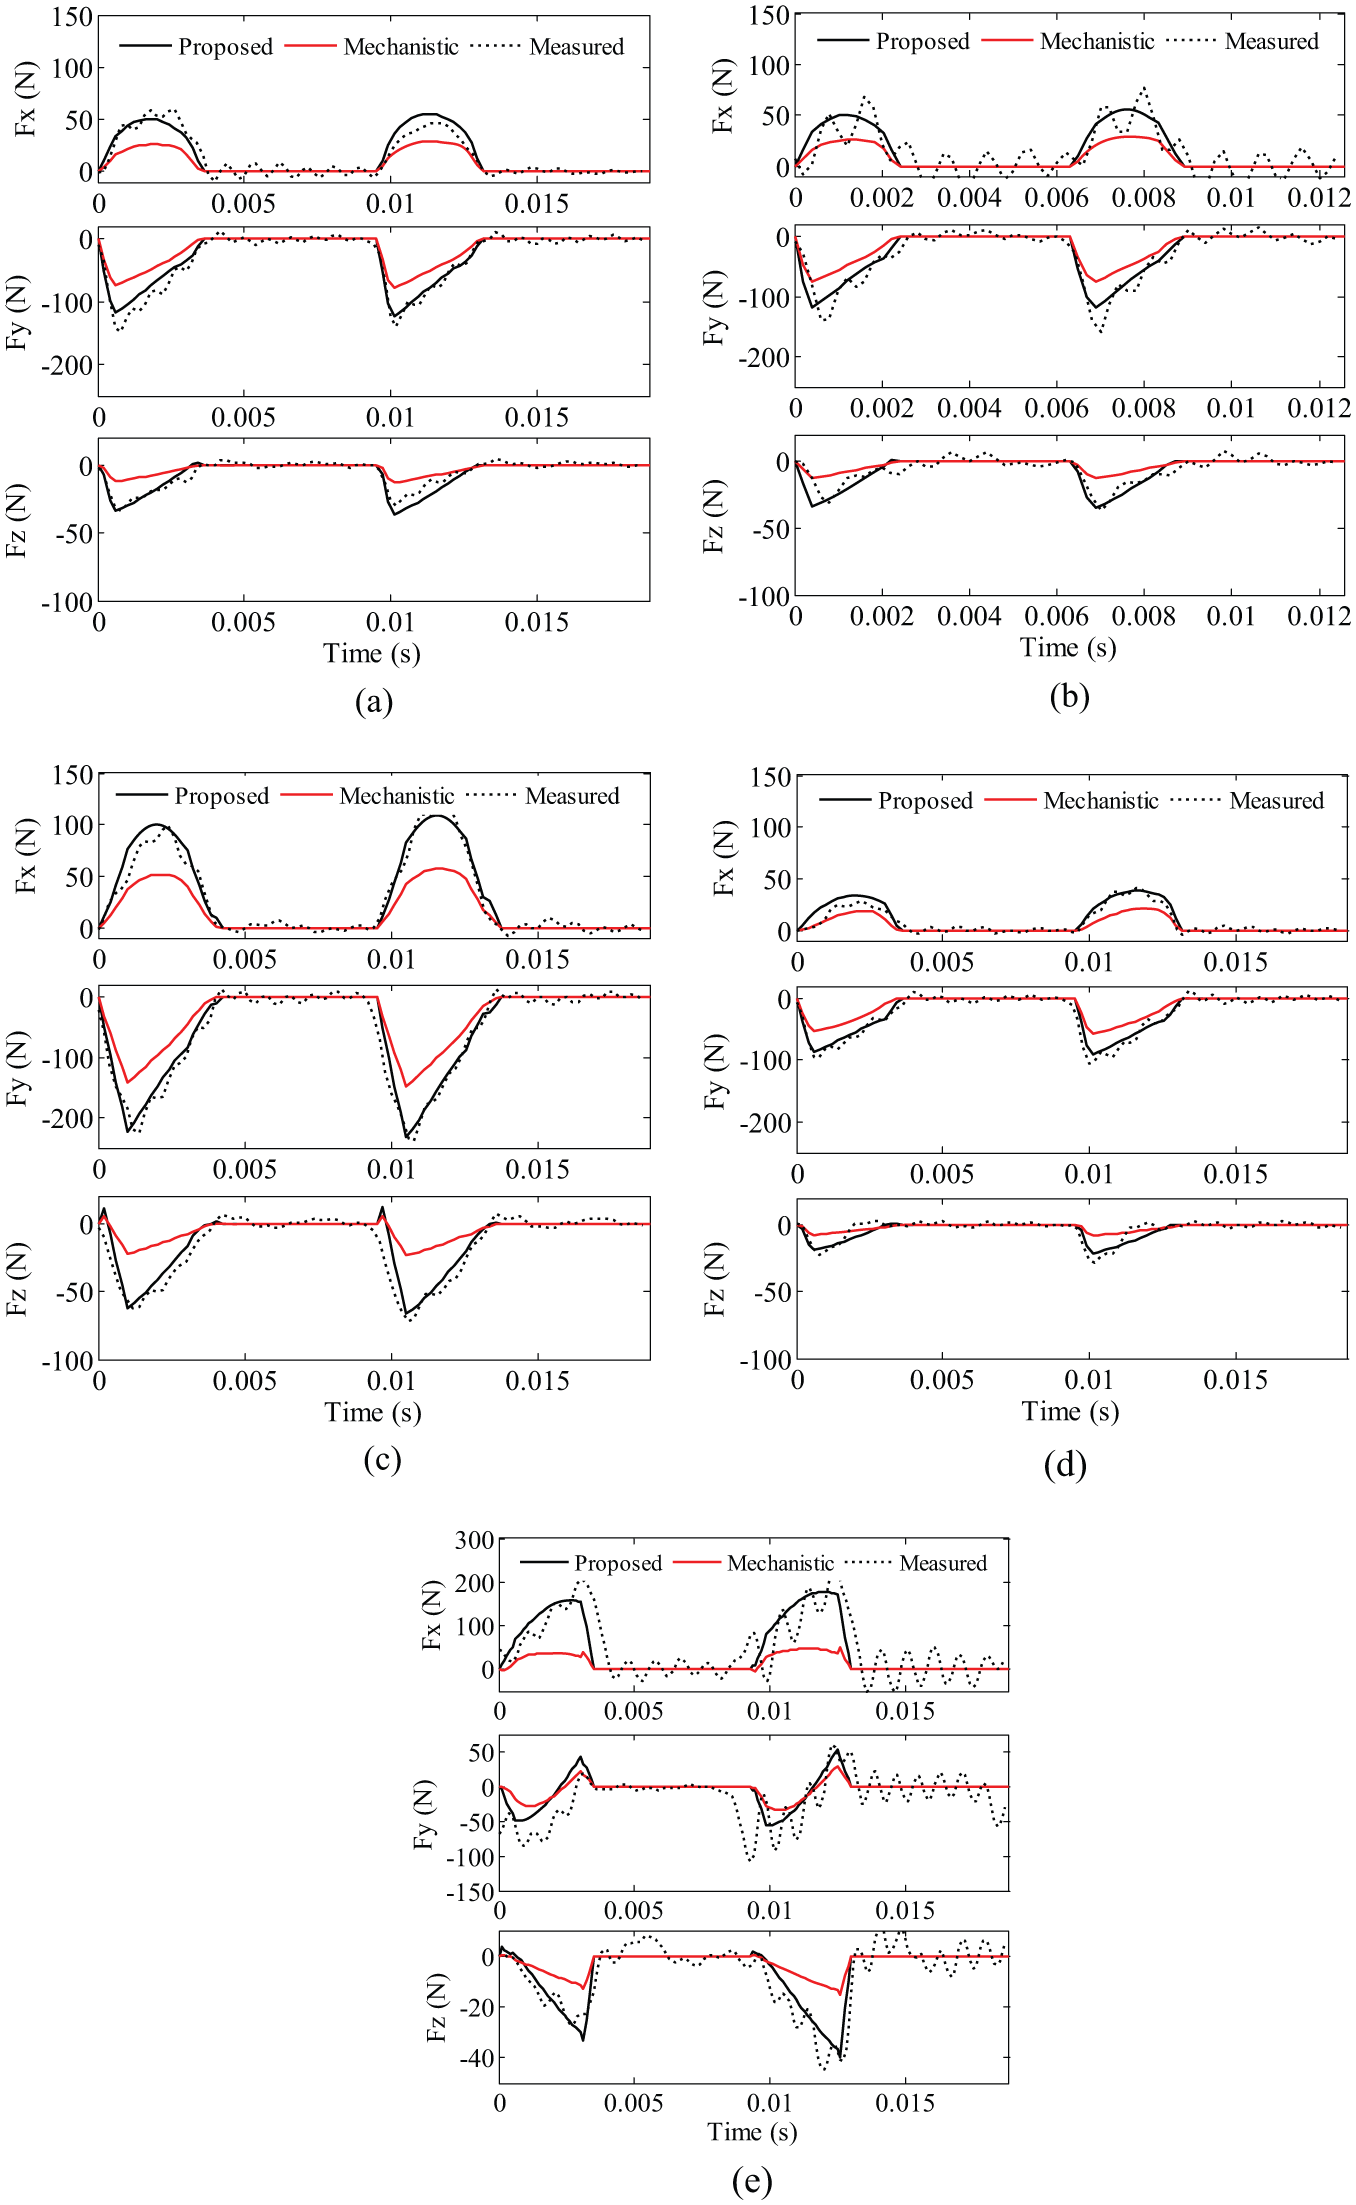
Comparison of predicted and measured forces: (a) Test 1, (b) Test 2, (c) Test 3, (d) Test 4 and (e) Test 5. Cutting conditions are listed in Table 1.
The performance of the force model is also assessed for up milling as shown in Figure 9(e). The predicted peak forces are close to the measured values, but the phase width of the predicted force waveform differs from that of the experimental one, especially in the y direction. Wan et al.
33
attributed the difference in the phase width to the forces caused by the end cutting edge. These forces exist even when the peripheral cutting edge is not in cut, which pushes the effective cutting upper boundary beyond the exit angle
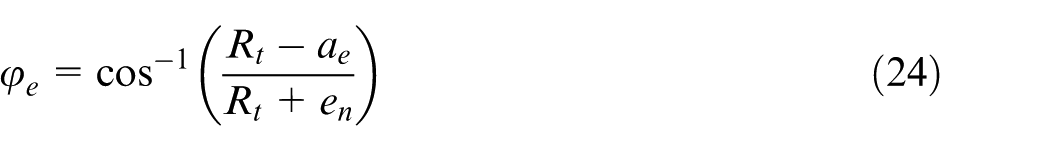
where ae is the radial depth of cut. Equation (22) indicates that the exit angle
In Figure 9, the force prediction using a mechanistic model as in Wan et al. 35 is also presented for comparison. The force coefficients in the mechanistic model were identified from the average measured forces over one tooth passing period. It can be seen that the results from the mechanistic model show significant deviations from the measured values for all the investigated tests. The deviations are possibly caused by an inaccurate calibration of the force coefficients. Additionally, the mechanistic model requires matching the experimental forces and the instantaneous average chip thickness. As the measured forces are usually influenced by the tool–workpiece vibration, it is difficult to exactly identify the critical point at which a tooth begins cutting engagement. This also challenges the accurate calibration of the coefficients. On the other hand, the proposed method demonstrated more accurate force prediction results than the mechanistic model. It is actually built on an analytical force model that couples the thermal and mechanical effects and is independent of the experimental data. Machining process models are used by the industrial practitioners to select optimum machining parameters. When the process models are not accurate enough, more conservative machining parameters have to be chosen and hence lead to loss of productivity and accuracy. Improvement of model accuracy can help to achieve optimum machining parameters such as feed, cutting speed, depth of cut and cutting fluids. Even small changes in any of these parameters may have a significant effect on the surface quality and productivity. Therefore, it is important for the researchers to develop more accurate models.
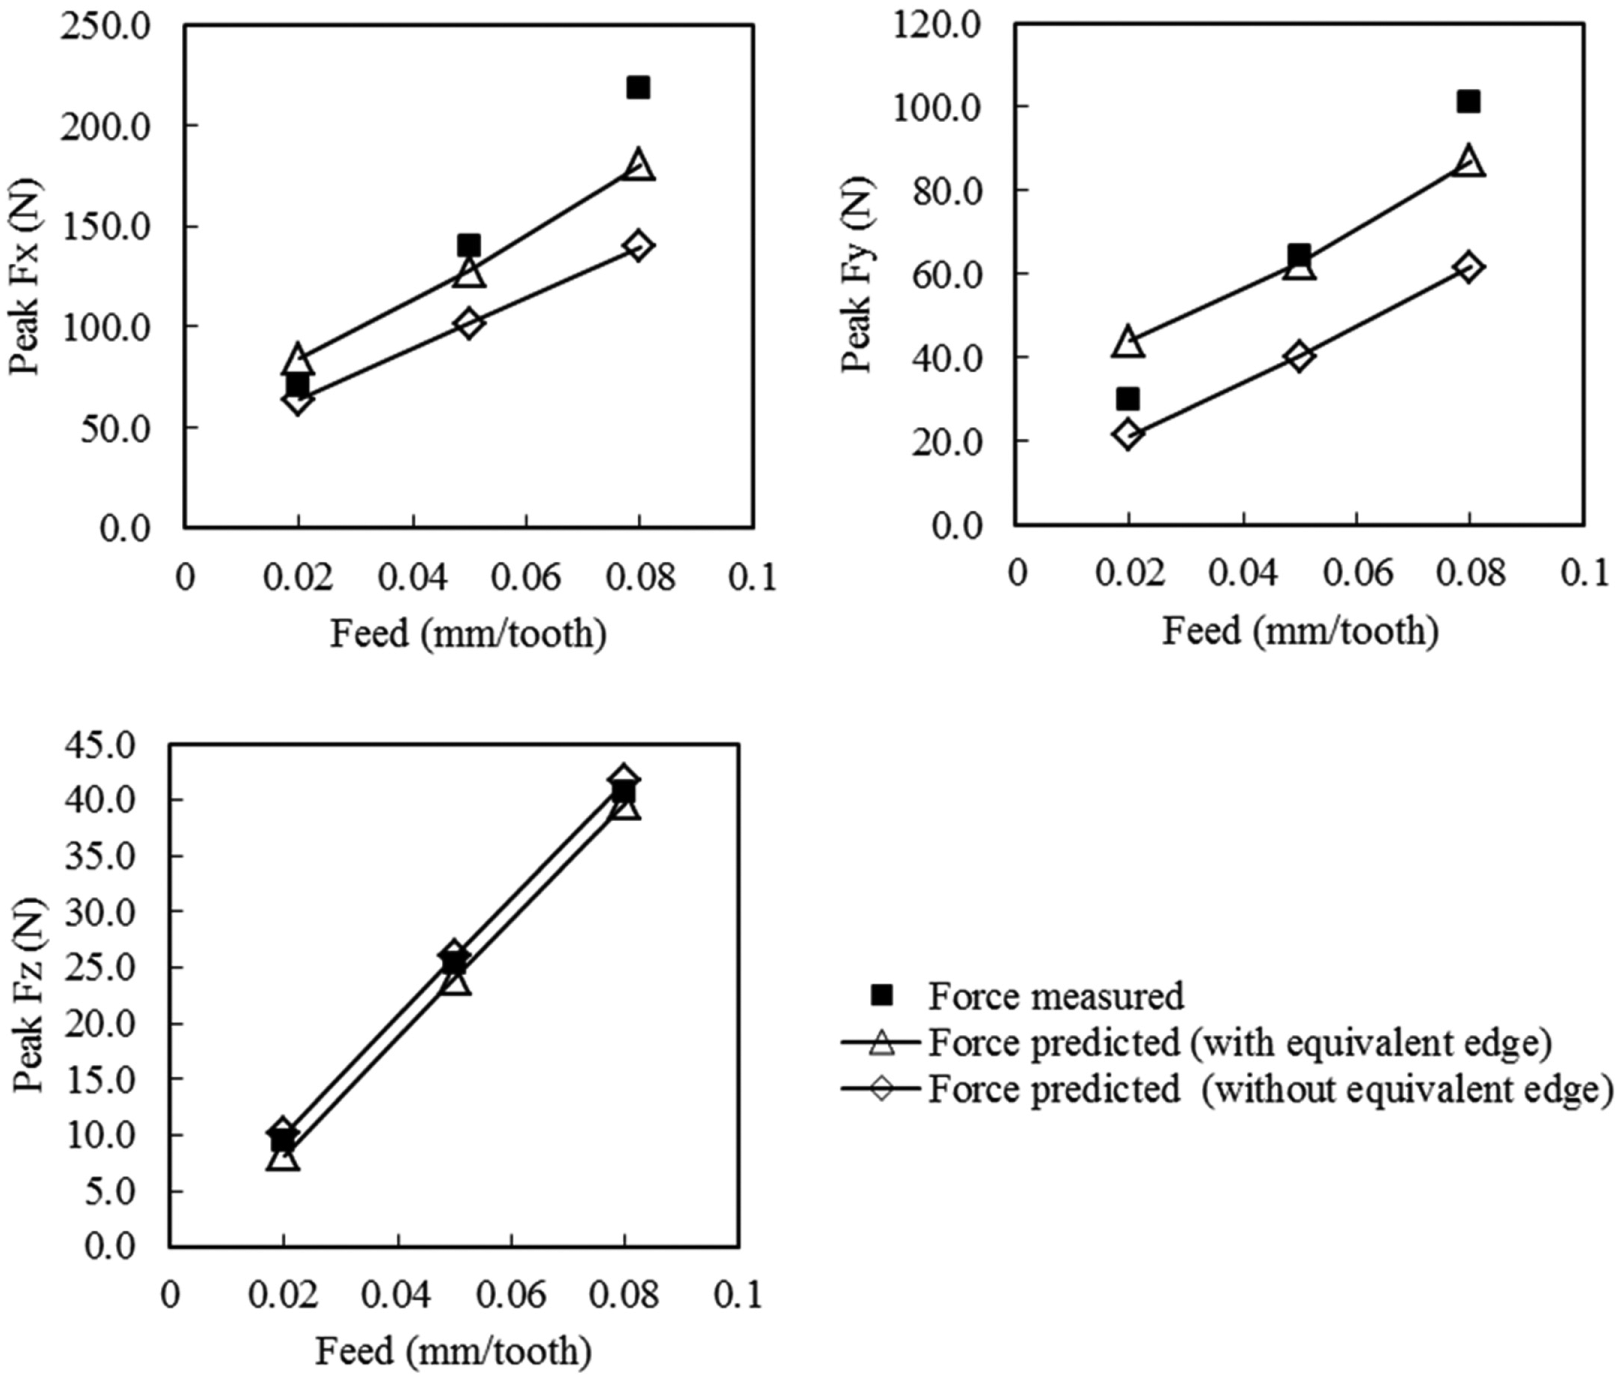
Figures 10 and 11 present comparisons of the predicted and measured peak forces in the three principal directions under different cutting conditions, in the down and up milling operations, respectively. Two sets of force models were used in the force prediction, using the approaches with or without the equivalent cutting edge considered, respectively. The percentage errors of the simulated peak forces in Figures 10 and 11 using the model with the equivalent cutting edge considered are less than 20%, which indicates acceptable simulation accuracy. It can be seen that an increase in the feed per tooth caused a clear increment of the peak forces in all directions. The developed models are able to predict such a trend along with the increase in the feed. Both models with and without the equivalent cutting edge can predict the peak forces much closer to the measured results in the z direction. It is found that the predicted peak forces Fx and Fy using the model with the equivalent cutting edge considered are closer to the experimental results than that without such a cutting edge considered, although both models underestimated the peak forces when the feed per tooth was high. One possible reason for the obvious deviation of the simulated results at high feed is that the tool–workpiece vibration is significant when the chip load is high, as can be seen in Figure 9(b) and (e). Although a low-pass filter was applied to the force signal, the cut-off frequency was still high and the vibration ripples still existed, which contributed to high measured peak force values. However, the influence of the cutting dynamics has not been included in the developed cutting force model. To further improve the model accuracy, the dynamic cutting process and tool–workpiece vibration should be taken into consideration in the cutting force modelling.
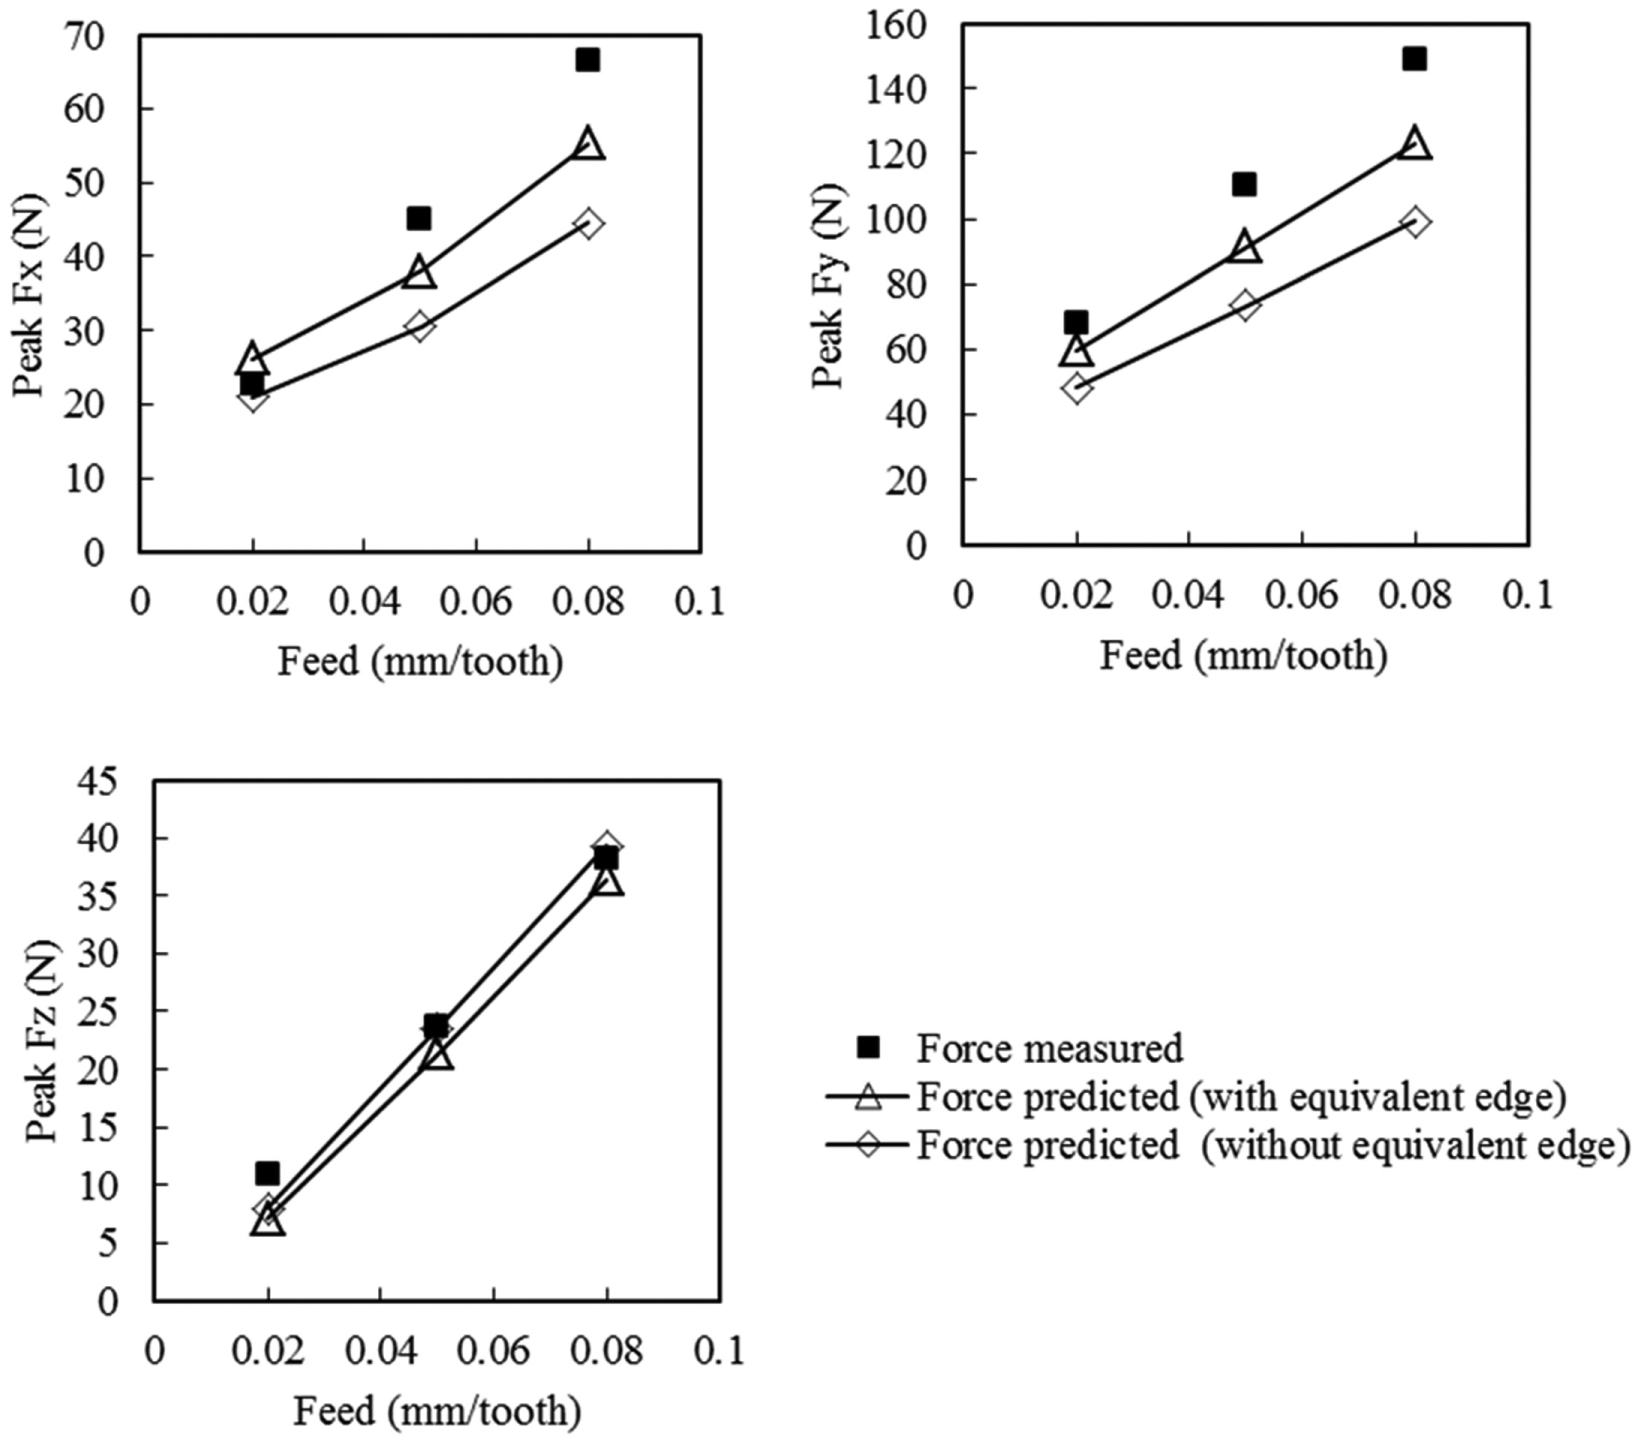
Peak forces at Ω = 3185 r/min, ap = 1 mm and ae = 1.5 mm (down milling).
Peak forces at Ω = 3185 r/min, ap = 1 mm and ae = 1.5 mm (up milling).
Conclusion
In this article, a predictive cutting force model in end milling of titanium alloy Ti6Al4V has been developed. This work is based on a predictive model which was proposed by the authors for orthogonal cutting. The thermo-mechanical effect is incorporated using the Johnson–Cook material model and a thermal model considering the tool thermal properties. An equivalent cutting edge is applied to include the cutting forces generated by the end cutting edge. The true tooth path and radial run-out are included in the chip thickness model. The proposed force model is verified under different cutting conditions. The results show that acceptable force predictions have been obtained in end milling of titanium alloy, which indicate a reasonable assumption of the semi-stationary serrated chip formation. The proposed force model with an equivalent cutting edge improves the force predictions in the x and y directions. Both the force models with and without the equivalent cutting edge predict the forces in the z direction close to the measured ones. It is noted that the predicted forces in up milling differ from the experimental ones in terms of phase width. Future work is still needed to improve this model in up milling. The proposed model overcomes the drawbacks of the FE and mechanistic methods which require many simulations and experimental tests to determine the cutting force coefficients.
Footnotes
Appendix 1
Declaration of conflicting interests
The author(s) declared no potential conflicts of interest with respect to the research, authorship and/or publication of this article.
Funding
The author(s) received no financial support for the research, authorship and/or publication of this article.