
Abstract
Powder-bed electron beam additive manufacturing has the potential to be a cost-effective alternative in producing complex-shaped, custom-designed metal parts using various alloys. Material thermal properties have a rather sophisticated effect on the thermal characteristics such as the melt pool geometry in fabrications, impacting the build part quality. The objective of this study is to achieve a quantitative relationship that can correlate the material thermal properties and the melt pool geometric characteristics in the electron beam additive manufacturing process. The motivation is to understand the interactions of material property effect since testing individual properties is insufficient because of the change of almost all thermal properties when switching from one to the other material. In this research, a full-factorial simulation experiment was conducted to include a wide range of the thermal properties and their combinations. A developed finite element thermal model was applied to perform electron beam additive manufacturing process thermal simulations incorporating tested thermal properties. The analysis of variance method was utilized to evaluate different thermal property effects on the simulated melt pool geometry. The major results are summarized as follows. (1) The material melting point is the most dominant factor to the melt pool size. (2) The role of the material thermal conductivity may outweigh the melting point and strongly affects the melt pool size, if the thermal conductivity is very high. (3) Regression equations to correlate the material properties and the melt pool dimension and shape have been established, and the regression-predicted results show a reasonable agreement with the simulation results for tested real-world materials. However, errors still exist for materials with a small melt pool such as copper.
Keywords
Introduction
Powder-bed additive manufacturing (AM) becomes the main application of solid freeform fabrication method in recent years. In such a process, commercially available atomized metallic or alloyed powders will be melted using a high-energy moving beam heat source to fabricate desired parts under programmed systems. Engineering components can be fabricated with complex internal features and embedment of prefabricated components such as fibers and sensors. 1 However, challenging issues such as build part geometric errors 2 and quality variance hinder effective AM applications. Electron beam additive manufacturing (EBAM) technology, which has been developed and commercialized by Arcam AB, 3 is one of few powder-bed AM technologies that can produce fully dense metal parts directly from metal powder with the target material features. During powder-bed AM part building process, mathematically sliced thin layer information will be created from the computer-aided design (CAD) part model. The cross section of the sliced CAD model is represented by individual shaped layer. Then, designed part can be produced by the controlled consolidation of the deposited powder material in a layer-by-layer adding fashion. 4 The detail of the process can be found in literature. 5 In addition, the EBAM process takes place under vacuum environment, thus it is able to manufacture easy reactive materials such as titanium which has a high affinity for oxygen.
Titanium (Ti) and titanium alloys are materials with outstanding mechanical properties and have been widely applied in the area of aeronautics, medical and automotive systems. Generally speaking, conventional fabrications of these materials such as casting and machining are challenging due to their high melting point and extreme chemical affinity to atmospheric gas. 6 Therefore, EBAM is a perfect solution for these materials in various applications. Besides the widely used titanium alloys, EBAM has also been applied on other metal-based materials including intermetallics, 7 tool steels, 8 copper, 9 and nickel-based superalloys. 10 Murr et al. 7 have studied the microstructures of EBAM TiAl intermetallic products. They have noticed that a phase transformation has been caused by the EBAM process, and the build parts showed an equiaxed γ-TiAl (faced-centered cubic (FCC)) grain structure with a lamellar γ/α2 colony structure of 0.6 µm average spacing within the γ-grains. They have also pointed out that the residual hardness would be introduced by relatively high dislocation density. The microstructure and properties of EBAM-produced H13 steel specimens were investigated by Cormier et al. 8 Generally, martensite structure and full interlayer bonding with a hardness of 48–50 HRC were observed for the obtained H13 parts. Ramirez et al. 9 investigated the resulted microstructure and mechanical properties of EBAM fabricated copper components by adding Cu2O precipitate in atomized Cu powder. Increased hardness was created by these precipitate-dislocation architectures. Murr et al. 10 showed columnar precipitate architecture and unusual microstructures in the EBAM Inconel 625 samples. In addition, the solid, mesh and foam Co-29Cr-6Mo alloy specimens manufactured by EBAM have exhibited a directional and columnar Cr23C6 precipitate architecture. Those precipitate architectures were observed to be parallel to the build direction of EBAM process and intermixed with some stacking faults in the FCC matrix. 11 These works just mentioned are generally the observation from experiments. More detailed investigations about the change in the thermal behaviors when subject to electron beam melting are required to understand the effects of powder materials. Numerical thermal analysis can be an effective tool for the preliminary study of thermal responses of different powder materials during the EBAM process. There have been studies presenting about the process modeling for various processes. However, few such investigations were focused on EBAM.
EBAM is a rather complicated process including complex heat transport, physical mechanisms as well as powder material properties. Due to the increasing demand of evaluating EBAM process performance and part quality consistency, accurate heat transfer physical model is required to capture thermal response and determine melt pool characteristics. It has been pointed out that numerical modeling for the thermal or mechanical prediction in AM process could be similar to that of multi-pass welding. 12 However, the utilization of powder material distinguishes EBAM from general welding process. The review work of Schoinochoritis et al. 13 summarized the recent progress in numerical simulation of metallic powder-bed AM process. It has been noted that most of the simulation works have been developed for laser-based process. There are still several EBAM models that have been presented to simulate the complicated physical process. Mahale 14 developed a three-dimensional (3D) model using COMSOL Multiphysics for Al 7075 simulation in the EBAM process. Zäh and Lutzmann 15 simulated EBAM thermal process considering the powder properties. Jamshidinia et al. 16 built an EBAM numerical model to study the fluid convection and temperature distribution inside the melt pool. Recently, a novel 3D finite element method (FEM) thermal model was developed by Cheng et al. 17 to investigate temperature distribution and powder porosity effect on melt pool size, potentially correlated to the occurrence of the deficiencies. The simulated thermal response and cycle are very helpful to understand the transient process, within a few milliseconds.
On the other hand, plenty results have been presented about the process characteristics on melt pool geometry for related processes. Xu et al. 18 discussed various heat source models and calculated melt pool geometry in different welding processes. Han and Liou 19 numerically investigated the influence of laser beam mode on melt pool. Ahmed et al. 20 presented their study about beam shape on melt pool characteristics. Juang and Tarng 21 studied process parameter selection to optimize the weld pool geometry in the tungsten inert gas welding of stainless steel. Kim and Peng 22 investigated how to optimize the melt pool size by selecting optimal the process parameters to reduce the dilution in laser cladding. Soylemez et al. 23 presented both analytical and numerical methods to develop a process map of melt pool cross-sectional area (Ax) and length/depth ratios (L/D) in a wire-feed EBAM process. Constant Ax and L/D ratio could be maintained through selected beam power, speed and wire deposition rate. Cheng and Chou 24 studied the Ax and L/D relationship with beam speed, power and diameter in a powder-bed EBAM process. The prediction equations have been proposed between process parameters and melt pool characteristics. Price et al. 25 presented both experimental and numerical works to investigate the process parameters effect on melt pool size and part surface quality. Antony et al. 26 utilized both numerical and experimental methods to study the process parameters effect on temperature and melt zone characteristics in a single-track laser melting process. They showed that appropriate selection of process parameters could realize homogeneous layer formation in laser scanning process. Kamara et al. 27 numerically investigated the influence of anisotropic thermal conductivity on melt pool shape in a laser deposition process. Their results indicated that thermal conductivity directional enhancement factors should be carefully decided so as to accurately capture melt pool size. Romano et al. 28 utilized 3D FEM modeling method to study different melt pool geometries and temperature distributions among commonly used commercial metal materials in both selective laser and electron beam melting processes. They have pointed out that process parameters should be optimized for each material in actual builds. Ma et al. 29 applied both numerical modeling and design-of-experiment approach to identify critical variables in a laser powder-bed fusion (L-PBF) process. They have found that the laser power, specific heat, scan speed and powder packing ratio were the dominant factors affecting the peak temperature of IN625. However, the effect of material properties has not been well studied to help people efficiently capture the performance of one material in a particular process, such as EBAM. Thus, extra effort has been focused on the material effect on the melt pool characteristics for EBAM in this study.
In this study, extended numerical studies for various materials, such as Ti-6Al-4V (Ti64), IN718, AISI316L, TiAlNb and copper (Cu), were conducted with developed FEM thermal model in literature. 17 The thermal model was used to evaluate material thermal property effects, namely, conductivity (k), specific heat (Cp), latent heat of fusion (Lf) and melting temperature (Tm), on the melt pool length over depth ratio (L/D) and cross-sectional area (Ax). The design-of-experiment approach was used, with analysis of variance (ANOVA) method, to evaluate the characteristics of melt pool shapes for different conditions. The effect of specific material properties on the melt pool characteristics was investigated, and a material property correlation equation was derived to help people understand the effect of a particular material model on the melt pool characteristics from a more comprehensive picture in EBAM.
Numerical modeling
Thermal model
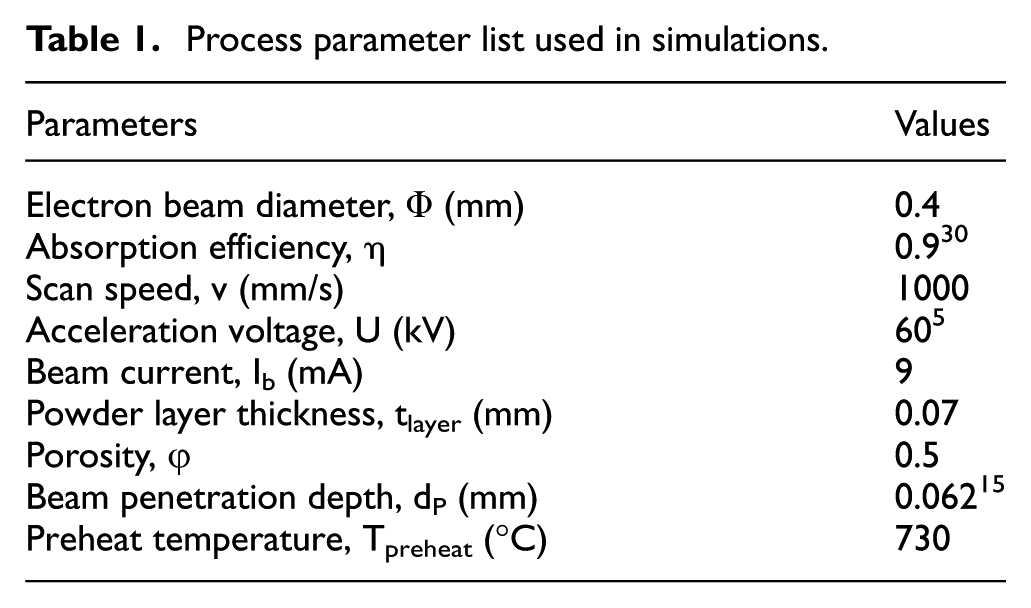
With the negligible convection of a melt flow during the solidification process in the EBAM process, the dominant mode of heat transport is heat conduction with radiation at top surface, subject to a moving heat source at the part top surface. The latent heat of fusion was included in the model to incorporate the material phase transformation. It was calculated as an additional term of the internal thermal energy per unit mass based on mass liquid fraction in the temperature range between the solidus (TS) and liquidus (TL) point. To approximate the heat intensity input, the electron beam is typically modeled as a conical moving heat source with Gaussian distribution intensity and linearly decaying in penetrating depth direction across a horizontal surface. A 3D FEM EBAM thermal simulation has been implemented in ABAQUS. Figure 1 presents the model and boundary condition information. The electron beam scan was simulated as a single straight path along the x-axis on the top surface. The substrate was assumed as a solid to represent the solidified material from previous depositions, while a thin powder layer was considered at the top of the substrate with powder material properties. Thermal radiation was considered in the heat transfer between the powder/part and surroundings since the EBAM process is conducted in vacuum chamber. A thermal initial condition, simplified as a uniform temperature distribution of the whole model, was adopted to approximate the observation of preheating effect from the experiments. A user-defined subroutine of DFLUX was programmed in FORTRAN so as to apply the heat source in the FEM model. The subroutine read the simulation time to determine the domain and magnitude of the volumetric heat source. The process parameters used were the values commonly used, listed in Table 1. All material properties are temperature dependent which will be discussed in a later section. The details of the thermal model and finite element implementations can also be found in a previous study. 17
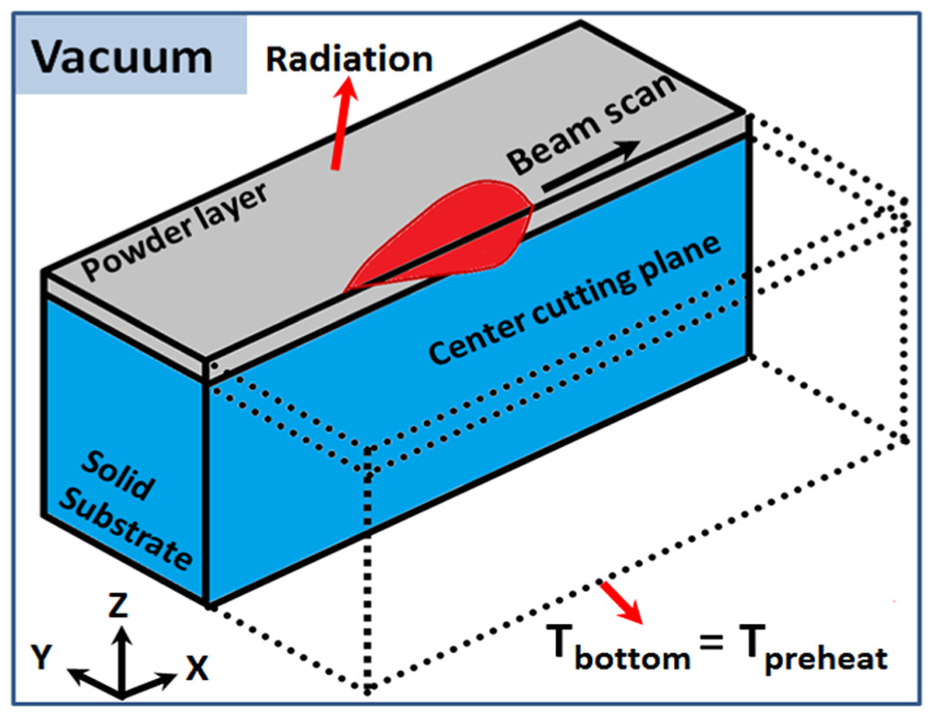
FEM model configuration and boundary conditions.
Process parameter list used in simulations.
The model has been validated using experimental measurements for Ti-6Al-4V material. Cheng and colleagues17,25 utilized a near-infrared (NIR) thermal imager to measure the build surface temperatures during EBAM fabrications. Data post-processing has been done to obtain process temperature profile and melt pool sizes. The collected temperature profiles and melt pool sizes were compared against the simulations for model validations. With the validated EBAM model, several cases of FEM thermal simulations were conducted using different powder materials to study the thermal property effects on the melt pool geometry.
Thermal properties
Properties of solid bulk materials
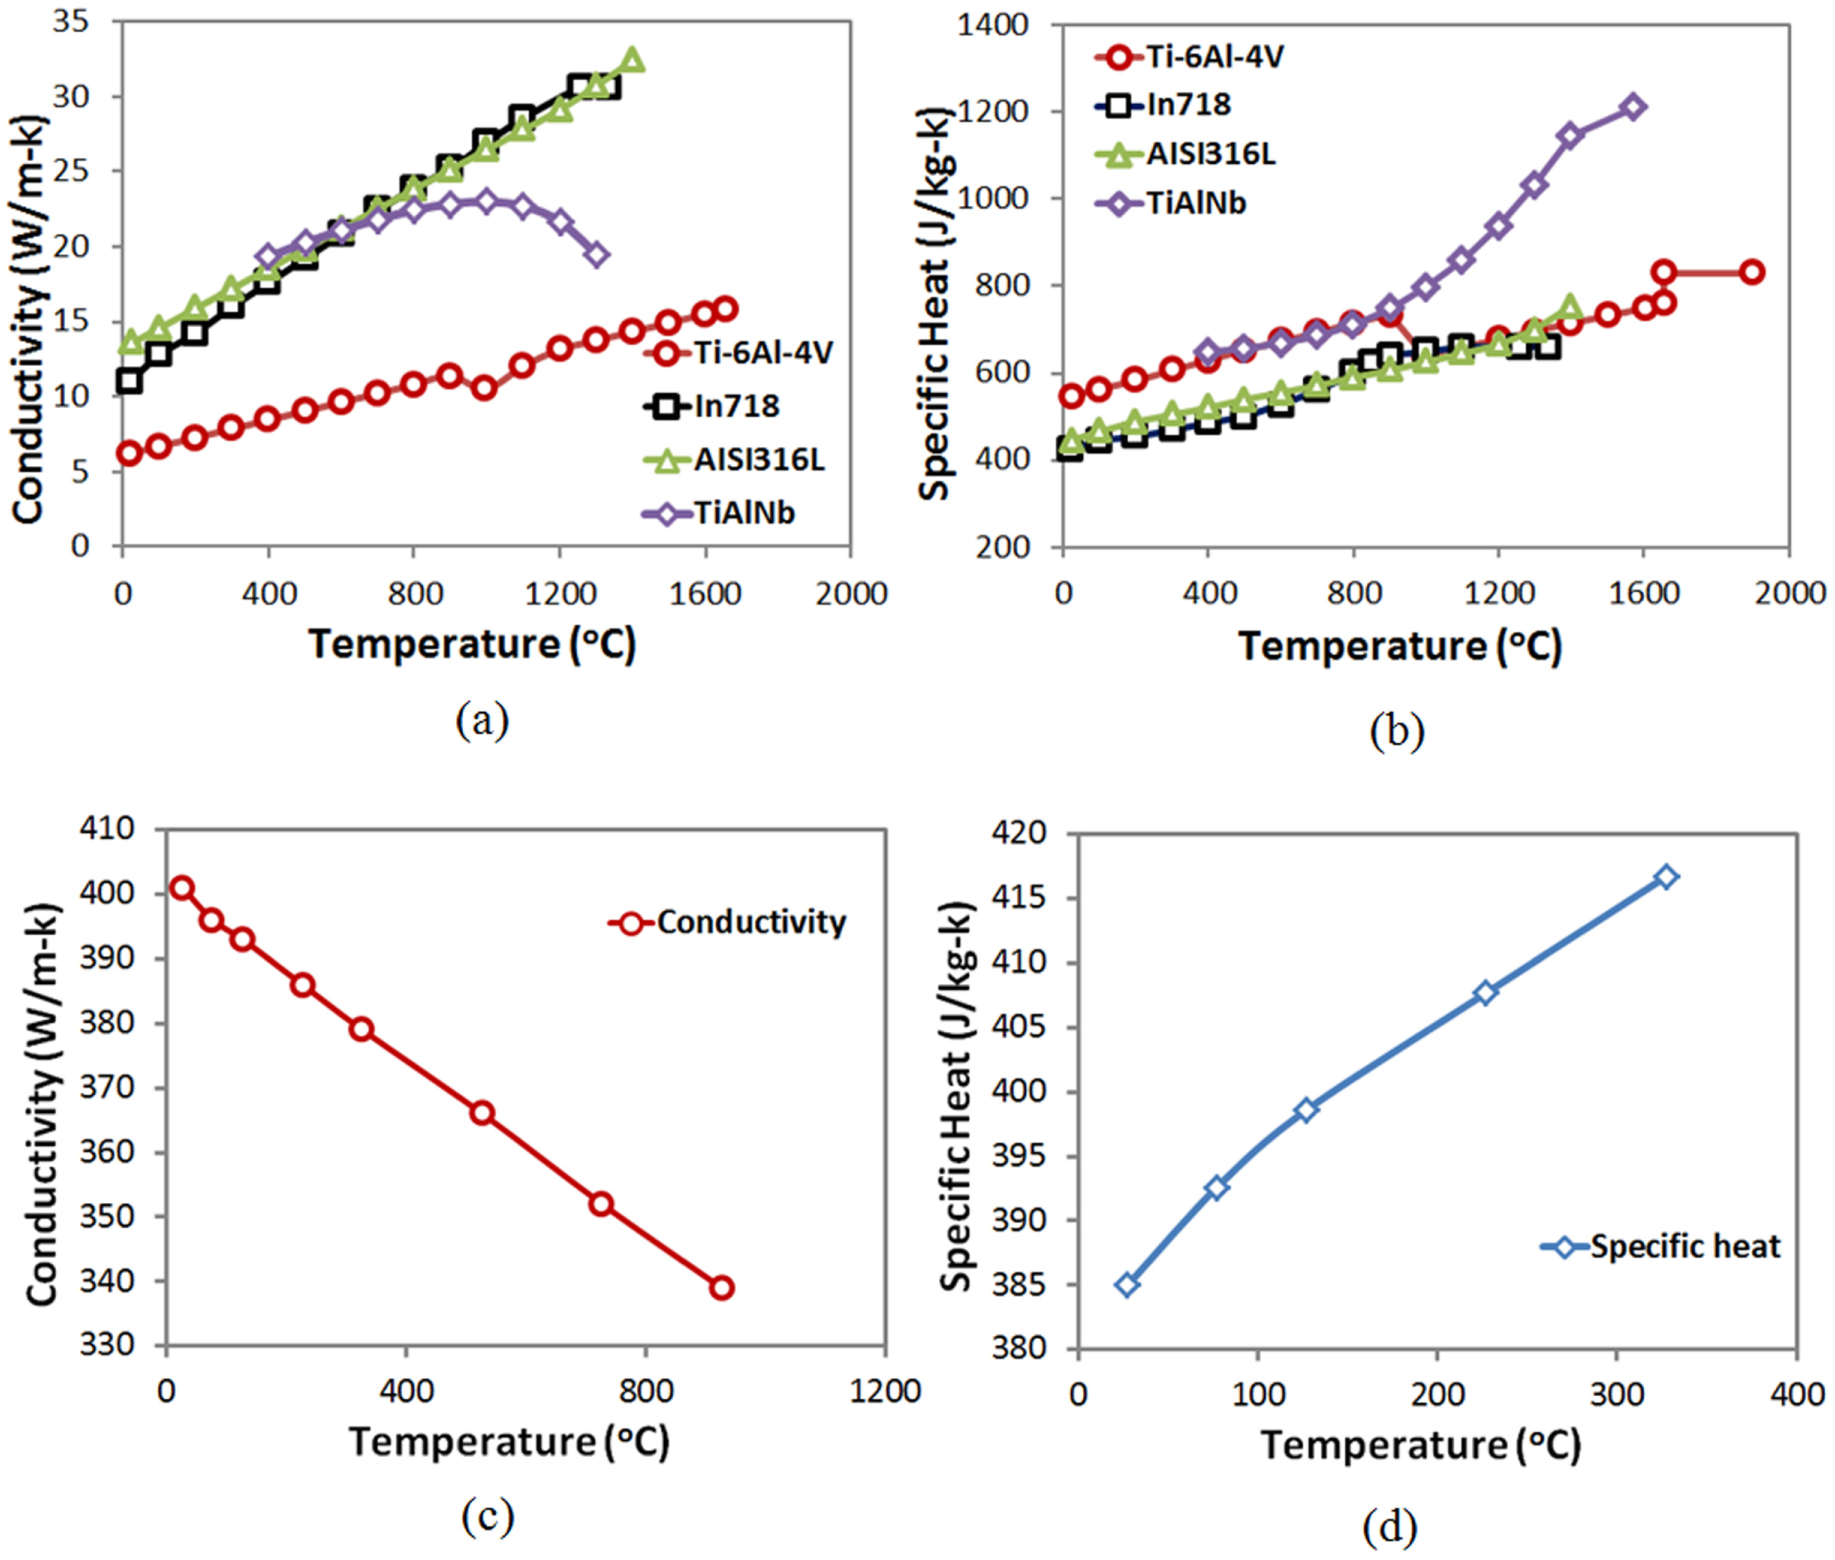
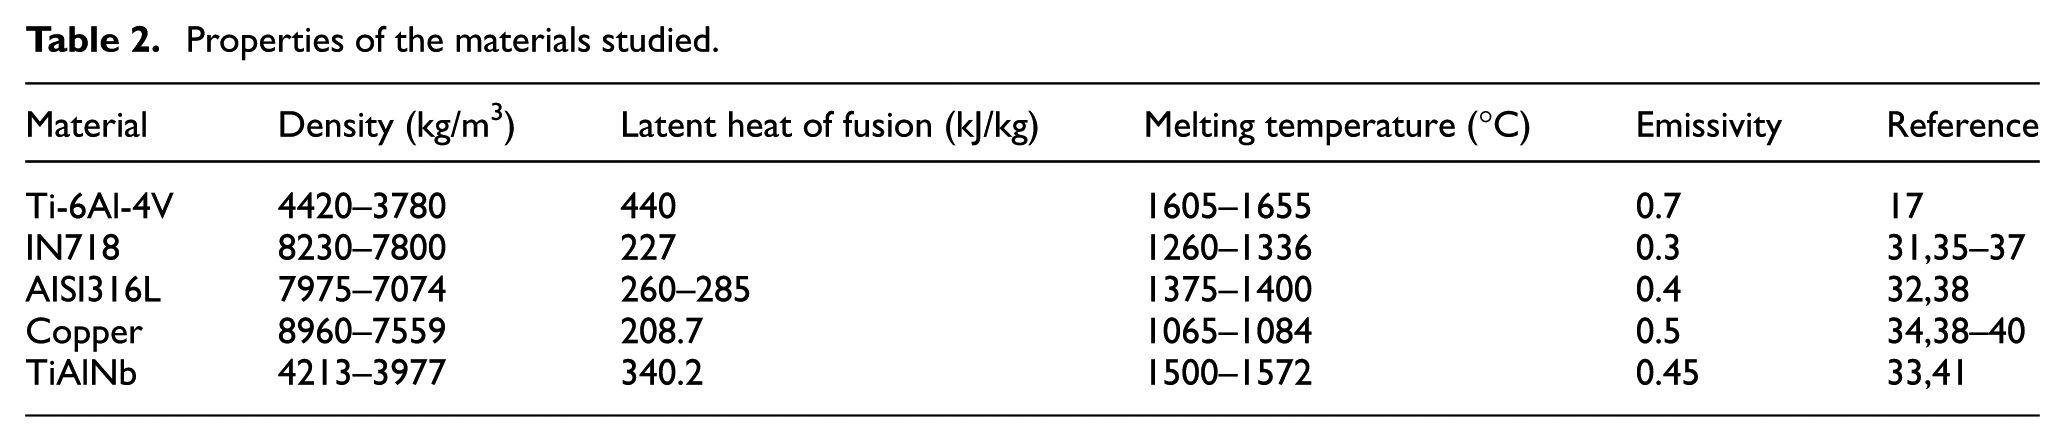
Various materials were investigated in this FEM study including experimentally measured EBAM solid part Ti-6Al-4V, 17 IN718, 31 AISI316L, 32 TiAlNb, 33 and copper. 34 The thermal conductivity and the specific heat of the studied materials are shown in Figure 2. Since the thermal conductivity of Cu is significantly different from the other four materials, the thermal properties of Cu are separately shown in Figure 2(c) and (d). The other related properties are listed in Table 2 for the materials studied. It should be noted that the thermal conductivity of TiAlNb is not measured as those of other materials. It was estimated from the measured temperature-dependent thermal diffusivity, specific heat and density. 33 The emissivity of the bulk materials is required as a result of including radiation in the thermal model, but the value is generally unknown for a powder-type material in EBAM. Therefore, the emissivity in the laser or EBAM processing was used for all the materials17,32,35,38 in this study. The emissivity of TiAlNb was not available, and thus, the emissivity of TiAlN 41 was used.
Properties of the materials studied.
Properties of metallic powders
The latent heat of fusion and specific heat of powder materials are generally considered the same as the solid materials.15,42,43 The emissivity of powders has also been modeled as the same with solid bulk materials. The thermal conductivity of 50% porosity powders has been considered according to the ratio of Ti-6Al-4V solid and powder conductivity value. 17
Design-of-experiment approach
Mathematical methodology is usually adopted to relate input variables and desired responses so as to quantify the output parameters. In a laser-aided AM study by Ahn et al., 44 a relationship has been established between the input variables, such as chord height tolerance and hole diameter, and response such as geometric error, for the purpose of evaluating the geometric accuracy of 3D printed parts with hole features. In this research, it has been noted that material properties have a rather complex effect on the melt pool geometry in the EBAM process. Because virtually all thermal properties would change when a different material was selected, testing individual properties is insufficient to understand, nor predict, the anticipated thermal response when using a different material. A study is underway with a more systematic approach to conduct different simulation cases using the design-of-experiment approach. The intent is to analyze the effects due to the interactions between different thermal properties, so to identify the properties as well as the property interactions that are significant to the thermal response in EBAM. The objective is to achieve a quantitative relationship that can correlate the material properties and the melt pool size and shape in the EBAM process.
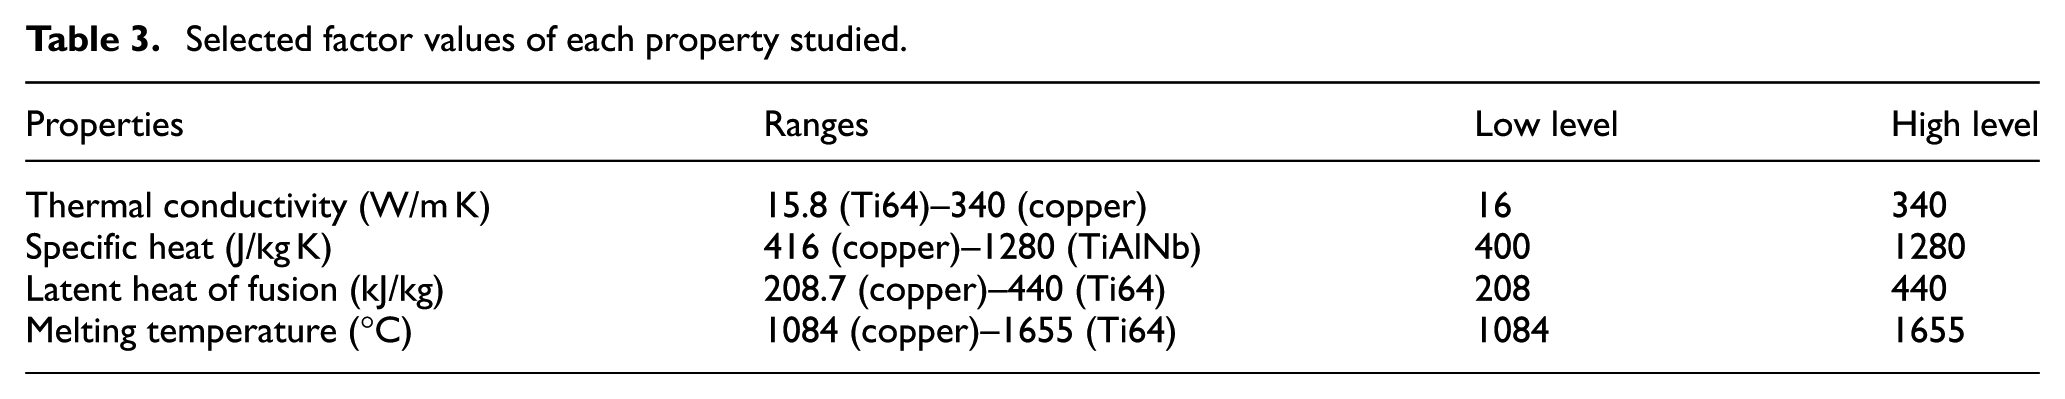
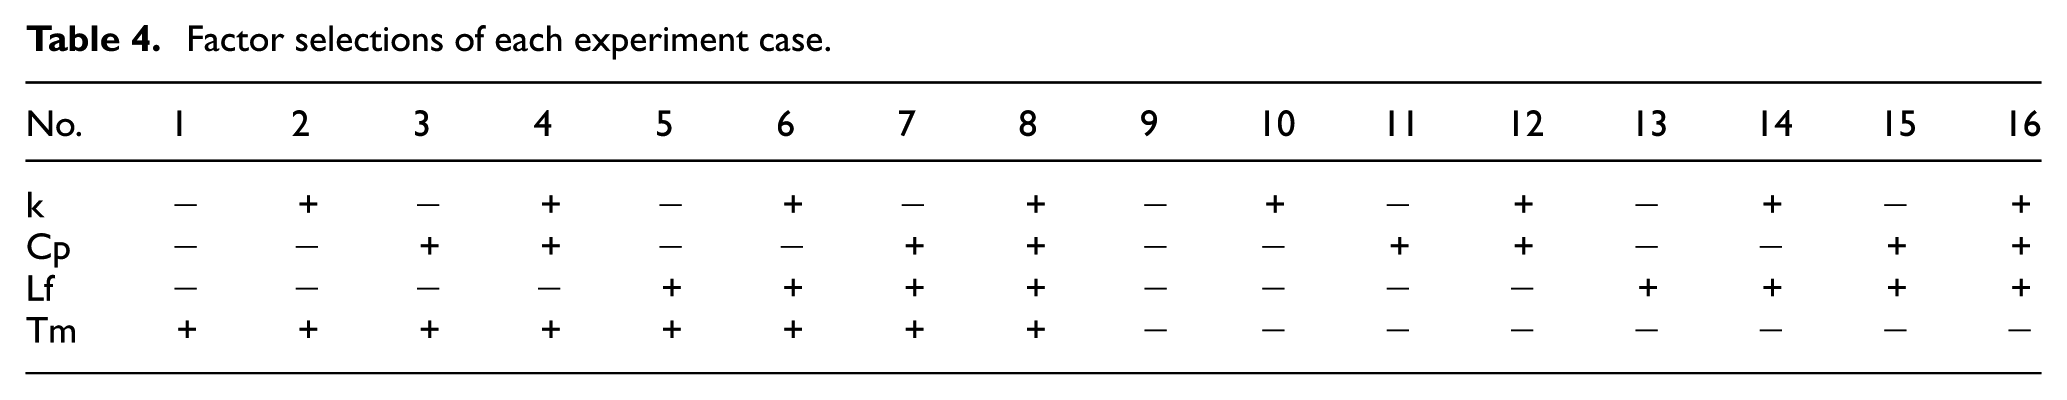
A study of factorial numerical experiments of material effects on the melt pool geometry was conducted. Four material properties were considered as the factors. They are thermal conductivity, specific heat, latent heat of fusion and melting temperature. Two levels, covering a reasonable range, were designated for each property. Those two values were picked generally based on the minimum and maximum values for each property among the five actual materials studied and did minor adjustment. Ranges of all the materials and the picked factor values are listed in Table 3. In Table 3, the listed melting temperature is the liquidus temperature. The listed thermal conductivity and specific heat are the values at or most close to the liquidus temperature. Since the thermal conductivity and specific heat are temperature dependent, each original curve was shifted based on the ratio of the value at liquidus temperature over the adjusted low- or high level of each property. The solidus to liquidus range is set to be 50 °C for all cases. All the material thermal properties will be incorporated in an artificially designed material X with Ti64 density to conduct material effect study. A full-factorial experiments, that is, totally 16 sets of simulations, were conducted. The spread sheet of the factor selection is shown in Table 4.
Selected factor values of each property studied.
Factor selections of each experiment case.
Results and discussion
Material property effect on melt pool size
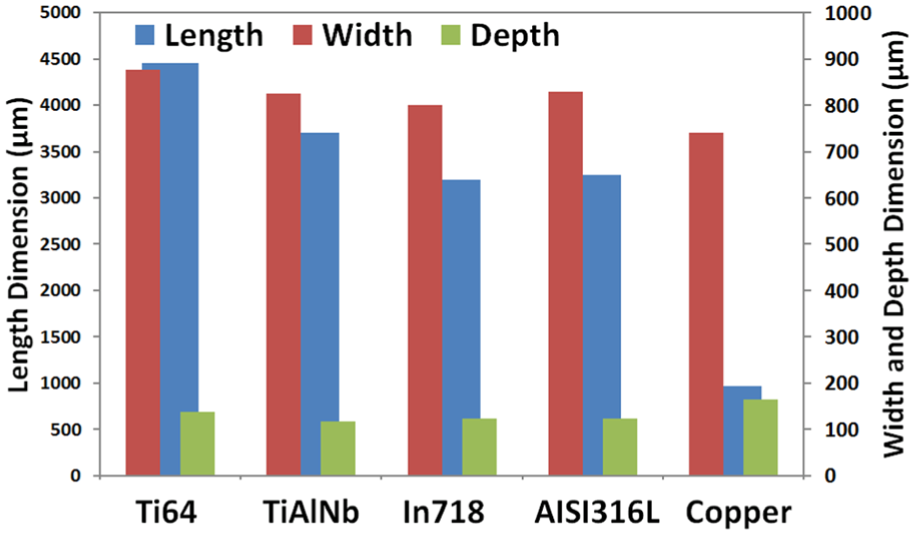
The simulation result of each case is a transient temperature distribution in the EBAM part. At any instant, if the heat source has moved long enough, the thermal phenomenon can be considered to reach a quasi-steady state. The temperature distribution can be used to extract the melt pool boundary, using the material liquidus temperature. Then, the melt pool boundary can be used to calculate the melt pool size, again in a quasi-steady state. The simulated melt pool length, width and depth (L × W × D) information for all the materials are summarized in Figure 3. For the range of process parameters tested, the effects of process parameters on melt pool geometry have several characteristics:
The melt pool geometry has a large variance; for example, the melt pool length varies from ∼371 to ∼17,200 µm, the melt pool width changes from ∼468 to about ∼1052 µm and the melt pool depth ranges from ∼51 to ∼300 µm.
At the same melting temperature, the melt pool size generally decreases with the increase in the conductivity, specific heat and latent heat of fusion.
With a given sets of conductivity, specific heat and latent heat of fusion, low melting temperature usually causes a large melt pool size.
A high conductivity significantly reduces the melt pool dimension.
In the tested value range, the melt pool length is most sensitive to material property changes; it varies in a very wide range compared to width and depth.
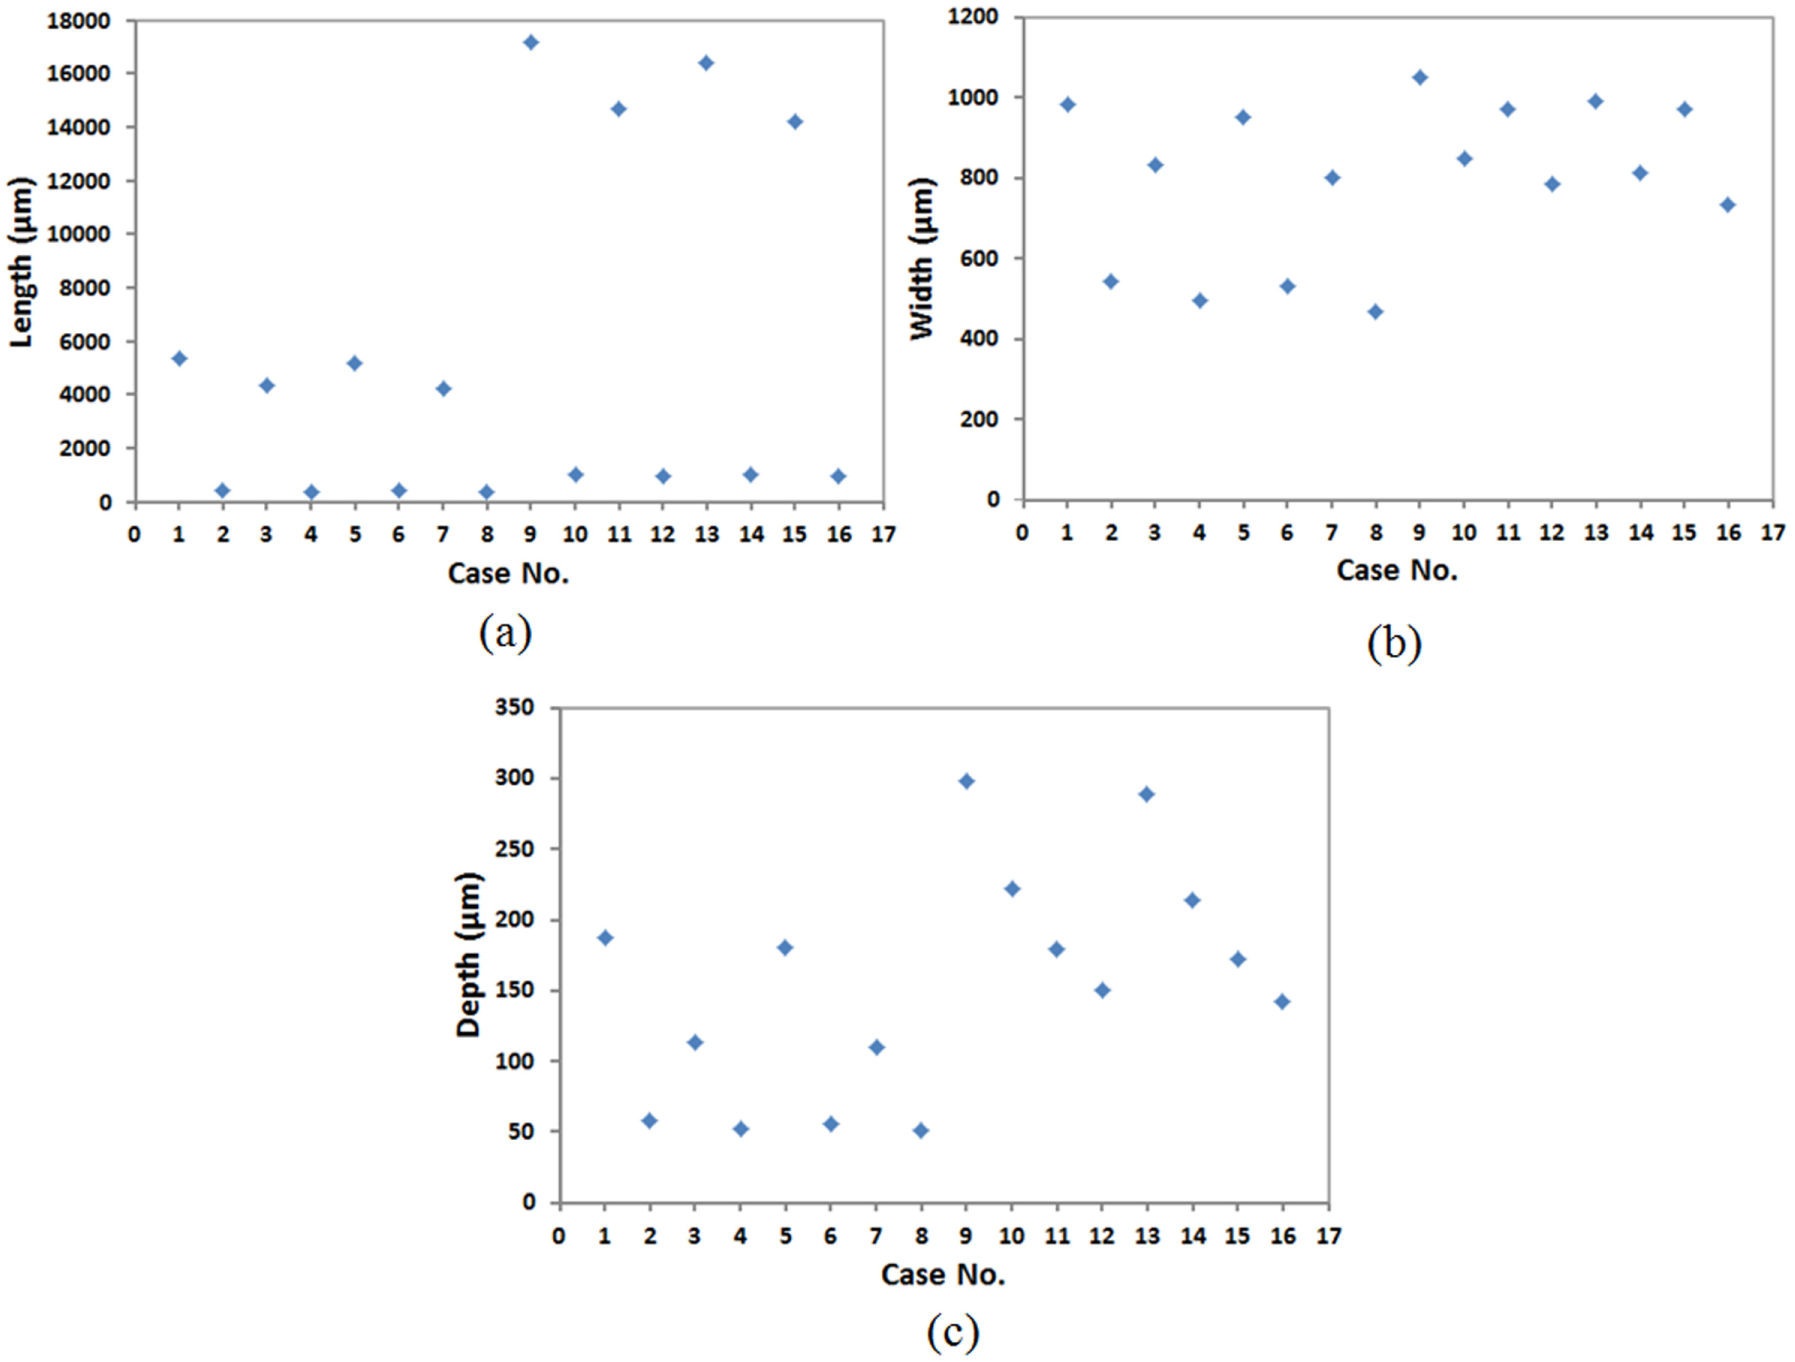
Simulated melt pool information: (a) melt pool length, (b) melt pool width, (c) melt pool depth.
A detailed examination of the simulated results has been conducted to extract more information about the thermal property effect. First, the effect of melting temperature has been checked. It is obvious that the higher melting temperature can make the material more difficult to be melt, so that the melt pool size should be smaller, especially referring to a shorter length in EBAM. In other words, a smaller melt pool is expected when the melting temperature is higher. Since the only difference between paired case N and N + 8 (N = 1 − 8) of Table 4 is the melting temperature, they provides interesting information to observe the melt pool geometry difference between different pairs. The melt pool lengths from all pairs with lower melting temperature were longer by the range of ∼130% to ∼240%. Meanwhile, all the melt pool becomes wider (by ∼7% to ∼59%) and deeper (by ∼56% to ∼282%).
The effect of thermal conductivity is referred to the comparison of the neighboring odd number of cases (low k) and even number of cases (high k) of Table 4, since the difference in thermal conductivity between these paired cases is large enough (one is about 20 times greater than the other). Generally speaking, a smaller melt pool size is observed when all other material properties are the same for high conductivity case. However, the melt pool length and width of case numbers 10, 12, 14 and 16 are smaller than the expectation which should be larger than those of corresponding case numbers 1, 3, 5 and 7 due to much lower melting point. On the other hand, the melt pool depth of case numbers 10, 12, 14 and 16 is larger than that of case numbers 1, 3, 5 and 7. This may imply that the lower thermal conductivity makes it easier for the absorbed heat to spread on two sides of the scanned track but to penetrate shorter under higher melting point when compared to the performance of high conductivity at low melting point. Therefore, the thermal conductivity may be the dominant factor when it is very high to determine the melt pool size, for example, greater than 300 W/m K.
Latent heat of fusion and specific heat are another two material properties explicitly related to the melt pool size. It is well known that the latent heat of fusion determines how easy the material can be changed from one side of the melting temperature to the other; and the specific heat determines how fast the material will respond when a heat flux comes in or out. Thus, it is possible that a lower latent heat of fusion or specific heat may increase the melt pool size. When comparing the cases with low and high level of Lf or Cp in Table 4 and Figure 3, the simulated melt pool size changes as expected. Specifically, with the increase in specific heat, the melt pool lengths were shorter by the range of ∼3% to ∼20%, the melt pool widths were reduced by ∼2% to ∼16% and depths were also reduced by ∼9% to ∼40%. Meanwhile, with the increase in latent heat of fusion, the maximum reduction in melt pool lengths, widths and depth is less than 7%. However, the effect of change of latent heat of fusion and specific heat seems to be not as significant as that of conductivity and melting temperature in the tested range. Therefore, the latent heat of fusion and specific heat may determine the shape of melt pool to some extent.
Material property correlation effect analysis
Based on the above analyzed results, a mathematical method is necessary to get a better understanding of material thermal property effect on melt pool geometry. Melt pool L/D and Ax are two important variables for melt pool characteristic. Thus, they were attempted to be analyzed first and considered as the responses in this analysis. Ax can be estimated as a half-ellipse shape perpendicular to the beam moving direction of a melt pool, while L/D ratios can be obtained from the simulated length and depth values. The Ax and L/D results have been concluded in Figure 4, and it is noticed that lower conductivity usually caused a large L/D ratio, while the combined effect of high conductivity and melting temperature resulted a low Ax. To systematically analyze the material correlation effect, all the simulated results were analyzed using ANOVA with the General Linear Model in Minitab software. Both of the second-order and third-order interactions were tested. The ANOVA routine was then run again when the significant factors were selected, in order to amplify the significance of those selected factors. If any base factor is not significant, it will still be considered in the second analysis.
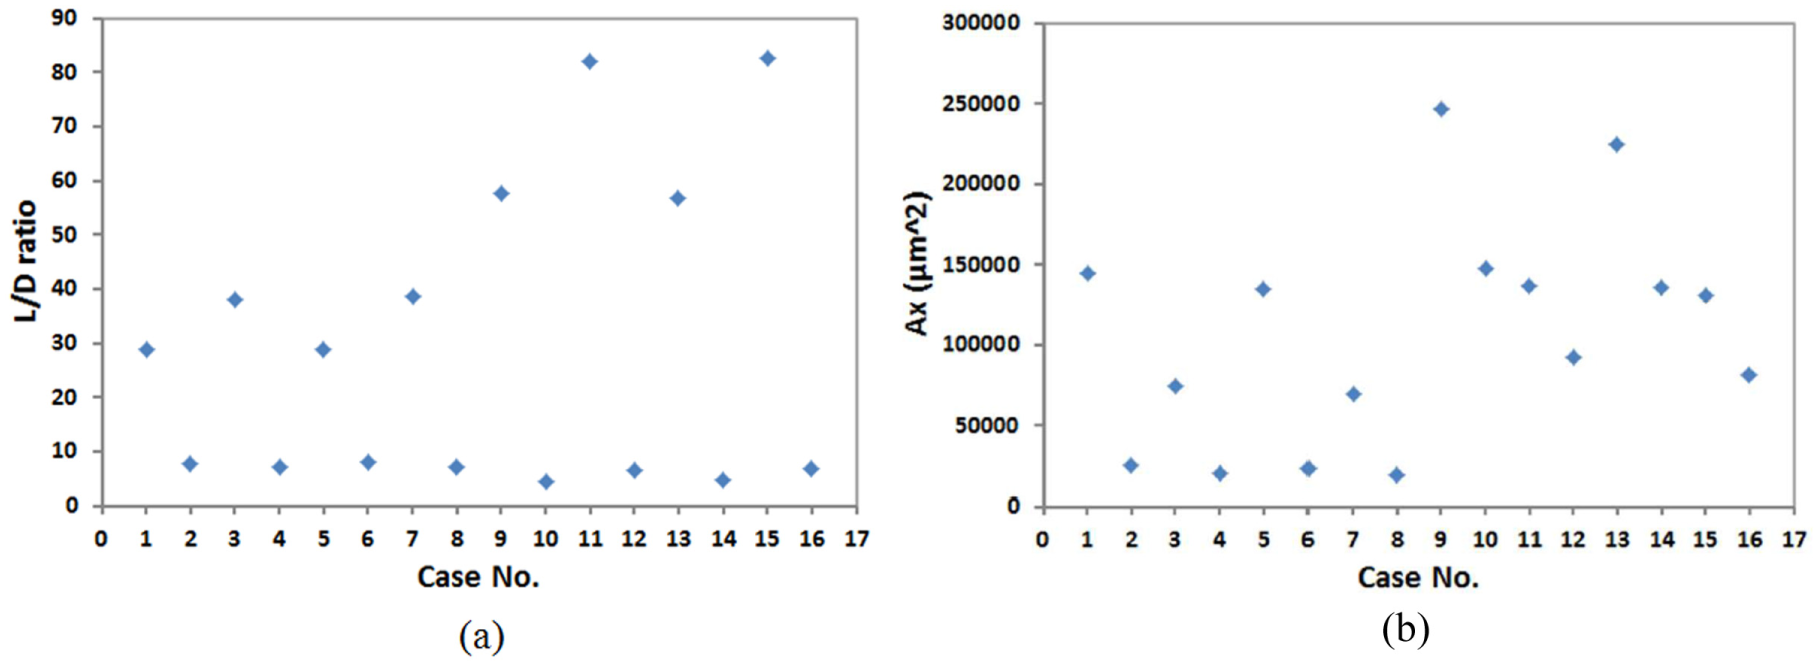
Calculated L/D ratio and Ax results: (a) L/D ratio summary, (b) Ax summary.
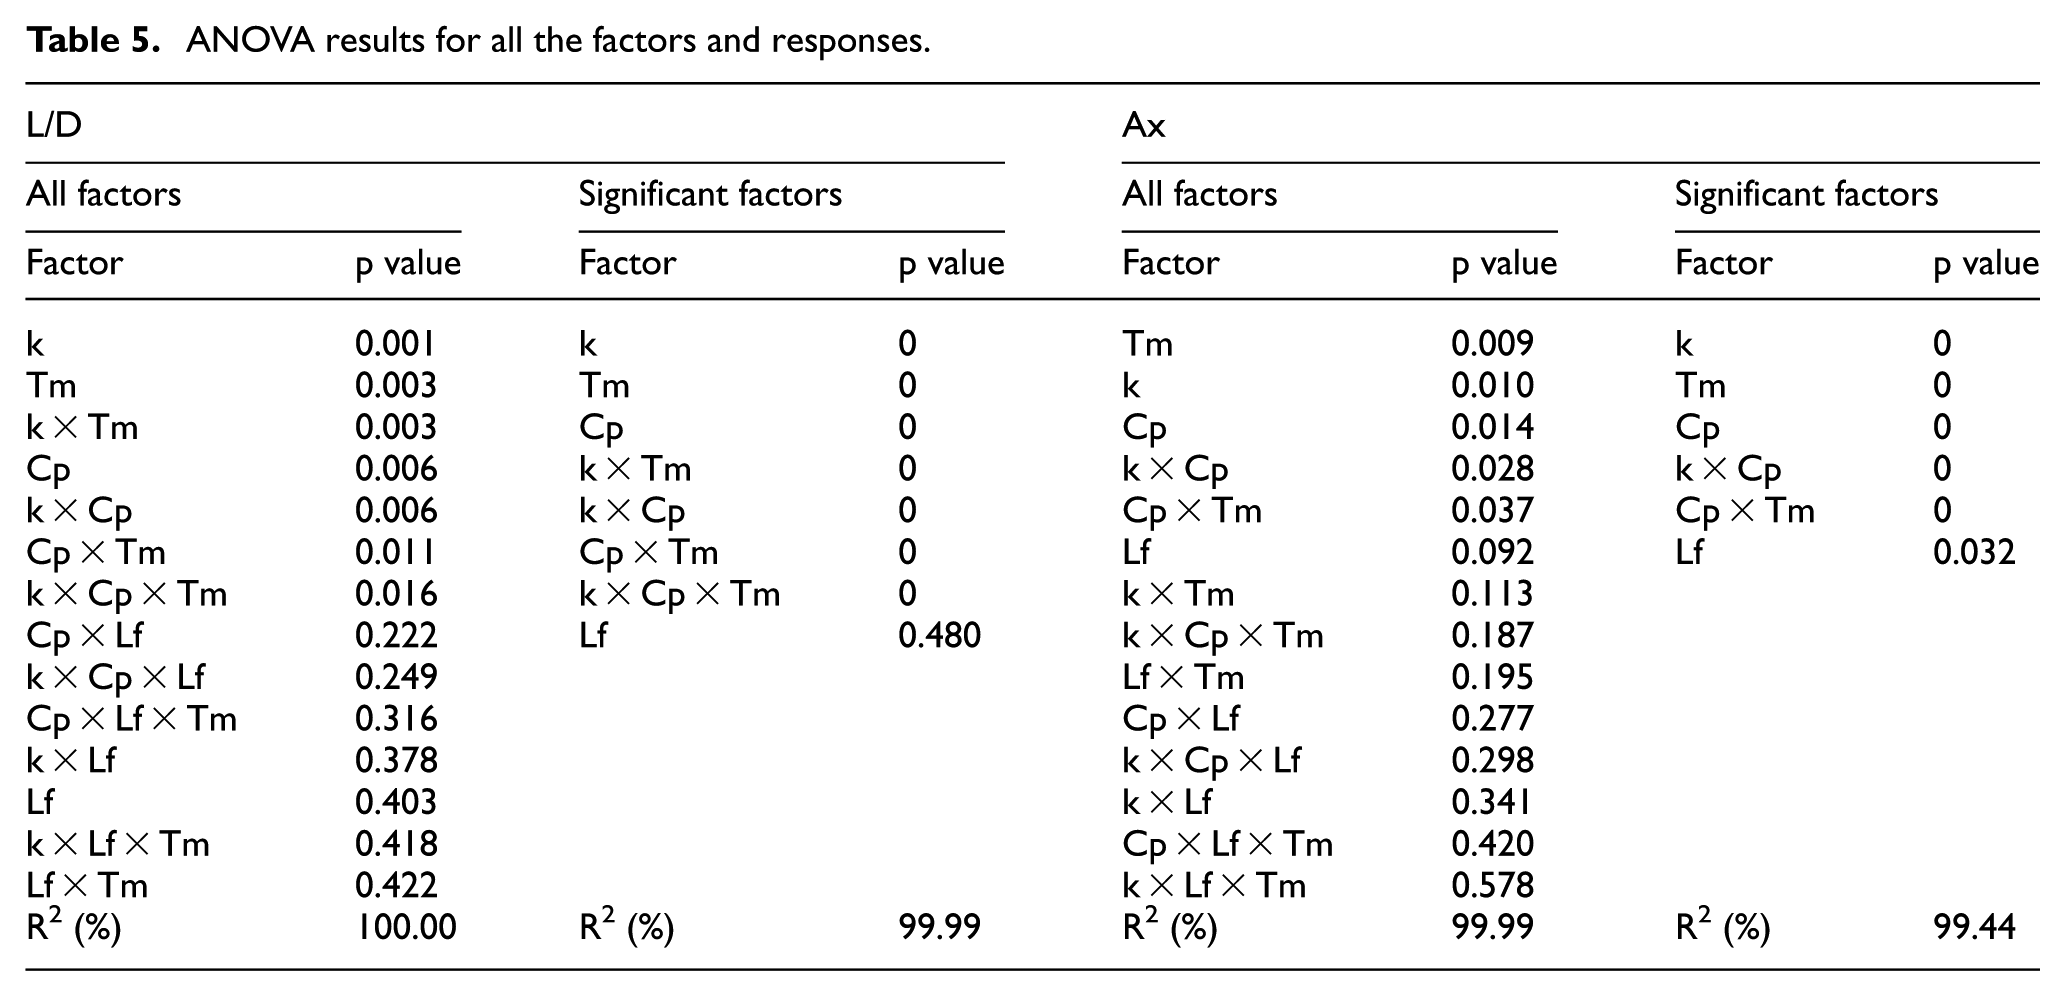
The tested ANOVA results are shown in Figure 5 including the main effect from each individual factor (Figure 5(a) and (b)) and the effects from factor interactions (Figure 5(c) and (d)). It is clearly observed that the melting point and the thermal conductivity are the most significant factors for both L/D and Ax. Specific heat also played an important role for L/D and Ax. In addition, the interactions between the thermal conductivity, melting point and specific heat are considered significant for L/D. Meanwhile, the interactions between the thermal conductivity and specific heat and between the specific heat and melting point are significant for Ax. The latent heat of fusion is consistently considered less significant in both responses in the all-factor analysis results. The results are listed in Table 5, with the factors listed for each analysis in a descending order of significance (significant factors p-value< 0.05).
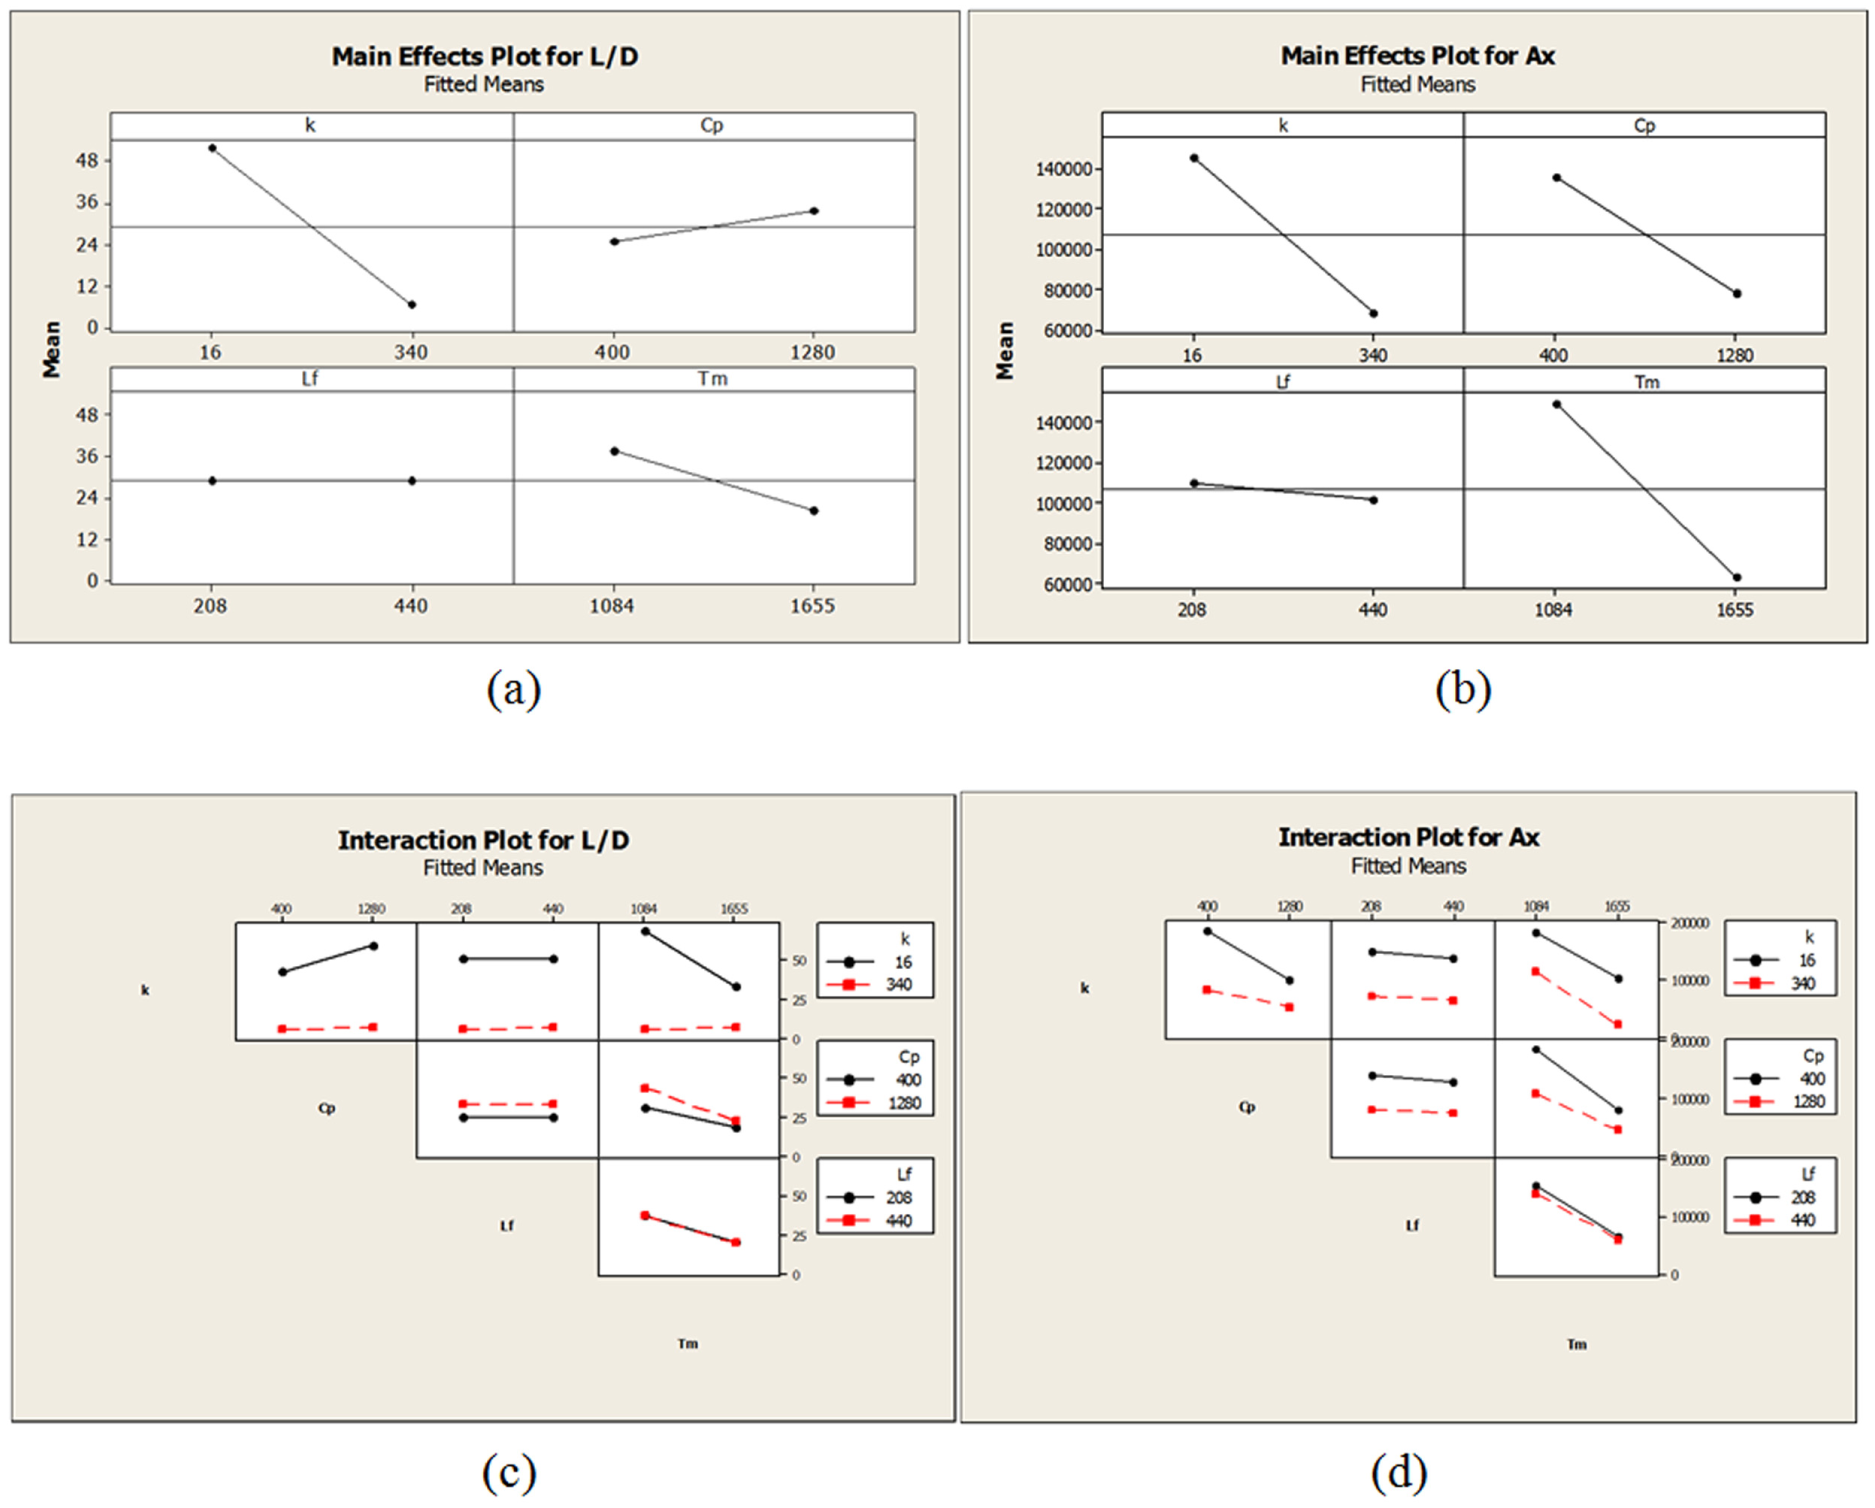
(a, b) Main effect plot and (c, d) interaction plot for L/D and Ax.
ANOVA results for all the factors and responses.
Two prediction equations, for the two melt pool geometry characteristics, have been generated by general regression method. Only the significant factors shown in Table 5 are considered in the equations, all the four base factors are also included. The two equations are given as follows
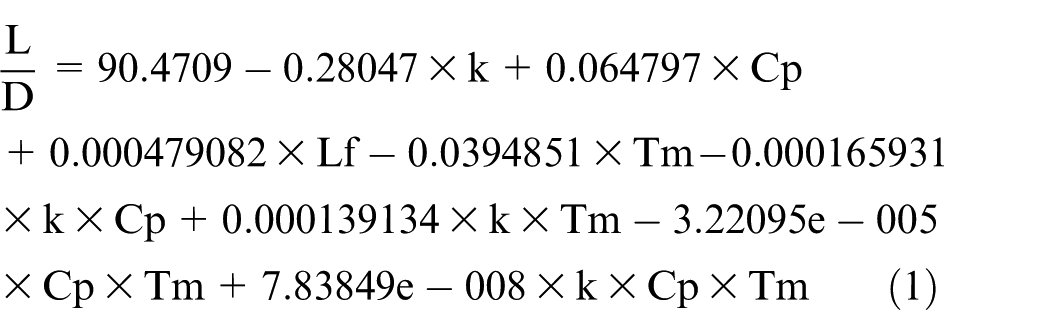
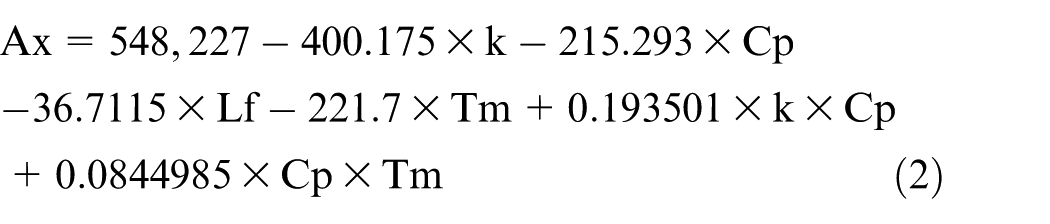
The regression reports and plots for the prediction model have been collected in Table 6 and Figure 6. Table 6 shows the calculated regression results summary. The T-test statistics for tested variables (except Lf for L/D equation) are in high range, thus small p values should be expected, which indicates that the obtained corresponding coefficients played a critical role in the regression model. R2 value may be used to explain the goodness of the prediction since a small R2 value means the model is lack of fit. Very high R2 as well as R2 (adjusted) values (>99%) have been presented for L/D and Ax models which indicate the data fitted well to the linear models. In addition, R2 (predicted) values for both L/D and Ax are observed to be close to R2 and R2 (adjusted), the obtained models have adequate predictive ability. The small p values (∼0.00) of regressions again confirm significant predictions have been made. The residual plots have been concluded in Figure 6. The normality probability plots for both L/D and Ax show the points are around blue line which may indicate the error terms are nearly normal. Most data points are randomly scattered in L/D and Ax residuals versus fitted value plots indicating the error terms have mean value close to zero. The distribution of the histogram again confirms the normality assumption. The residual versus order plots are not quite important here since the input material property data are not a function of order. From the detailed analysis, the proposed predictions have a reasonable fit with the given data. The prediction equations were first employed to estimate the melt pool geometry characteristics and then have a comparison with the simulated 16 cases. The average error for L/D is 0.63%, while the maximum error is 1.65%. On the other hand, the average error for Ax is 6.86% and maximum error is 36.48%.
Regression report for tested values.
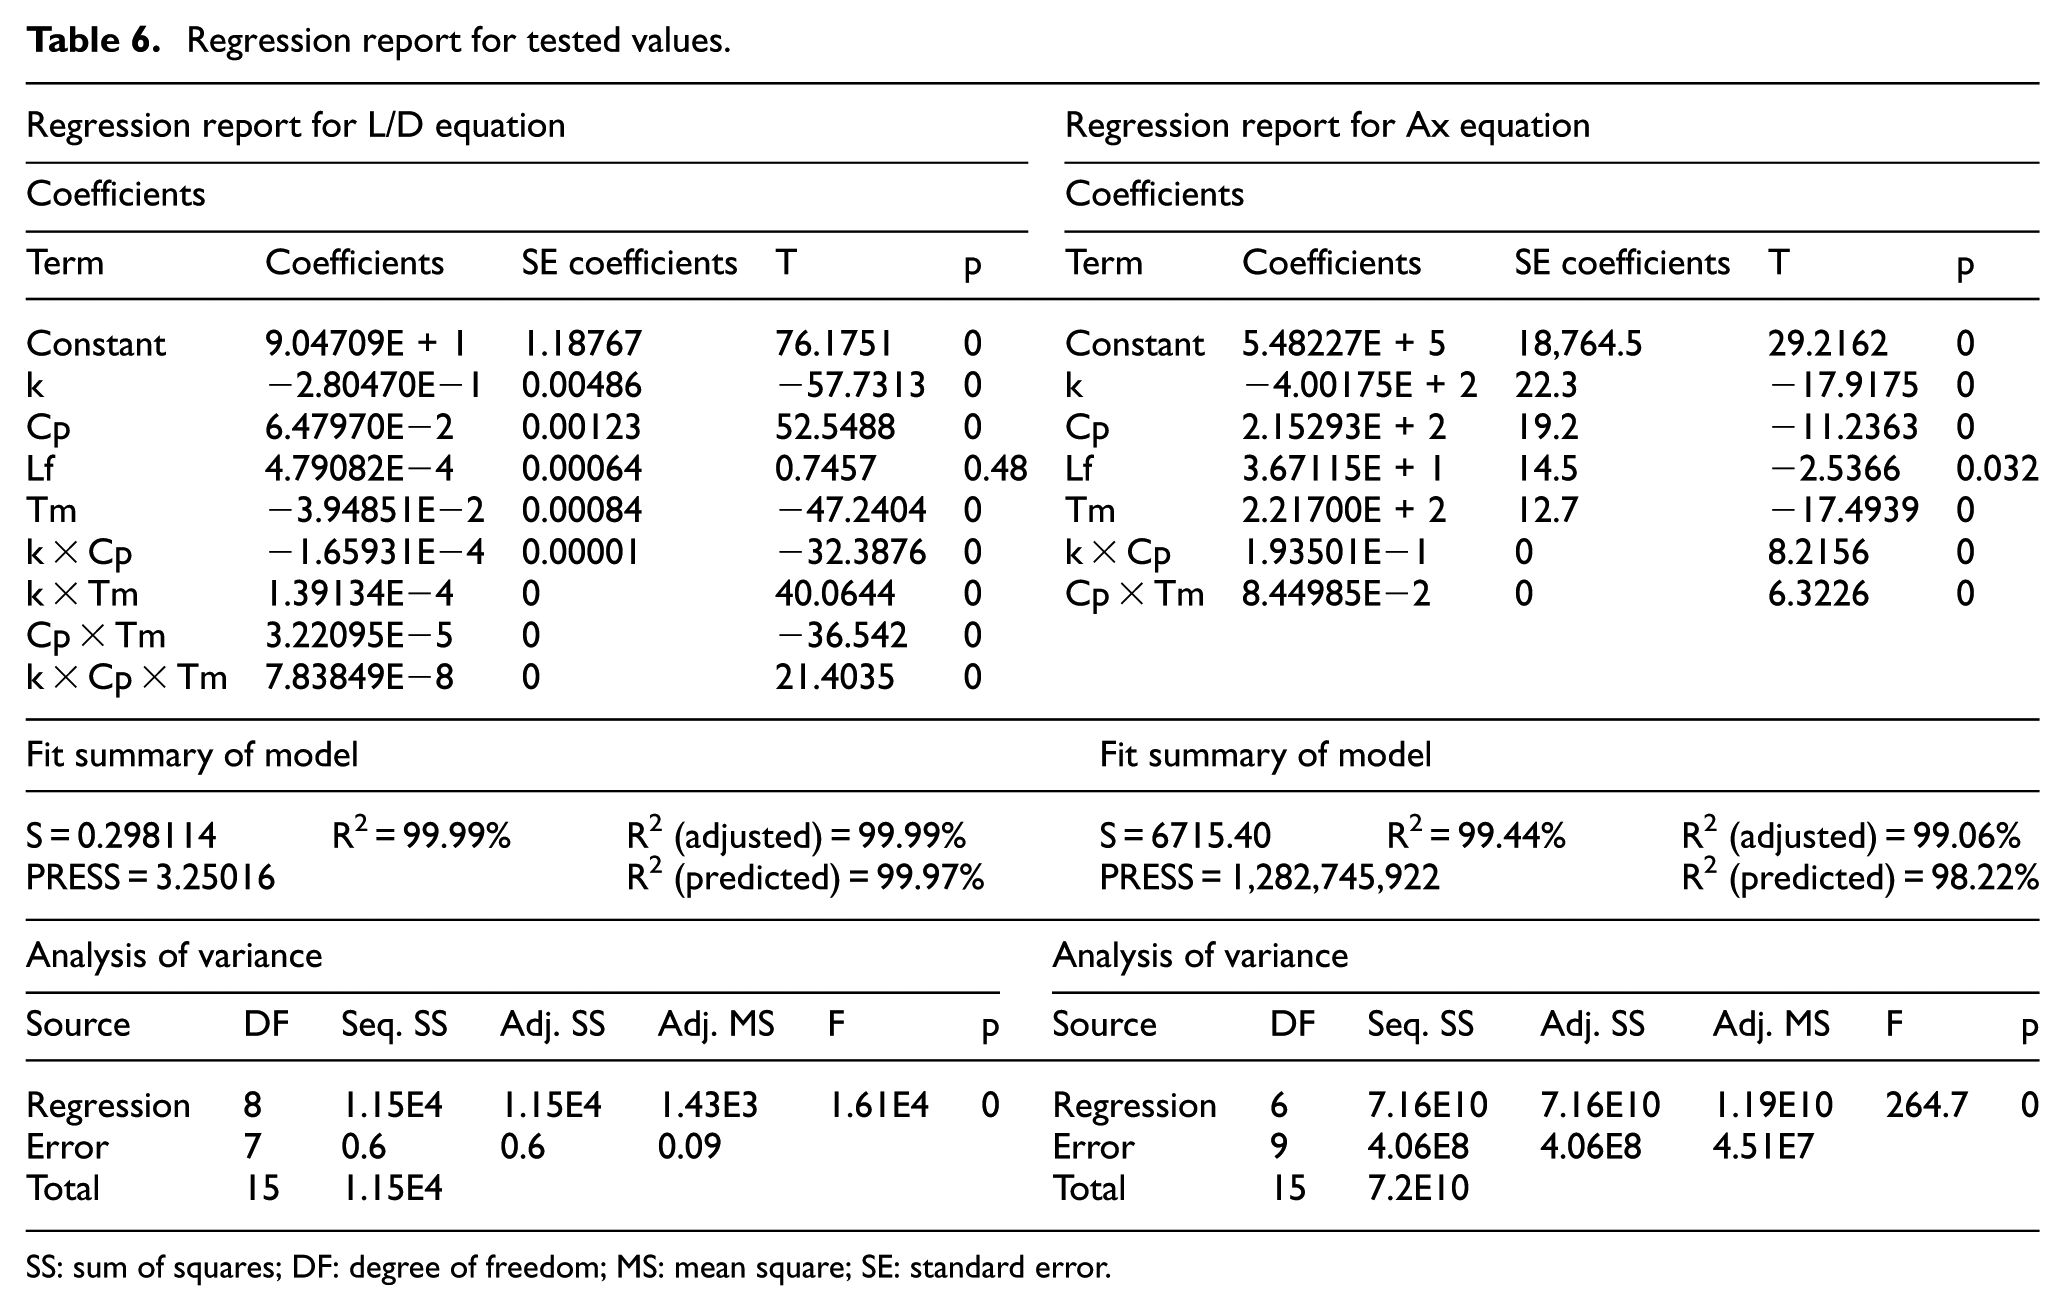
SS: sum of squares; DF: degree of freedom; MS: mean square; SE: standard error.
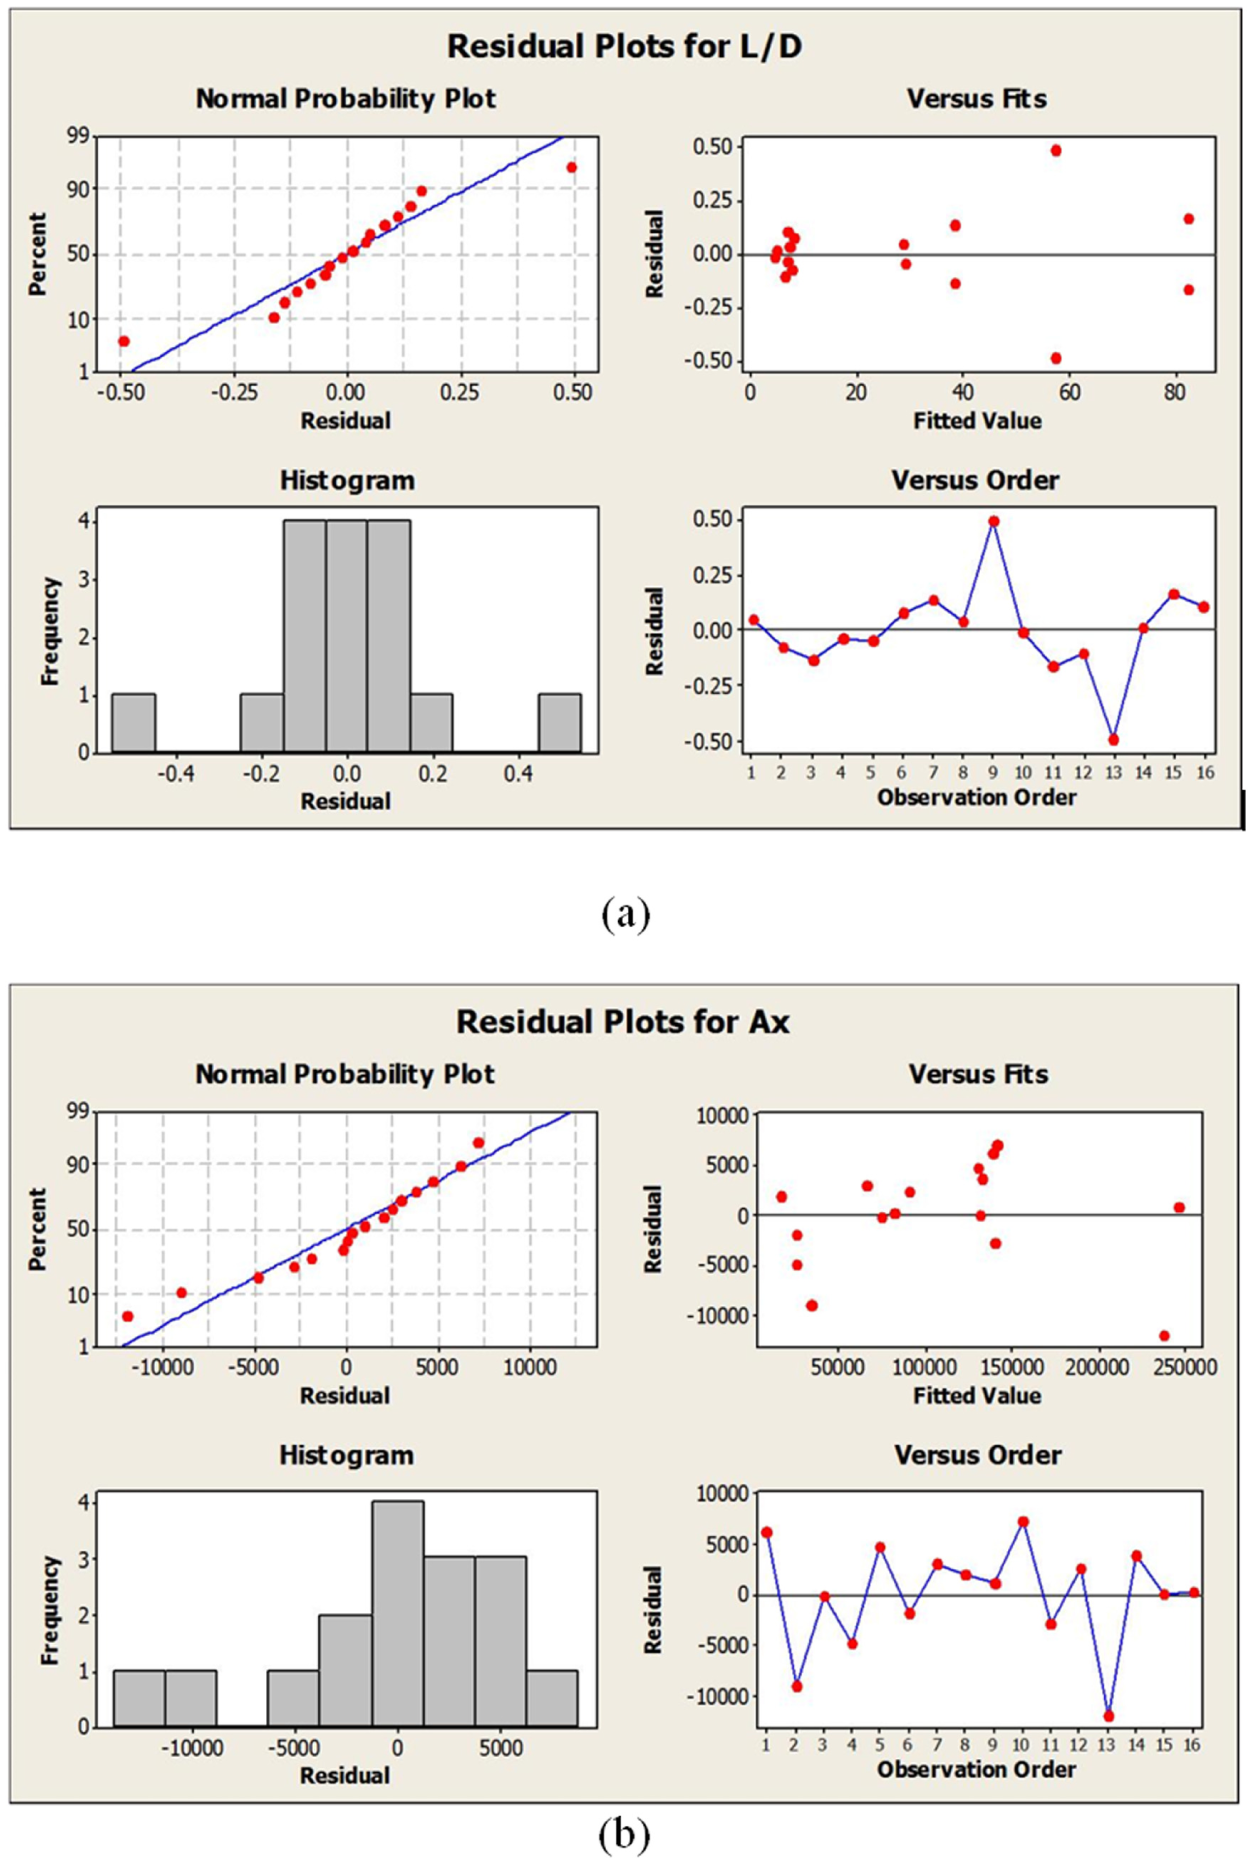
Residual plots for L/D and Ax.
Prediction equation validation
It is noticed that the prediction equations are based on artificial material which has Ti64 density, thus density scale factor has been applied to equations (1) and (2) to have normalized results. The density used in the equations is from the melting or liquidus density value, which is approximately the lowest value listed in Table 2. Therefore, the prediction equations for different materials can be adjusted as follows
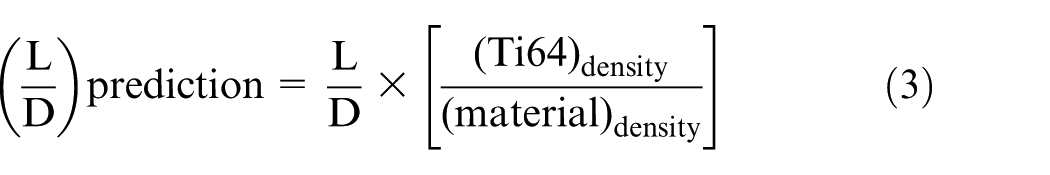
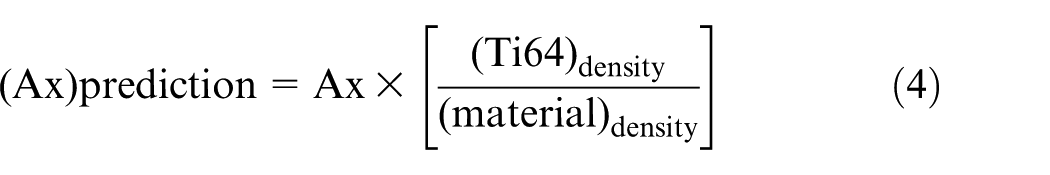
The prediction equations (3) and (4) were then used to estimate the melt pool L/D ratio and Ax value for the real-world materials. Numerical simulation for actual Ti64 material, with properties obtained from Table 2 and Figure 2, has been done first using the validated Ti64 EBAM numerical model. The obtained Ti64 Ax and L/D values were compared with predicted values using equations (3) and (4). Small errors have been observed between predicted values and simulated values that the Ax value has an error of 3.4%, while the L/D ratio has an error of 4.6%. Extended comprehensive comparisons, between simulated melt pool characteristics of five actual materials listed in Table 2 and predicted values using equations (3) and (4), have been conducted. The average error for L/D is 21.53% and the maximum error is 53.54%, while the average error for Ax is 9.98% with a maximum error of 37.11%. The case with maximum error for L/D and Ax is copper, which has the smallest melt pool length value. All the simulated melt pool size information has been concluded in Figure 7. The result comparisons have been concluded in Figure 8. It is concluded that the prediction has a reasonable agreement with simulated long melt pool length cases such as Ti64, TiAlNb, IN718 and AISI316L. However, the ability of prediction equation may need to be further improved, especially for small melt pool size materials such as copper.
Melt pool dimension information for five materials.
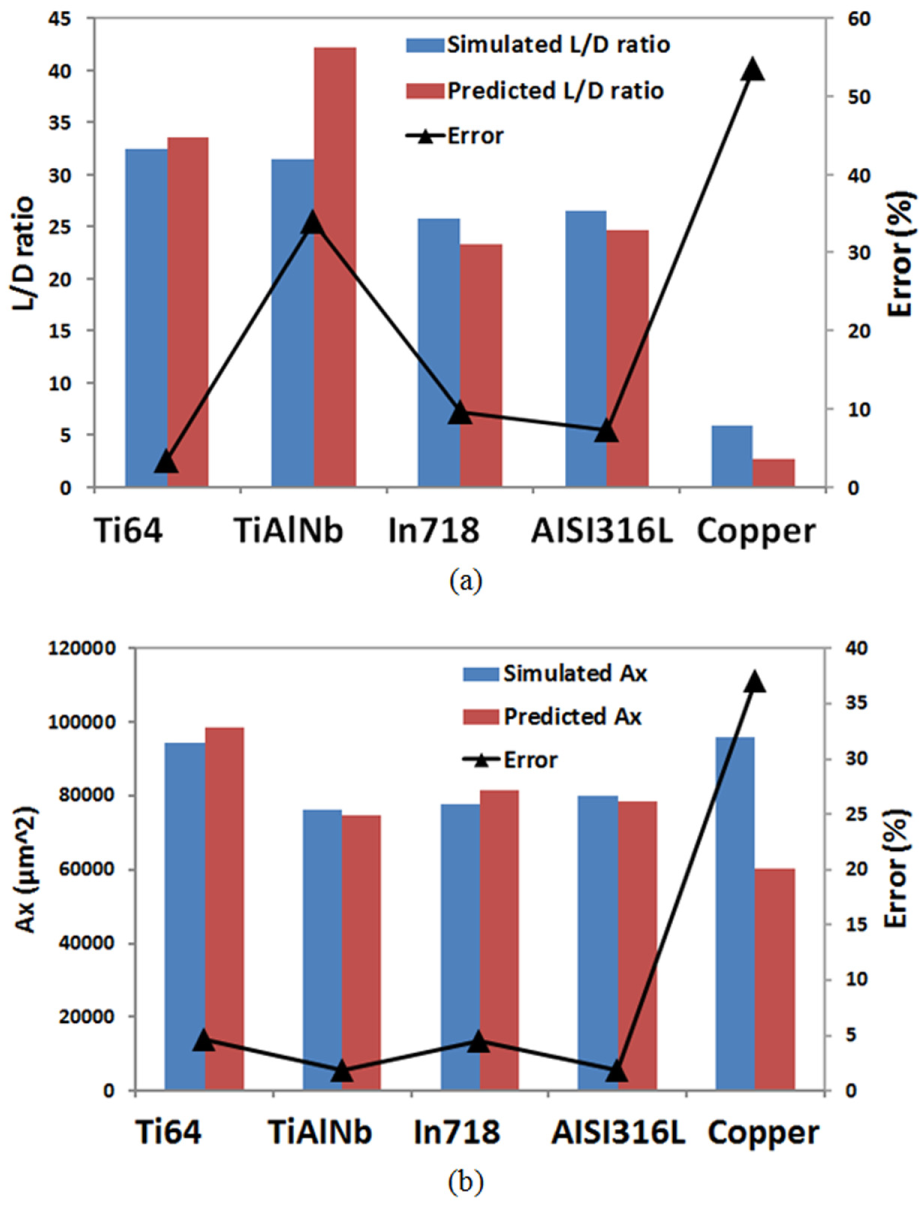
Prediction results versus simulated results: (a) L/D ratio comparisons, (b) Ax comparisons.
Conclusion
An extended numerical study with various powder materials were conducted using the previously developed FEM thermal model, including Ti-6Al-4V, IN718, AISI316L, TiAlNb and copper. The effect of individual thermal properties on the melt pool size was obtained and discussed. A design-of-experiment approach with four factors, two levels and full-factorial testing is employed for this investigation. ANOVA is then used to capture what thermal properties and interactions of properties are considered significant to the melt pool characteristics such as the L/D and Ax. The material effect correlation equations have been proposed based on ANOVA analysis result to predict the L/D and Ax values for actual materials. The major findings can be summarized as follows:
The melting temperature is intuitively the dominant factor if the thermal conductivity is in a comparable range. A material with a higher melting point will have a smaller melt pool size in EBAM.
If the thermal conductivity is very high (e.g. greater than 300 W/m K), it, exceeding the melting temperature, becomes the dominant factor for the melt pool size. The melt pool length and width can be reduced noticeably by a very high thermal conductivity. The latent heat of fusion and the specific heat may affect the shape of the melt pool in EBAM to some extent. Lower latent heat of fusion and specific heat may make the melt pool larger.
The ANOVA analysis results show that the base factors except latent heat of fusion are considered significant factors for L/D ratio and Ax. The interactions between the three significant factors are significant for L/D, while the interactions between the thermal conductivity and specific heat and between the specific heat and melting point are important for Ax.
The prediction equation can have a reasonable agreement of the melt pool L/D ratio and Ax for real-world materials. However, errors still exist for material with small melt pool size such as copper, which requires further improvement in the prediction accuracy.
Footnotes
Appendix 1
Declaration of conflicting interests
The author(s) declared no potential conflicts of interest with respect to the research, authorship and/or publication of this article.
Funding
The author(s) disclosed receipt of the following financial support for the research, authorship, and/or publication of this article: This research is supported by NASA, No. NNX11AM11A. The first author (B.C.) acknowledges the Graduate Council Fellowship at the University of Alabama for the financial support.