
Abstract
Several methods and tools have been developed to facilitate sustainable product design, but they lack critical application of the ecological design (eco-design) process and economic costing, particularly during the conceptual design phase. This research study overcomes these deficiencies by integrating eco-design approaches across all phases of the product life cycle. It proposes an eco-design case-based reasoning tool that is integrated with the recently developed ecological quality function deployment method, which supports sustainable product design. The eco-design case-based reasoning tool is an intuitive decision-support tool that complements the ecological quality function deployment method and proposes solutions related to customers’ requirements and the environmental and economic impacts of the product. The ecological quality function deployment method ensures that customers’ needs are considered within the context of product sustainability. The novelty of this article is in the development of the eco-design case-based reasoning tool which is based on the premise that if experiences from the ecological quality function deployment process can be captured in some useful form, designers can refer to and learn from them. This approach helps industrial decision-makers propose solutions by reusing solutions from similar cases and from their past experiences. The novelty is in the way the cases are structured and new cases are generated, using life-cycle assessments, cost estimations, and information about related manufacturing processes and means of transportation. This article demonstrates the applicability of the proposed approach through an industrial case study.
Keywords
Introduction
Design for sustainability has evolved greatly since the 1990s; its focus more and more is on sustainable product development by integrating the three main components: people, profit, and planet. These components have become fundamental to product innovation. Design for sustainability aims to make green products; it addresses the best way to meet consumers’ needs in a sustainable way. In order to produce a more sustainable product, the implementation of sustainability considerations should be applied at the earliest possible stage of product design.
Product sustainability needs to be evaluated from both the environmental and economic perspectives; this requires the careful consideration of customer needs, which must be met in the most economical way. To date, product designers normally focus on functionality, quality, and cost, which have long been the most important factors in product design.1,2 Sustainability has become ever more important in product design. This study advances the concept of ecological design (eco-design) as a system of strategies that aim to integrate environmental aspects throughout a product’s life cycle.
The aim of this study is to produce an innovative, more sustainable product design method by finding similarities with previous cases stored in a case-based library; this process uses the experiences from similar cases to generate the ideal solution. The objective of developing the eco-design case-based reasoning (Eco-CBR) tool is to support various design processes, and to add and maintain the library of cases in a more organised fashion. The integration of the ecological quality function deployment (Eco-QFD) and case-based reasoning (CBR) methods introduced in this study meets this challenge by storing and manipulating eco-design product knowledge within a case-based library. This uses the integrated eco-design decision-making (IEDM) framework, which was previously engineered by the authors to ensure that product development embraces environmental and economic considerations throughout the product’s life cycle. 3
This article demonstrates this new approach using a case study that considers the design of medical forceps. The particular problem used here is to configure solutions for lower environmental impact based on the estimation of manufacturing, environmental, transportation, and economic costs. The intention is that such solutions will help designers improve the quality of their designed products while enabling them to choose optimal manufacturing and end-of-life (EOL) strategies during the design stage.
The remaining of the article is organised as follows. Section ‘Background and related work’ provides a brief overview of related work on quality function deployment (QFD) and CBR applications. Section ‘Proposed Eco-CBR tool’ describes the proposed development of the Eco-CBR tool, and section ‘Case study and discussions’ presents the case study and discussion. Section ‘Conclusion’ draws conclusions from the research that has been conducted thus far.
Background and related work
Bereketli and Genevois 4 and Remery et al. 5 show that the consideration of sustainability at the design stage requires dealing effectively with products’ functional and environmental impacts. Functional product impact has previously been evaluated based on affordability, durability, reliability, and the aesthetic perspective.6,7 Yang et al. 8 and Ljungberg 9 evaluated functional product impact alongside eco-design aspects, including global warming/climate change, the reductions in energy consumption, and conducting end-of-product life-cycle activities, such as reusing, recycling, and remanufacturing. Product life-cycle management based on key characteristics has been previously identified as a viable means of supporting knowledge reuse, particularly in respect of important parameters that must be truly represented at key decision stages. 10 To date, a number of eco-design tools have been specially developed to support sustainable product design, including QFD-based tools and CBR-based tools, both of which are described below.
QFD-based tools
The traditional house of quality (HoQ) has been extended by Emzer et al. 11 by directly adding environmental factors to customer requirements. Zhou and Schoenung 12 developed an integrated industrial ecology function deployment (12-EFD) approach to assess the environmental behaviour of various technologies, with correlations to their performance and economic characteristics. In their study, they implemented the 12-EFD approach in a case study of a computer display desktop. They used the results of the case study to assess trade-offs among different objectives in product design.
The previous study by Romli et al. 3 has undertaken environmental design to identify design alternatives using environmentally conscious quality function deployment (ECQFD) and life-cycle assessment (LCA) and has been correlated with the theory of inventive problem solving (TRIZ, from the Russian ‘теориярешенияизобретательскихзадач’ or ‘teoriya resheniya izobretatelskikh zadach’). Wang et al. 13 and Vinodh and Rathod 14 have proposed integration methods between ECQFD and LCA for ensuring sustainable product development in electronic switches (in China) and rotary switches (in India). Sakao 15 used eco-design to reduce environmental impact throughout a product’s life cycle by combining LCA, quality function deployment for environment (QFDE), and TRIZ and applying the combination to a hair dryer to effectively support the product planning and conceptual design stages. Despite these efforts, researchers have paid very little attention to the question of how to carry out an Eco-QFD effectively and efficiently.
The evolution of Eco-QFD started from green quality function deployment (GQFD) by Cristofari et al., 16 which is used to evaluate products using QFD integrated with LCA. Later, the developments reported by Zhang et al. 17 led to GQFD-II, which integrates LCA, life-cycle cost (LCC), and QFD into an efficient tool that deploys customer, environmental, and cost requirements throughout the entire product development process. GQFD-II has several shortcomings, however, which makes it difficult to use: it depends on a detailed and time-consuming LCA that requires designers to have a comprehensive understanding of environmental science. To address these shortcomings, Mehta and Wang 18 developed GQFD-III methodology to integrate life-cycle impact assessment (LCIA) into the greenhouse and used the analytical hierarchy process (AHP) technique for selecting the best product concept. The GQFD-III methodology is used to illustrate a case study of three coffeemakers by comparing the products’ quality, cost, and environmental performance.
In Japan, Masui et al.19,20 developed a QFDE tool to design an environmentally friendly product. QFDE is generally carried out in four phases. Phases I and II allow the user to identify environmentally significant components (parts and devices) of the product, while Phases III and IV allow the user to choose the most environmentally friendly design from alternative design proposals.
Eco-QFD helps product design teams to consider environmental concerns and has been proven by Ernzer et al., 21 Kuo et al., 22 and Utne 23 to be a good quality systems tool for achieving total customer satisfaction. In their study, Bereketli and Genevois 4 proposed a multi-aspect QFD for an environmental approach to identifying product improvement strategies; they did so by considering not only the end users’ requirements but also the requirements of environmental stakeholders.
Hare 24 believes that QFD for the environment would benefit environmental strategies by facilitating a more systematic and quantitative analysis of the requirements and investigated how QFD for the environment should be included in the review of potential eco-innovation tools. Such a review could help the designer to improve the requirements of a product’s specifications and thus integrate them with environmental considerations. This view was also proposed under a green product design framework built using a modified HoQ 25 with the reservation that the process at the time was limited by inadequacy of life-cycle data. In a more recent assessment, Miguel 26 suggested that while QFD can translate product design requirements into engineering parameters (which can be a useful tool for understanding design requirements), it cannot provide detailed information for the sustainability analysis. This deficiency was further explored by Zhang et al., 27 who suggest that a HoQ can be better deployed by defining value models rather than specifying engineering characteristics. It is suggested that by doing so, the approach can be used to support designing for value in the life cycle of products. It is possible to foresee the incorporation of sustainability-related values into such a procedure.
These studies have shown evidence of significant efforts in the development of environmental product design. Researchers have suggested that QFD cannot provide the detailed information that is necessary for sustainability analysis. Thus, a sustainability method for the relevant eco-design improvement strategies is needed as a basic conceptual structure for decision-makers in conducting eco-design with a multi-aspect approach (cost, quality, and environmental and social aspects). Such a proposed method should include an integration of several methods that would combine the required aspects.
CBR-based tools
CBR is an artificial intelligence (AI) tool and computational modelling technique that is used to solve design problems. Several studies, including those presented by Aamodt and Plaza 28 and Belecheanu et al., 29 have focussed on the application of CBR to support decisions in product design. Yang and Chen30,31 outlined a forecasting model to design eco-products based on the use of TRIZ and CBR evolution patterns. They used these methods to accelerate the process and to help designers reduce environmental impacts throughout the life cycle of their products.
In other research, Takai 32 implemented a CBR approach to storing information about various products in a knowledge base and defined a new product concept. This involved retrieving a cluster of products and adapting the cost from existing cases to the new case The CBR method is used to find similarities to previous cases based on product features. These cases can then be retrieved and reused in a process that adapts the information and knowledge that they contain to the new case.
The application of CBR to sustainable product development is a growing area of research. It includes the development of the communication and decision support environment for managing concurrent engineering projects outlined by Kuo. 33 This is an application of CBR to new product development, which can be used as a decision-support environment and practical communication tool for managing concurrent product development. It proposed a hybrid AHP-CBR method to determine recycling strategies for a product. Ghazalli and Murata 34 used the same hybrid method for evaluating remanufacturing processes in order to support the integration of economic and environmental cost models to determine the EOL strategies for a product.
Jeong et al. 35 proposed a solution to approximate LCA using CBR for the eco-design of products. Later, Germani et al. 36 proposed a CBR approach that would allow designers to consider the indications given by well-known eco-design guidelines in an efficient way.
Bejarano et al. 37 recently proposed research on CBR by producing a recursive case-based reasoning (RCBR) method; they developed the RCBR method to guide design teams in system design by integrating industrial standards and existing CBR methodologies. They used this method to provide product requirements and solution representation.
Although they have considered aspects of sustainable product development, previous works have not combined the main factors in sustainability, which are the environmental, economic, and social factors. Thus, the aim of this study is to provide a platform for considering all of these factors by integrating eco-design features to propose reliable solutions to the new problem of product design.
This study proposes the use of the Eco-CBR tool by integrating the QFD method to store all the product design knowledge in the library of cases and to help a designer to quickly evaluate the new product design case by finding similar cases in the library. The proposed method, which to the best of our knowledge is the first of its kind, will allow designers to collaborate with consumers and will allow designers to gain insights and innovations for sustainable product design.
Proposed Eco-CBR tool
Figure 1 illustrates the Eco-HoQ as a platform for managing eco-design, production costs, and environmental cost considerations within all four QFD phases. The Eco-HoQ is an extra ‘house’ that can capture and manage sustainability considerations in a single place. This adds to the relevance of the information and links attempts to improve sustainability to each phase of the design process. In this way, the research is supporting steps aimed at capturing best practice through life engineering knowledge with the intention that this can be fed back across the product life cycle. This has been previously identified as an important field of research. 38
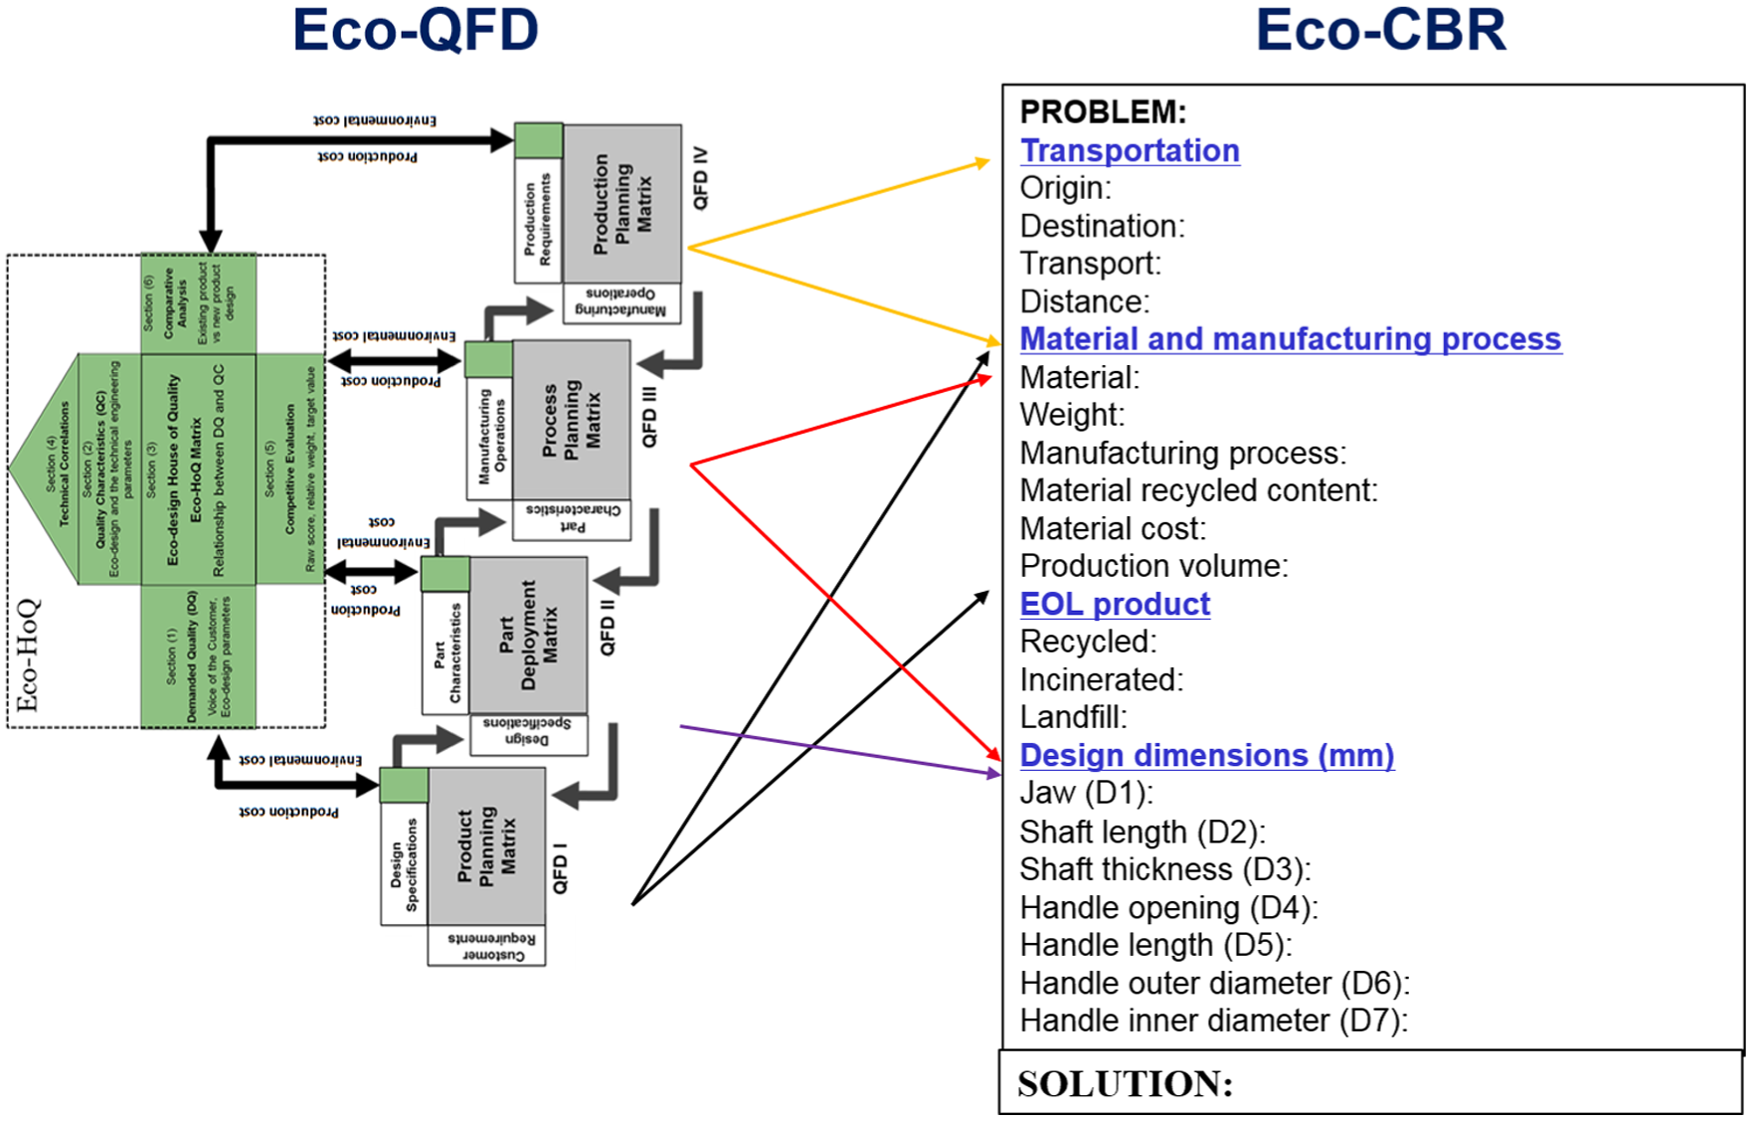
Relation between Eco-QFD and Eco-CBR features.
The linking process is used to drive the important sub-evaluation criteria for ranking and to establish critical design specifications and target values for the Eco-QFD process. By accessing this information during the preliminary and subsequent Eco-QFD cycles, the designer can then deploy a coherent sustainability strategy. Organisations will continuously learn and develop their expertise from this approach and will improve the process of sustainable product development. Examining sustainability along the entire product life cycle makes the goal of sustainable product development a feasible reality.
In the previous case study developed by Romli et al., 3 the important features in the Eco-QFD Phase I were weight, material, manufacturing process, recycled content, volume, incineration, landfill, and recycling. From Eco-QFD Phase II, the features adapted into the Eco-CBR tool were the dimensions of critical design parts. The features defined in Eco-QFD Phase III were materials used, manufacturing process, recycled content, and the dimensions of critical design parts. Finally, the features defined in Eco-QFD Phase IV were origin region of the manufacturer, product use destination region, transportation, distance, volume, manufacturing process, material, and recycled content. All of these important features were defined and used as features for the new case in the Eco-CBR process.
The features of an existing case are categorised into two sections (problem and solutions), as shown in Figure 1. The proposed solution uses a process based on the calculation of similarity between the new case and the existing cases in the Eco-CBR library. The recommendation and the four categories of the solution features are as follows:
LCA, which analyses the carbon footprint, air acidification, water eutrophication, and energy consumed during the life-cycle stages. This provides data that indicate the overall environmental impact; the goal is to reduce environmental pollution during the product design stage.
Cost estimation, which estimates LCC for a product in terms of its purchasing cost, manufacturing cost, environmental cost, transportation cost, EOL cost, and economic cost.
Customer requirements, which is the findings from Eco-QFD Phases I and II.
Eco-QFD indicators, which display the environmental impact, product design, and customer requirements.
This section introduces the Eco-CBR tool, which integrates CBR with eco-design factors into the new product design process. Figure 1 shows the process related to the application of the Eco-CBR tool. These processes were implemented during the development phase of the Eco-CBR tool, following the design flow developed by the authors, as shown in Figure 2.
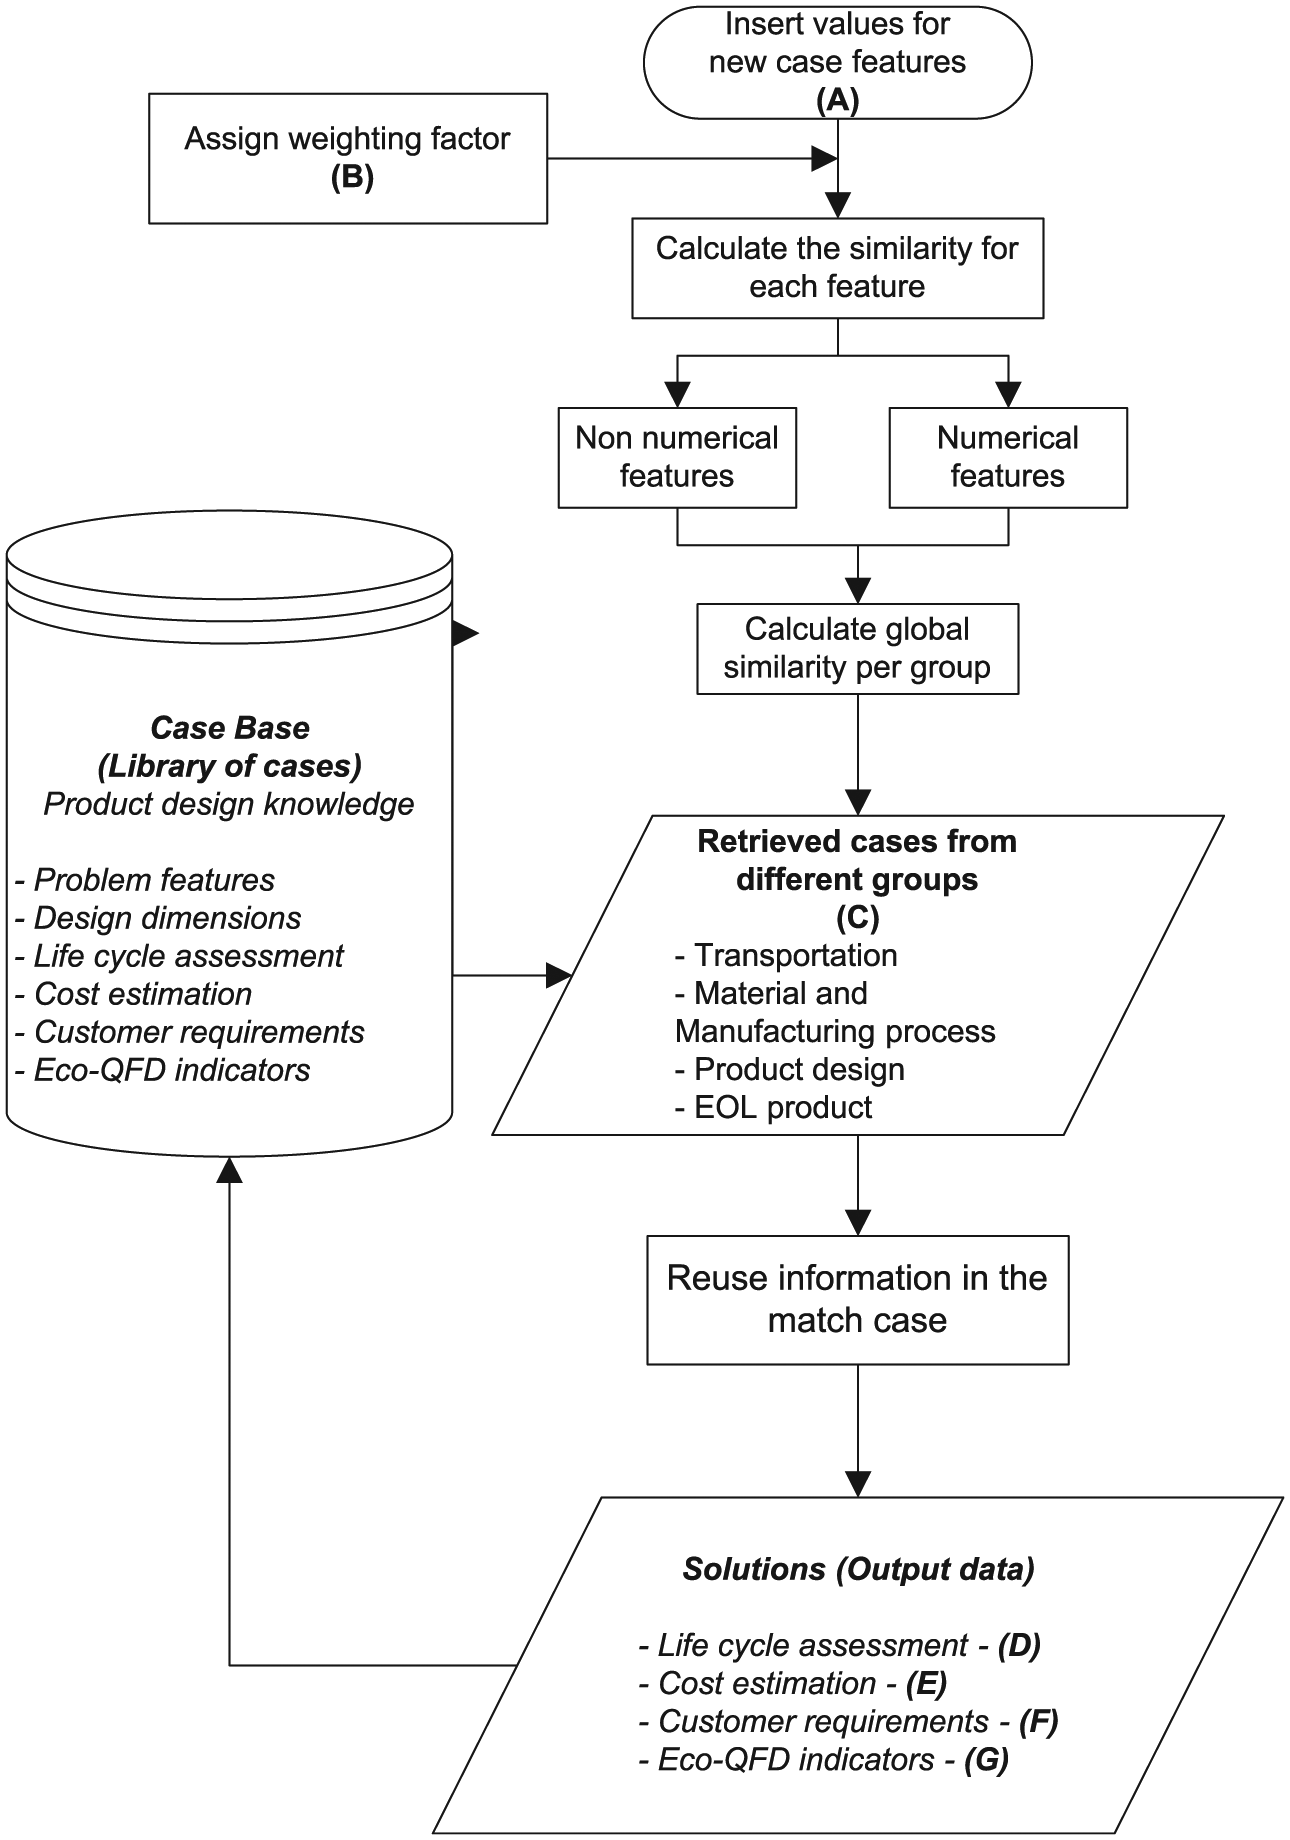
Schematic process of the Eco-CBR tool.
Development of the Eco-CBR tool
Figure 2 represents the schematic process of the Eco-CBR processes by showing stages and elements, labelled ‘A’ to ‘G’. It starts with label ‘A’, which represents the entry of new case features, where a designer has to assign a value for each feature. The new case acts as a ‘problem’, while the tool will find a suitable ‘solution’ for this problem. Label ‘B’ represents the allocation of the weighting factor that has to be assigned for each feature. These weights are then used as an input to search for the similarities between existing cases and the requirements of the new case from the Eco-CBR library. The retrieved cases are shown at this stage, as designated by label ‘C’. After retrieving the cases, the solutions are automatically shown, with features assigned to labels ‘D’, ‘E’, ‘F’, and ‘G’.
In this study, a prototype system of an Eco-CBR tool was developed in Microsoft Excel, as shown in Figure 3. The spreadsheet represents a template for the tool used in the investigation of sustainable product design problems. Labels ‘A’ to ‘G’ in Figure 2 refer to the areas shown in Figure 4. These labels exhibit the areas of the processes involved in this tool. This template is shown as a blank sheet that has to be filled in by the designer to generate the solutions. In the following discussions, the contents of each area are considered without providing the inherent details. This discussion will be part of the case study.
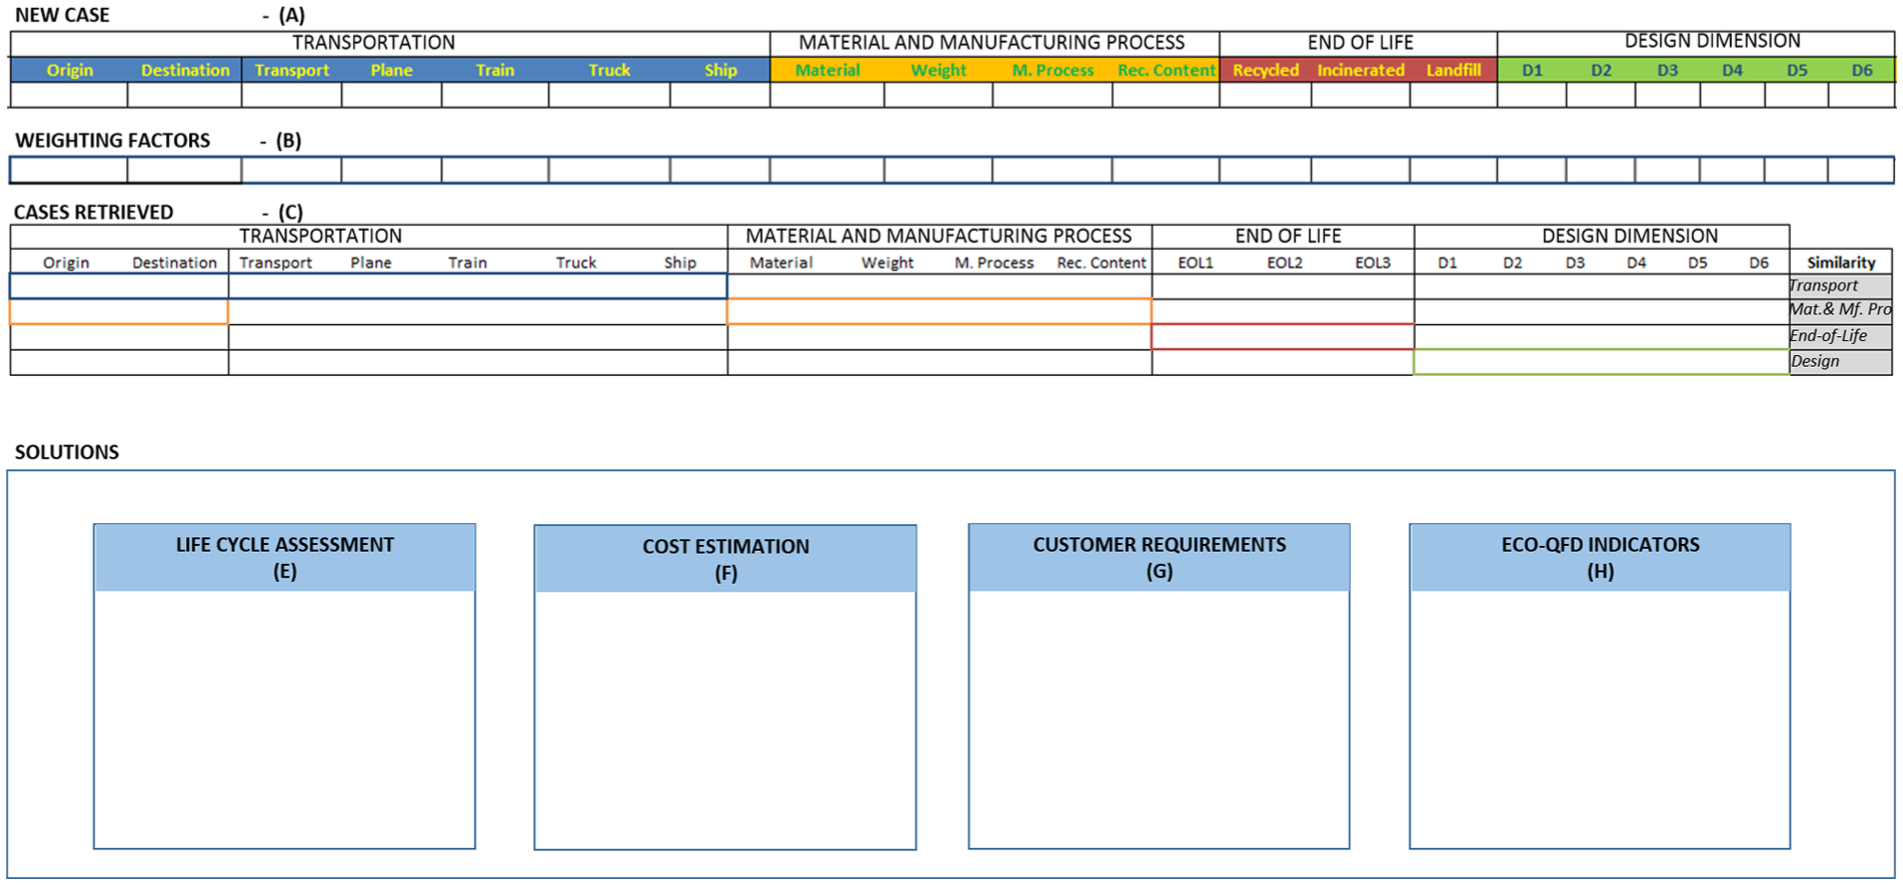
Screenshot of the Eco-CBR tool interface.
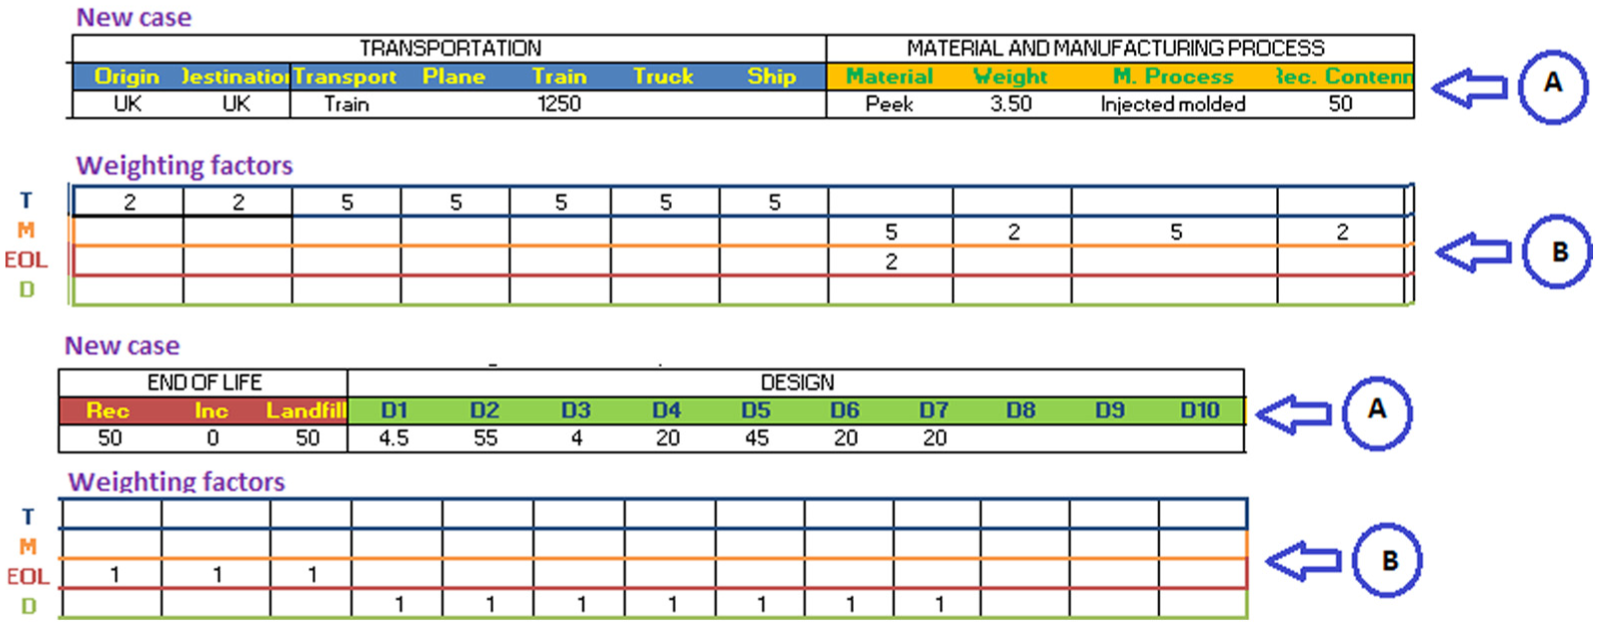
Screenshot of the areas labelled ‘A’ and ‘B’.
This process starts with the problem that is defined as a new case according to the process flow in Figure 2 and areas with label ‘A’ in Figure 3. A designer provides the input for each feature of the new product design, where the features are selected from the important parameters of the Eco-QFD process. The features for a new case are divided into four categories: transportation, material and manufacturing processes, EOL, and design dimensions. The details of the categories are as follows: (1) transportation group: origin, destination, types of transport, and distance; (2) material and manufacturing process: materials, weight, manufacturing process, recycled content, volume, and material cost; (3) EOL product: recycling, incineration, and landfilling; and (4) design dimension: this is classified into product specifications. The process of adding these inputs will be demonstrated in the case study.
Weighting factors
Area B in Figures 3 and 4 represents the weighting factors, which have to be assigned for the features in each group. Label ‘T’ in area ‘B’ represents the weighting factors for the transportation group, ‘M’ represents the material and manufacturing process group, ‘EOL’ represents the EOL group, and ‘D’ represents the design group. These weights are then used for the calculation of the similarities between the new case and the existing cases in the library.
Weights usually vary according to the product, which has a great effect on the similarity computation results. In this study, a real number between 1 (a less important attribute) and 5 (a very importance attribute) is used as a weighting scale. These weights are not fixed, allowing the decision-maker to assign their importance according to the characterisation of the product that is being studied. This method enables the searching process to be more efficient and adaptable to the user’s requirements. The searching similarities process is explained in the next section. The information from the retrieved cases is then reused in the ‘solutions’ entry of the new case.
Searching similarities process
Area ‘C’ represents the retrieved cases from the process of searching for similarities. The retrieval of the cases is based on the highest similarity rate found during the searching process. The group of existing cases for transportation, material and manufacturing process, EOL, and design is retrieved from the Eco-CBR library. During the searching process, the similarity techniques are performed based on calculations that use equations (1)–(3).
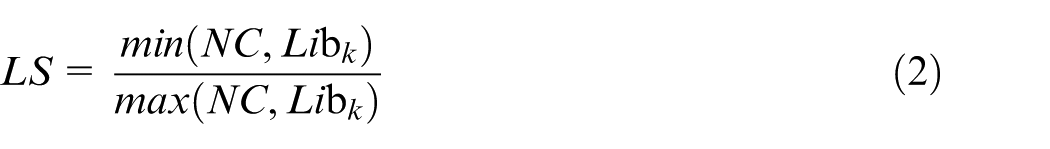
Equation (1) is used for features that contain non-numerical values, while equation (2) is used for numerical features; equation (2) is also used for the normalisation of the numerical features. Thereafter, a global similarity (GS) technique is used for the calculation of the total local similarities per group using equation (3).
Non-numerical local similarity (LS) is assessed by
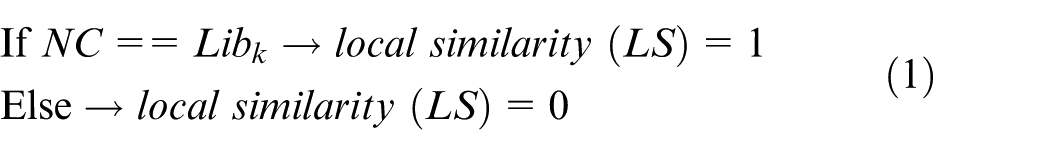
Numerical LS is assessed by
If (NC == 0 and Libk == 0), then LS = 1, where Libk is the k-case from the Eco-CBR library and NC is a new case. Equations (1) and (2) are at the feature level.
GS is assessed by
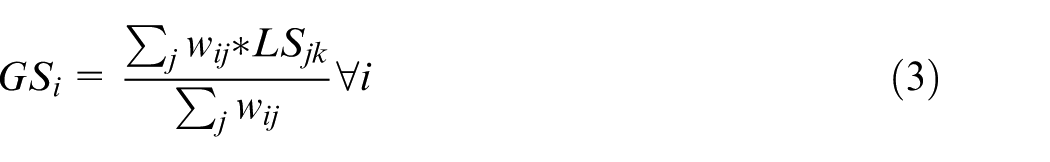
where i is a group of features, j is a set of input features, LS is the LS for each feature, and wij is a set of weights per group.
The GS function is used to find similarities between the new case and the existing cases in the Eco-CBR library. The existing cases with the highest similarities compared to the new case are then retrieved. The existing cases that are retrieved from the similarity process will provide solutions detailing the LCA, estimations of cost, customer requirements, and Eco-QFD indicators. The information from these retrieved cases is then reused in the solutions entry for the new case, within the solutions area that contains elements labelled ‘D’, ‘E’, ‘F’, and ‘G’. These solutions are retrieved from the Eco-CBR library using the following methods, as explained in the next sections.
LCA
The solution features for the LCA group, as represented by the area assigned by label ‘D’, are carbon footprint, total energy consumed, air acidification, and water eutrophication. These features are used for the finding of the quantitative measurement for the environmental impact of the product life cycle (material, manufacturing, use, transport, and EOL). These data are set to one of five rankings: ‘very high (VH)’, ‘high (H)’, ‘medium (M)’, ‘low (L)’, and ‘very low (VL)’. With this conversion, the interpretation of the LCA data by the designer will be well supported.
Cost estimation
Label ‘E’ represents the area that provides the solution group for cost estimation of the LCC. This solution provides information on the costs of manufacturing, environmental factors, transportation, product use, and EOL of the product. It integrates the environmental and product costs considerations into each Eco-QFD phase of the single Eco-HoQ. Thus, these costs will be stored in the Eco-CBR library for the use of the Eco-CBR. Five categories of cost are considered, as shown in Table 1.
Categories of cost solutions.
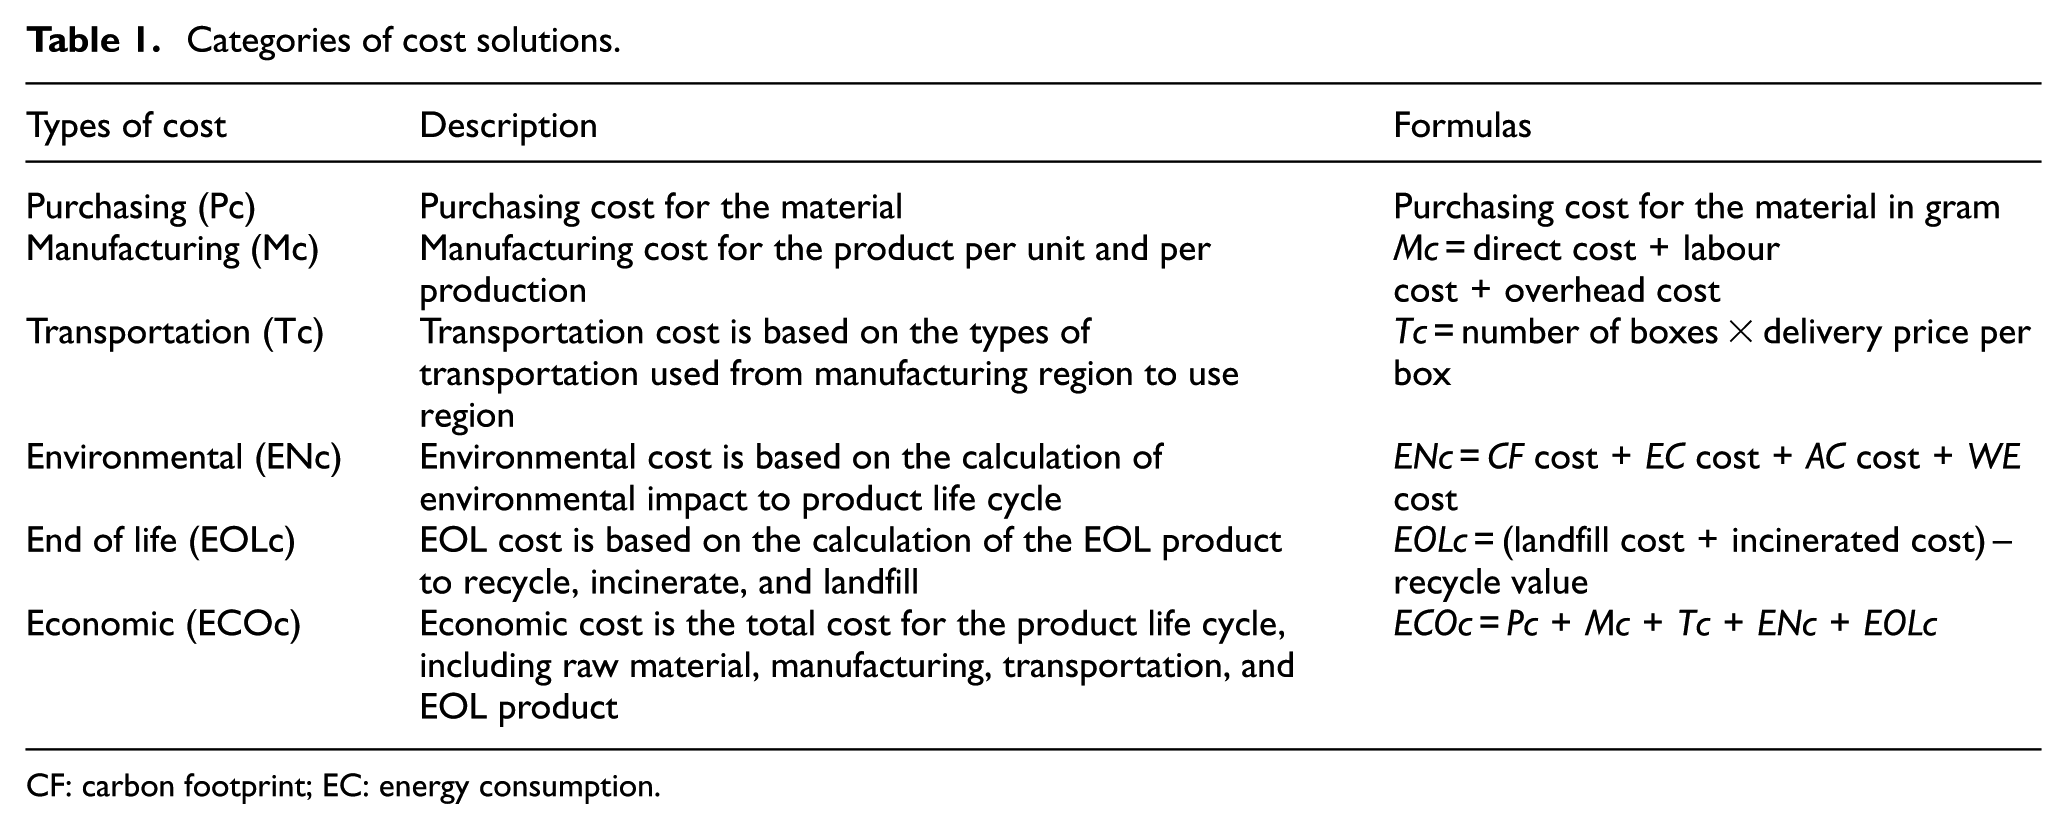
CF: carbon footprint; EC: energy consumption
Customer requirements
Area ‘F’ presents an assessment of the solution measured against customer requirements. Generally, these requirements are taken from the Eco-QFD in Phase I. Table 2 shows the application of this approach for the list of customer requirements, and the rules used to measure the product design taken from the case study.
Example for input data of customer requirements.
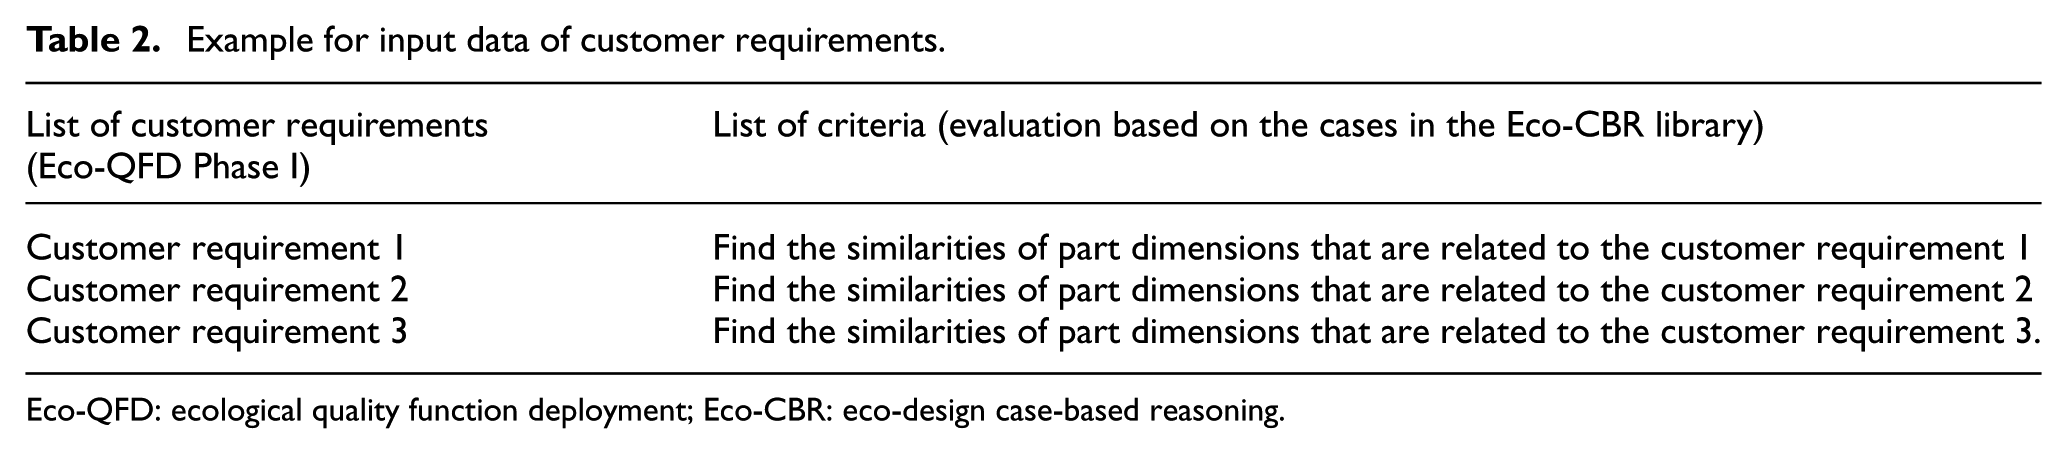
Eco-QFD: ecological quality function deployment; Eco-CBR: eco-design case-based reasoning.
The criteria for each requirement are developed based on the characteristics of the product design in the Eco-CBR library. These criteria are measured by calculating the average of the LS for each requirement. The LS functions are considered in a range of [0, 1]. Here, ‘0’ represents the worst criteria and ‘1’ represents the best criteria for product design to fulfill the requirements from the customer. Figure 5 shows an example of customer requirements, with the average LS of the product design.
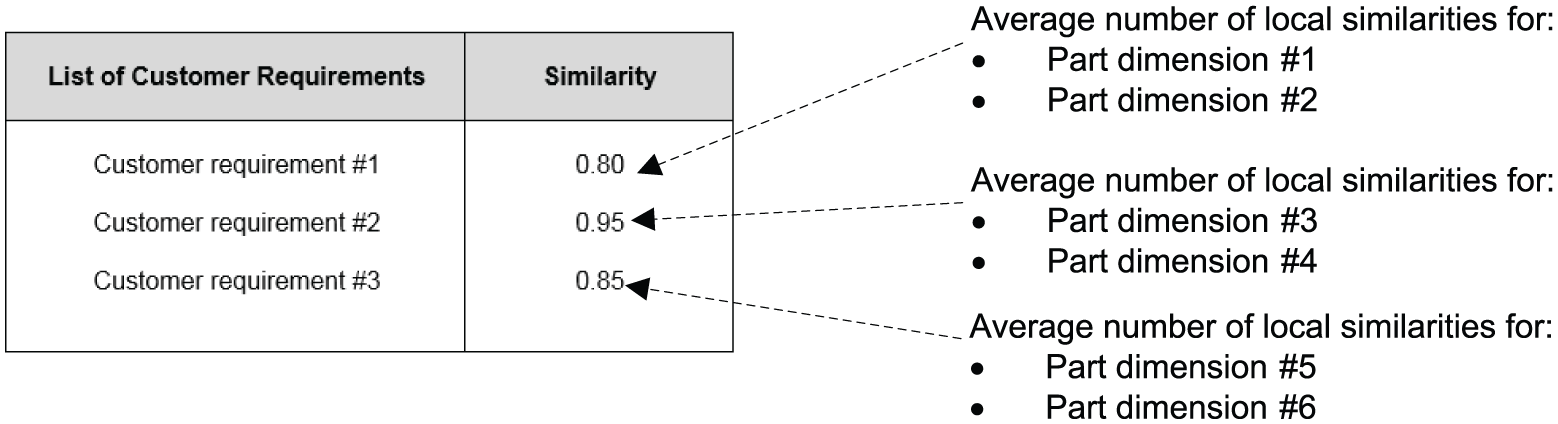
Screenshot of the solution to customer requirement assessment (Area ‘F’).
Eco-QFD indicators
Area ‘G’ represents the summarised indicators for an Eco-QFD evaluation for three of the most important factors in sustainable product design. The indicators comprised environmental impact, product design, and customer requirements. The purpose of this solution is to summarise the performance of the product design assessment in three aspects (environmental impact, product design, and customer requirements). These indicators are assigned a single number based on the integration between the Eco-CBR solutions with the Eco-QFD weighting factors (Phase I). This solution is intended to be used to help industry decision-makers to propose solutions for new product design features by reusing solutions from similar cases and past experiences.
LCA indicator
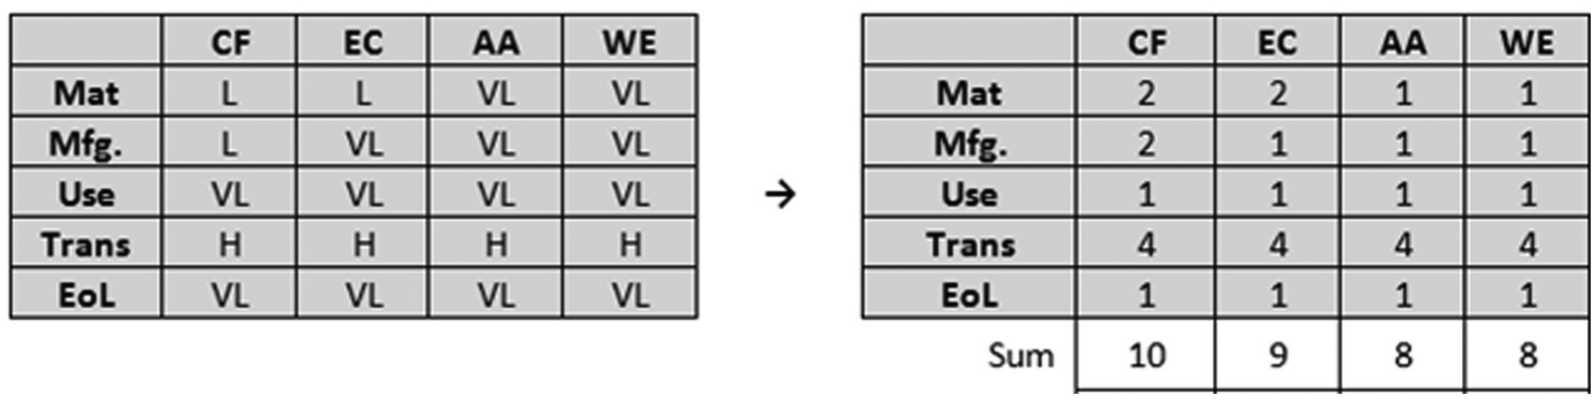
Various units of measurement are found in the inputs of the environmental impact indicator in this study, such as carbon footprint (kg CO2), total energy consumed (MJ), air acidification (kg SO2), and water eutrophication (kg PO4). In order to solve this problem, the qualitative to quantitative conversion approach is used by assigning a score per value: very low (VL): 1, low (L): 2, medium (M): 3, high (H): 4, and very high (VH): 5. Once the numerical conversion is done, the total score per environmental feature is calculated with the addition of all values, as shown in Figure 6.
Conversion of environmental impact indicators.
Equation (4) is used to summarise these impacts into a single indicator via the weights that are retrieved from the Eco-QFD Phase I
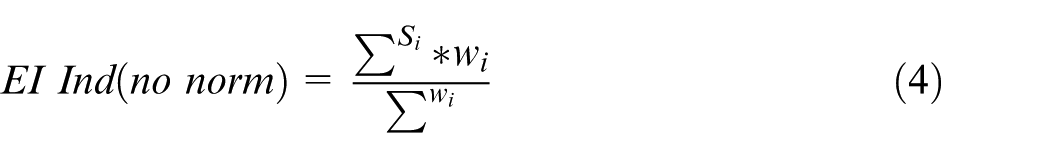
where
The environmental impact factor has to be normalised into the range of [0, 1]. In order to achieve this, a transformation function is used. The value range for the non-normalised indicator is [5, 25], in which ‘25’ represents the maximum number from ‘worst possible value indicator’ = [All Very High (5 × 5)] and ‘5’ represents the minimum number from ‘best possible value indicator’ = [All Very Low (1 × 5)]. These values are then translated using equation (5), where the line between two coordinates is (x1, y1 = 5, 1) and (x2, y2 = 25, 0). This can be written as
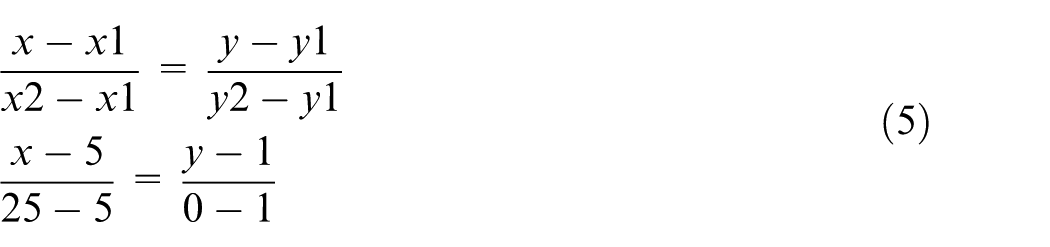
The result of equation (5) is represented as follows
Equation (6) is used to produce attribute y, which represents the environmental impact indicator for normalisation; x is the environmental impact that has not yet been normalised. This result is an indicator that is weighted in a range of [0, 1], which gathers the important weight revealed in Eco-QFD Phase I, thus allowing the comparison of results with other Eco-QFD indicators.
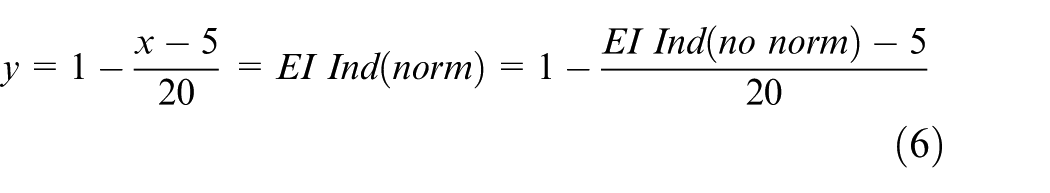
Figure 7 displays the integration process between the Eco-QFD and Eco-CBR tools for the product design indicator. The design dimensions are critical for fulfilling customer requirements. There will be a range of possible solutions for the product design in the Eco-CBR library. A new case for product design is created by combining different variables and populating it into the Eco-CBR library. This product design indicator considers the key critical design dimensions and relative weights for a product from the process of Eco-QFD Phase I. The values of relational strength between design criteria and parts are retrieved from Eco-QFD Phase II. It is then integrated into the Eco-CBR process to analyse the design indicators for a new case assigned in the Eco-CBR.
Integration process between the Eco-QFD and Eco-CBR tools.
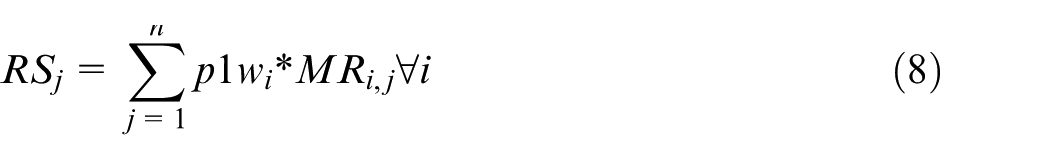
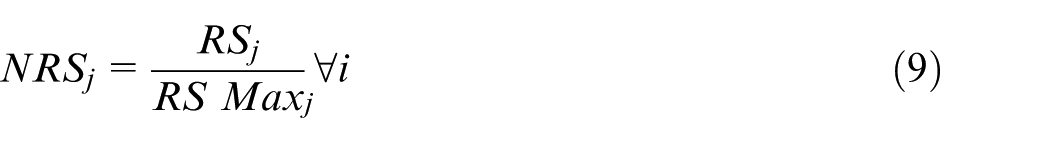
An LS will be retrieved from the design group in the Eco-CBR process. The LS is calculated for each critical design dimension and is used to weigh the values of relational strength. The following process is the calculation of the raw score, where the sum of the modified relational strength is multiplied by the weights (Eco-QFD Phase I). The normalisation of each part is then calculated by dividing each raw score by its maximum possible score, which is calculated by setting the feature similarity to 1. The raw score data is normalised in the range of [0, 1].
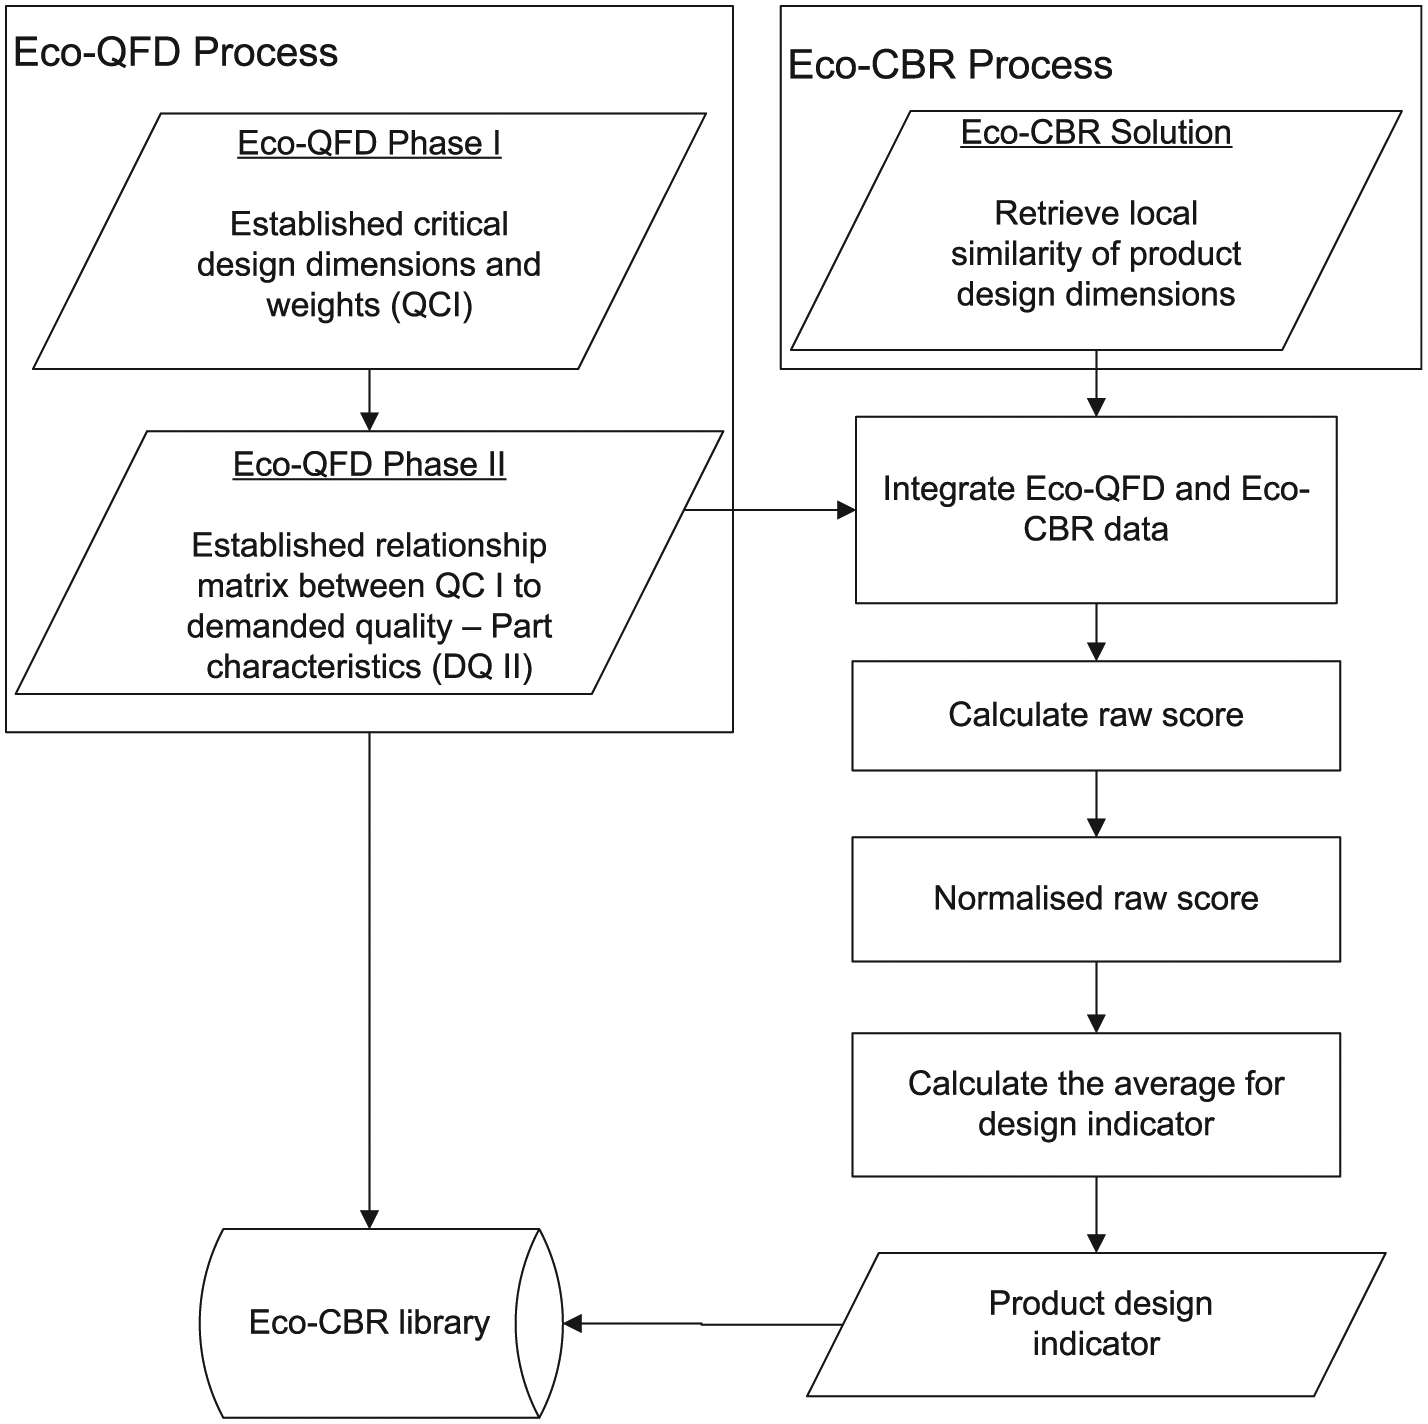
Tables 3 and 4 show the process of integration between the Eco-QFD and the Eco-CBR tools. In Table 3, LS is considered to be ‘1’ for each design criterion and is used to find the maximum score of each part. The maximum score is used as a reference to calculate the normalisation of the raw score. The weight for each design criterion is taken from Eco-QFD Phase I. The numbers of relational strength between design criteria and parts deployment are retrieved from Eco-QFD Phase II.
Integration of features selection between Eco-QFD and Eco-CBR processes.
Eco-QFD: ecological quality function deployment; Eco-CBR: eco-design case-based reasoning.
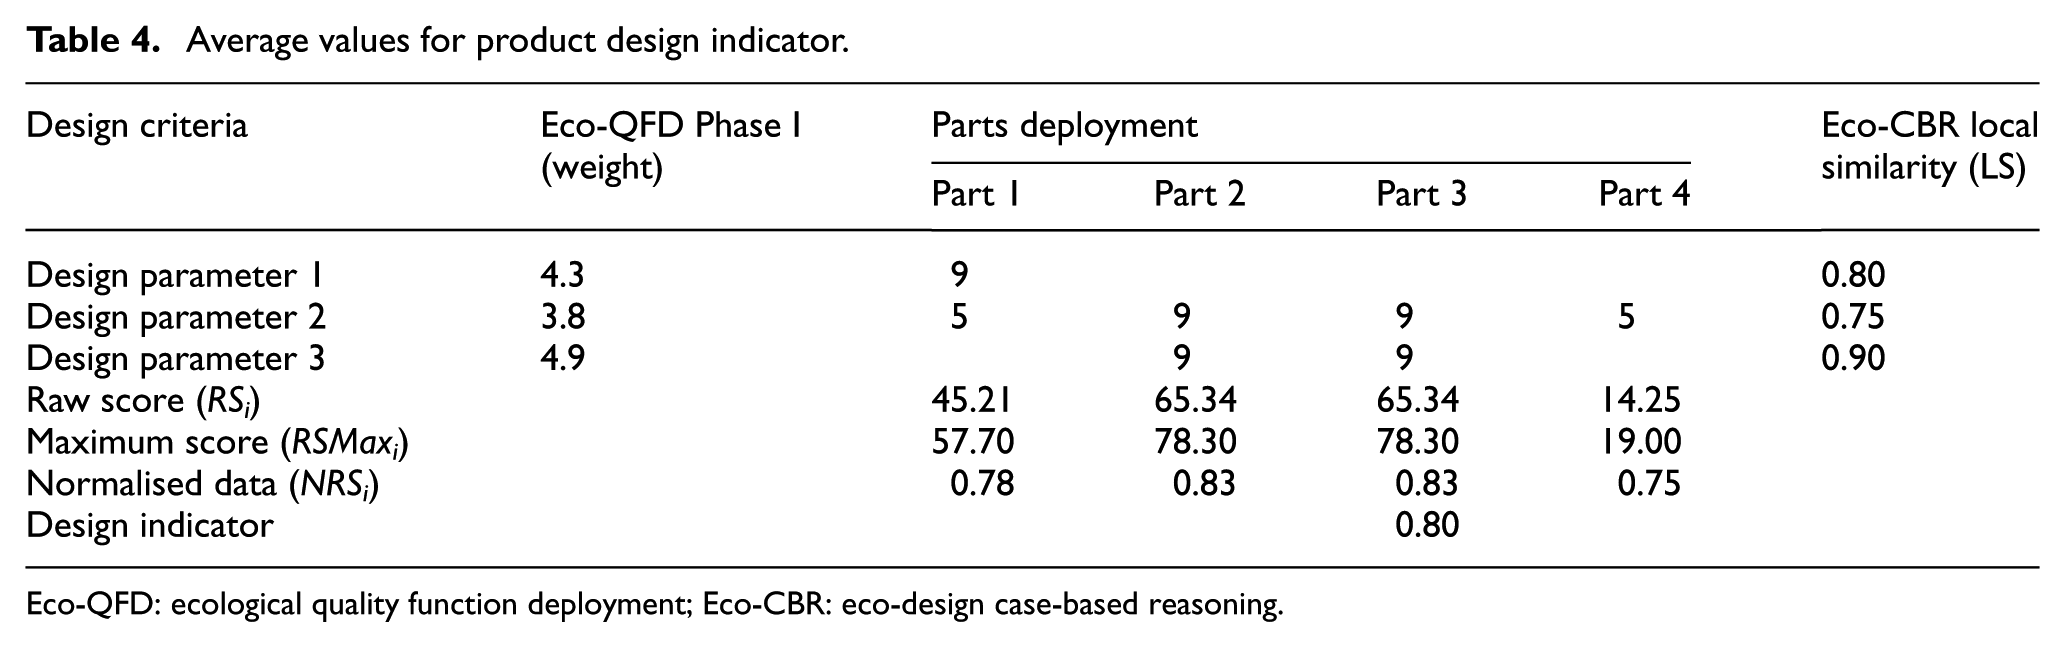
Average values for product design indicator.
Eco-QFD: ecological quality function deployment; Eco-CBR: eco-design case-based reasoning.
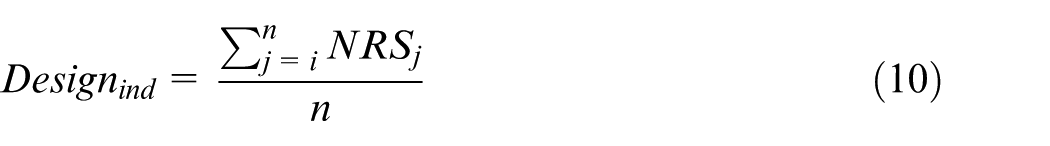
The modifications of relational strength, raw score, and normalisation are then calculated using equations (7)–(9), respectively; equation (10) is used to calculate the design indicator. Examples of the outcomes of these equations are shown in Table 4

where
Table 4 shows the next step in this process, based on Table 3, which is used to calculate raw scores and normalised data for part deployment. The ‘Eco-CBR LS’ column shows the values that are recorded from the assessment in the design group. The values are recorded in conjunction with the critical design criteria from Eco-QFD Phases I and II. The raw score and normalised data for parts deployment are then calculated. The design indicator summarises all of the normalised weights in one single indicator using equation (10), as shown in Table 4.
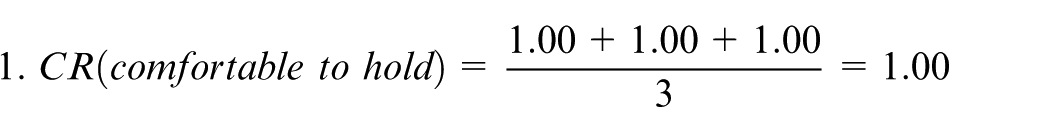
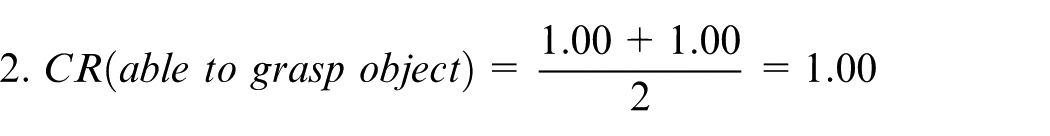
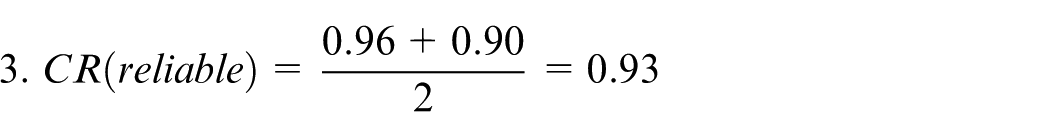
This customer requirement indicator represents the relationship between various features of customer requirements in Eco-QFD Phase I and input measurements in Eco-CBR’s new case. The process combines the data from the customer solution, as shown in Table 2, with the weight assigned for each feature in the Eco-QFD process. Since the input data are in the range of [0, 1], no normalisation is needed. The indicator is calculated with the following expression
where
Case study and discussions
The objective of this case study is to demonstrate the use of the Eco-CBR tool in the creation and analysis of new medical forceps. In response to the durability issue raised in the previous study, 1 it was confirmed that the handles of the existing stainless steel forceps are solid and therefore it could be assumed that the material reduction will be 10%, without a performance trade-off in the product. Figure 8 shows the revised design dimensions by reducing the length of the shaft and the thickness of the handles by 10%. The assessment for the Eco-QFD was conducted by a design engineer working in the area of advanced sustainable manufacturing technologies.
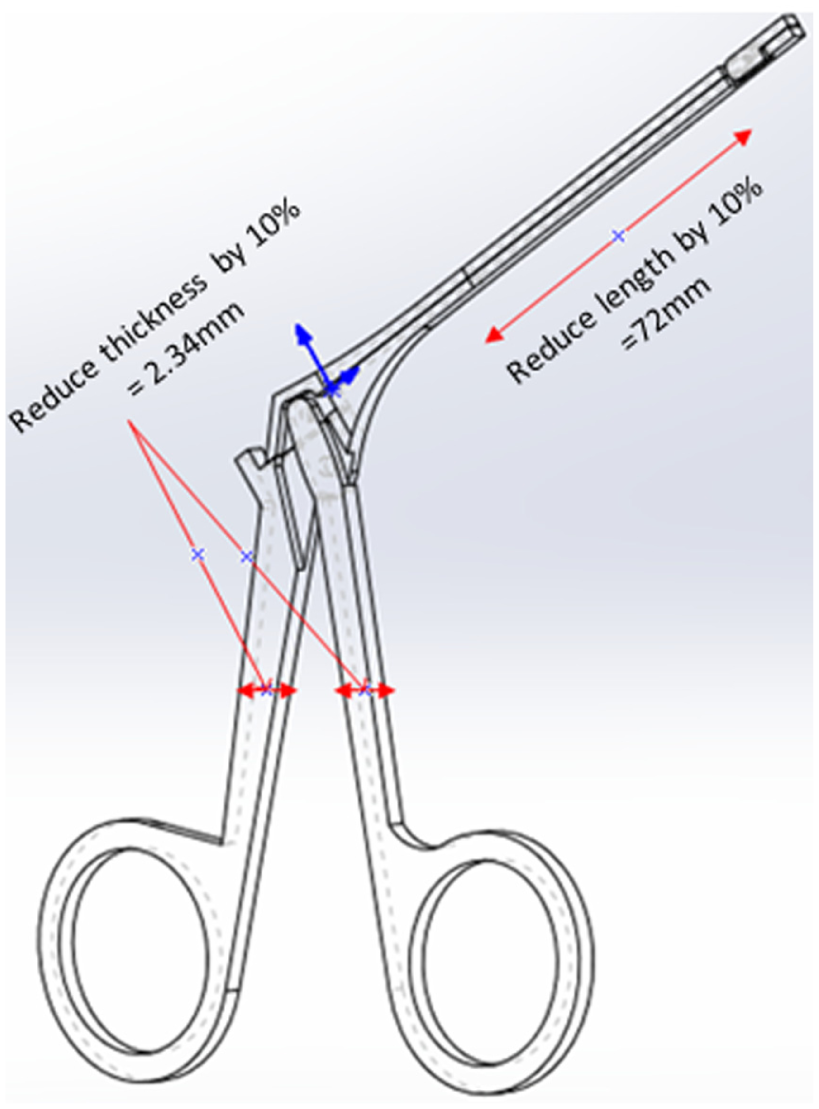
Revised design dimensions.
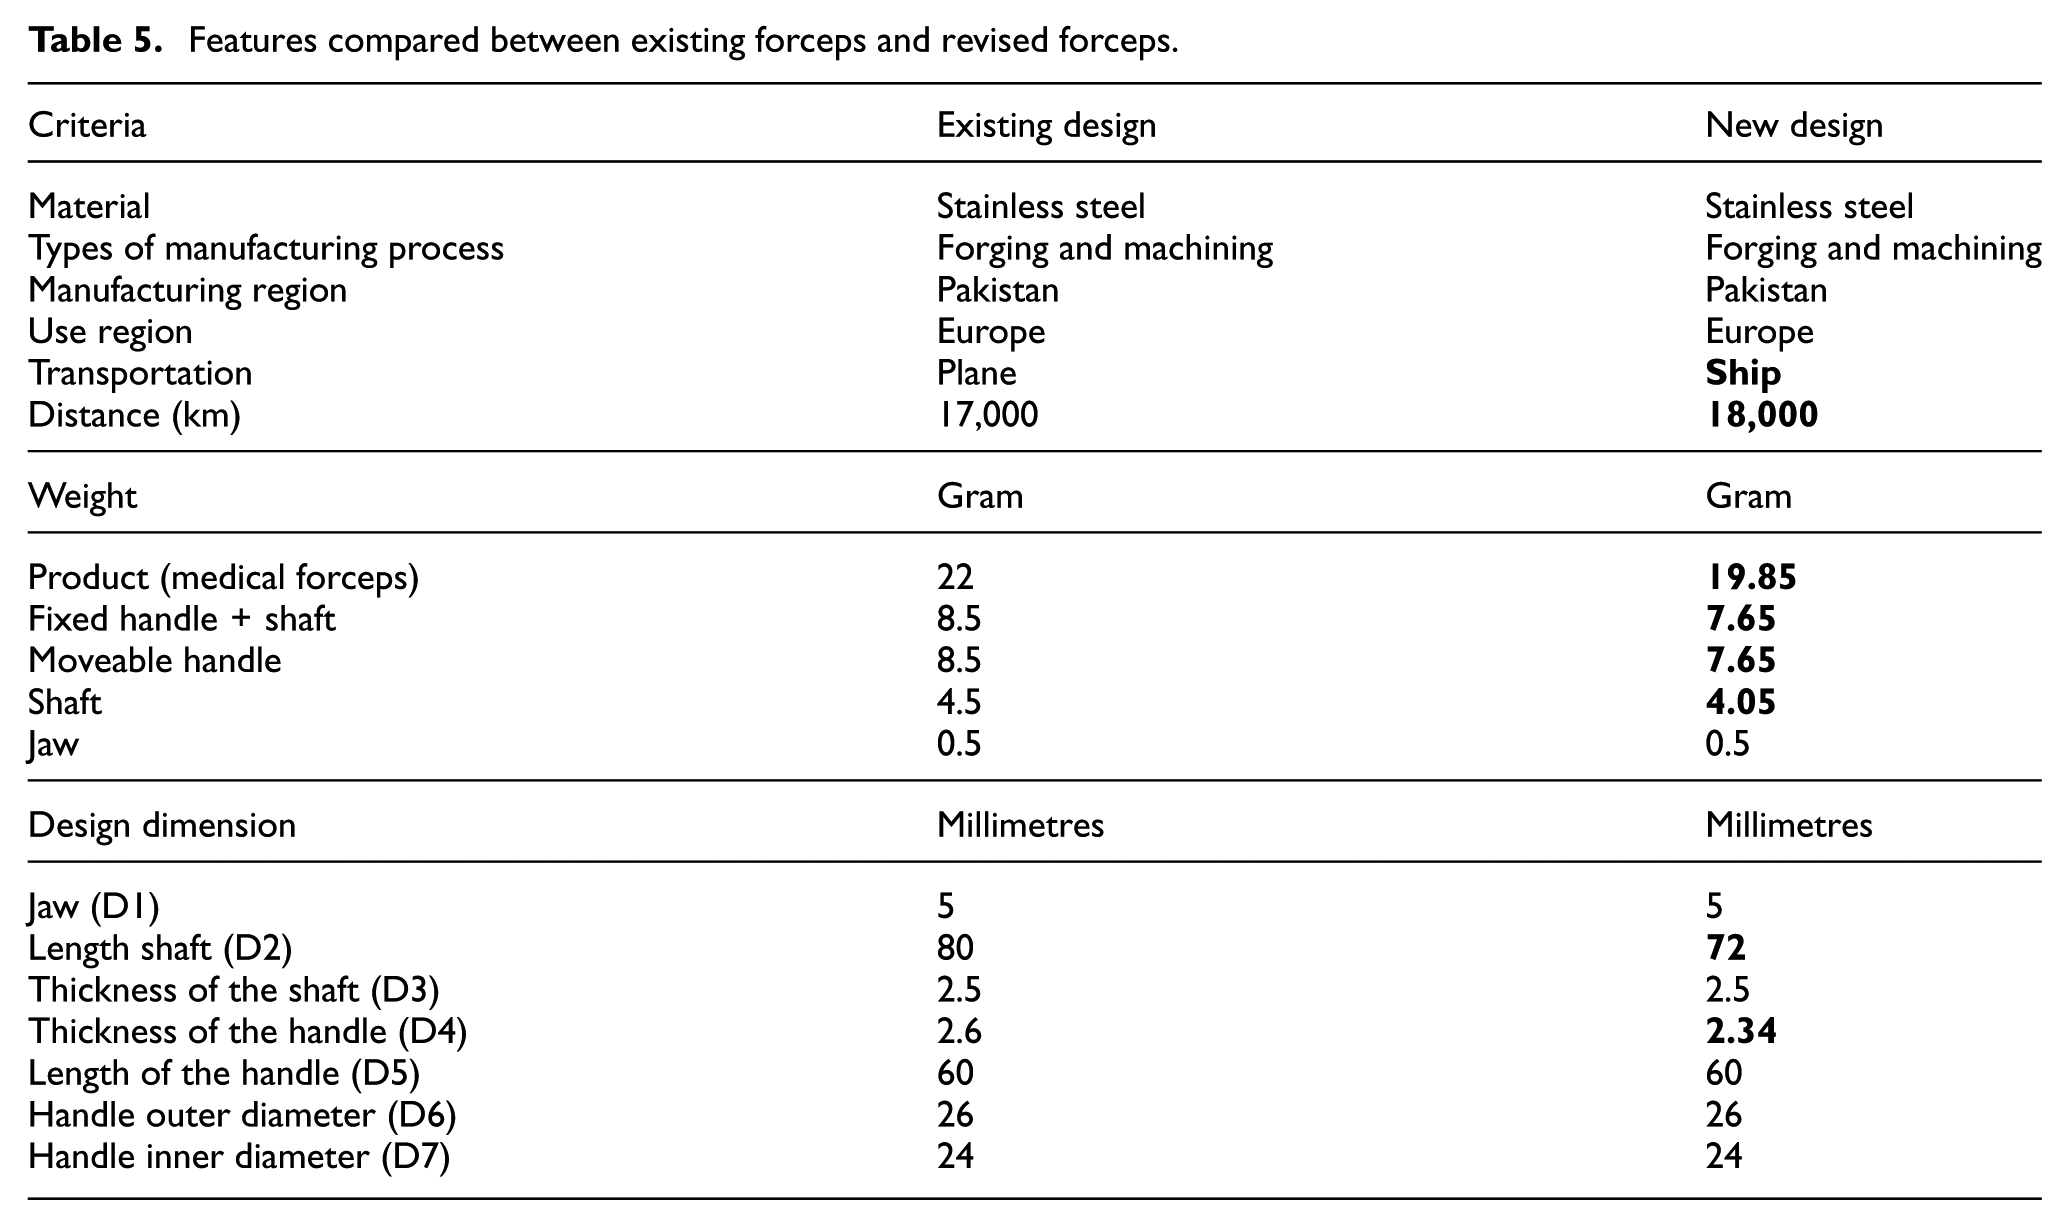
Table 5 presents a comparison between the new product and the existing product. The information highlighted in bold under the ‘new design’ column indicates parameter changes for the new case, while non-bold indicates unchanged parameters. The transportation method is changed from plane transportation to ship transportation. The Eco-CBR tool proposes better solutions by moving towards a lower environmental impact and lower economic cost. Furthermore, the design still provides the same quality of performance and still fulfils the customer’s requirements.
Features compared between existing forceps and revised forceps.
The features of an existing case are categorised into two sections, namely, the problem and solutions. Table 6 shows the input values and weights for a new case without a solution assigned by the designer. The information from the retrieved cases is reused in the solutions entry for the new case. Weights for volume and material cost are not given, because these features are not considered to be found among the similarities, but they are used for the calculation of cost estimation.
Features of a new case.
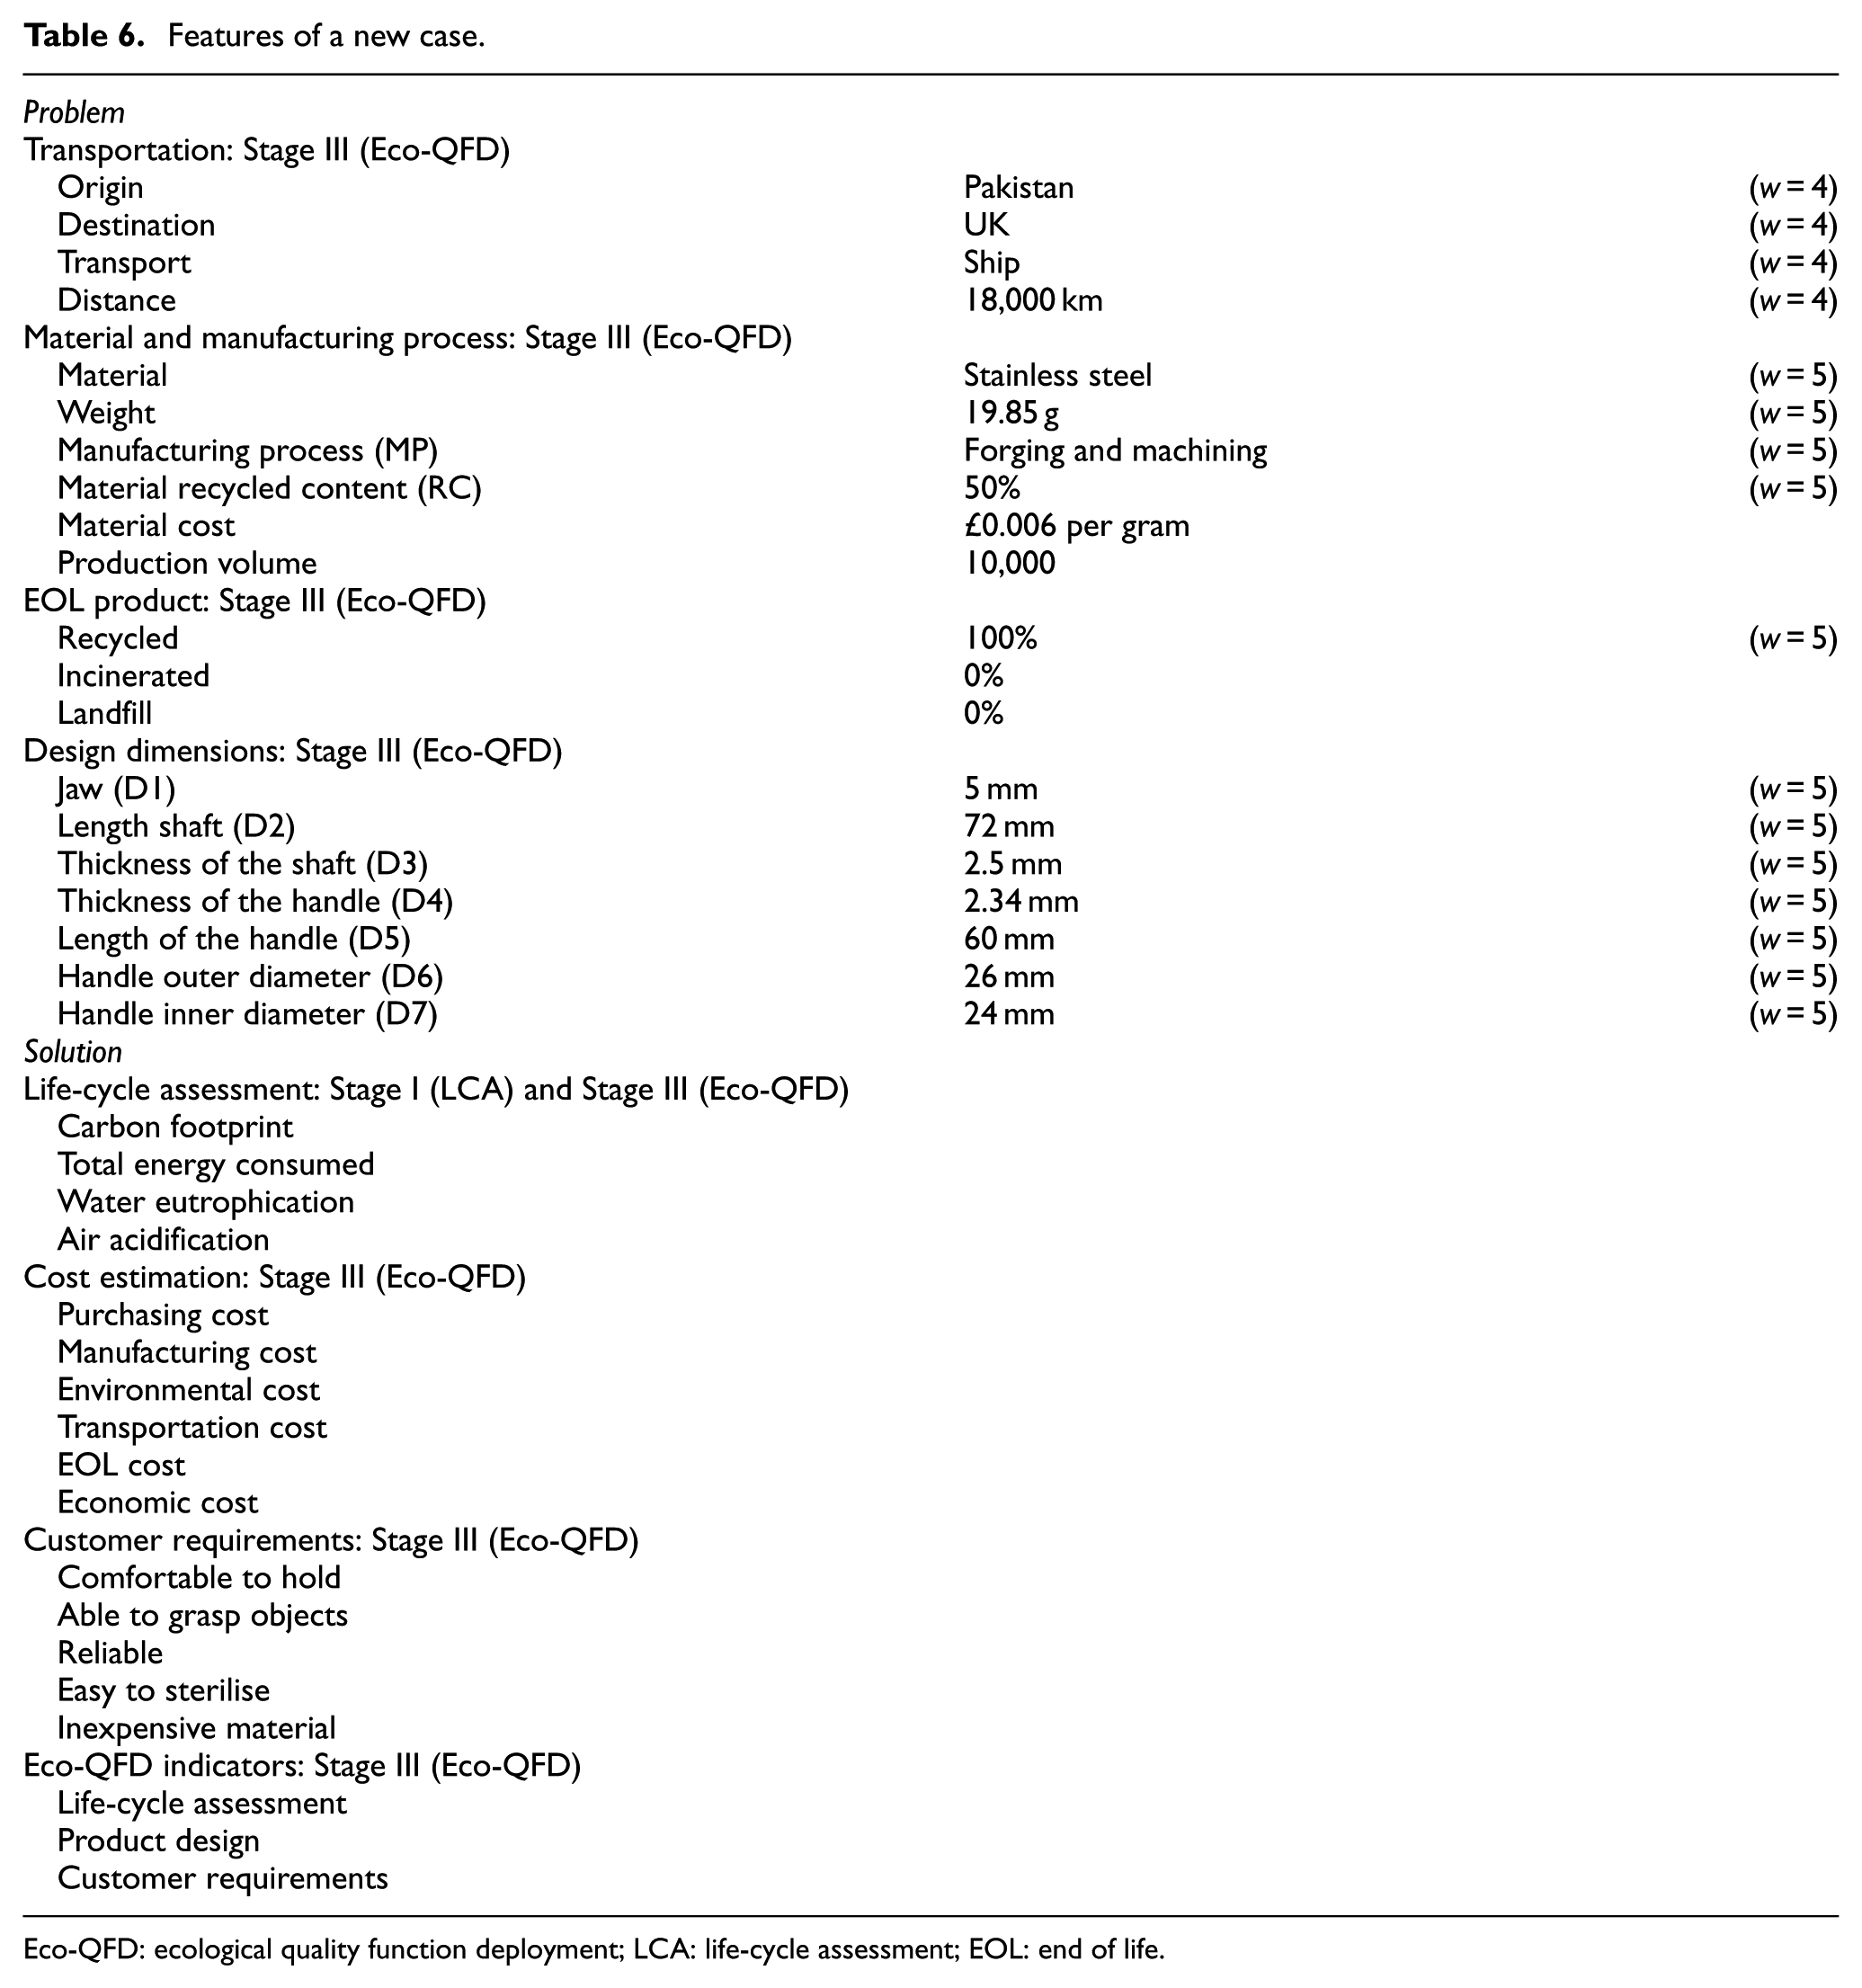
Eco-QFD: ecological quality function deployment; LCA: life-cycle assessment; EOL: end of life.
The next step is to conduct the similarity function between the new case and existing cases in the Eco-CBR library. Area ‘C’, as shown in Figure 3, represents the retrieved cases from the process of finding similarities. Figure 9 shows the retrieved cases that are based on the highest similarities found during the search process. The group of existing cases that are retrieved from the Eco-CBR library are rated in a range of [0, 1], where ‘0’ represents the lowest similarity and ‘1’ represents the highest similarity.
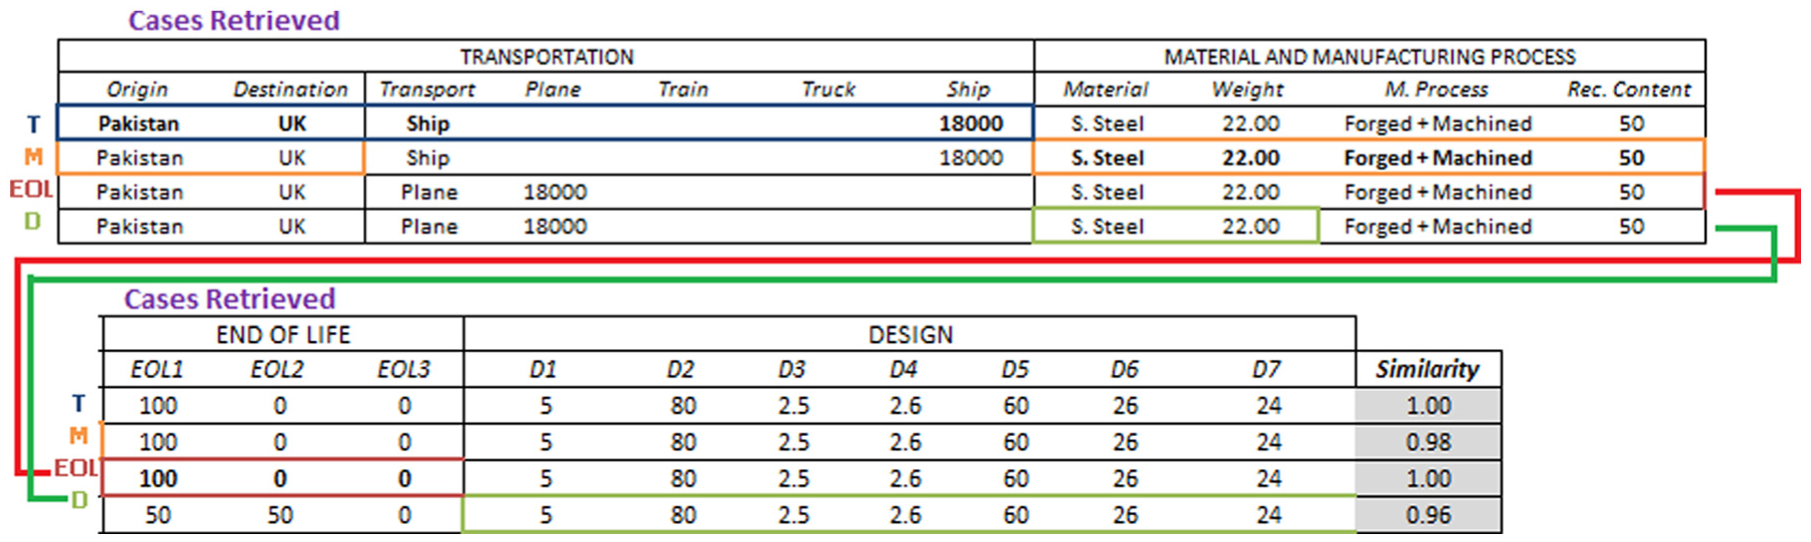
Screenshot of the retrieved cases.
The illustration of the LS and GS calculations for the transportation group is shown below. Table 7 provides a summary of these calculations, using the context of a case retrieved from the Eco-CBR library for the transportation group. Here, the GS of 1.00 shows that the result obtained from the retrieved case provides the highest similarity to the new case.
Transportation group.
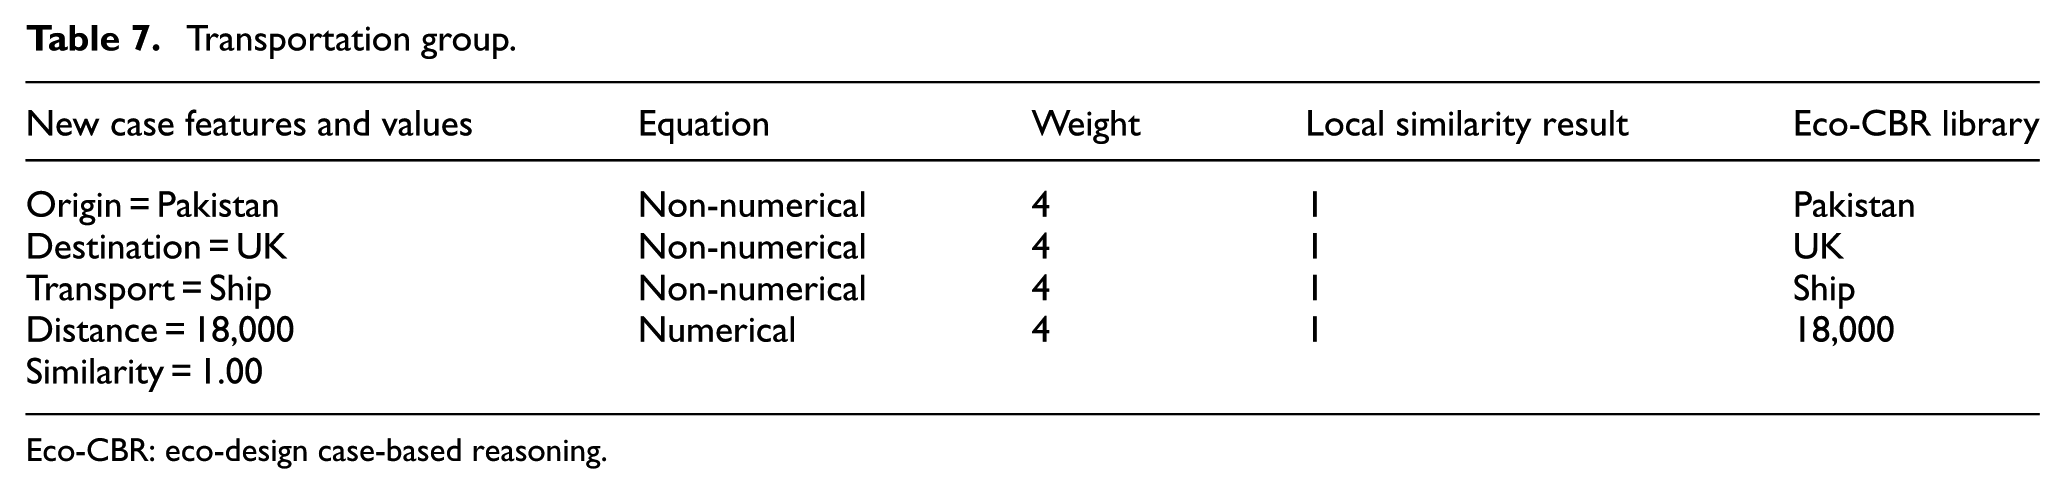
Eco-CBR: eco-design case-based reasoning.
Non-numerical LS


Numerical LS

GS ≈ similarity

Table 8 shows the retrieved cases and GS for the groups in the material and manufacturing process, EOL, and design dimensions, with values of 0.98, 1.00, and 0.96, respectively. The solution for this retrieved case can be reused for an adaptation to the new case.
Retrieved cases with similarities
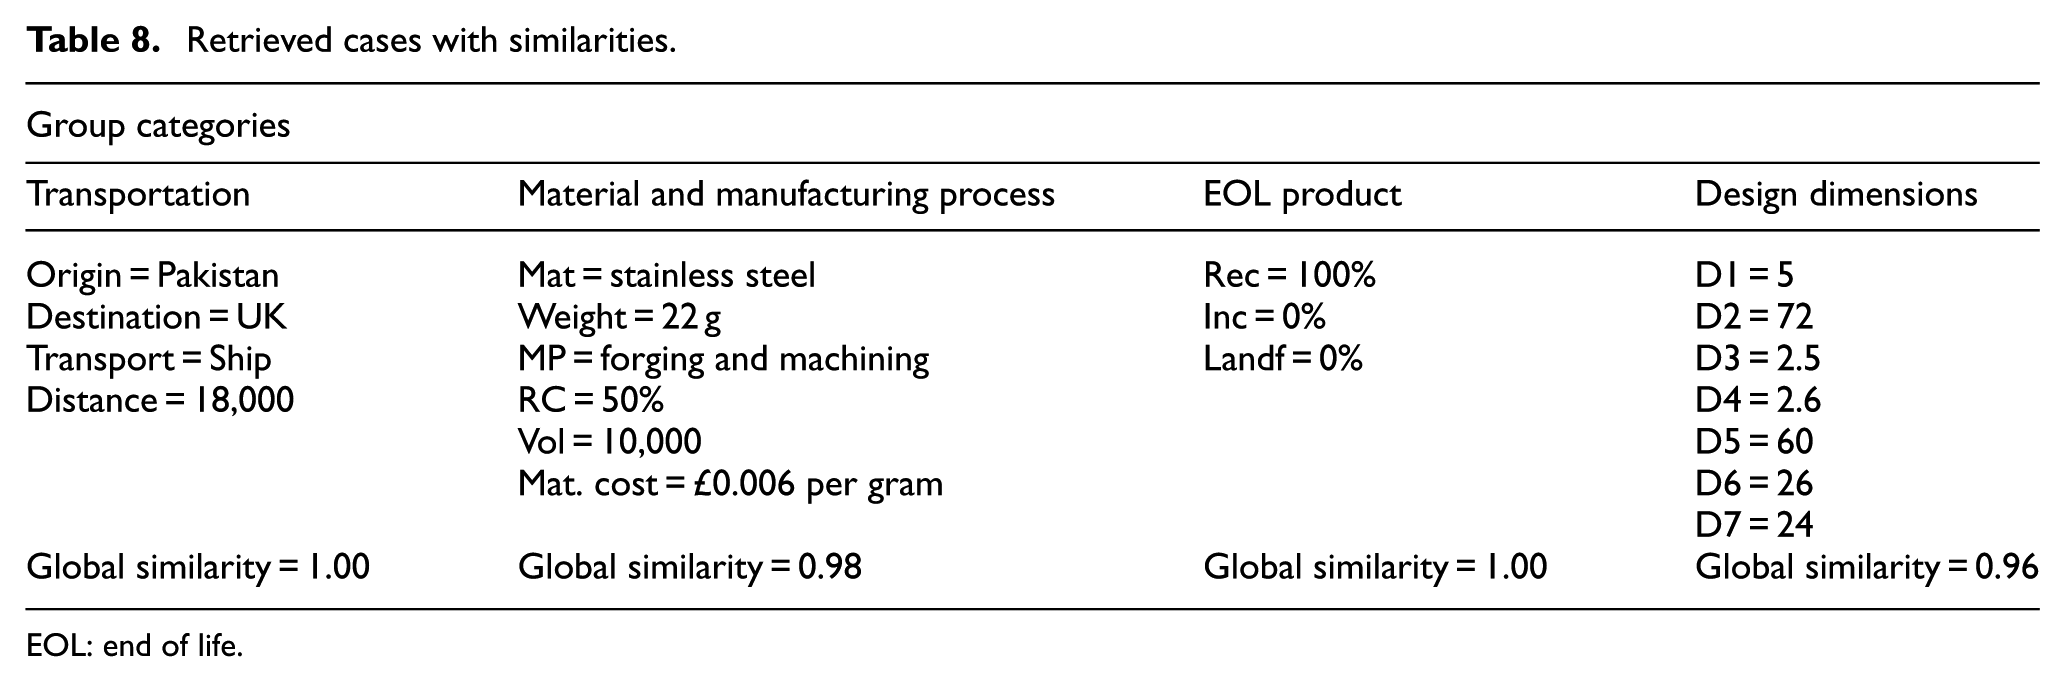
EOL: end of life.
The next process is the case adaptation. In this Eco-CBR method, the process of adaptation represents an important step, as it translates the retrieved solution into the appropriate solution for the current problem (the new case).
Solutions for the new case
Four categories of solutions that were retrieved from the Eco-CBR library were recommended for the new case, as follows:
LCA
Cost estimation
Customer requirements
Eco-QFD indicators
Figure 10 shows the solution of the product life cycle to be analysed, based on the associated environmental impact. The procedure continues by analysing the new case criteria relative to the retrieved case, making adjustments in the values assigned to each category to reflect changes in the proposed product parameters. Here, the LCA results in Figure 10 show that carbon footprint, total energy consumed, air acidification, and water eutrophication resulted in 0.0994 kg CO2, 1.0987 MJ, 0.0006 kg SO2, and 0.0003 kg PO4, respectively. The carbon footprint, total energy consumed, air acidification, and water eutrophication provide ‘Very Low’ impacts on the product usage (because no energy is required for operation), transportation via ship (originating in Pakistan and being shipped to the United Kingdom), and the EOL product that is 100% product recycling. The process of translation from quantitative to qualitative data is performed based on the data from the Eco-CBR library. These data result in one of the five rankings: ‘Very High (VH)’, ‘High (H)’, ‘Medium (M)’, ‘Low (L)’, and ‘Very Low (VL)’.
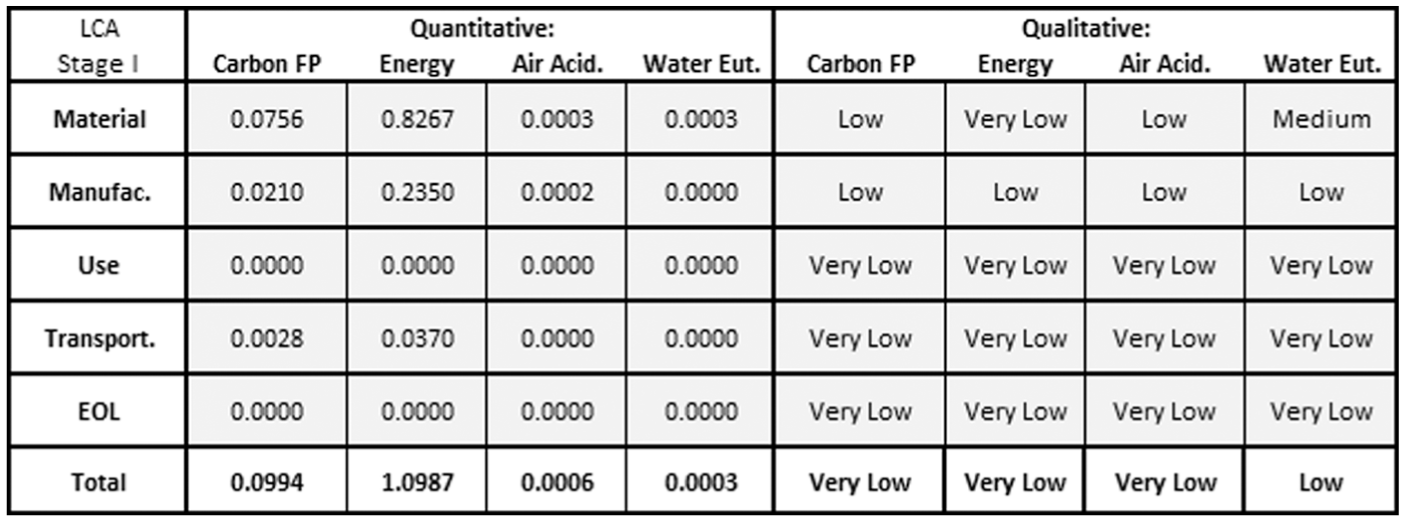
Screenshot of the solution for life-cycle assessment.
Label ‘E’, as shown in Figure 3, represents the area that provides the LCC of the solution group for cost estimation. The ecological economic cost (eco-economic cost) model is shown in Table 1, which is an approach used to summarise the development enabled by the Eco-QFD and Eco-CBR in the IEDM framework. Table 9 shows the information of the cost parameters used in this study.
Cost parameters.
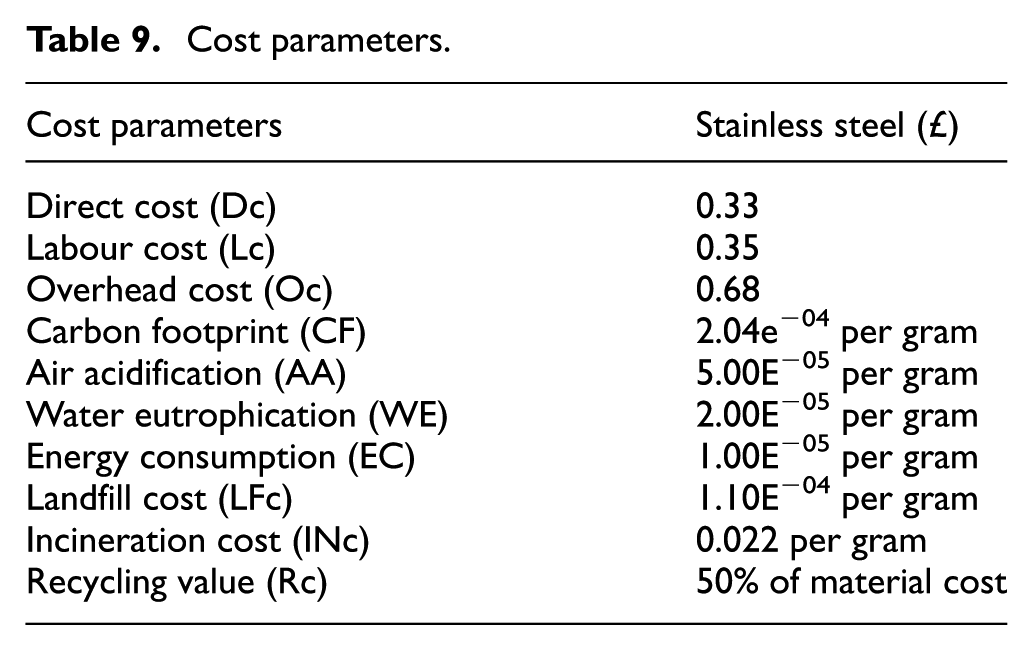
Figure 11 shows the screenshot of the solution for cost estimation, which is calculated based on ‘per unit’ as well as ‘per production’ (product volume) costs. The cost parameters presented in bold in Figure 11 refer to the estimated cost for the new case, while the non-bold parameters refer to the retrieved case. The summarised economic cost is presented in the form of a range, calculated as the minimum and maximum costs for the new case.
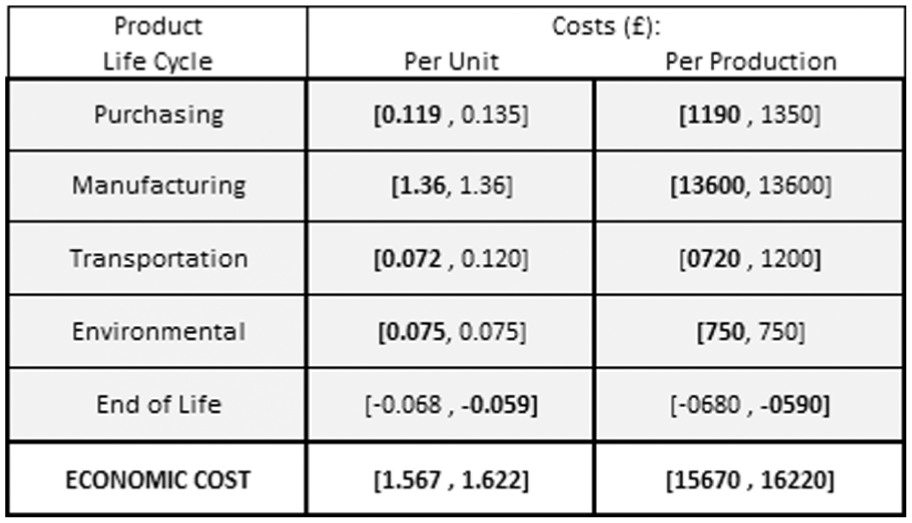
Screenshot of the cost estimation.
The data presented in Figure 11 are auto-generated by the Eco-CBR tool. The calculation of the new case shown here is undertaken using the parameters listed in Table 1.
1. Production cost per unit
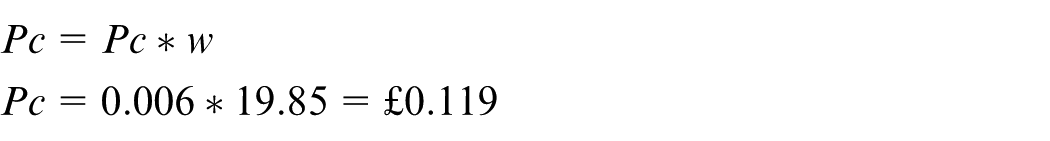
2. Production cost per production

3. Manufacturing cost per unit
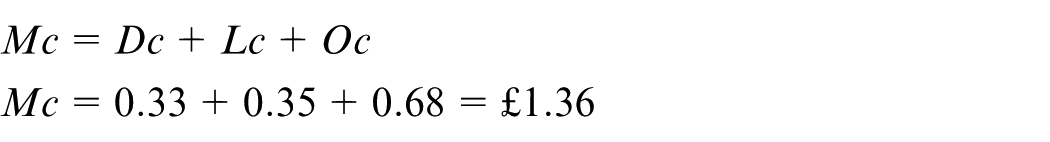
4. Manufacturing cost per production

The calculation of the transportation cost, Tc, is straight forward. First, the capacity of a suitable box, Bc, is identified. Next, the required whole number of boxes to contain the volume of production, Vp, is calculated. Finally, the logistical price to deliver a box, Db, is considered. This can be written as
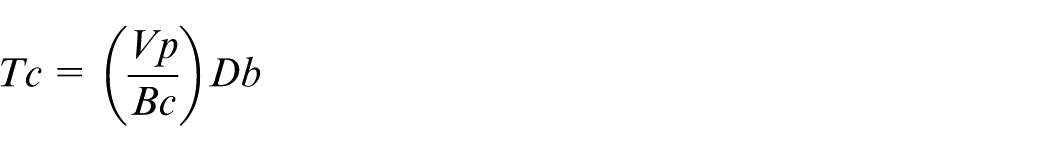
Here, a box of forceps contains 1300 pieces and the volume of production was set to 10,000. The price is £90.00 per box from Pakistan to the United Kingdom by ship was based on the dynamic parcel distribution (DPD) 39 website.
5. Transport cost per production

6. Transport cost per unit

7. Environmental cost per unit
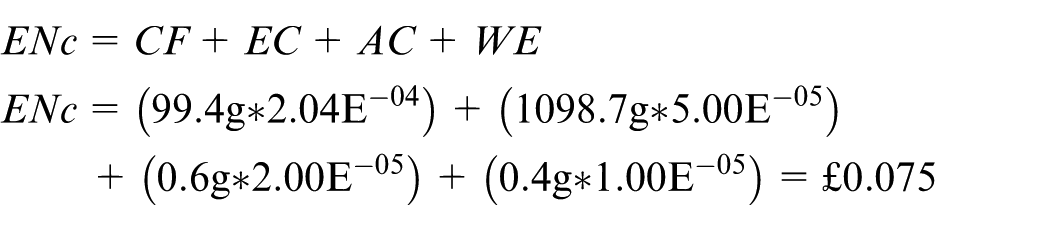
8. Environmental cost per production

9. EOL cost per unit
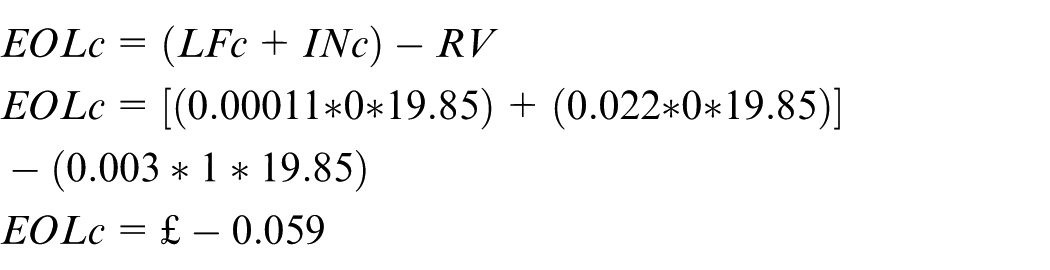
10. EOL cost per production

11. Economic cost per unit
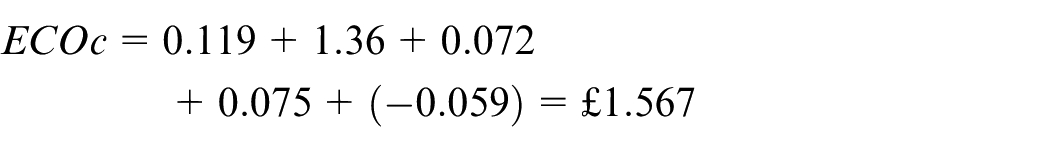
12. Economic cost per production

For the economic cost per unit, the solution results in £1.567 for a minimum limit and £1.622 for a maximum limit. This approach is applied across the production volume of 10,000 pairs of forceps, where the minimum and maximum economic costs are between £15,670 and £16,220, respectively. When retaining a new case in the Eco-CBR library, the system will provide options to the designer (either to save the cost based on the estimated cost or the retrieved cost), which depends on the user’s preference.
Area ‘G’, as shown in Figure 3, presents an assessment of the solution measured against customer requirements. Generally, these requirements are taken from Eco-QFD Phase I. 1 Table 10 presents the application of this approach with the list of customer requirements, and the criteria used to measure the medical forceps are taken from the previous case study. 3 In Table 10, the process starts with the calculation of the inputs. The similarities of the handles (D6 and D7) are calculated with a different method. For each dimension, a range between minimum and maximum values from the library can be combined by finding the average value.
Customer requirements’ input calculation.
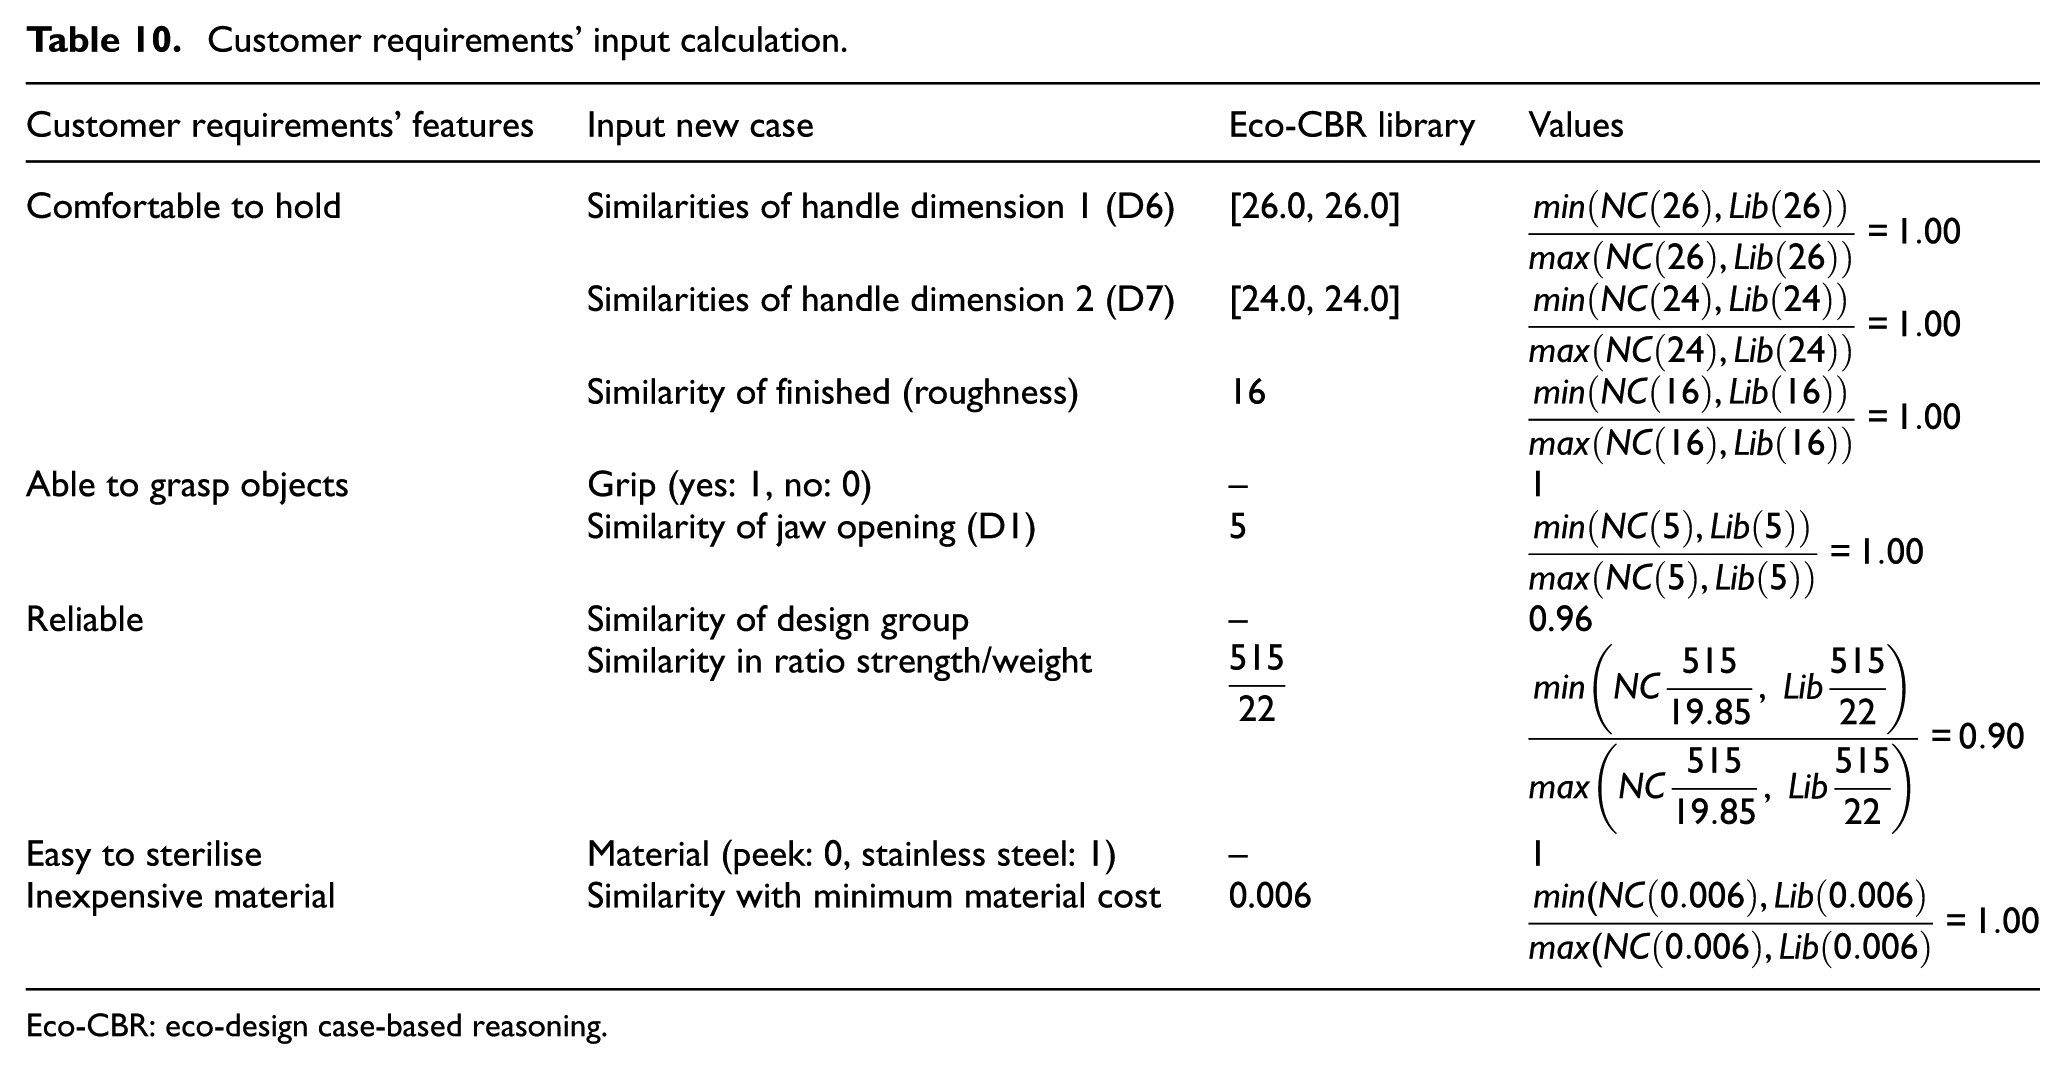
Eco-CBR: eco-design case-based reasoning.
The retrieved case from the Eco-CBR library shows that the dimension for D6 = 26 mm, D7 = 24 mm, and D1 = 5 mm; strength (stainless steel) = 515 MPa; roughness = 16 µin; weight = 22 g; and material cost (stainless steel) = £0.006 per gram. Meanwhile, the new case design dimensions that were assigned earlier in area ‘A’ are D6 = 26 mm, D7 = 24 mm, and D1 = 5 mm; strength (stainless steel) = 515 MPa; roughness = 16 µin; weight = 19.85 g; and material cost (stainless steel) = £0.006 per gram.
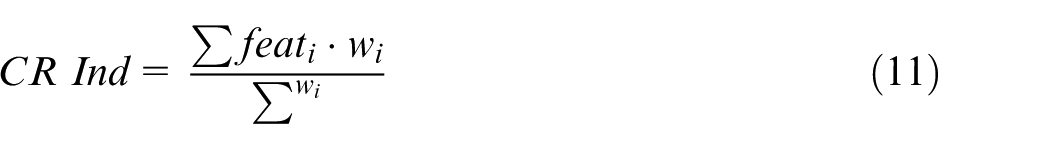
Equation (11) was used to calculate the average value of the listed inputs for each customer requirement


From these calculations and by observation of the customer requirements’ features in Table 10, it is clear that the proposed new case solution fulfills the existing customer requirements when measured against four features. The main difference is in the strength to weight ratio which should be noted and could be investigated at a later stage. The decision can then be taken to confirm that the new case will fulfill the requirements.
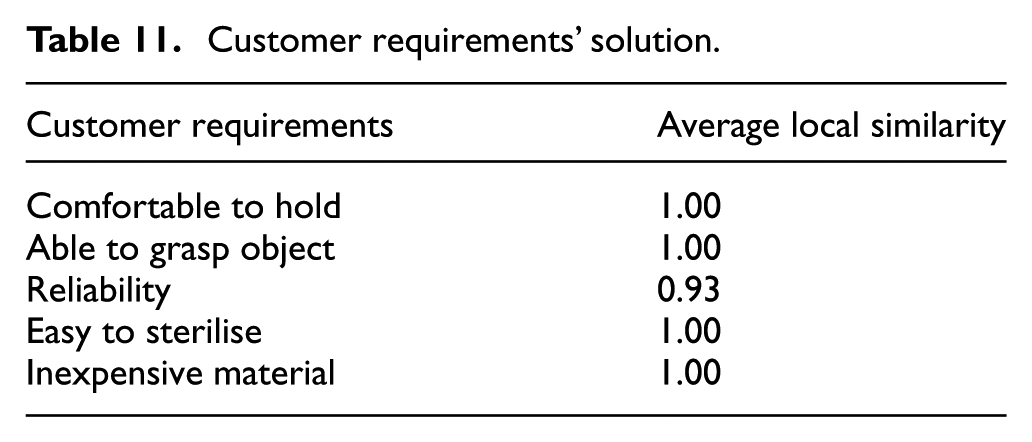
Table 11 represents the Eco-QFD indicators’ solutions for the product’s LCA, design, and customer requirements. The purpose of this solution is to summarise the performance of the product design assessment in three aspects (environmental impact, product design, and customer requirements). The factor performance in Table 11 shows the Eco-QFD scores that were evaluated and integrated into the Eco-CBR method.
Customer requirements’ solution.
The result of the factor performance for each indicator was calculated as follows.
Environmental impact indicator
For the EI indicator, the first step is to translate the qualitative data in Figure 10 into a numeric scale, as shown in Table 12. Equation (12) is applied to calculate this indicator. The result shows that the indicator for the environmental impact (EI) is 0.90
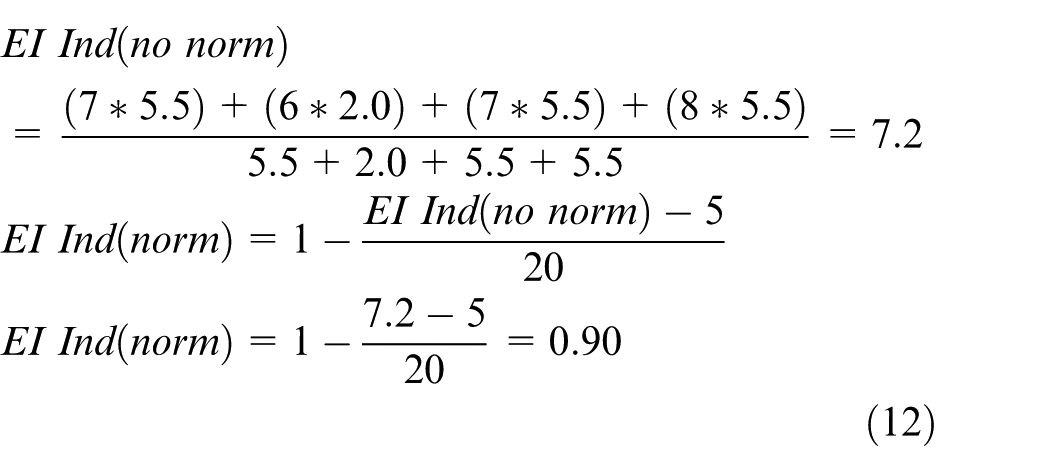
Qualitative data to numeric scale for environmental impact indicator.
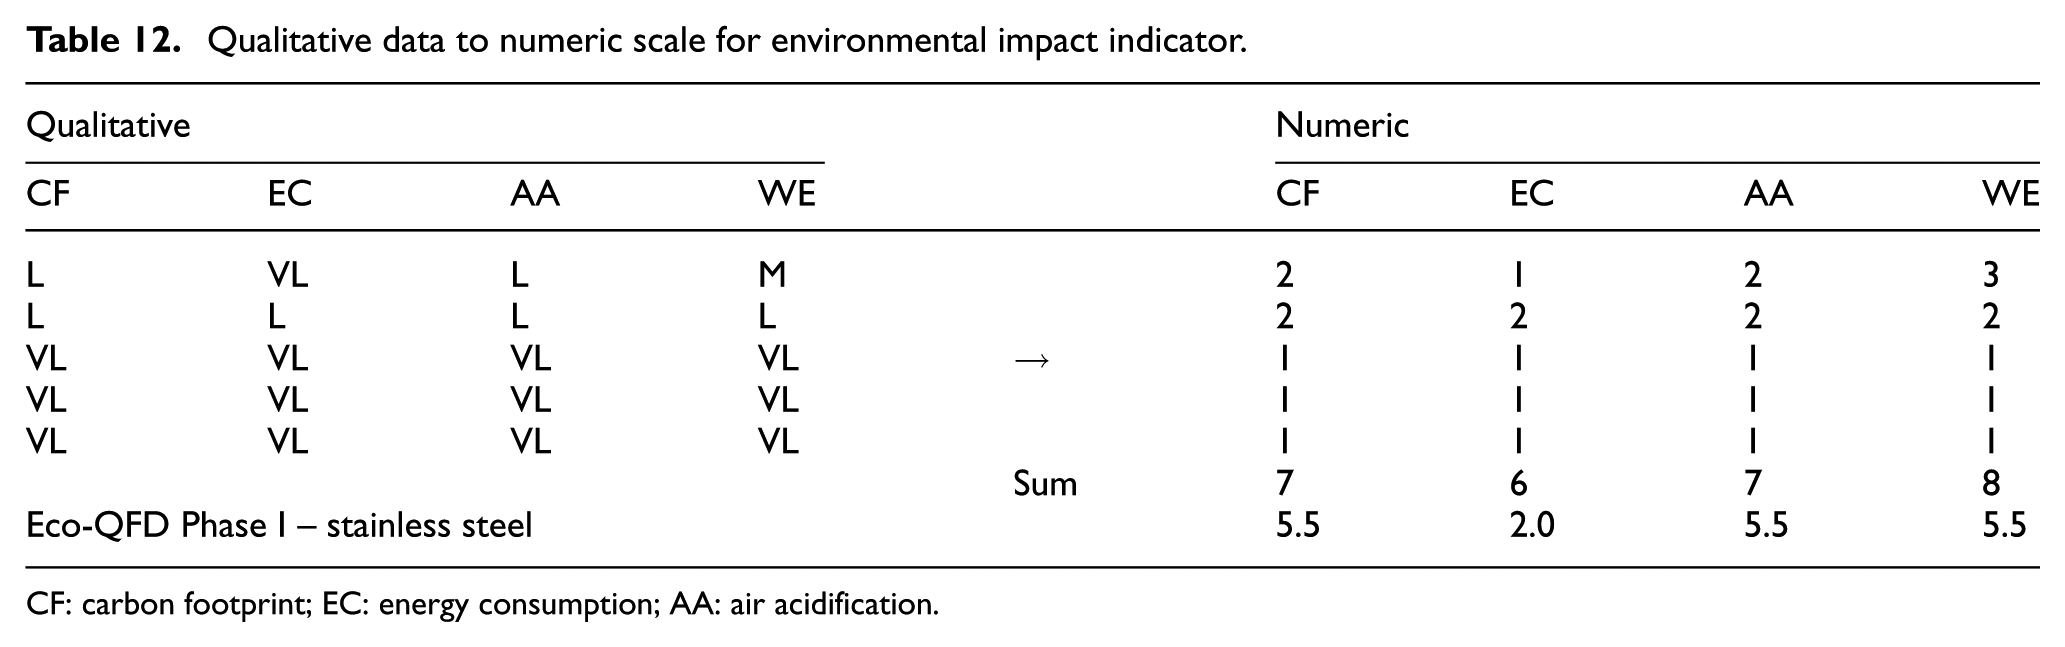
CF: carbon footprint; EC: energy consumption; AA: air acidification.
Product design indicator
For the product design indicator, Table 13 shows the integration process between Eco-QFD Phase II and the Eco-CBR LS data. The selected design features in the Eco-QFD are the dimensions of D1 (maximum opening of the jaws), D2 (working length for the shaft), and D3 (thickness of the main shaft). These features of Eco-QFD are integrated into the Eco-CBR assessment under the design dimension.
Integration of selected features between Eco-QFD Phase II and the Eco-CBR process, and the calculation for design indicator.
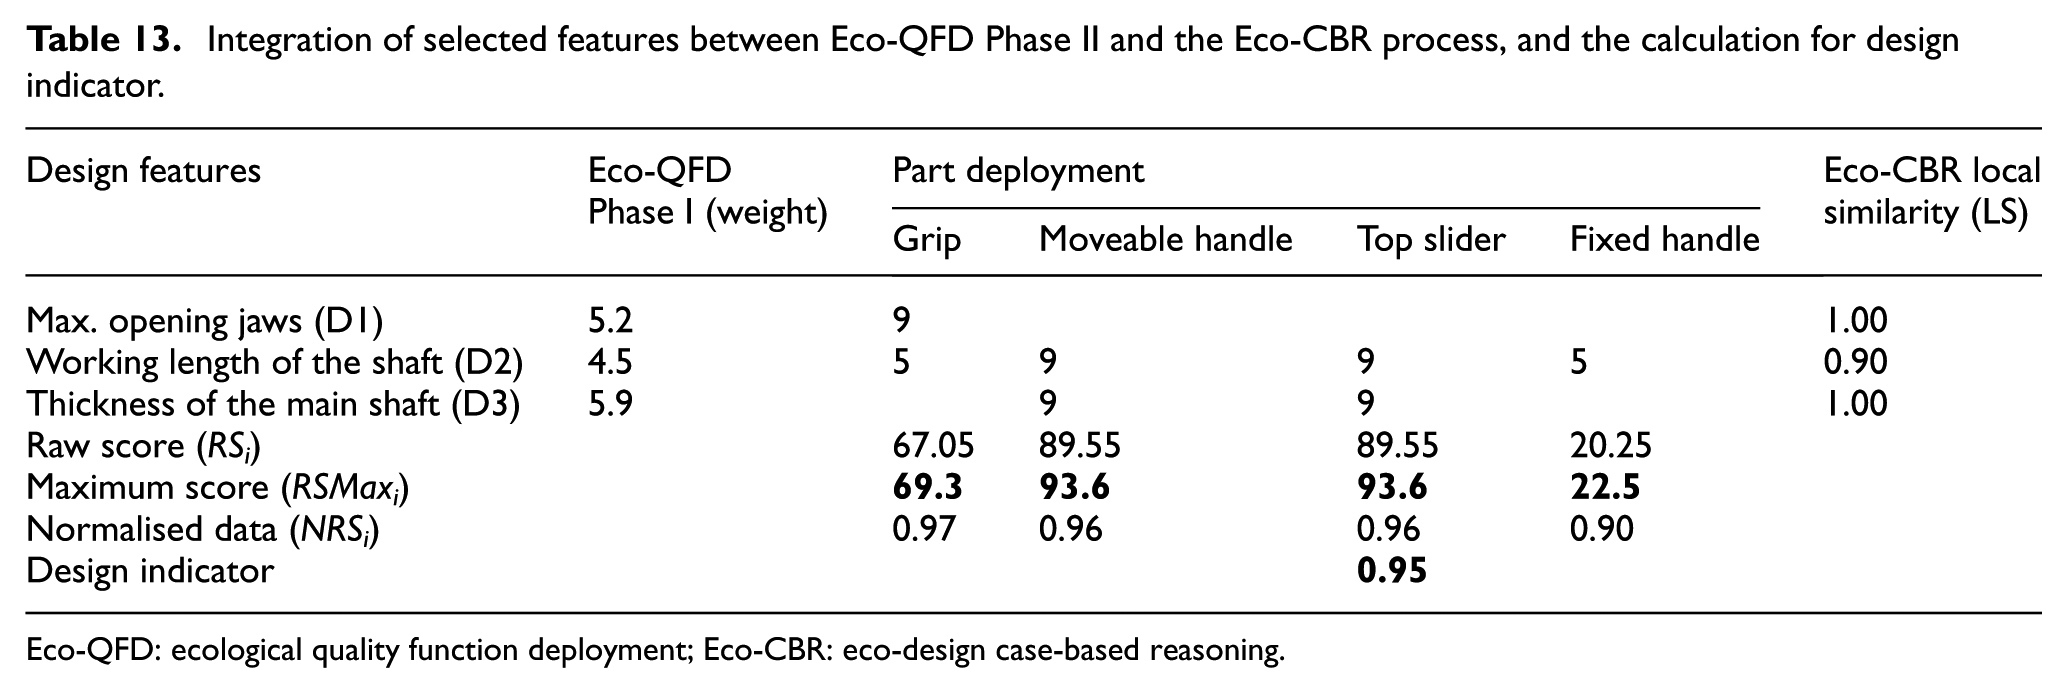
Eco-QFD: ecological quality function deployment; Eco-CBR: eco-design case-based reasoning.
In Table 13, the ‘Eco-CBR LS’ column represents the LS for the design features. The LS is considered to be ‘1’ for each design criterion, and it is used to find the maximum score for each part. This maximum score is then used as a reference to calculate the normalisation for the raw score. The weight for each design feature is taken from Eco-QFD Phase I. The numbers for relational strength between the design features and the part deployment were retrieved from Eco-QFD Phase II.
The calculation of the maximum score for each part is as follows

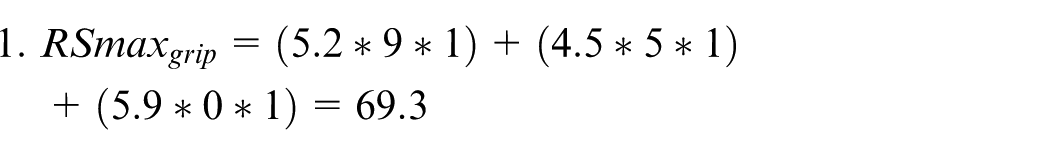
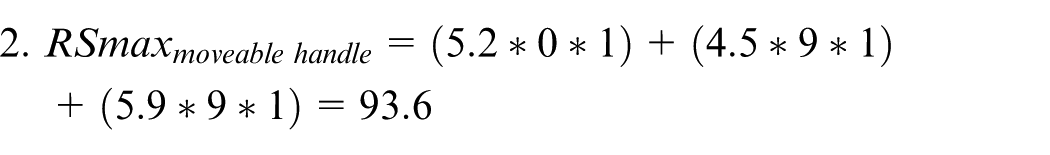
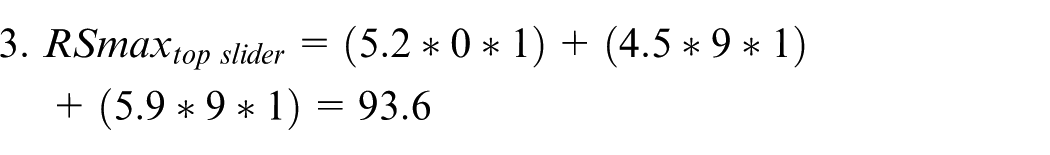
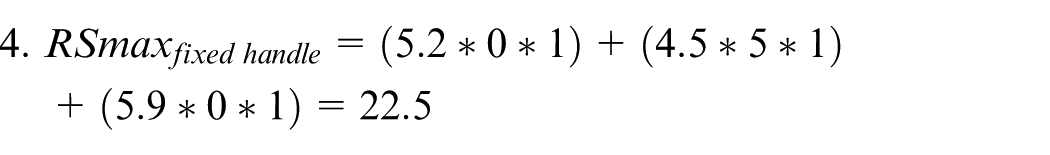
Table 13 illustrates the next process; the calculations of the raw score and weight normalisation for part deployment are based on equations (8) and (9), while the average score for the design indicator is calculated by equation (10). The example of the calculation for a part (grip) and design indicator is shown below
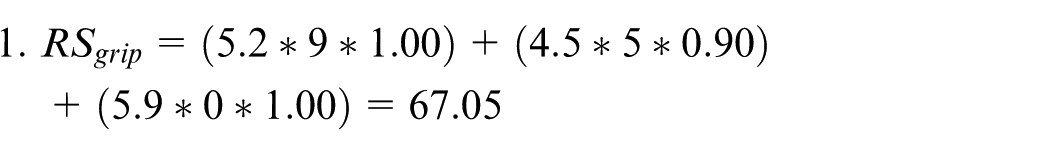

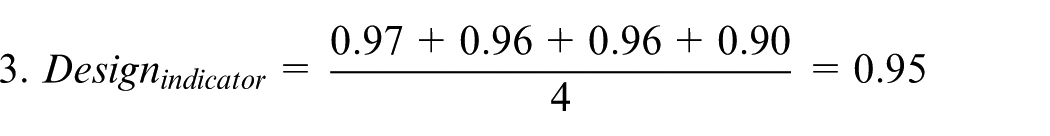
The results of the raw scores for the grip, moveable handle, top slider, and fixed handle are 67.05, 89.55, 89.55, and 20.25, respectively. Thereafter, these raw scores are normalised to new scores, resulting in the values of 0.97 (grip), 0.96 (moveable handle), 0.96 (top slider), and 0.90 (fixed handle). The average value of the normalised scores is 0.95. This indicator is then used as a reference in the Eco-CBR solution for product improvement. This result will help the designer to analyse the performance of the design integration with the evaluation made in the Eco-QFD.
For the customer requirement indicator, the final result is calculated using equation (11). Table 14 shows the process of assessing the relationship between the features of customer requirements in Eco-QFD Phase I and the input measurement of Eco-CBR. The Eco-CBR value is retrieved from the average value of the customer requirements, as shown in Table 11. The weight of each feature in Table 14 is retrieved from the Eco-QFD process in Phase I. The result shows that the customer requirement indicator resulted in 0.99, as shown in Table 11
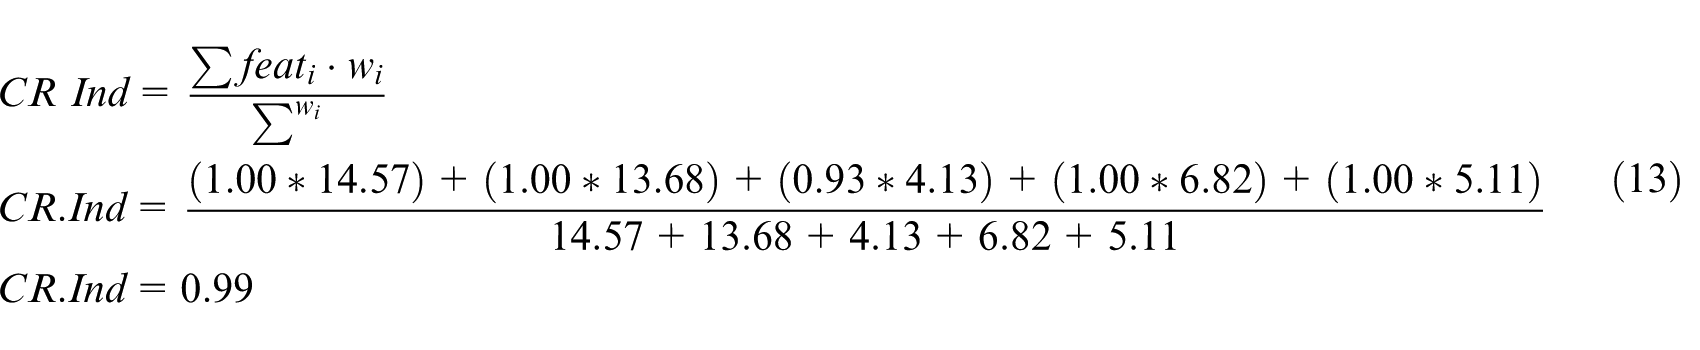
Eco-CBR customer solution value aligned with Eco-QFD Phase I.
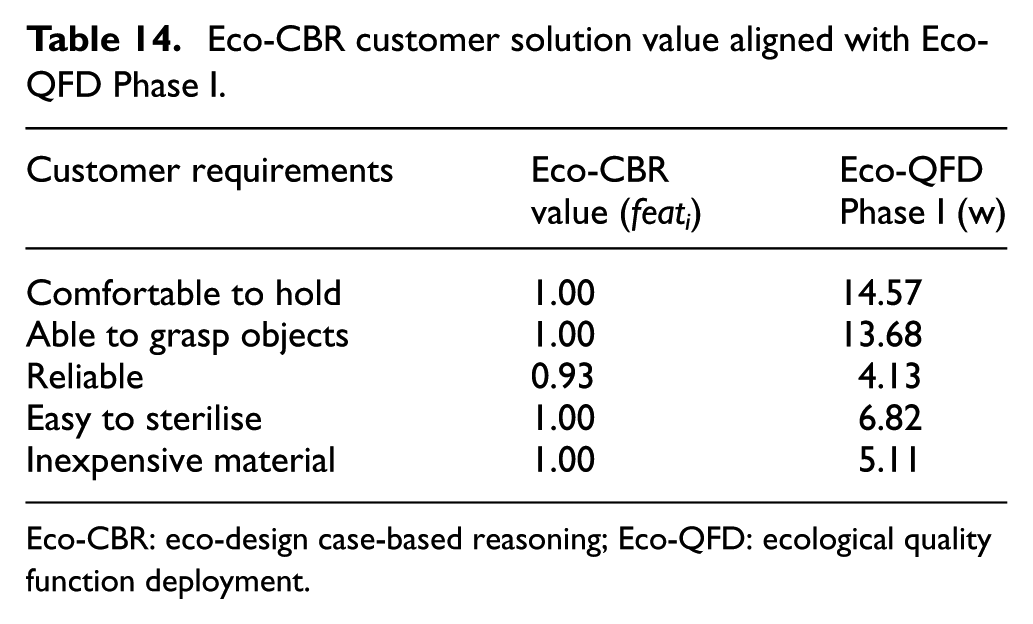
Eco-CBR: eco-design case-based reasoning; Eco-QFD: ecological quality function deployment.
The solution proposed for the new case indicates that the environmental impact has a performance valued at 0.9 with product design and customer requirements valued at 0.95 and 0.99, respectively. This solution is intended to be used to help industry decision-makers propose solutions for new product design features by reusing solutions from similar cases and past experiences.
Retain the new case into the Eco-CBR library
When a designer is satisfied with the solutions presented, the case will be retained, and the library is updated by storing the new case that has been discussed here. This process will enlarge the case-based library, and the new case can be accessed in future, allowing for the reuse of proven solutions. In this way, during future redesign of similar products, the designer will have a quantitative result for the application of each particular choice.
Discussion
The proposed Eco-CBR tool is developed to integrate Eco-QFD, LCA, and economic cost. The features of a particular problem are used here to configure a product solution that has lower environmental impacts, with a lower LCC. Table 15 shows the improvement of the new medical forceps by comparing it with the existing product.
Life-cycle assessment of medical forceps: new design versus existing design.
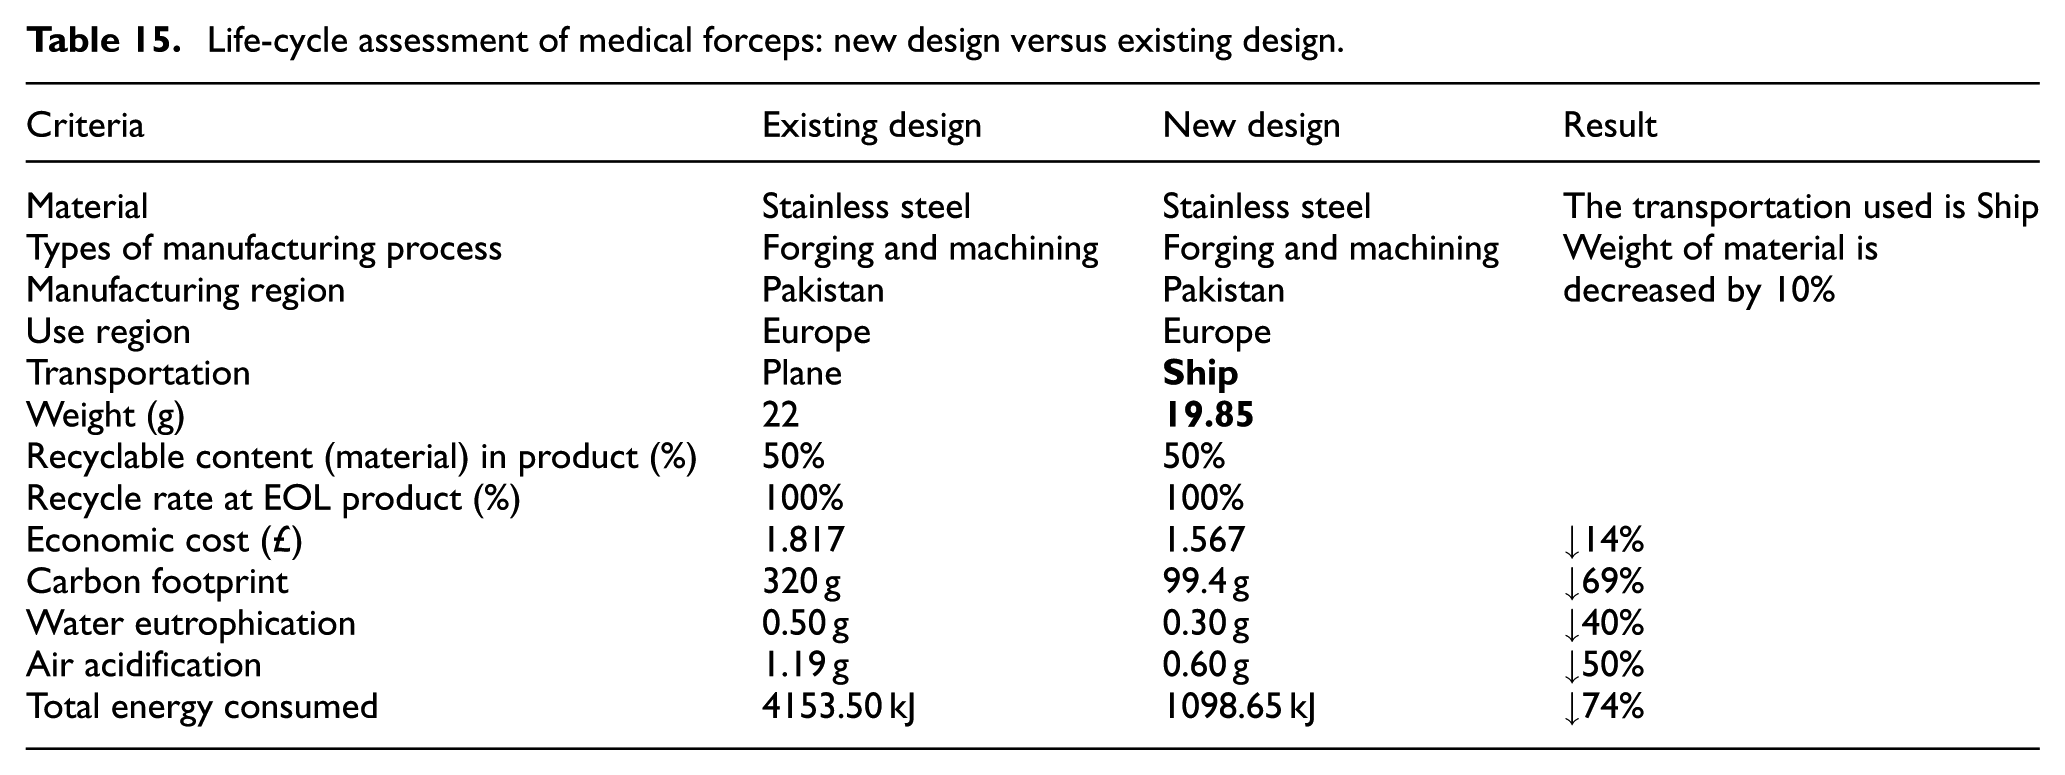
The solutions contained in the Eco-CBR library include information contributed from the LCA, Eco-QFD assessment, and economic cost. Table 11 shows a summary of the solutions (environmental impacts, product design, and customer requirements) that result from the information integration of the Eco-QFD and Eco-CBR methods. The solutions show that the new case study of the medical forceps has 10% weight reduction in the stainless steel material, and the new design dimensions provide lower environmental impact and economic cost to the product. This weight-saving has a ‘domino’ effect in terms of profit for the company, as there are not only material savings, but also increased quantities of the product can be transported for the same amount of fuel, thus increasing revenue.
Many improvements were observed from the combinations of the change of transportation mode from plane to ship, the reduction in material usage, the environmental footprints, and the lowered cost of the product. Some of the improvements include decreasing the carbon footprint (69%), water eutrophication (40%), air acidification (50%), and total energy consumed (74%). In addition, the economic cost has also decreased by 14% due to the above changes. The designer is able to make changes to the design features; he or she can examine the importance of the weighting factors and observe the consequences. This makes the Eco-CBR tool a user-friendly and intuitive aid to the eco-design process.
The remaining concern about this method is the usefulness of the Eco-CBR library for a new design problem. The intention is that such solutions will help designers to improve the quality of the designed product, while fulfilling customer requirements by enabling them to choose both optimal manufacturing and EOL strategies during the design stage.
Conclusion
The Eco-CBR tool has been designed to be easily and widely applicable to sustainable product development. The tool has been tested using an industrial case study relating to the design of medical forceps. The tool helps the designer to shorten the design process by exploring similar cases in the case-based library.
The current version of the Eco-CBR tool was tested with two relatively simple industrial products. Future plans include evaluating the tool with more complex products. The library of the CBR tool has been shown to be reliable in terms of the accuracy of the solution that is retrieved. The new Eco-CBR tool proposed here can also be integrated with existing systems to support a management, operational, logistics and supporting processes.
Footnotes
Acknowledgements
The authors would like to thank the Ministry of Government Malaysia for providing the research grants scheme. The authors gratefully thank the editors and anonymous referees for their recommendations and useful comments.
Declaration of conflicting interests
The author(s) declared no potential conflicts of interest with respect to the research, authorship, and/or publication of this article.
Funding
The author(s) disclosed receipt of the following financial support for the research, authorship, and/or publication of this article: The case study presented in this article was partially supported by the Advanced Sustainable Manufacturing Technologies (ASTUTE) project, a £26.8M consortium of Welsh universities supported by the Welsh European Funding Office (WEFO).