
Abstract
Sustainable development, one of the main challenges of our time, is a policy focused on the perfect balance between three fundamental pillars: environmental, economic and social sustainability. As regards the environmental protection, the Life Cycle Assessment (LCA) methodology allows to evaluate the sustainability profile of the overall Life-Cycle (LC) of products, processes and services, based on an inventory (in terms of materials/energy consumption and emissions/waste production) referred to all LC stages. The paper describes an application of LCA in the maritime transportation field, after a careful analysis of the state of the art. In particular, the case study consists in the environmental comparison of two alternative design solutions for the superstructure of a Azimut-Benetti yacht, designed by Corporate R&D department and manufactured in one of Benetti botyards. The competing construction options are a Glass Fiber reinforced Vinylester-isophthalic Resin (GFVR) and a Carbon Fiber reinforced Epoxy Resin (CFER) component, and they are assessed in terms of Global Warming Potential through the CML2001 Life Cyle Impact Assessment (LCIA) method. The study takes into account the entire LC of the superstructure component, divided into production (including raw materials, manufacturing and transportations), use (including both fuel consumption and exhaust air emissions) and End-of-Life (EoL). The Life Cycle Inventory (LCI) is mainly based on primary data (materials and energy consumption for manufacturing) directly provided by the construction company; missing data are retrieved from secondary sources (literature and LCI database provided by the GaBi6 environmental software). Results show that, despite the higher impact in production stage, the innovative solution allows achieving a significant quota of GWP over the entire LC (more than 16%), which is mainly associated with decreased amount of fuel needed and lowered CO2 exhaust emissions during operation. The sensitivity analysis reveals that the environmental advantage provided by the CFER design becomes bigger as both component life-time and yacht consumption increase.
Keywords
Introduction
“Meeting the needs of the present without compromising the ability of future generations” is not only the slogan of our times but also the global goal of the United Nations 2030 Agenda. 1 As a matter of fact, the model of sustainable development imposes criteria of greater responsibility in terms of environmental, economic, and social sustainability, to avoid that the entire terrestrial ecosystem collapses within the next few years.2,3 From the above, it directly derives that a crucial point is supporting environmental education, awareness and understanding of all actors involved in the production, use and disposal of industrial products (i.e. designers, manufacturers, end-users, and end-of-life operators).4,5
In this context, the transportation industry (considering all transport modes, from surface to air and sea transport) is one of the main contributors to global anthropogenic GreenHouse Gas (GHG) emissions, representing about 30% of total.6,7 More specifically, a study conducted by the International Maritime Organization (IMO) 8 highlights the notable growth in the environmental effects of sea-borne transport, which have increased about three times in the last 30 years. The study also reveals that emissions from ships currently represent a notable share of overall worldwide transport-related, these being 60%, 40%, and 15% respectively for SOx, NOx, and CO2.
Given this background, in recent decades the Life Cycle Assessment (LCA) methodology (ISO 14040, 9 ISO 14044 10 ) has been widely applied in the maritime transport field to pursue a series of different objectives, such as developing environmental strategies,11–13 evaluating alternative powertrain systems,14,15 and assessing innovative design solutions in replacement of conventional ones.16,17 Interesting examples of sector studies and large-scale LCA applications in the shipping industry are provided by Chatzinikolaou and Ventikos 18 and Popa et al. 19 The first one is developed by the Laboratory for Maritime Transport of the National Technical University of Athens, 20 which already in the early 2000s incorporated LCA in its research agenda to conduct environmental assessment of various maritime transport scenarios. The focus of the study is assessing the Life Cycle Inventory (LCI) of a Panama transoceanic ship (7300 t) according to a cradle-to-cradle approach and assuming a 25-year life-time of the craft. Results show that for the considered case study the CO2 is by far the main pollutant emitted to air. Popa et al. 19 conceives a theoretical model, supported by LCA system, functional to support real case studies of impact assessment in the maritime industry. More specifically, the paper proposes an innovative LCA approach based on three-dimensional modeling software, specially developed for evaluating the sustainability profile of container ships. The paper presents the application of the refined method to the entire LC (materials extraction, construction, use, transportation, and end-of-life) of Panamax, 21 a vessel of 65,400 t powered by an 80,000 kW diesel engine.
Other papers use LCA to investigate energy and environmental consequences caused by the introduction of innovative boat powertrain systems/fuels in substitution of conventional ones.22,23 In this regard, it is worth to cite Hwang et al., 24 a comparative study that assesses three different alternative power sources for a 12,000 gross tonnage coastal ferry operating in the Republic of Korea. The considered power sources are marine gas oil, natural gas, and hydrogen, for which the fuel LC is analyzed on the basis of Well-to-Tank (supply chain) and Tank-to-Wake (emissions during operation) phases. The outcomes of the paper reveal that hydrogen-fueled powertrain is the only viable solution to meet the 2050 GHG regulation, 25 mainly due to the absence of emissions in the Tank-to-Wake step. Another interesting work is Hawkins et al., 26 a LCA which demonstrates the environmental potential of shipment powertrains powered by bio-fuels. The article takes into account nine alternative scenarios with nine different low-sulfur fuels, that are evaluated by means of the GREET software. 27 The study includes all processes associated with feedstock recovery, feedstock transportation, fuel production, fuel transportation and fuel combustion, assuming as functional unit “1 MJ of marine fuel produced and utilized.” Results show that the use of biomass-derived biofuel provides the greatest GHG abatement, about 93% with respect to conventional fuels. The last noteworthy paper in this field is Perčić et al., 28 which assesses the beneficial effects of replacing internal combustion engine powertrains with electric powertrains. The analysis envisages the application of LCA to three passenger ships for routes in the Croatian area, including Well-to-Pump and Pump-to-Wake phases for the conventional engine scenarios and battery production for the electric vessel scenarios. The findings of the study indicate that the most environmentally friendly option to replace diesel-powered ships is electrification with a Li-ion battery, resulting in 46% lower CO2 emissions and 98% lower NOX emissions.
The studies below are interesting LCAs functional to wide-range analysis and strategy development. That said, literature shows that the main application of LCA within the maritime sector is the environmental assessment of specific case studies (both entire ships and single components), with a wide a range of final targets: comparing alternative design options from a sustainability point of view, taking decisions during the design process, assessing benefits of new materials/manufacturing processes with respect to traditional solutions. The first such application dates back to mid-2000s, when Shama 29 gives a rough overview on the main environmental performances of ships. This is one of the first LCA studies to take into account all components of the boat by analyzing the entire LC through a holistic approach (considered LC steps: materials supply, manufacturing, use, maintenance, and EoL). Results highlight that the highest energy consumption and environmental impacts stem from ship operation, thus leading authors to recommend a series of design modifications for improving energy efficiency, the main ones being ship routing and propulsion power for the required speed. The most recent studies in this field are Quang et al. 30 and Zhang et al. 31 The first one uses LCA to estimate the impact of a cargo ship using the Global Warming Potential (GWP) indicator assessed through the CML 2001 method. The chosen case study is a 73,000 t gross tonnage ship made in Korea, with system boundaries defined according to a cradle-to-grave perspective and inventory established by means of secondary data collection (mainly from GaBi database, scientific literature and technical reports). The main conclusion of the authors is that the big amount of CO2 emitted is the main responsible (more than 96% on a total LC basis) for GWP, much greater than N2O, SF6, and CH4 emissions. Zhang et al. 31 focuses on small recreational boats with the aim to identify the main environmental hotspots and incorporate such information into a pre-defined circular economy model. The study allows the identification of key LC hot spots by implementing mathematical predictive models for the selected impact categories (Climate Change, ADP, Ecotoxicity).
A specific strand of research that can be identified when considering comparative LCA in the sea transport field is energy efficiency and lightweighting, of which literature provides three main reference papers. The first one is Tuan Dong and Cai, 32 that investigates the environmental benefits obtainable by reducing fuel consumption and increasing Light Displacement Tonnage (LDT) in container ship applications. The chosen case study is the Panama Bulk carrier, assessed assuming 25 scenarios that differ in both fuel consumption level and LDT configuration. The inventory and impacts are quantified on the basis of the transport of 1 t of bulk cargo over 1 km by sea and the inventory is made using secondary data. Results denote that fuel consumption reduction is an effective strategy to abate damages on the environment for the vast majority of considered impact categories. Another sustainability study on the energy efficiency of ships is Cucinotta et al. 33 The paper presents a comparative LCA between two different techniques for the manufacturing of yachts in fiberglass, the traditional hand lay-up technique and the vacuum infusion. The research addresses the LC stages from cradle-to-grave, considering a 25-year time horizon and establishing the inventory through primary data, directly provided by the boat manufacturer. In line with expectations, the adoption of vacuum infusion involves 9% reduction in component mass, which is accompanied by an abatement of about 15% for all the selected impact categories. The other lightweight-focused LCA is Burman et al. 34 , a comparative study for a high-speed marine vessel. The work takes into account five lightweight materials for weight-optimization of high-speed craft component. The inventory is mainly based on secondary data modeled through the software SimaPro, while the impacts are expressed by means of abiotic depletion, global warming and acidification potential indicators. In line with researches cited above, the article stresses that the most impactful LC phase is operation, thus leading authors to conclude that lightweight design is the main effective strategy for impact reduction, since it allows to take advantage from both primary mass reduction (reduced weight of components) and secondary mass reduction (powertrain resizing).
The state-of-the-art section concludes with literature studies on sustainability assessment integrating both environmental and cost pillars under a circular economy point of view. 35 In this context, Gualeni and Maggioncalda 36 develops a method to carry out both sustainability and economic LC analysis for comparing different design solutions for a boat prototype. The refined approach consists in a blended formulation between LCA (NOX, PM, CO2), and Life Cycle Costing (LCC) based on Key Performance Indicators (KPIs), specifically designed for the ship application field. The added value of the methodology is the possibility to evaluate trade-off analysis in relation with uncertainty of variables and general boundary conditions of the problem, such as market oil or fuel prices. Favi et al. 37 develops an integrated LCA/LCC framework for application to shipbuilding of luxury motor-yachts. The method includes a reliable tool for inventory data collection as well as a set of integrated environmental/cost indicators to be used as metrics for long-term decision-making strategies.
The overview on LCA literature within the maritime transportation field proves that the sea transport is a significant contributor to global environmental impacts, thus representing a strategic area for future research and innovation. In particular, only a very small number of LCA amalyses of ship components are available that have yet to be critically compared. In addition, the inventory modeling of existing case studies is mostly based on secondary sources (commercial LCI datasets, literature, scientific, and industrial reports) due to lack of primary data.
This paper deals with the LCA of a superstructure of a yacht manufactured by the Azimut-Benetti company. 38 The study carries out the comparison between two competing design options for the component, which are evaluated based on the Global Warming Potential (GWP) LCIA indicator. Such solutions differ in construction material and corresponding manufacturing processes: Glass Fiber reinforced Vinylester-isophthalic Resin, GFVR (provided as reference design solution) and Carbon Fiber reinforced Epoxy Resin, CFER (provided as innovative design solution). The final objectives of the study are:
- establishing a sustainability assessment which can be used in the future as baseline for comparison with similar maritime components;
- identifying the most detrimental hotspots within the system LC;
- representing a valid basis for determining potential product improvements, supporting recommendations for future design strategies, verifying the compliance with possible regulations in next years on environmental effects of naval vessels;
- avoiding the shift of problems between LC stages when passing from the reference to the innovative design option.
The work is structured as follows: materials and method (including goal and scope definition and LCI inventory, with a description of design solutions, manufacturing technologies, data collection and inventory modeling), results and discussion (including critical discussion of LCIA results and sensitivity analysis) and conclusions.
Materials and method
The LCA is performed according to ISO 14040 9 and14044 10 standards.
Goal and scope definition
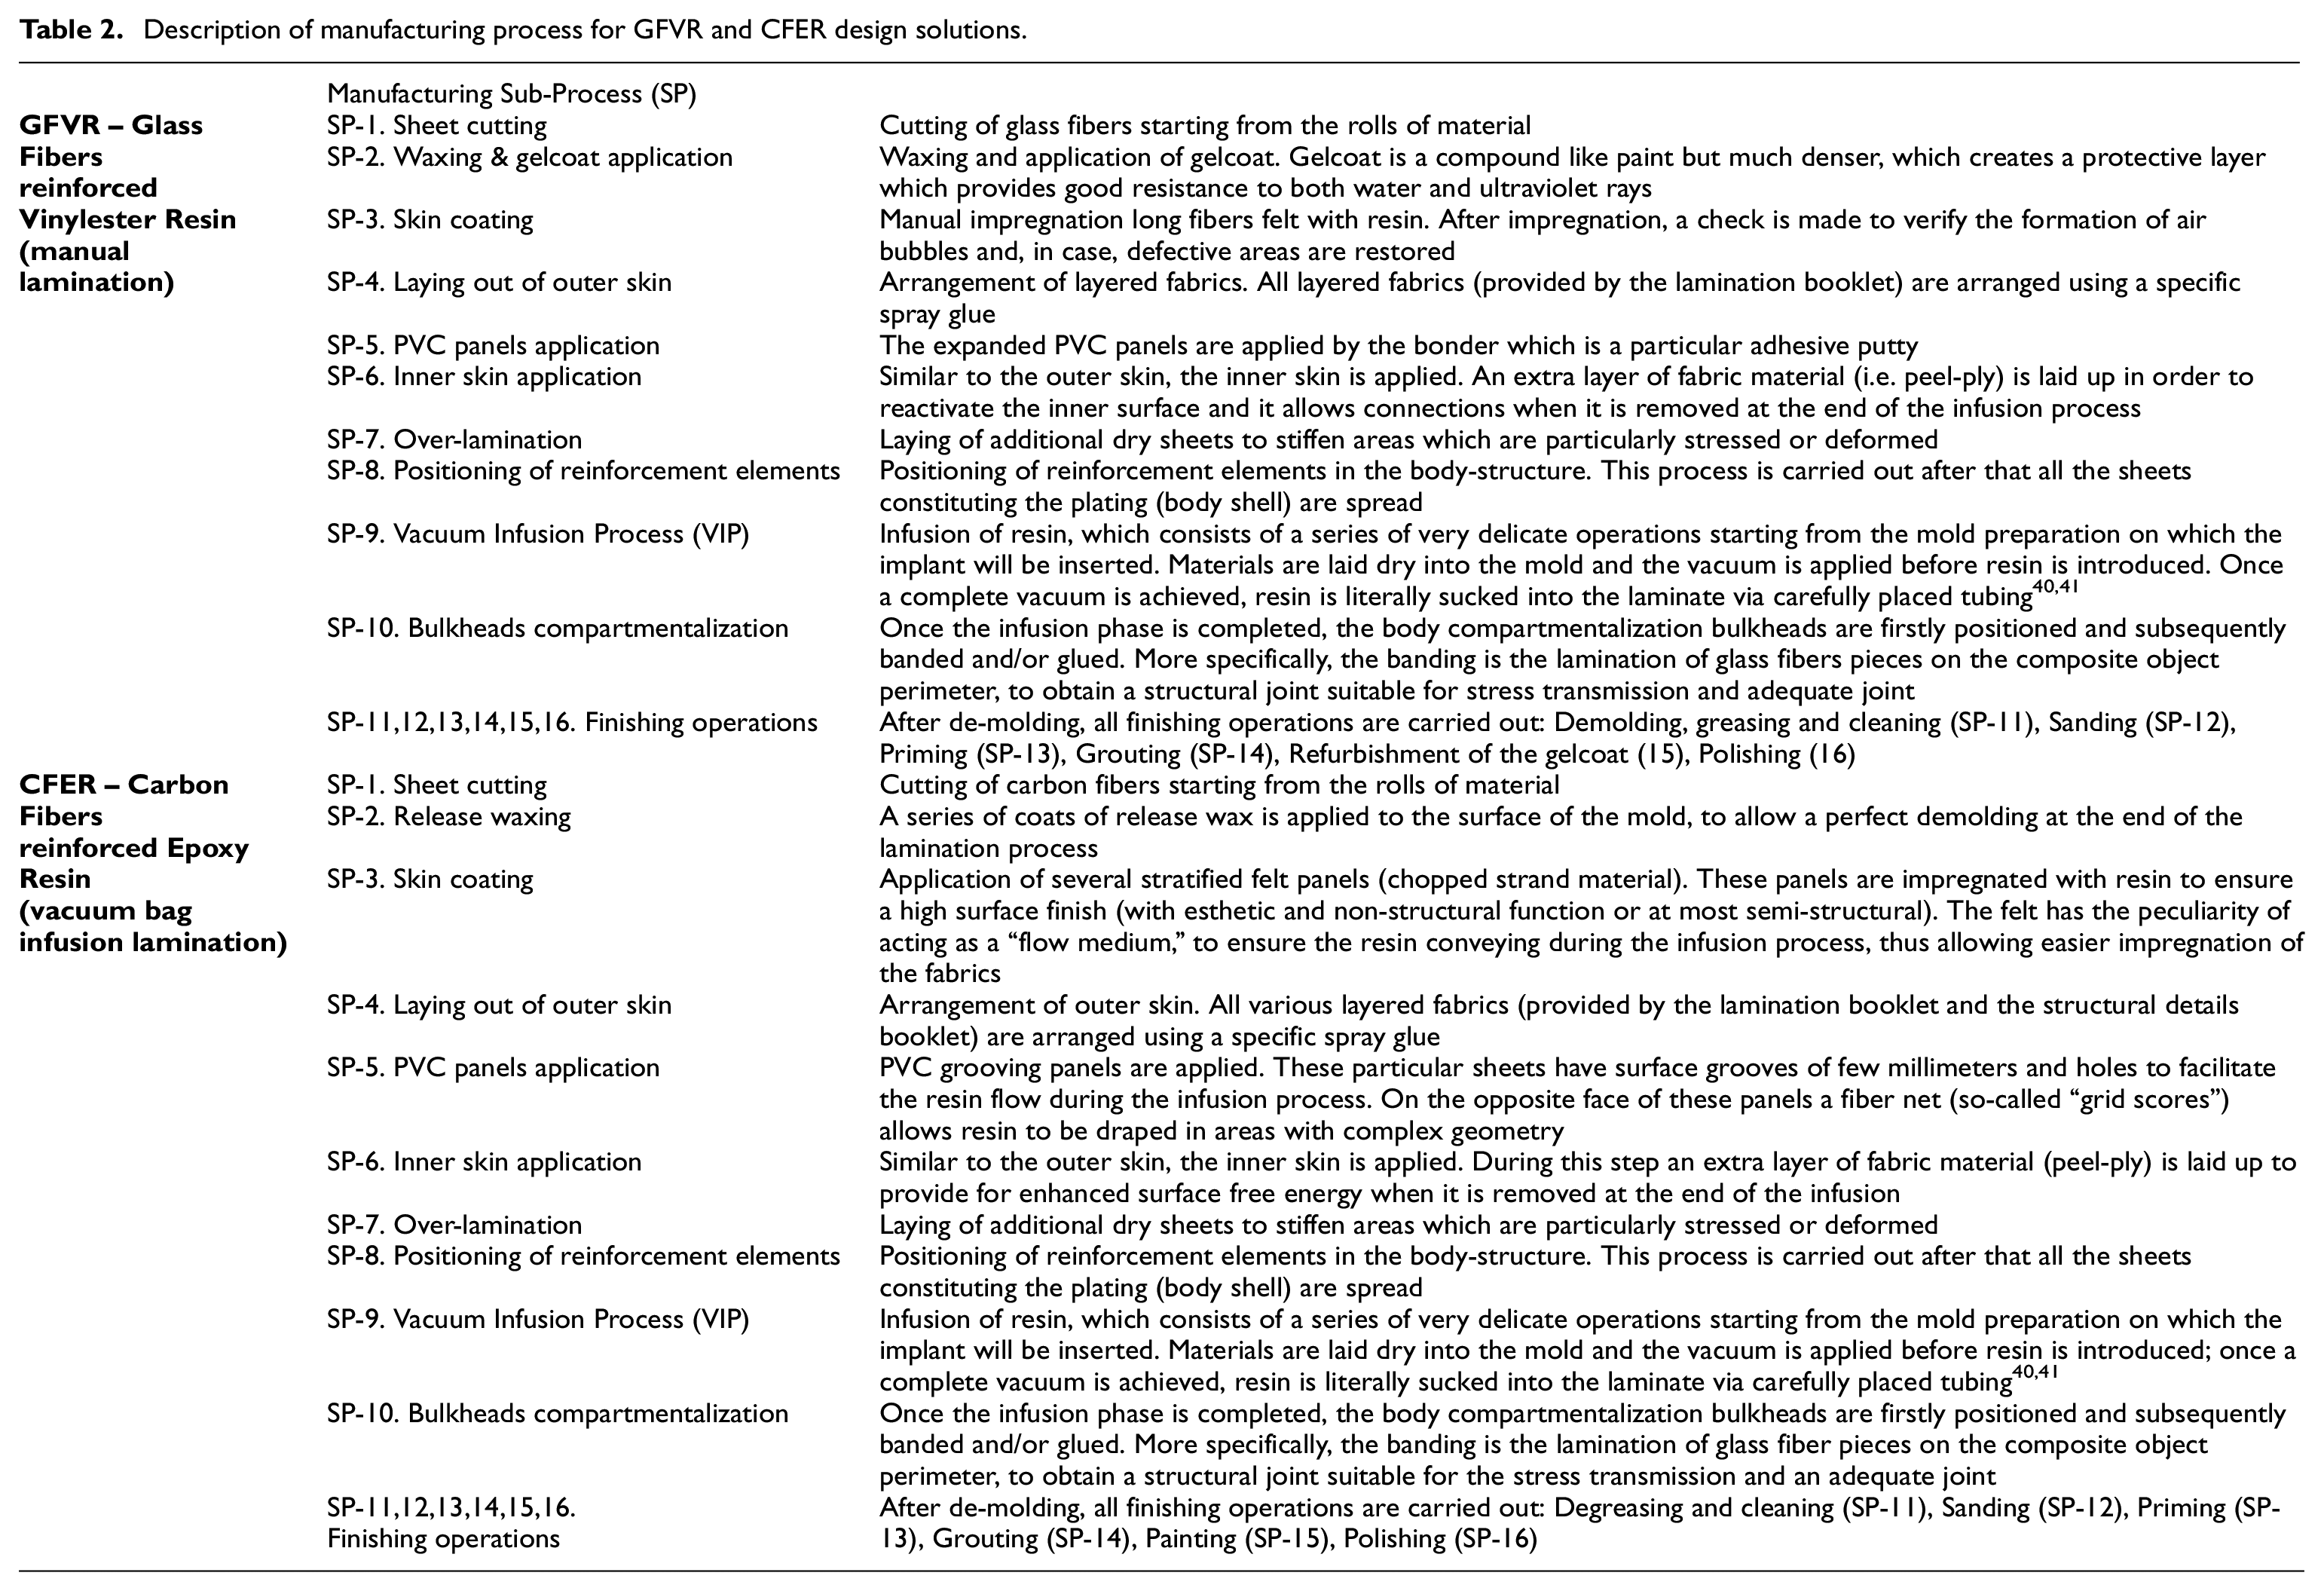
The study compares from an environmental point of view two design solutions for the superstructure component of the Benetti Delfino 95′, a Azimut-Benetti yacht designed by Corporate R&D department and manufactured in one of Benetti botyards. Such design alternatives differ in terms of construction material and corresponding manufacturing process: GFVR as the reference solution (made of fiberglass and polyester resin with manual lamination technique and final gelcoating process) and CFER as the innovative solution (made of carbon fiber and epoxy resin with infusion lamination technique and surface finishing by painting cycle).
The functional unit (FU) is defined as fulfilling the structural function of the superstructure for the Benetti Delfino 95′ Azimut-Benetti yacht (displacement at full load equal to 145 t) for the entire duration of the use phase, assumed equal to25,000 operating hours during a 25-years life-time. The two design solutions are assumed fully equivalent in terms of functional, operational and performance requirements.
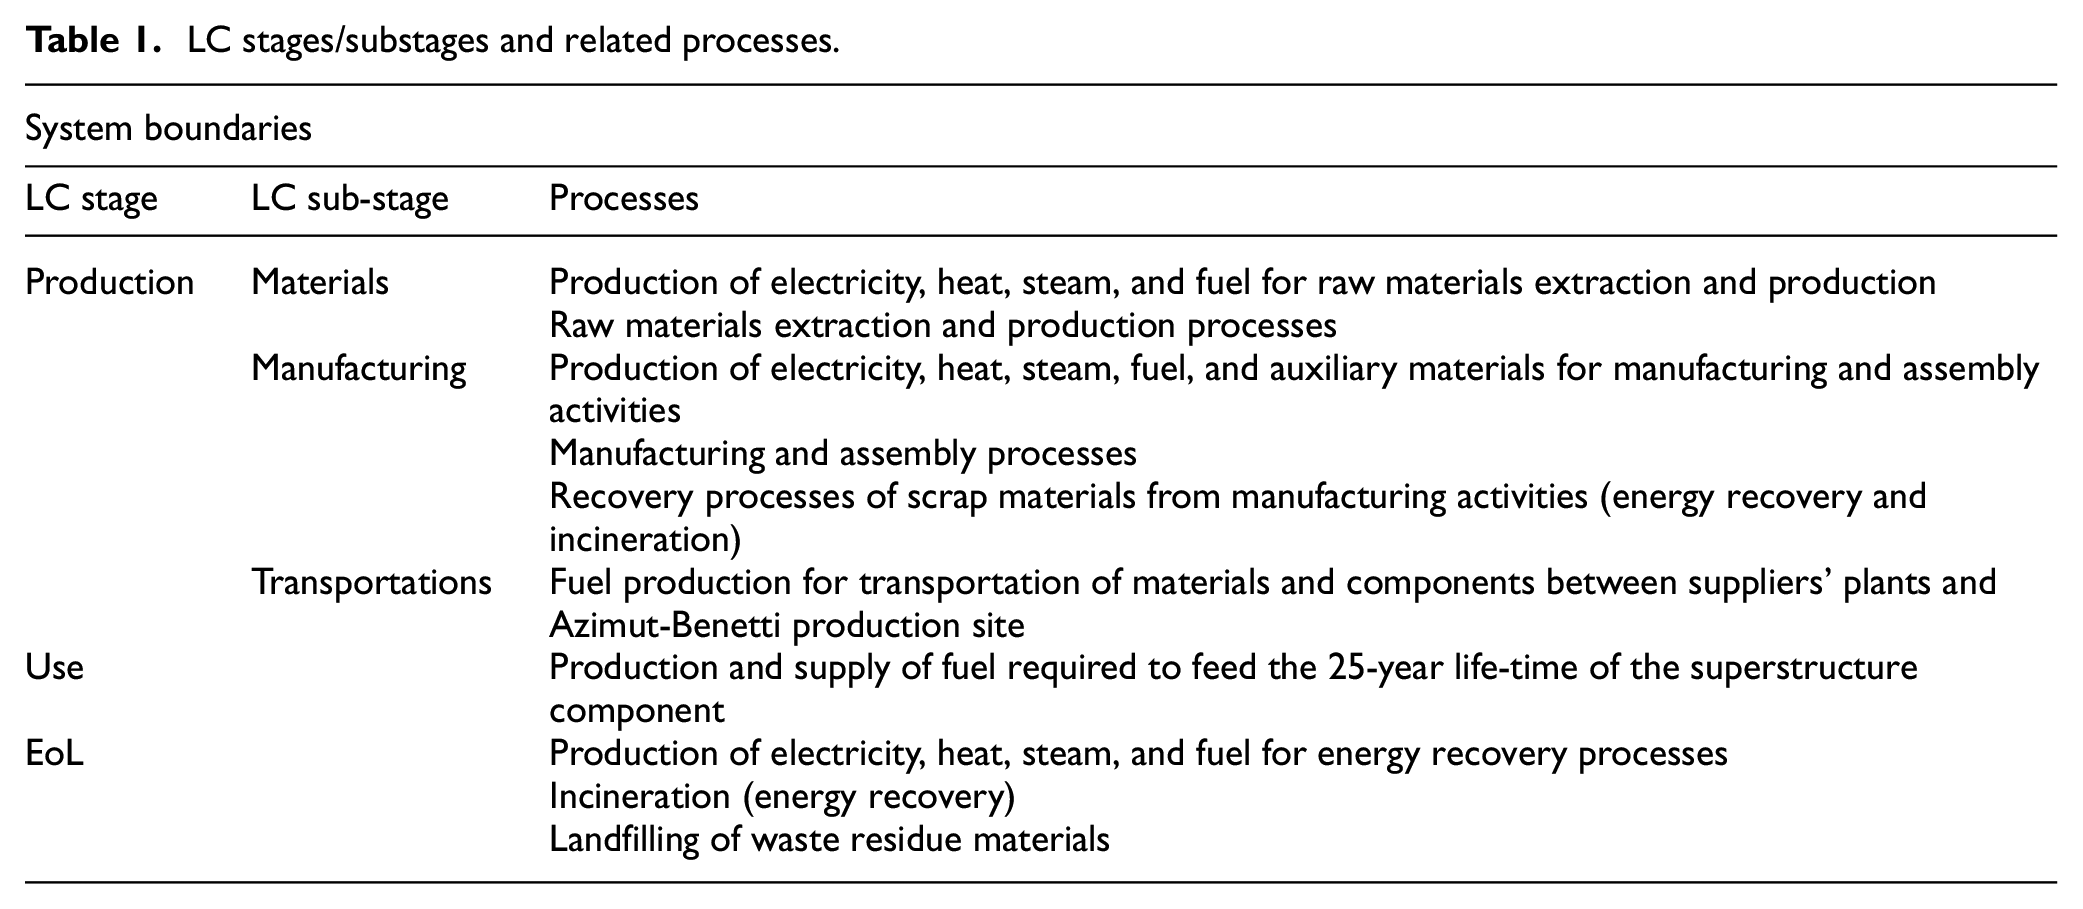
As regards system boundaries, the study takes into account the entire component LC, divided into the following stages and sub-stages:
- Production: including raw materials extraction and production of semi-finished products (Materials sub-stage), manufacturing of the finished component (Manufacturing sub-stage), transportations during production (Transportations sub-stage);
- Use: including the production of the fuel whose consumption is associated with the superstructure operation, as well as the yacht air emissions attributable to component operation;
- End-of-Life: disposal and recovery processes applied to the EoL yacht superstructure.
Table 1 illustrates the system boundaries considering the processes for each LC phase.
LC stages/substages and related processes.
The environmental impact is quantified in terms of the GWP LCIA indicator and the chosen method for the impact assessment is the CML 2001. 39
The main technical features of the Benetti Delfino 95′ yacht and the material composition of the superstructure component are reported in Figure 1; Table 2 describes the two manufacturing methods and the corresponding sub-processes.
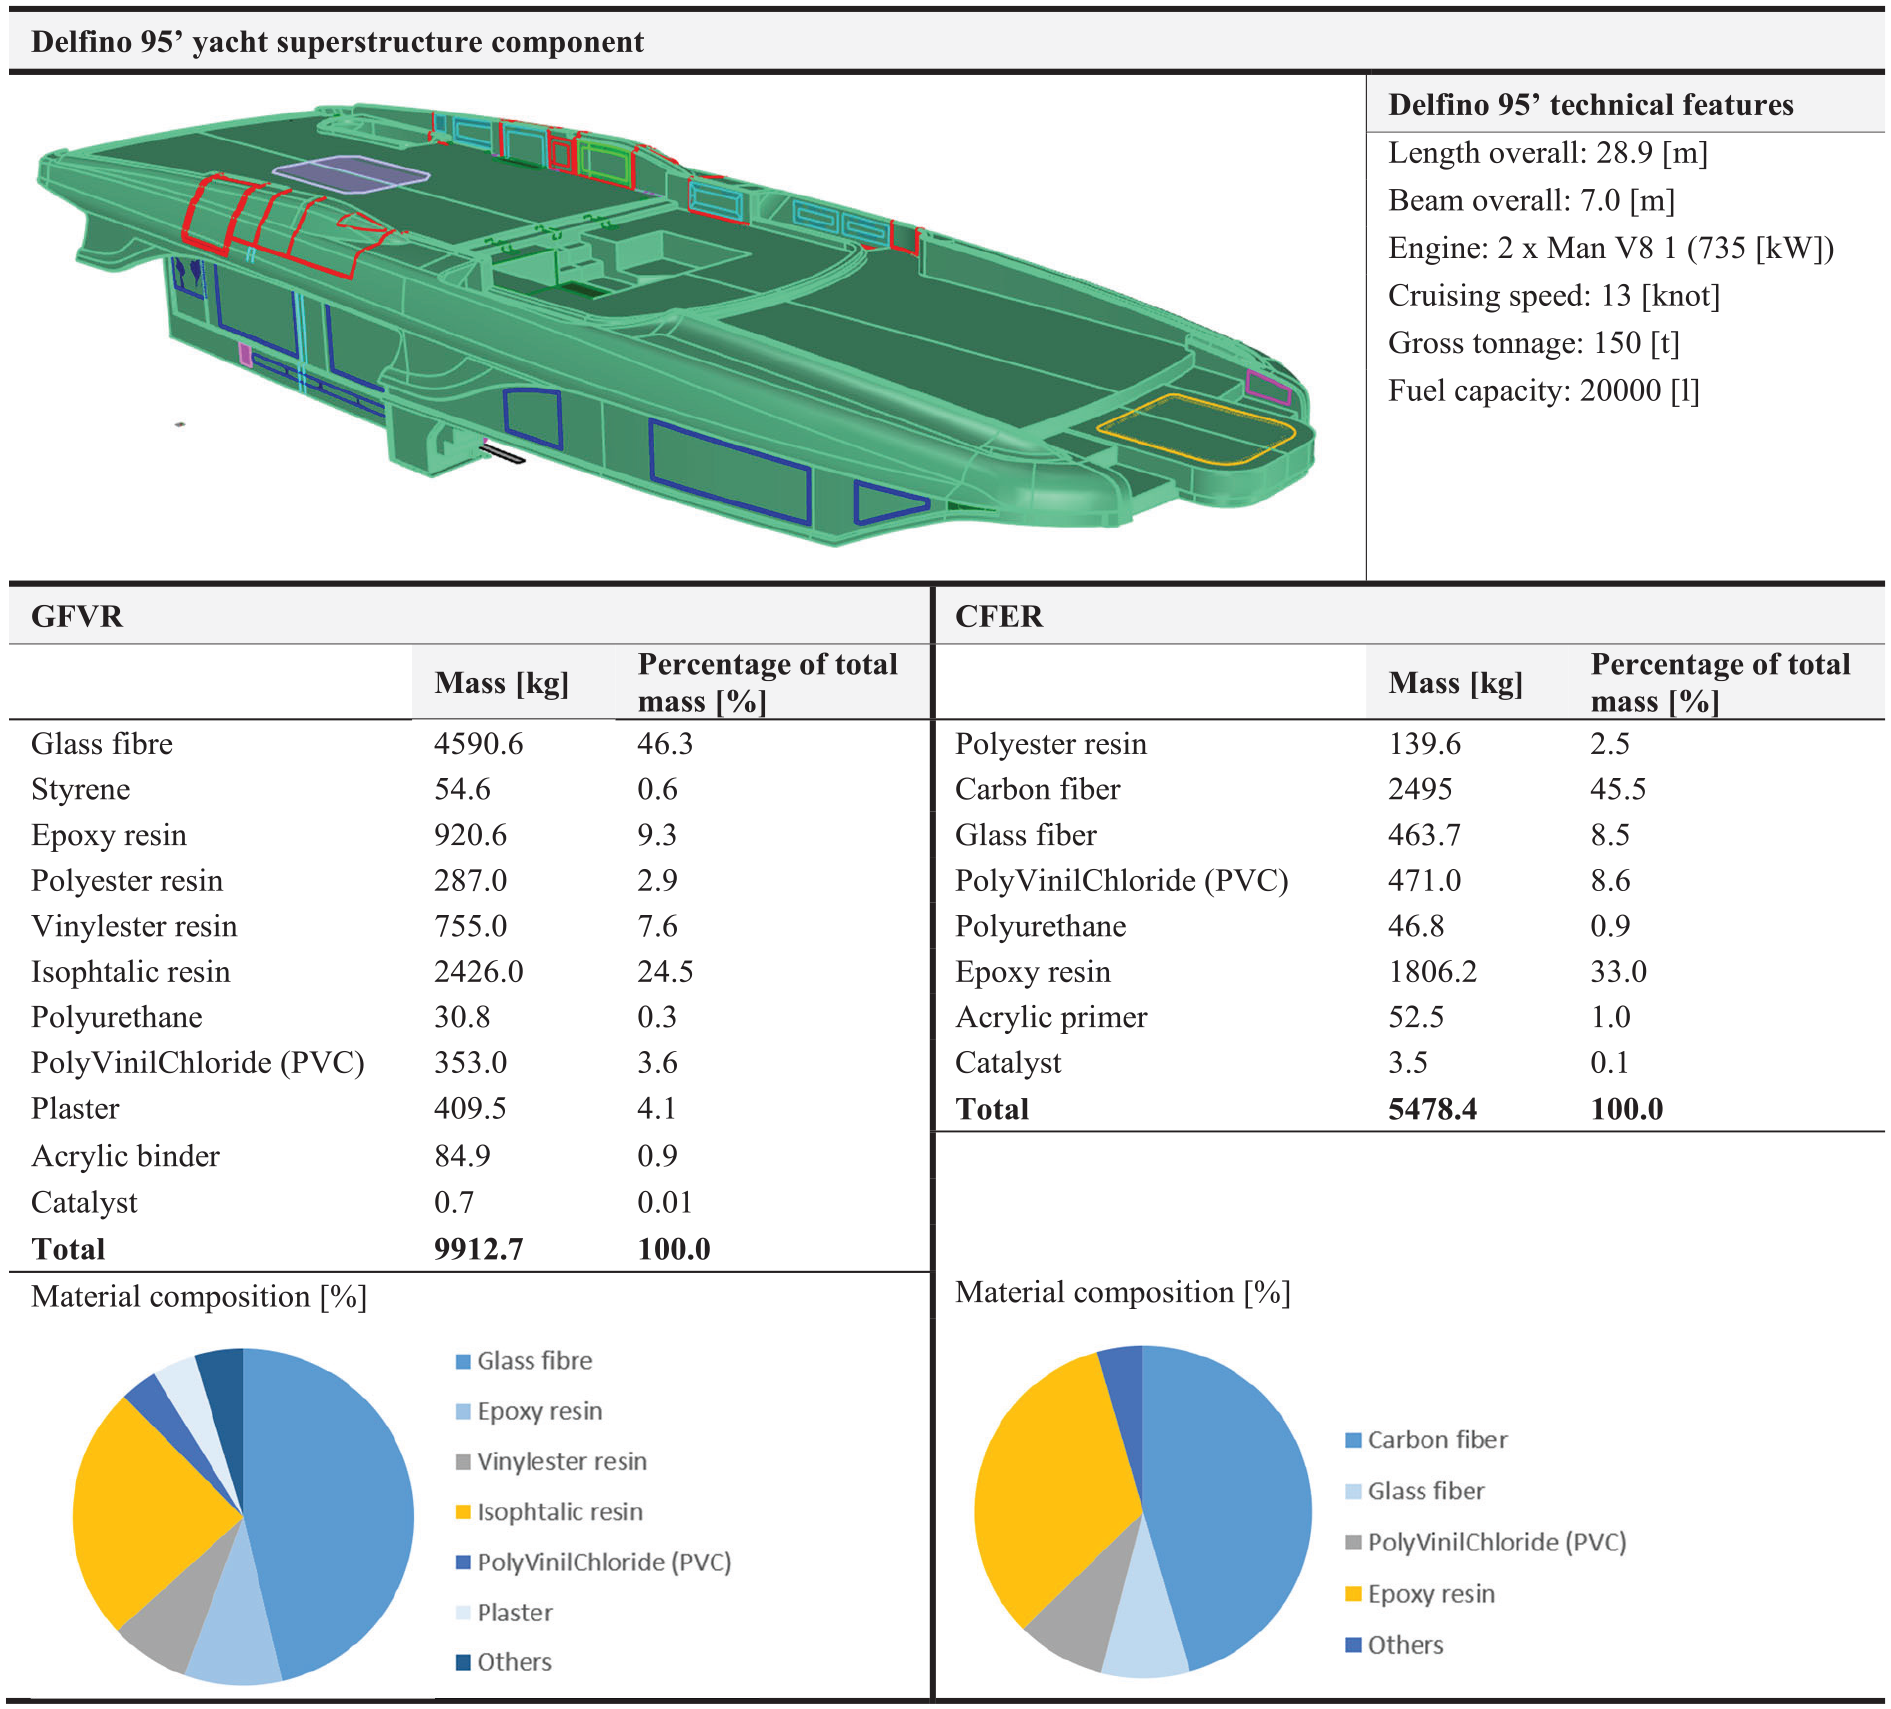
Main technical features of the Benetti Delfino 95′ yacht and material composition of the superstructure component (GFVR and CFER design). 38
Description of manufacturing process for GFVR and CFER design solutions.
Life Cycle Inventory (LCI)
The inventory consists in the collection and modeling of necessary data to analyze the environmental profile of the considered system. Such data are all natural flows which are exchanged by the system with the ecosphere during the entire component LC: energy and raw materials, emissions to air, water and soil, as well as production of solid wastes due to the superstructure component are quantified with respect to the chosen functional unit. The LC inventory is mainly based on primary data coming from a detailed information gathering; whenever primary data are lacking (or affected by a too high margin of uncertainty) secondary data retrieved from the GaBi6 Sphera database42,43 are used. Below data collection and inventory modeling is described for each LC stage.
Production – Materials
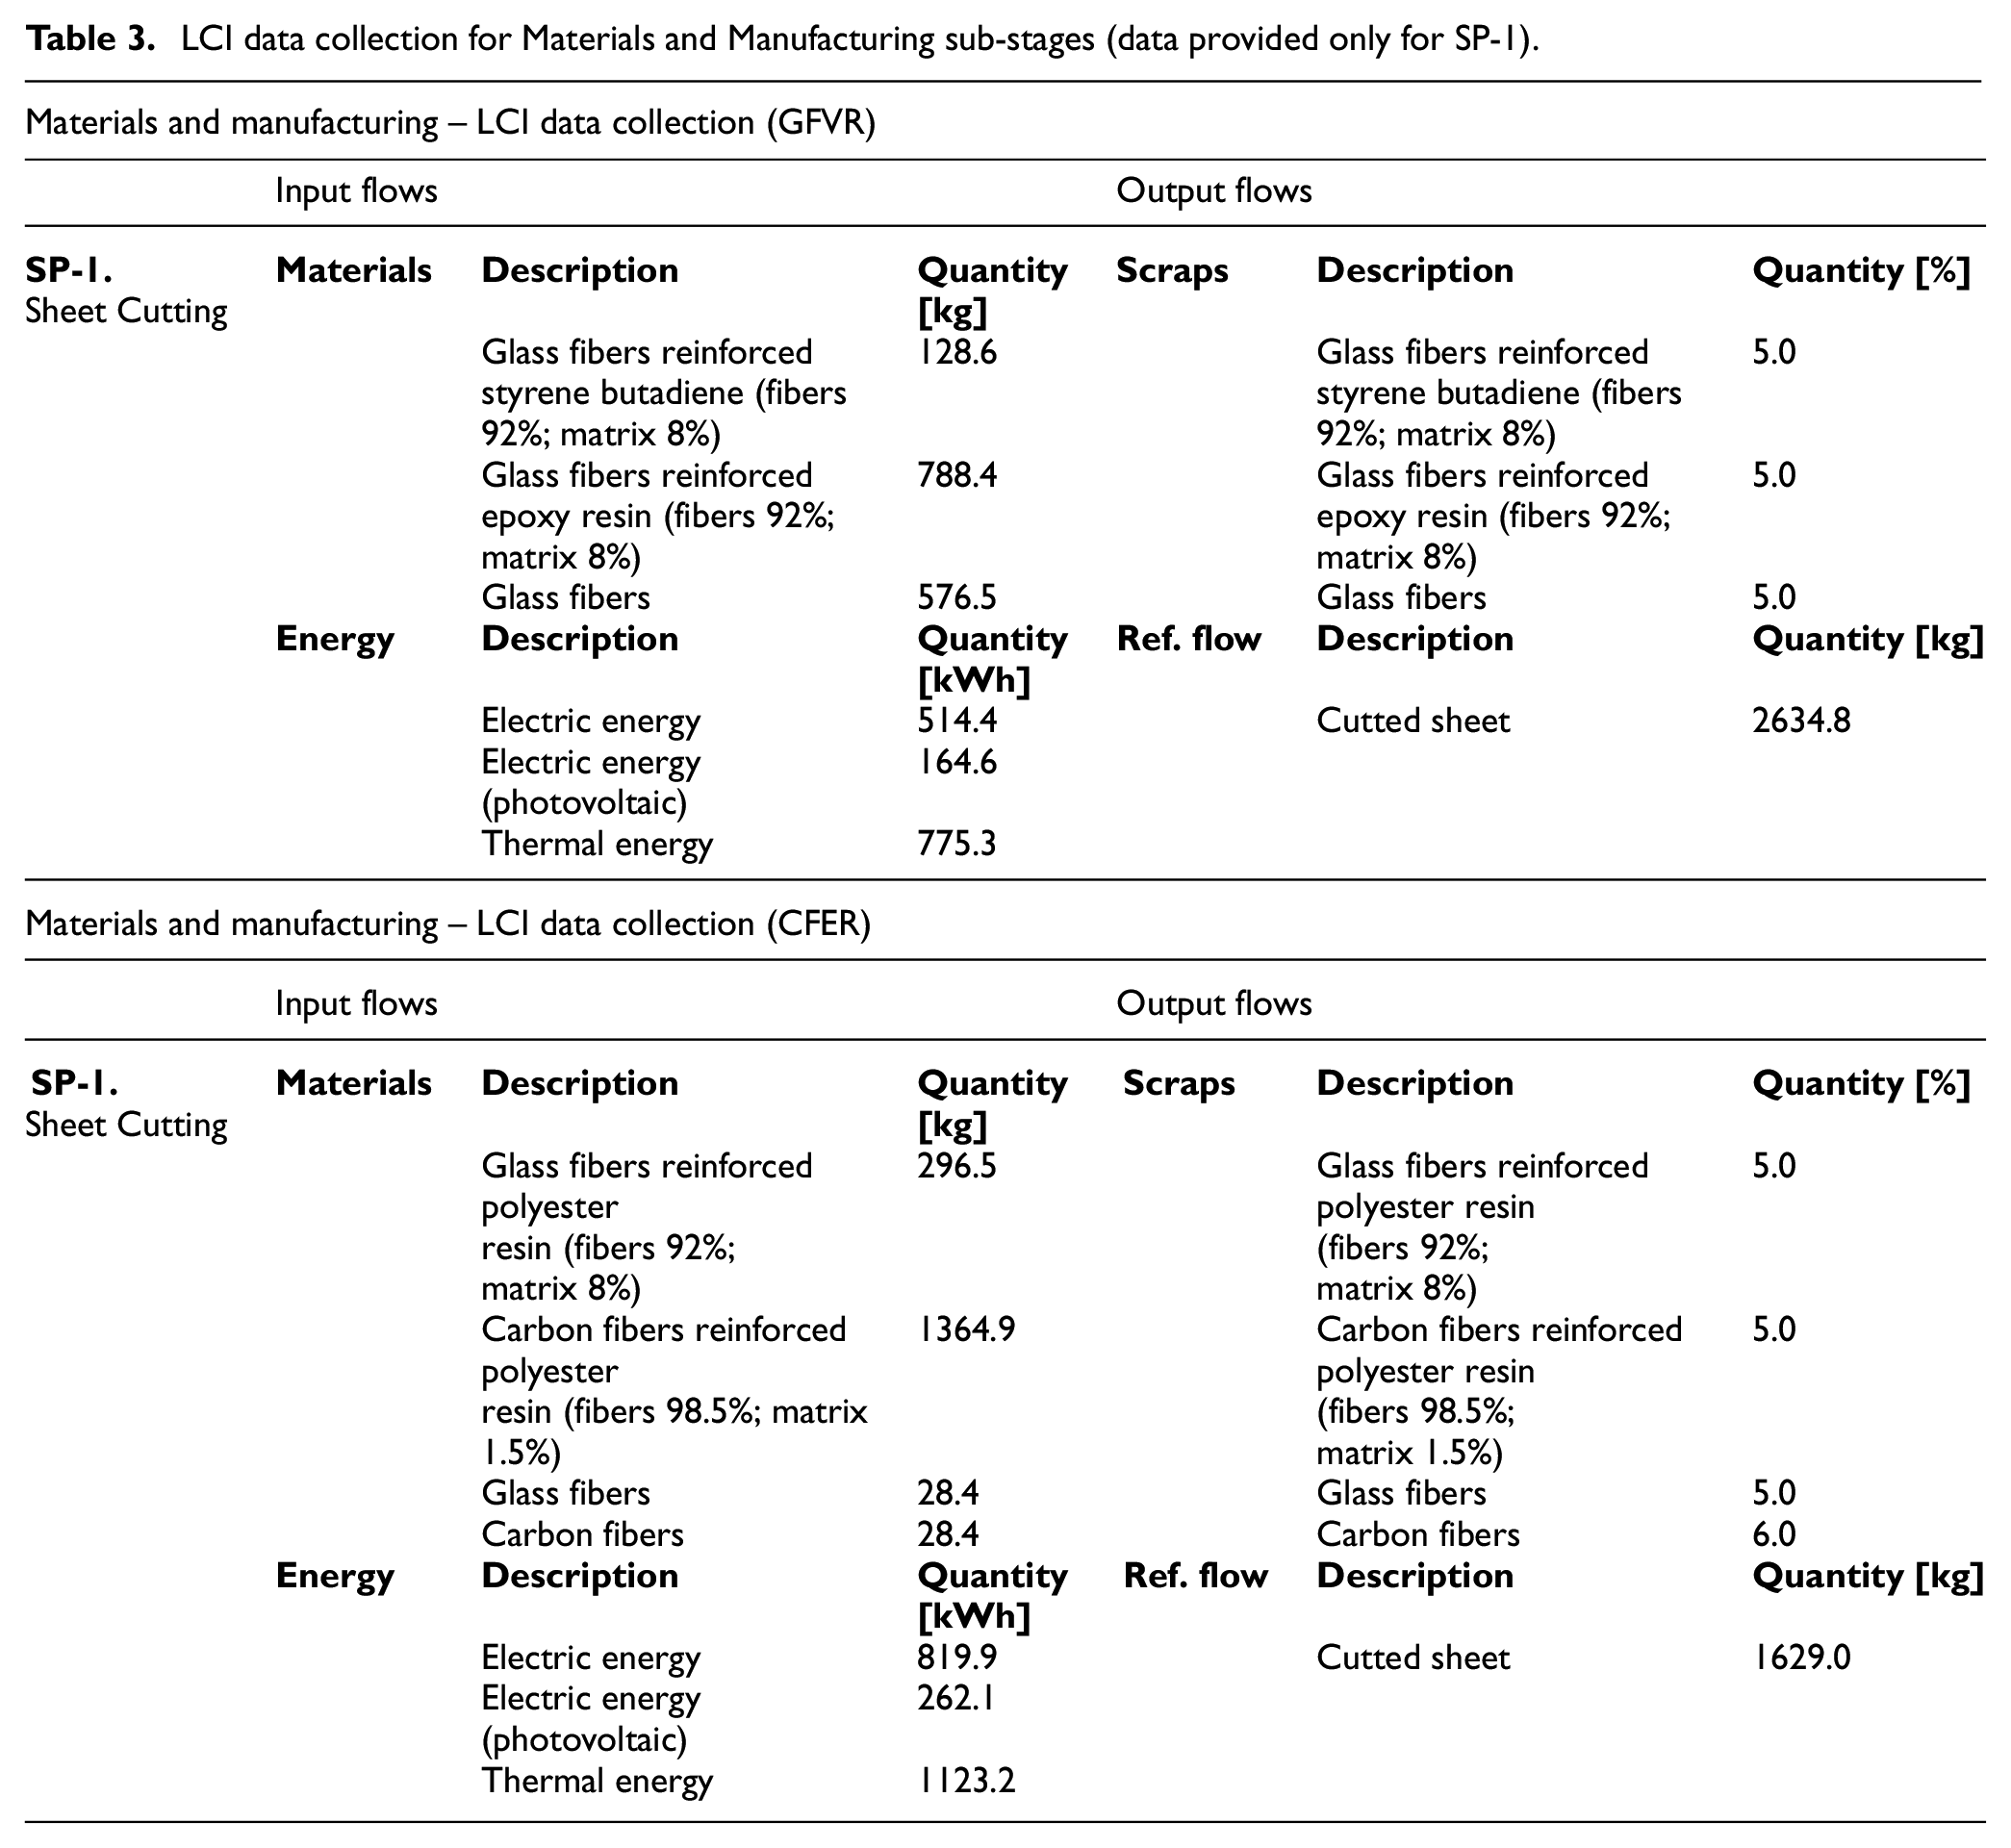
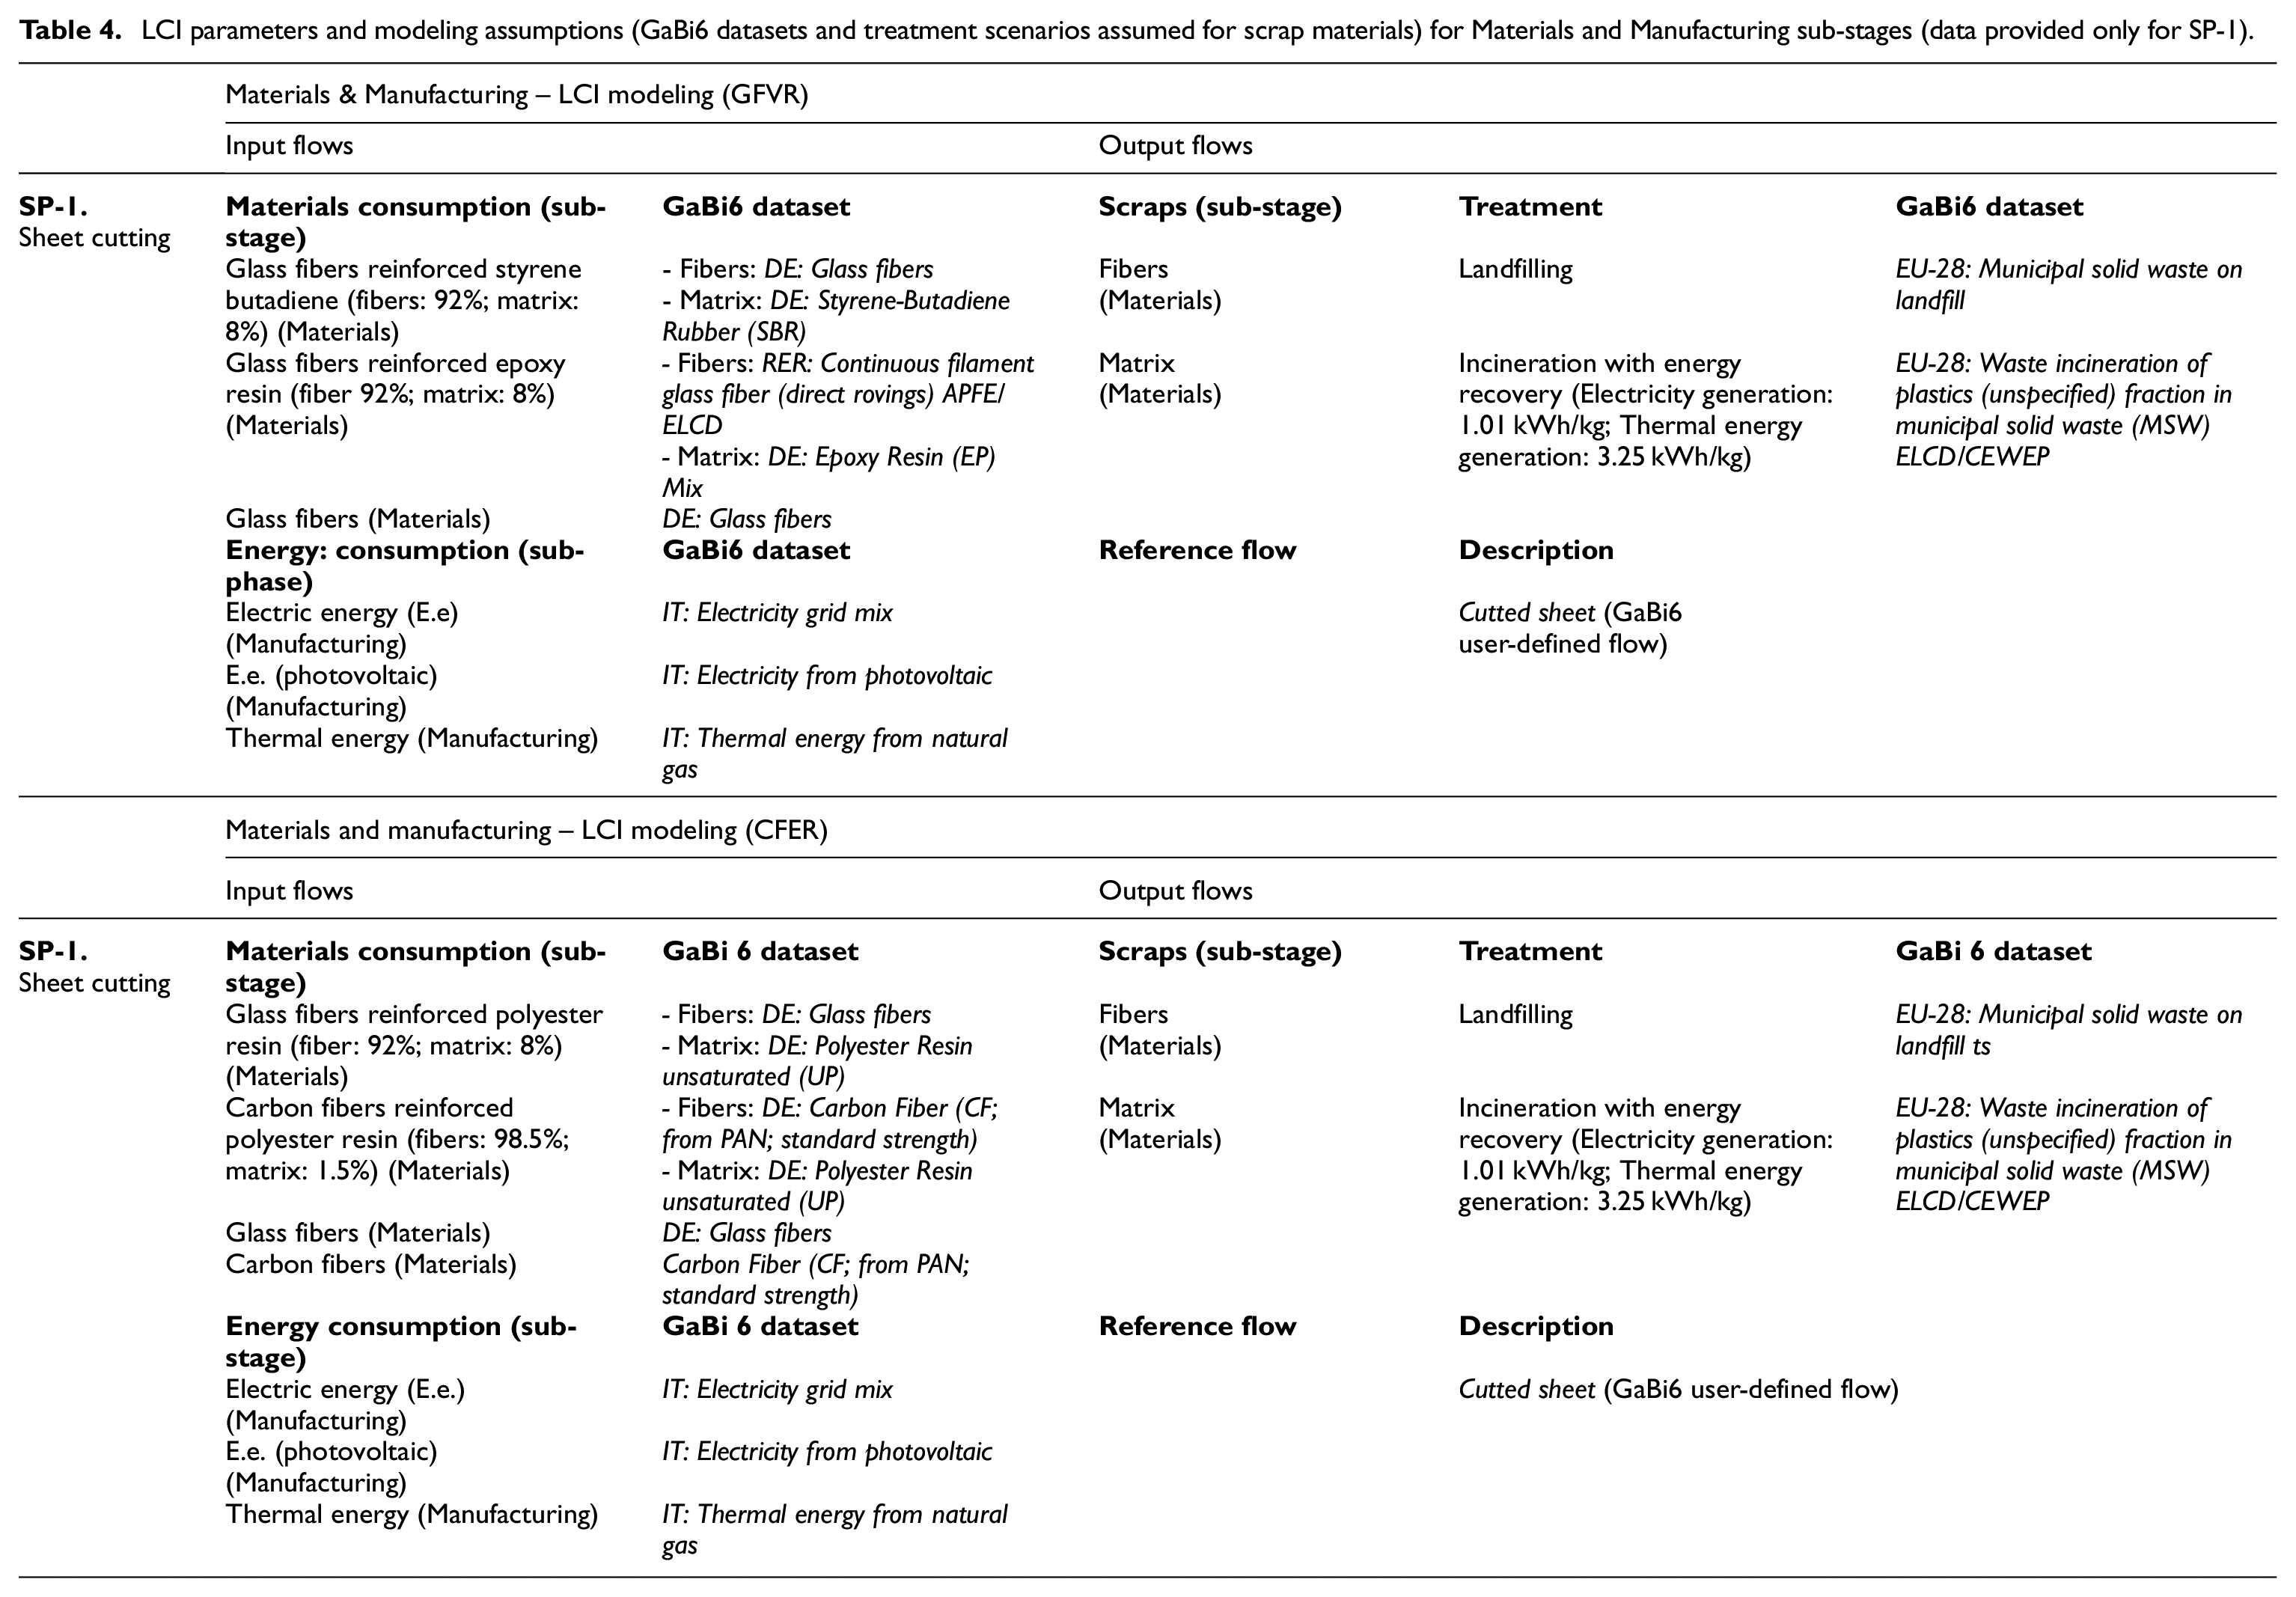
Data collection of raw materials extraction and production consists in the determination of typology and quantity of materials that are needed in order to manufacture the superstructure component. Table 3 provides LCI primary data collection for Materials sub-stage: the table provides GFVR and CFER data referred to only SP-1, while the complete inventory is provided in Table SI 1 of the SI Appendix. As regards the inventory modeling, Table 4 reports GaBi6 datasets used to model raw materials and production processes: the table provides GFVR and CFER data referred to only SP-1, while the complete set of datasets and modeling assumptions is provided in Tables SI 2 and SI 3 of the SI Appendix.
LCI data collection for Materials and Manufacturing sub-stages (data provided only for SP-1).
LCI parameters and modeling assumptions (GaBi6 datasets and treatment scenarios assumed for scrap materials) for Materials and Manufacturing sub-stages (data provided only for SP-1).
Production – Manufacturing
Data collection for Manufacturing sub-stage consists in the quantification of input/output flows involved in production processes: these are input material and energy flows (needed to feed the operation of production processes), output reference flows (semi-finished products which enter the subsequent manufacturing step) and output scrap flows (originated from different manufacturing steps). Table 3 reports LCI primary data collection for Manufacturing sub-stage; the table provides GFVR and CFER data referred to only SP-1, while the complete inventory is provided in Table SI 1 of the SI Appendix. Concerning the inventory modeling, this takes into account both the production of material/energy consumables (which are used for component manufacturing) and the treatment of waste materials, this latter modeled as landfilling or incineration with energy recovery depending on the specific material type. In particular, the modeling of energy recovery includes also environmental benefits of generating electric and thermal energy from incineration, which are credited to the LC stage that originates the incinerated scrap. For each scrap material to energy recovery, a specific value for electricity and thermal energy production (expressed in MJ/kg) is assumed, according to GaBi6 LCI database. Table 4 reports LCI parameters and assumptions (GaBi6 datasets and treatment scenarios assumed for scrap materials) to model Manufacturing sub-stage: the table provides GFVR and CFER data referred to only SP-1, while the complete set of GaBi6 datasets and modeling assumptions is provided in Tables SI 2 and SI 3 of the SI Appendix.
Production – Transportations
Data collection for Transportations sub-stage consists in the determination of all information that characterize the transports of materials/components during manufacturing: transported mass, type of transport and distance traveled. The inventory modeling is performed considering that materials and components provided by the same suppliers are transported together assuming a comprehensive utilization factor. Table 5 reports data collection and LCI modeling parameters for Transportations sub-stage.
Data collection and LCI modeling for Transportations sub-stage.
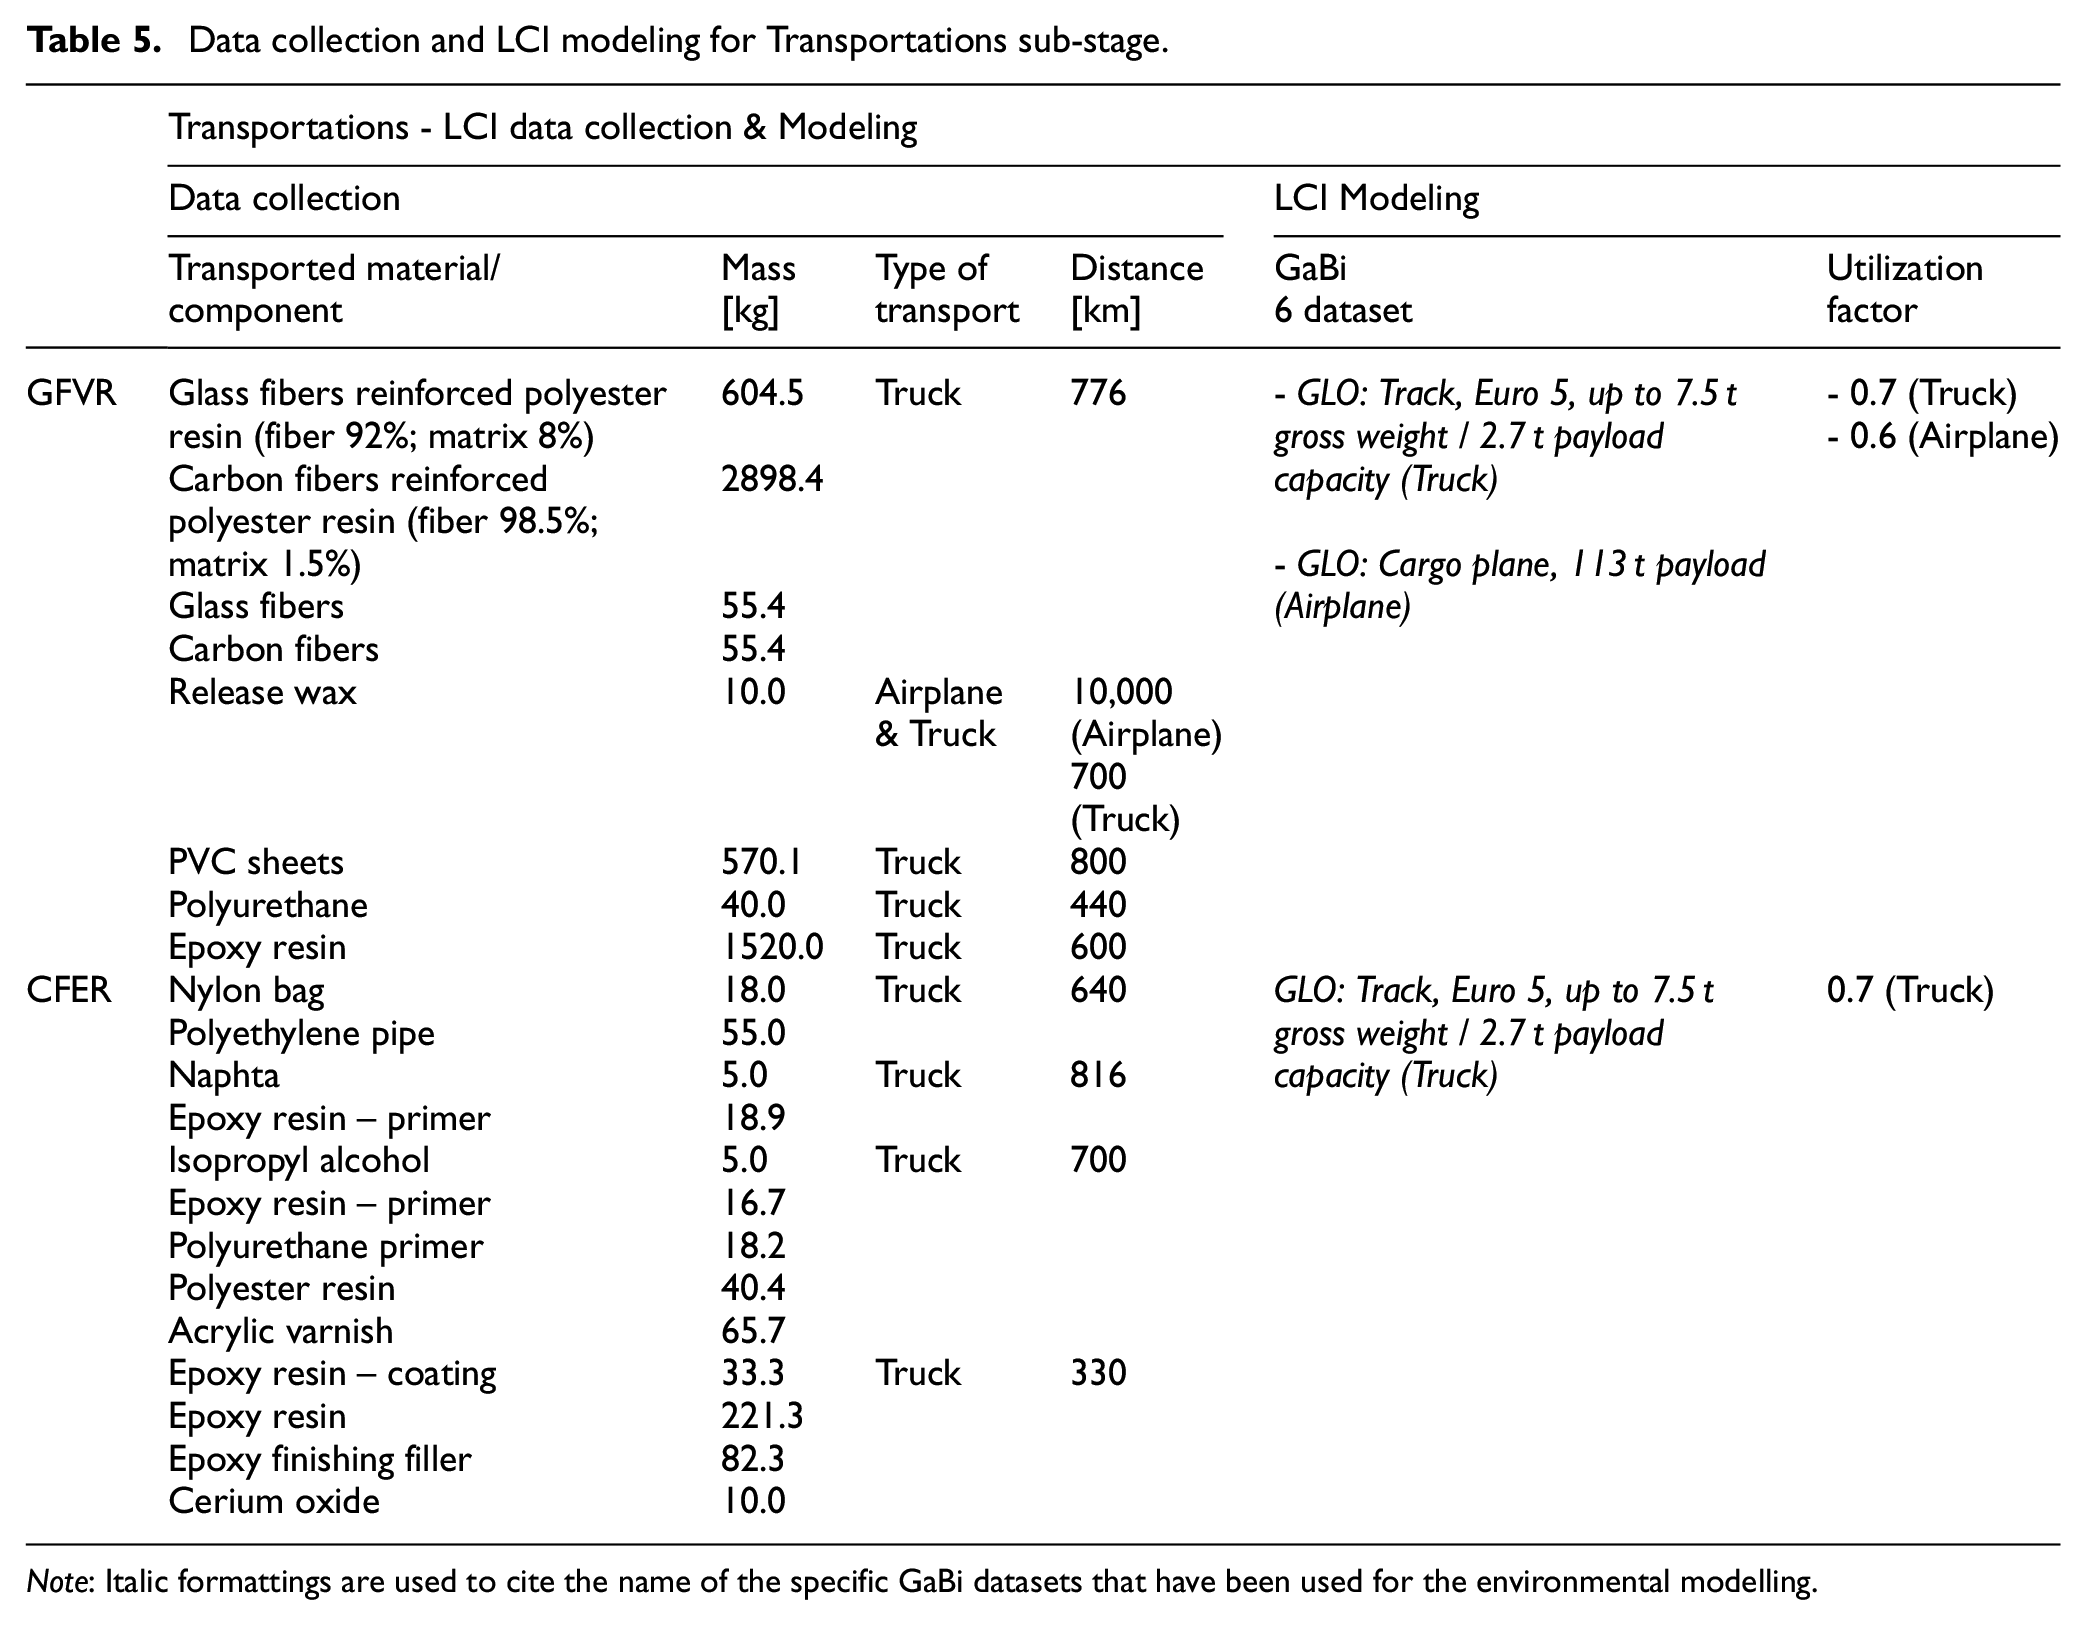
Note: Italic formattings are used to cite the name of the specific GaBi datasets that have been used for the environmental modelling.
Use
The use stage assesses the GWP associated with the operation of the superstructure component. Such an impact is determined by two contributions:
- production of the amount of diesel fuel which is associated with the operation of the superstructure component (“Fuel supply” sub-stage);
- CO2 air emissions during yacht operation associated with the superstructure component (“Operation emissions” sub-stage).
The inventory of operation consists in the quantification of the amount of diesel fuel and CO2 emissions associated with the operative life of the component. The inventory modeling is carried out through an analytical model based on a linear proportionality between mass and diesel consumption/emissions, assuming a proportionality constant of 0.4, as provided by Burman et al. 34 . Table 6 provides the LCI framework and data collection for use phase, including analytical model, primary data collection and GaBi6 datasets used for the environmental modeling.
LCI modeling framework and data collection for the Use stage.
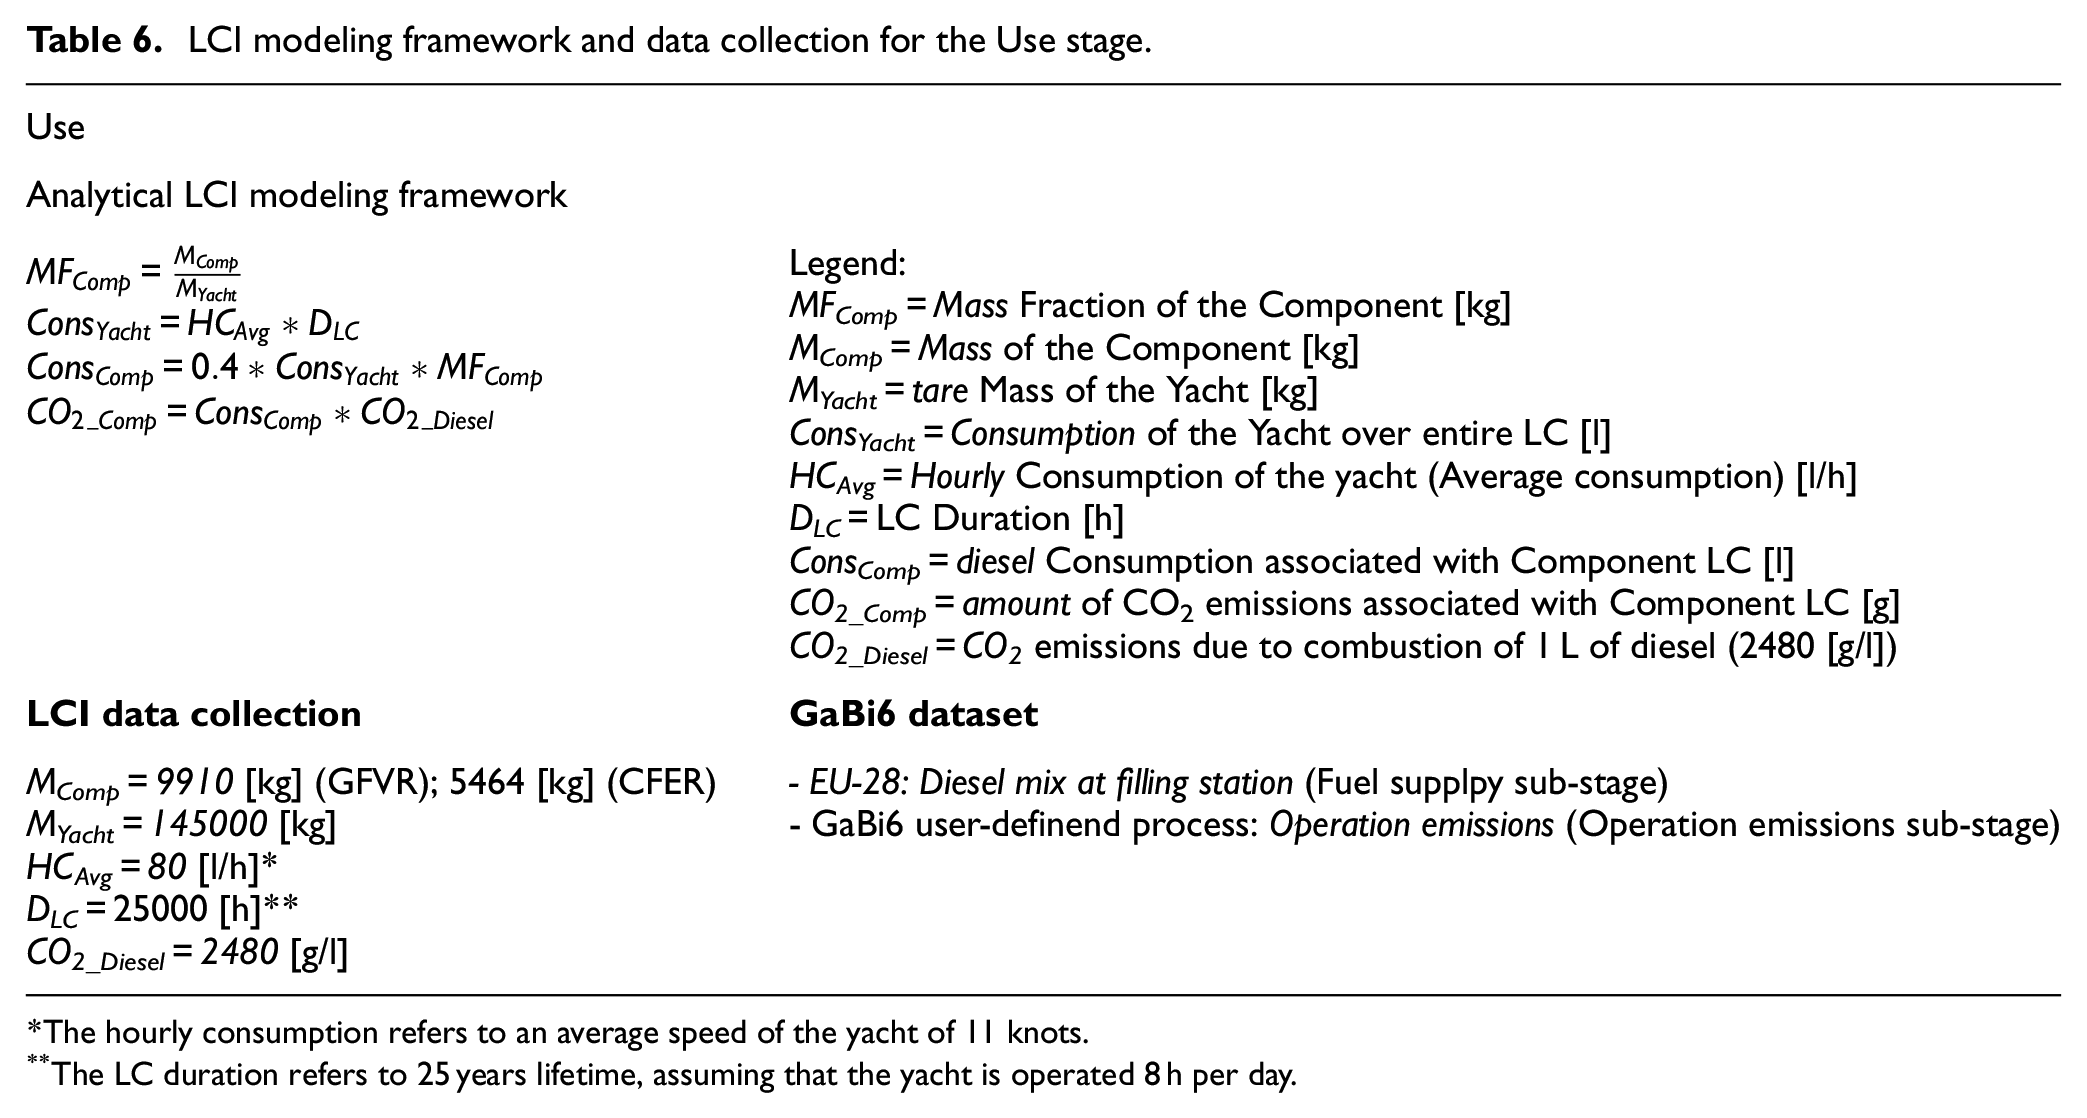
The hourly consumption refers to an average speed of the yacht of 11 knots.
The LC duration refers to 25 years lifetime, assuming that the yacht is operated 8 h per day.
End-of-life
Data collection for the EoL stage consists in the material composition of the superstructure component (see Figure 1). The assumed EoL scenario is incineration with energy recovery (both electricity and thermal energy) for both design solutions, which is modeled assuming the following GaBi6 datasets:
- “EU-28: Waste incineration of plastics (unspecified) fraction in municipal solid waste (MSW) ELCD/CEWEP <p-agg>” (incineration of resin parts);
- “EU-28: Municipal solid waste on landfill ts <p-agg>” (landfilling of panels fibers).
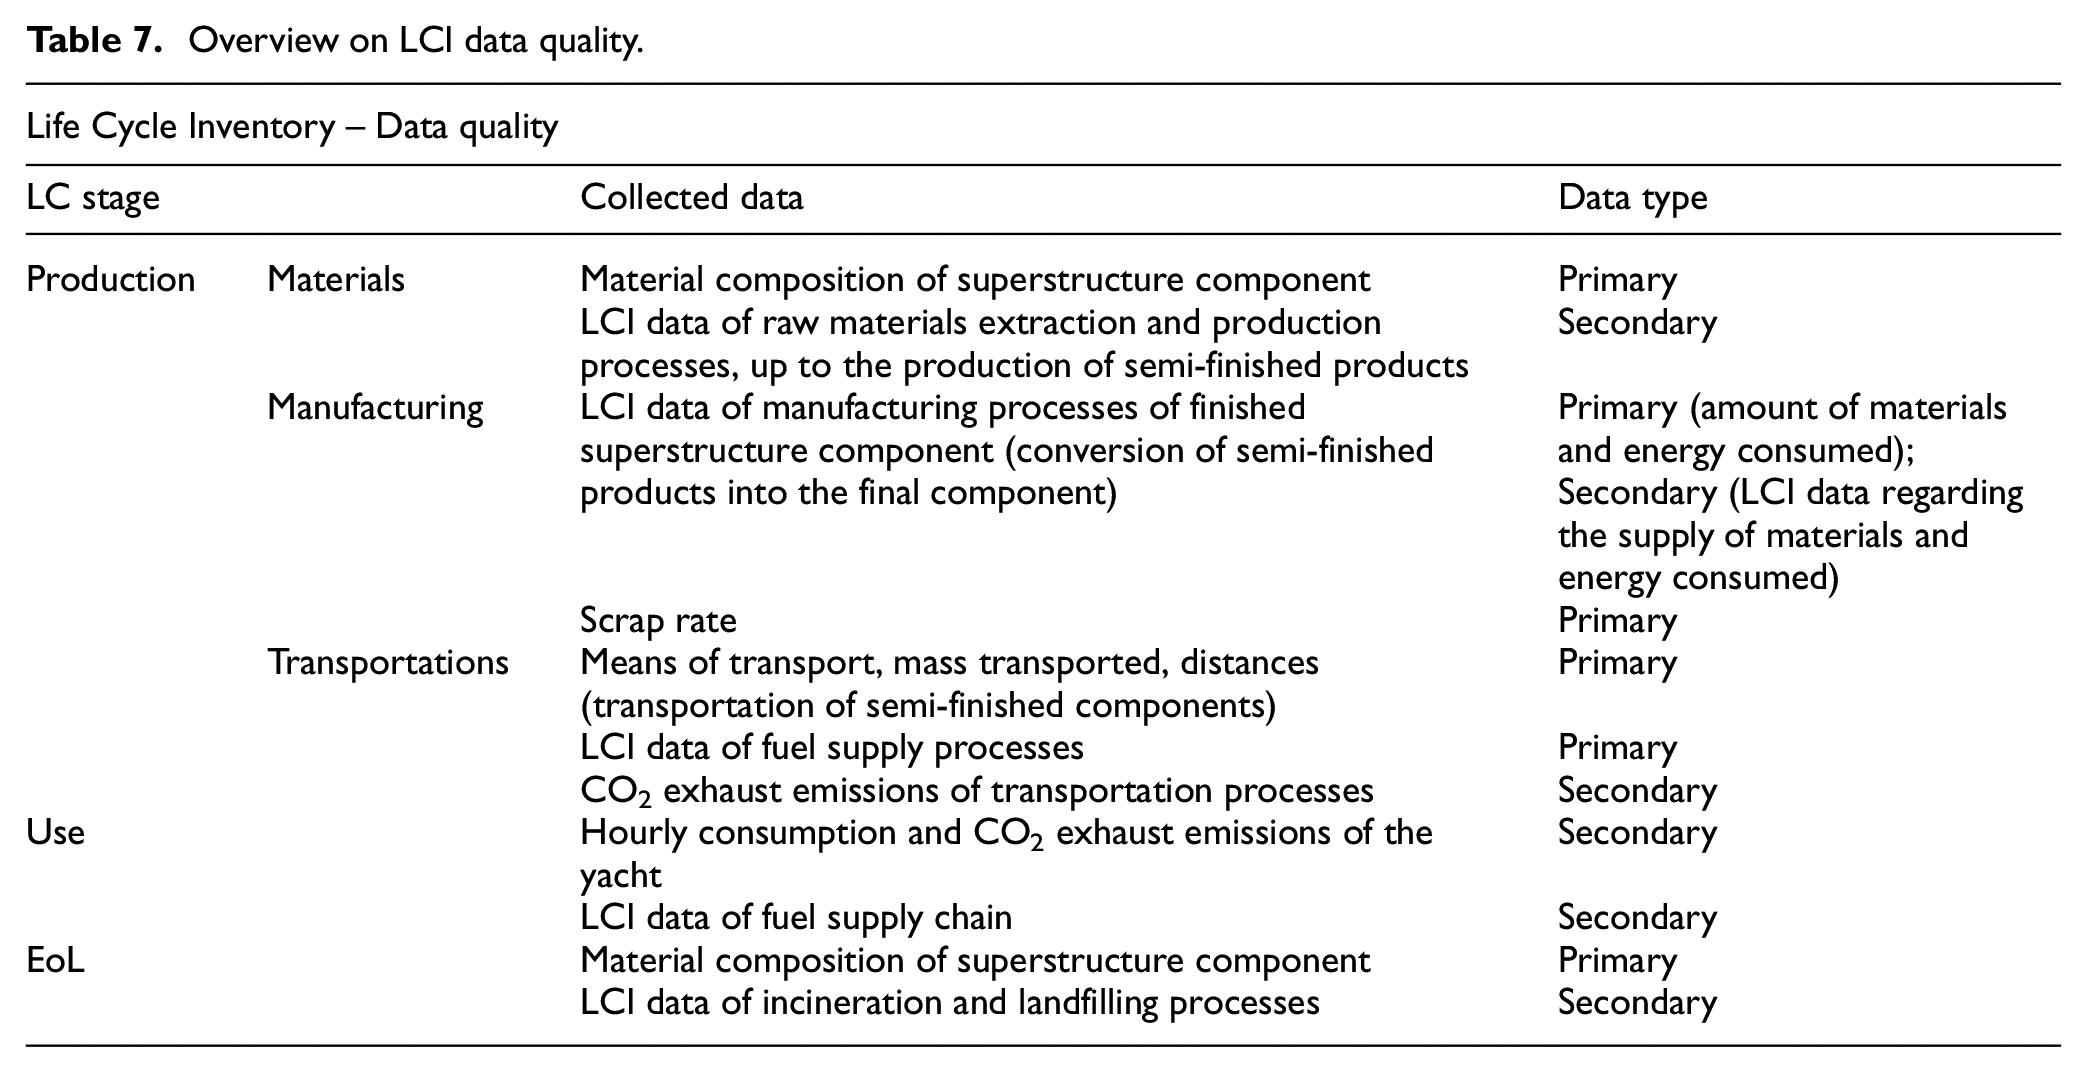
As regards the quality of the inventory, three types of data are distinguished: primary data (data obtained through direct measurements carried out by the manufacturer) and secondary data (data from GaBi6 inventory databases). 42 An overview on the quality of inventory data used in the study is reported in Table 7.
Overview on LCI data quality.
Results and discussion
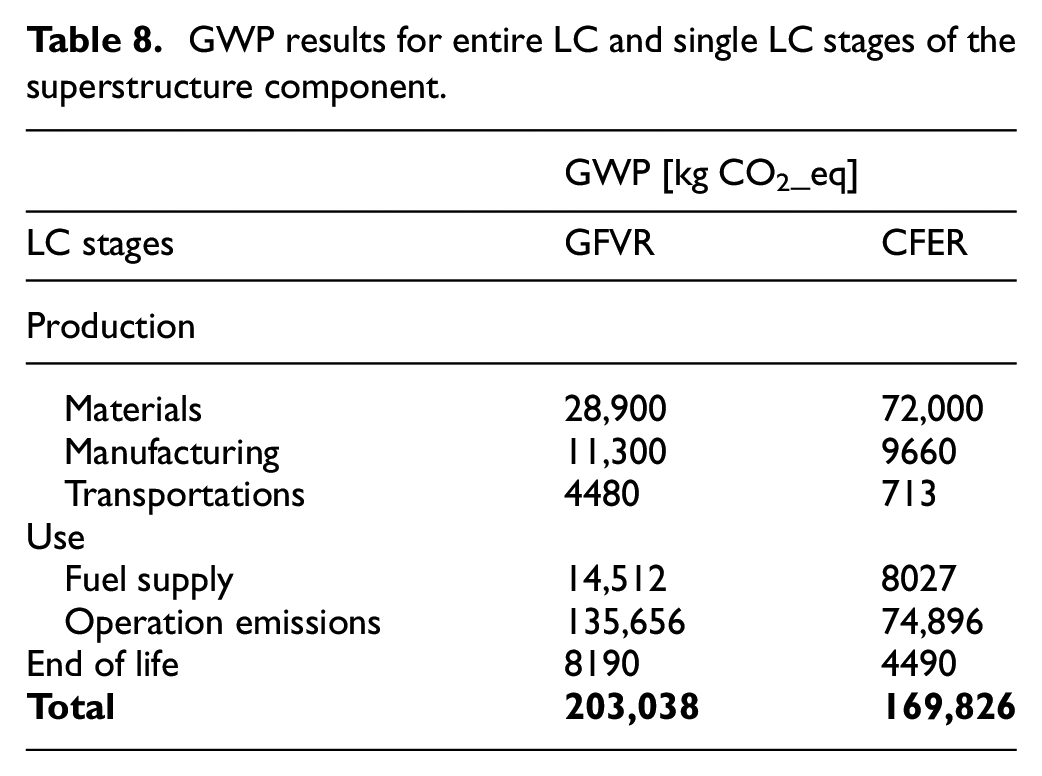
The GWP results are reported in Table 8 for both entire LC and single LC stages. Impacts referred to Materials and Manufacturing phases are reported in Table SI 4 of SI Appendix for all manufacturing steps. Results are compared and interpreted. Comments are divided in two main sections:
GWP results for entire LC and single LC stages of the superstructure component.
- allocation of impact to LC stages/manufacturing processes (contribution analysis by LC steps and manufacturing processes of GWP)
- comparative analysis (critical comparison between the two design solutions and sensitivity analysis).
Impact allocation
Figure 2 illustrates the contribution analysis by LC stages of GWP. Considering the GFVR solution, the vast majority of impact is associated with Use (almost 74% of total), followed by Production (22%) and EoL (4%). The highest effect of operation can be justified by the notable duration of the superstructure component life-time, which is responsible for the consumption of a great amount of diesel (about 54,700 L over 25,000 h life-time). More specifically, the fuel supply chain covers about 10% of total Use phase, for which the environmental modeling provides a GWP of 0.32 kg CO2_eq per liter of diesel produced; the remaining quota (around 90%) is represented by emissions during operation, that are modeled assuming 2480 g of CO2 emissions per liter of diesel burned (see section 2.2). Turning to Production, the environmental burden is primarily caused by Materials sub-stage (65% of total Production), mainly due to the relevant energy intensity of glass fibers and plastic matrices (styrene, epoxy resin and polyester resin) production processes. The quota of Manufacturing (about 25%) is mainly associated with energy consumption involved in application of PVC panel, application of inner skin and sanding (both electric and thermal energy). As concerns EoL, the GWP is mainly caused (about 85%) by air emissions from incineration of plastic material fractions (isophtalic resin and epoxy resin). In this regard, it is interesting to note that the environmental credits arised from energy recovery (for which it is assumed cogeneration of 1.01 kWh/kg of electricity and 3.25 kWh/kg of thermal energy) are not sufficient to counterbalance the detrimental effect of exhaust emissions of combustion.
Contribution analysis by LC stages/sub-stages of GWP.
The analysis of CFER results firstly highlights the strong decrease in Use stage quota with respect to the GFVR design (about 49%), which is more or less equal to Production. This effect is mostly due to two main reasons. The first one is the notably reduction in component mass (passing from the 9.9 t of the GFVR to the 5.5 t of the CFER) while maintaining the same specific use stage GWP (kg CO2_eq/kg of component), as fuel production and operation emissions are linearly scaled with superstructure mass. The second reason is the definitely higher impact in production (in terms of kg CO2_eq per kg of finished component) of the CFER option (average specific GWP: 15.1 kg CO2_eq/kg) with respect to the GFVR design (average specific GWP: 4.5 kg CO2_eq/kg). This last point is almost exlusively due to the high energy intensity of raw materials extraction and production of carbon fibers, for which the specific impact is almost 20 kg CO2_eq/kg, against 1.7 kg CO2_eq/kg for glass fibers production. 42 As regards the other Production sub-stages (Manufacturing and Transportations) and EoL, the contribution to total is lower for CFER than GFVR (respectively around 6%, 0.5%, and 3%), once again due to the big specific GWP in materials supply of the carbon fibers composite which limits the percentage quota of the other steps.
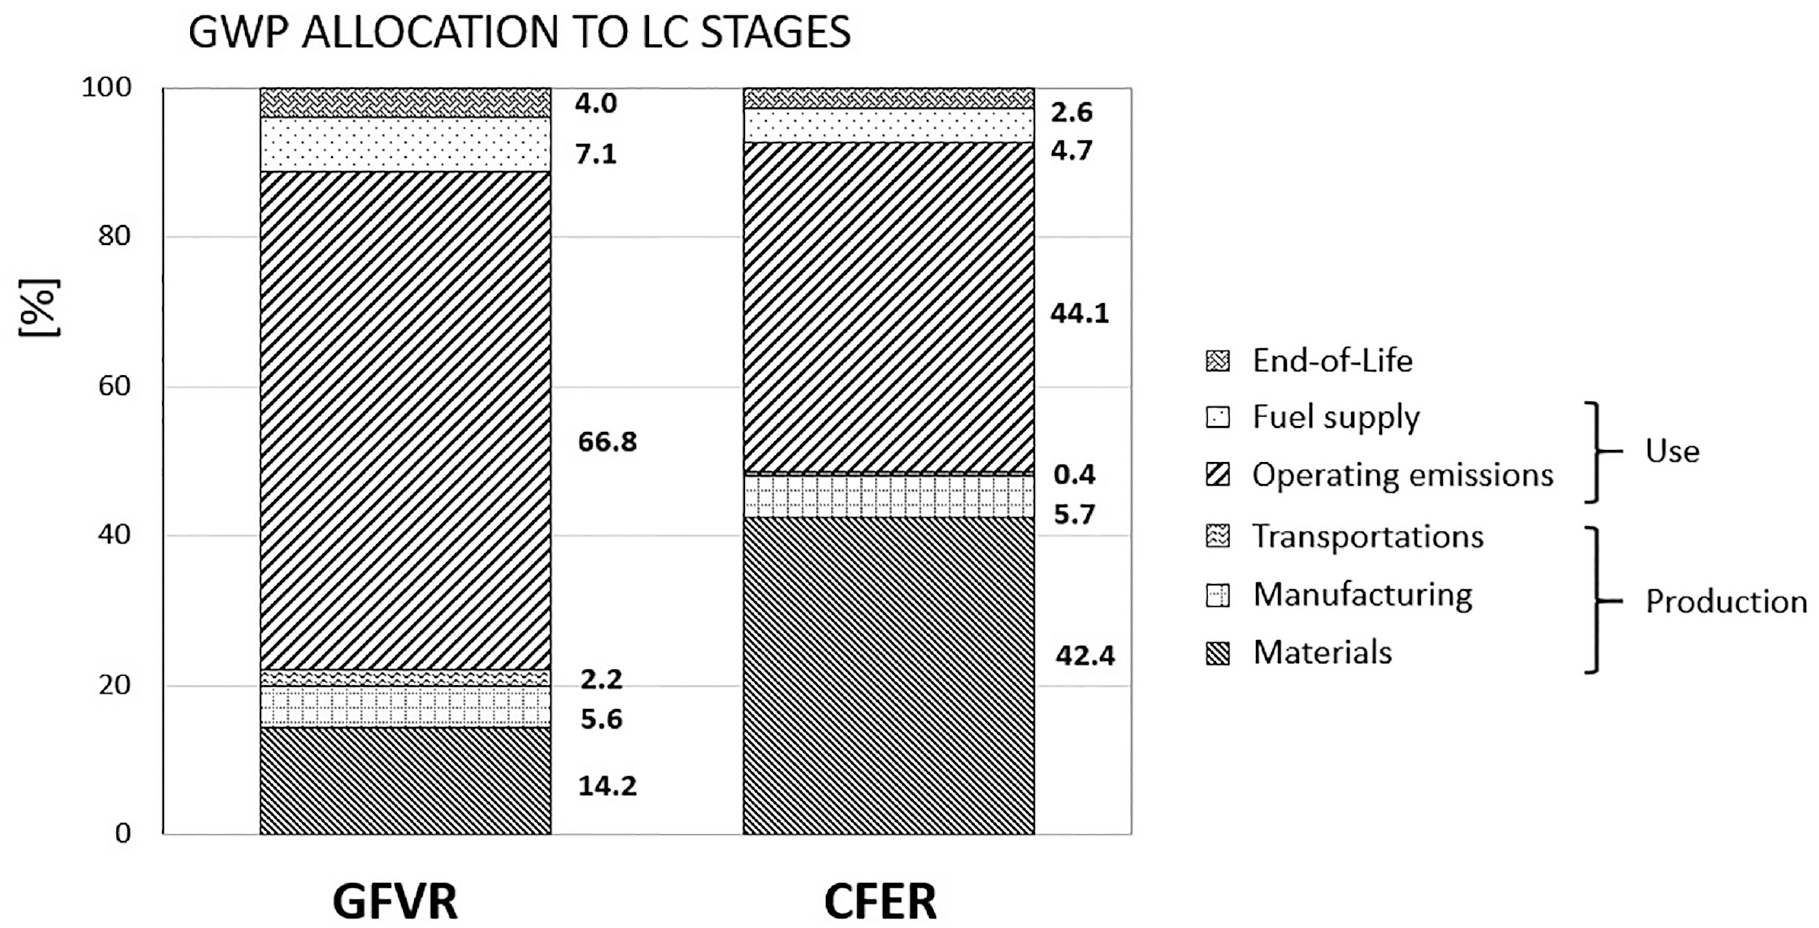
Figure 3 provides the allocation of GWP in Materials and Manufacturing to different production steps. Starting with the GFVR, more than 50% of the environmental effect is ascribed to inner skin application (SP-6), PVC application (SP-5) and fibers cutting (SP-1), representing respectively around 20%, 17%, and 13% of total. The strong influence of these steps is primarily based on the fact that the input materials to SP-6, SP-5 and SP-1 cover about 76% by mass of the input materials to the entire production chain. As a confirmation, the majority of impact for such production processes is associated with Materials stage, that is raw materials acquisition for the production of
- 1014 kg of glass fibers reinforced epoxy resin and 1316 kg of isophtalic resin (SP-6)
- 373 kg of PVC and 728 kg of epoxy resin (SP-5)
- 128.6 kg of glass fibers reinforced styrene butadiene, 788.4 kg of glass fibers reinforced epoxy resin and 576.5 kg of glass fibers (SP-1).
Allocation of GWP in Materials and Manufacturing stages to different production steps: GFRV (a) and CFER (b).
That said, the quota of GWP due to Manufacturing is bigger for inner skin (SP-6) and PVC application (SP-5) (respectively 23% and 19% of total process), while it does not reach 8% for the sheet cutting (SP-1), due to the lower electric and thermal energy consumption. As regards the other production steps, the most influential are laying out of outer skin (SP-4), skin coat application (SP-3), positioning of reinforcement elements (SP-8), sanding (SP-12), vacuum infusion process (SP-9) and waxing/gecoat application (SP-2), representing togheter around 41% of the overall Materials and Manufacturing GWP. For these processes, the impact allocation is more or less similar to SP-6, SP-5, and SP-1: the only exception is represented by sanding (SP-12), for which the quota of Manufacturing covers almost the totality because of a relevant electricity and thermal energy consumption (respectively 3100 and 3243 kWh). The remaining production processes (SP-7,10,11,13,14,15,16) account together for a contribution of less than 10% of Materials and Manufacturing GWP, since these steps involve a minority share of total materials and energy consumption due to production (around 3.6 and 18% respectively).
Passing to the CFER design, the most influential processes are fibers cutting (SP-1), vacuum infusion process (SP-9), laying out of outer skin (SP-4) and inner skin application (SP-6). Fibers cutting is by far the one with the highest GWP (28,500 kg CO2_eq, covering around 35% of total Production and Manufacturing), which is almost exclusively ascribed to Materials sub-stage. The strong impact intensity of SP1 is due to the fact that this step involves more than half of the composite material required for the entire component (around 52% of total amount of carbon/glass fibers reinforced polyester resin). As regards the vacuum infusion process, laying out of outer skin and inner skin application, they cover together around 44%; once again the impact is prevalently due to green-house gas emissions of raw materials supply, that is epoxy resin, nylon, and polyethylene (vacuum infusion) and glass/carbon fibers reinforced polyester resin (outer skin and inner skin application). The remaining 12 steps account together for only 21% of total Materials and Manufacturing, because of the lower demand in both constituent materials (mainly PVC, nylon and carbon/glass fibers composites) and consumables (for finishing and cleaning operations) if compared to above processes.
Comparative analysis
Impact variability GFVR/CFER
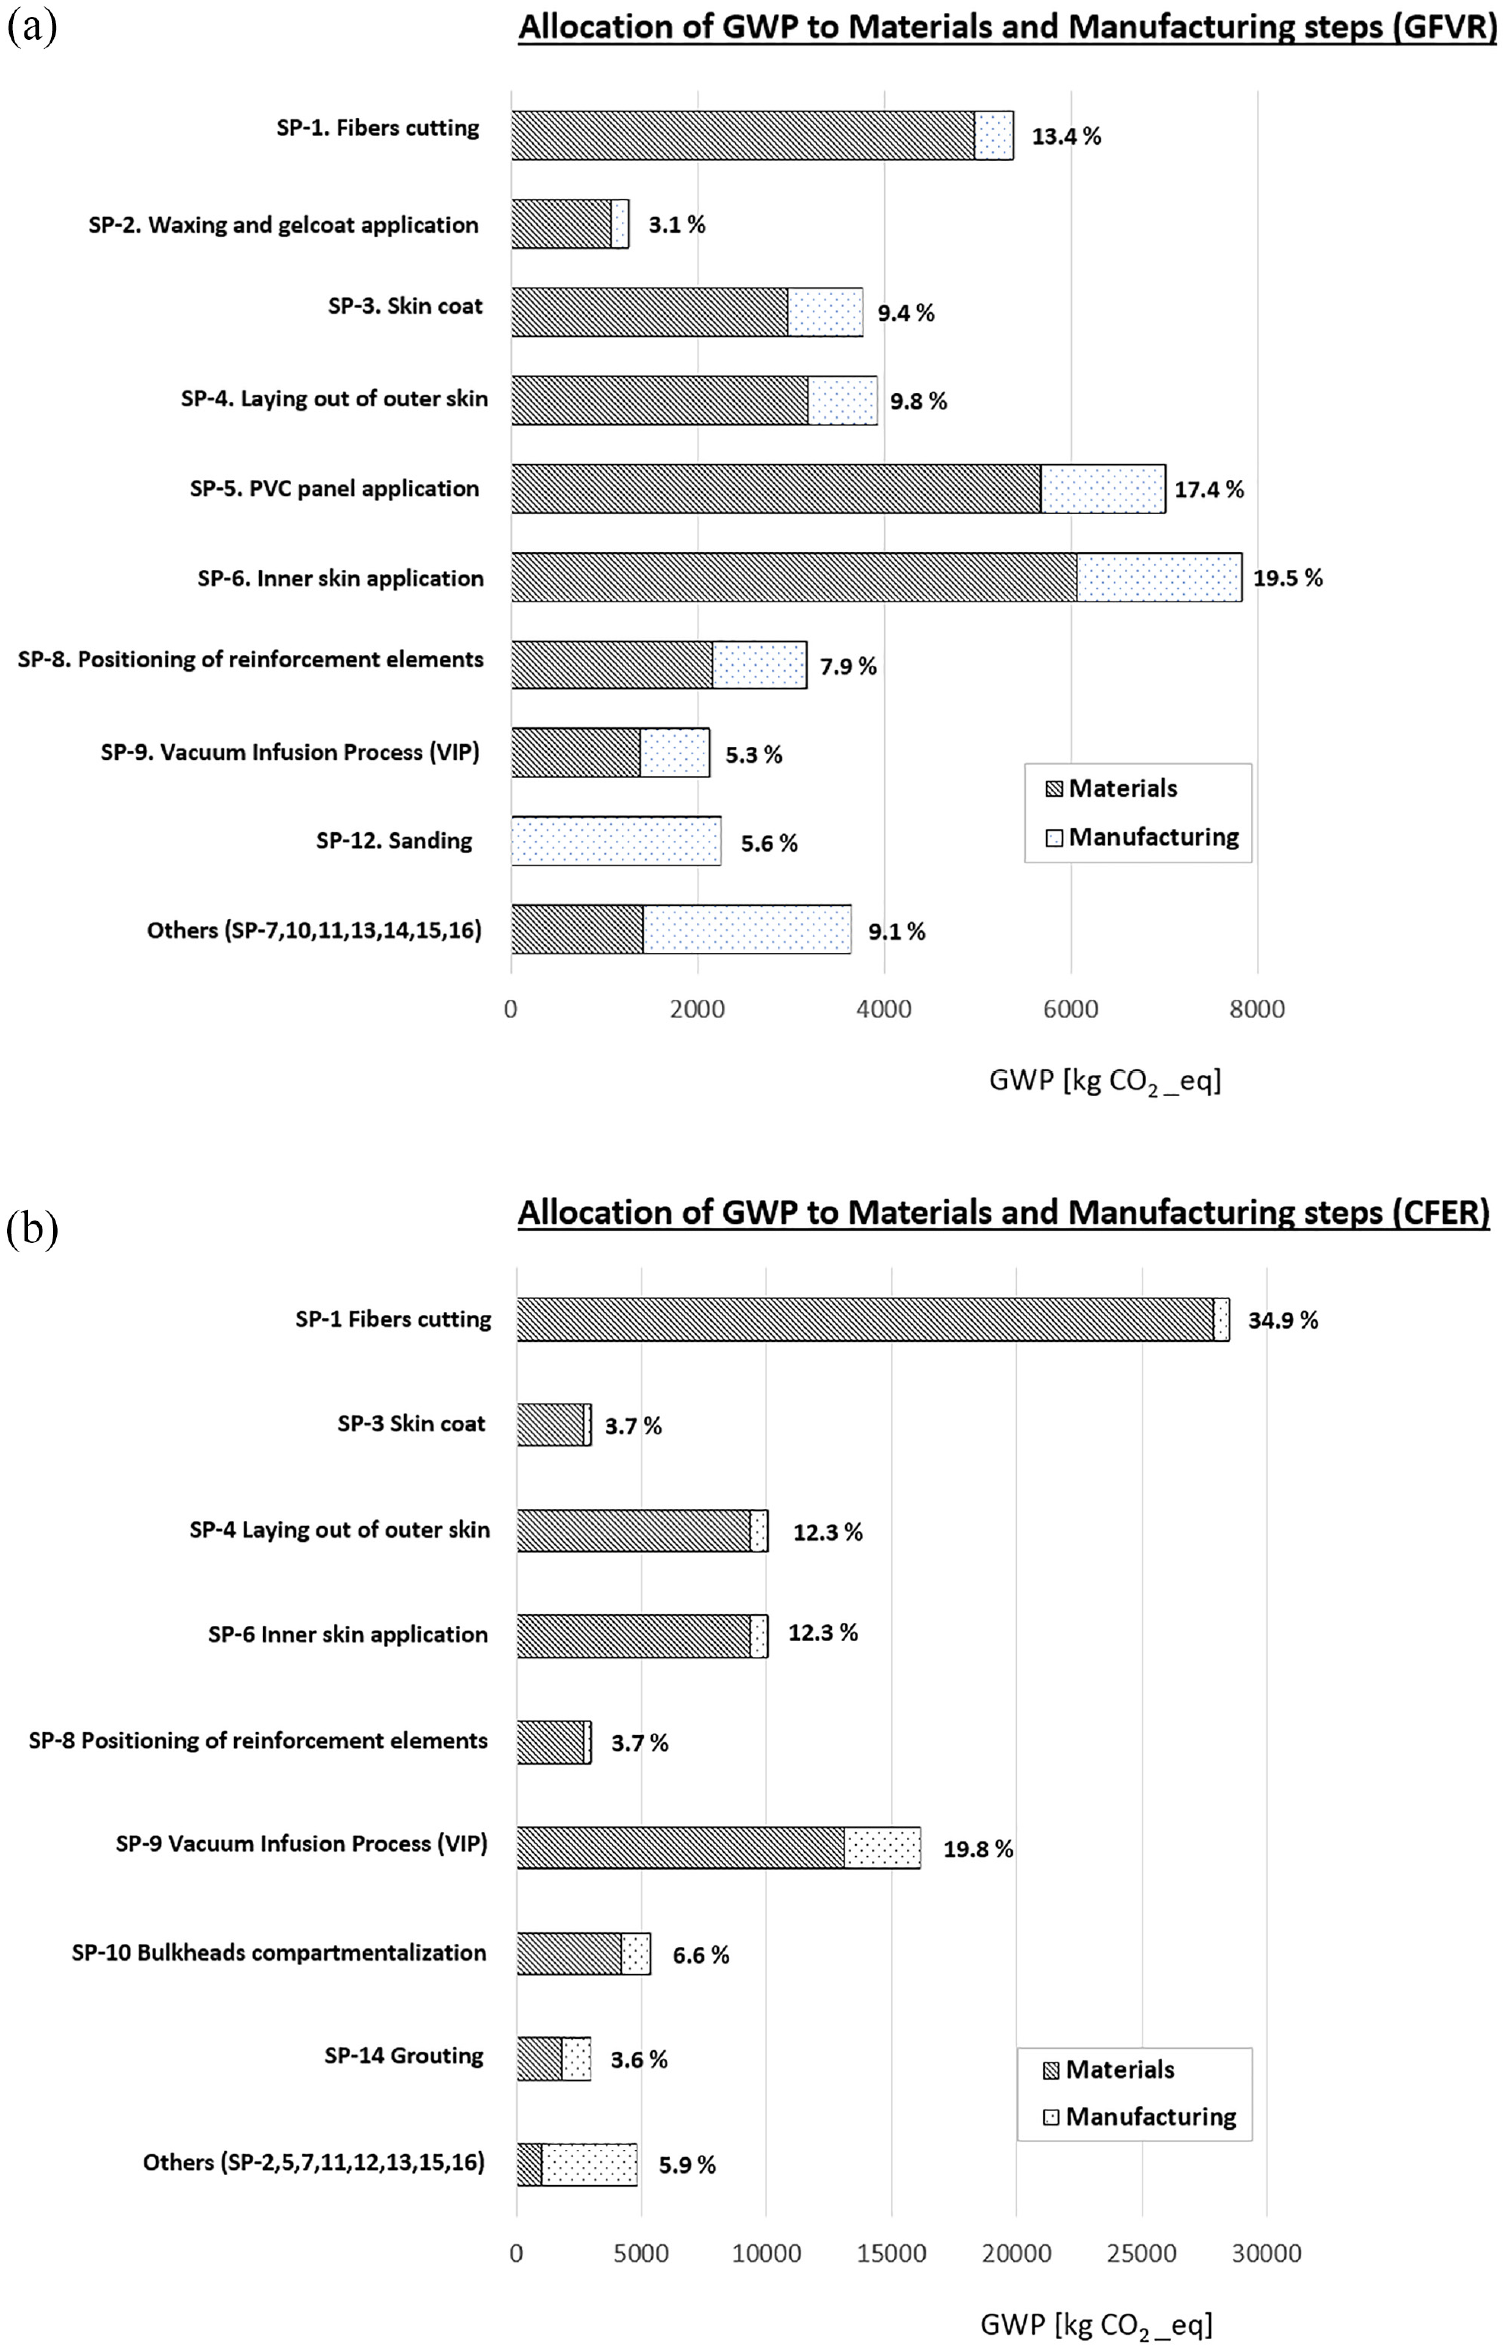
Figure 4 shows the percentage variation of GWP (ΔGWP = GWPCFER–GWPGFVR), both in relation to total LC and single LC stages. The first point is that the GWP related to the overall LC significantly decreases, with an impact reduction of 16-17%. Such an environmental benefit is almost exclusively due to the very high saving in Use phase GWP, which is determined by mass decrease achieved by lightweighting (44%–45%). Indeed, weight reduction means lower consumption during operation, which in turn translates on one hand into smaller environmental burdens caused by fuel supply chain (lower amount of materials to be extracted and consequently lower amount of energy to refine them) and on the other hand into decreased exhaust air emissions. It is worthy to note that the GWP reduction is exactly the same than mass reduction, since the analytical model for the inventory (both fuel consumption and CO2 emissions associated with superstructure operation) provides a linear dependency on component weight. That said, the highest contribution to use stage impact reduction comes from lowered exhaust emissions, with a benefit of 13.7 kg CO2_eq per kg of saved mass against 1.7 kg CO2_eq/kg from lowered demand in fuel production.
GWP variation GFVR/CFER design solutions.
The analysis of Materials phase reveals that, despite the lower weight of the CFER superstructure, the GWP strongly increases when passing from the reference to the lightweight design. The main reason for this is the definitely higher specific GWP in raw materials acquisition of carbon fibers reinforced polyester resin in comparison to glass fibers reinforced epoxy resin, respectively around 23 kg CO2_eq/kg against 4 kg CO2_eq/kg. 44 This very high impact of carbon fibers production is mainly ascribable to stabilization, carbonization, and heat treatment (graphitization) processes, which are needed to convert polyacrylonitrile precursor fibers into carbon fibers, as provided by GaBi dataset 42 and Janssen et al. 44 .
Passing to EoL, the percentage advantage is even bigger than the one in operation. This is due to the lower mass of the CFER with respect to the GFVR, while considering the same EoL treatment processes (incineration of EoL component and landfilling of the final residue), which are modeled through the same GaBi6 datasets (see section 2.2.). The small difference in percentage variation between Use and EoL is due to the fact that the matrix content in CFER is slightly lower than the one in GFVR, which means lower amount of plastic material to be incinerated and consequent decrease in exhaust greenhouse gas emissions.
Break-even point analysis
Figure 5 investigates the dependence of GWP on operational life-time by reporting the Break-Even Point (BEP) analysis for the overall component LC. The left end of the diagram reports the contribution of time-independent LC stages (Production and EoL), while on the right hand the impact of Use is provided in function of operation duration. Starting with Production and EoL, the GWP of the CFER is definitely higher than the GFVR. Despite the 45% impact decrease in EoL, the detrimental effects of the very high energy intensity in manufacturing of carbon-fibers reinforced polyester resin definitely prevails over the reduced exhaust air emissions from incineration, thus leading to a net GWP increase of around 34,000 kg CO2_eq at 0 h. As a confirmation, the GWP of time-independent phases is close to the one of Production for both solutions, given the small contribution of EoL to the overall impact (about 4% and 3%, respectively for GFVR and CFER, as reported in Figure 2). Passing to operation, the first point is that the trend of GWP is linear over component operation, since the analytical model of Use provides a linear scaling of both fuel consumption and emissions over life-time. As regards the comparison, the environmental equivalence occurs at a relatively high value of operation time (around 12,700 h, which corresponds to 51% of superstructure operation time); that said, the around 33,200 kg CO2_eq reduction achieved by CFER design in the last 12,300 h of LC is definitely significant, as it amounts to a decrease of more than 16% on a LC basis. For higher durations, the environmental benefit of lightweight design grows at life-time increasing, thus leading to a GWP saving of about 28% at 50,000 h, this latter being undoubtedly a very high value of duration but however not unrealistic.
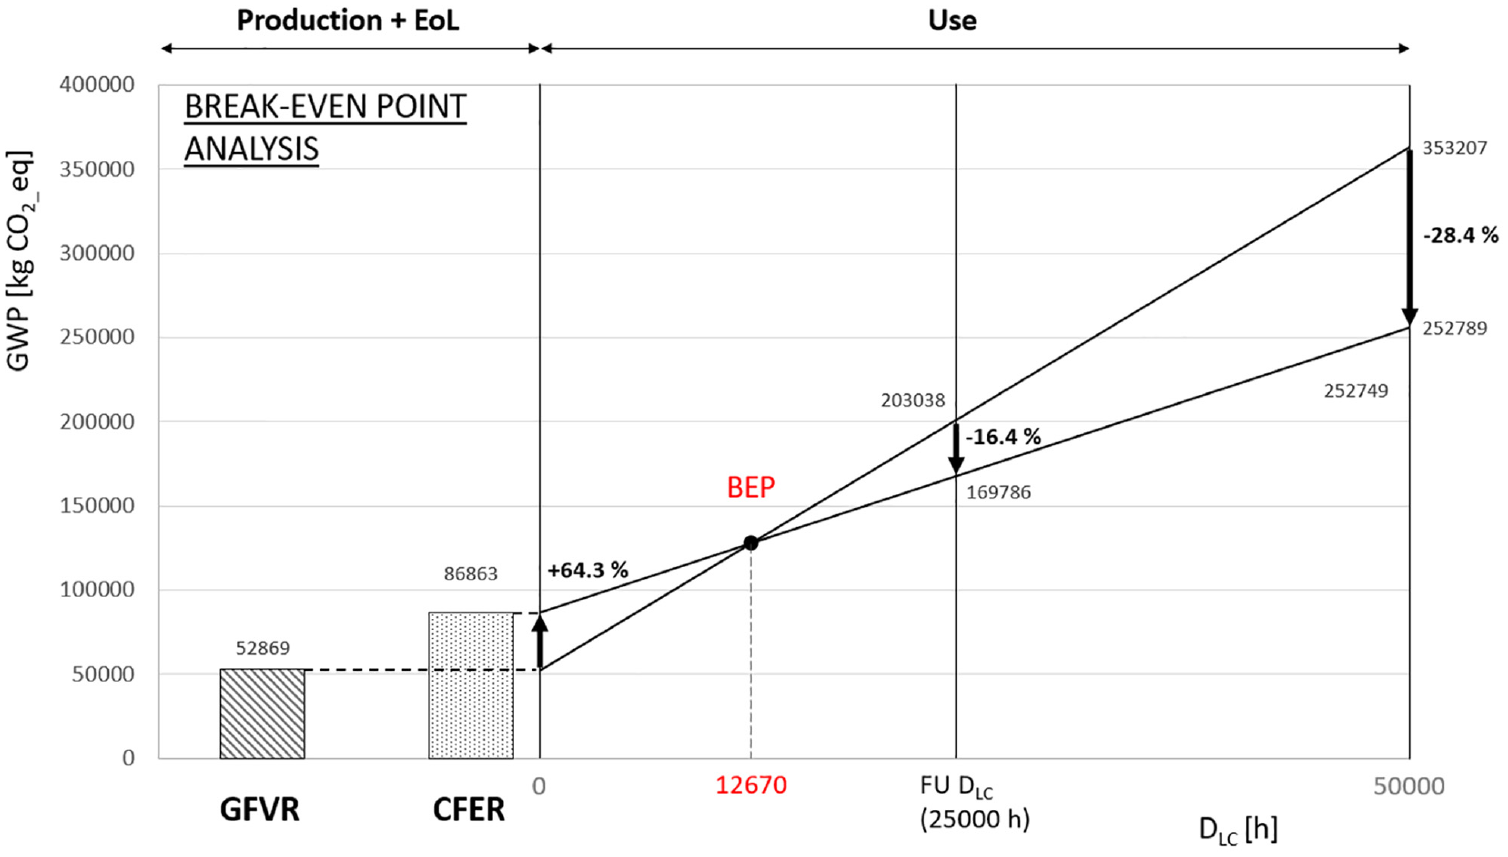
Break-even point analysis.
The considerations above are corroborated by Figure 6, which provides both absolute and percentage GWP variation in function of component LC duration (ΔGWP and ΔGWP%), with the latter defined as follows:

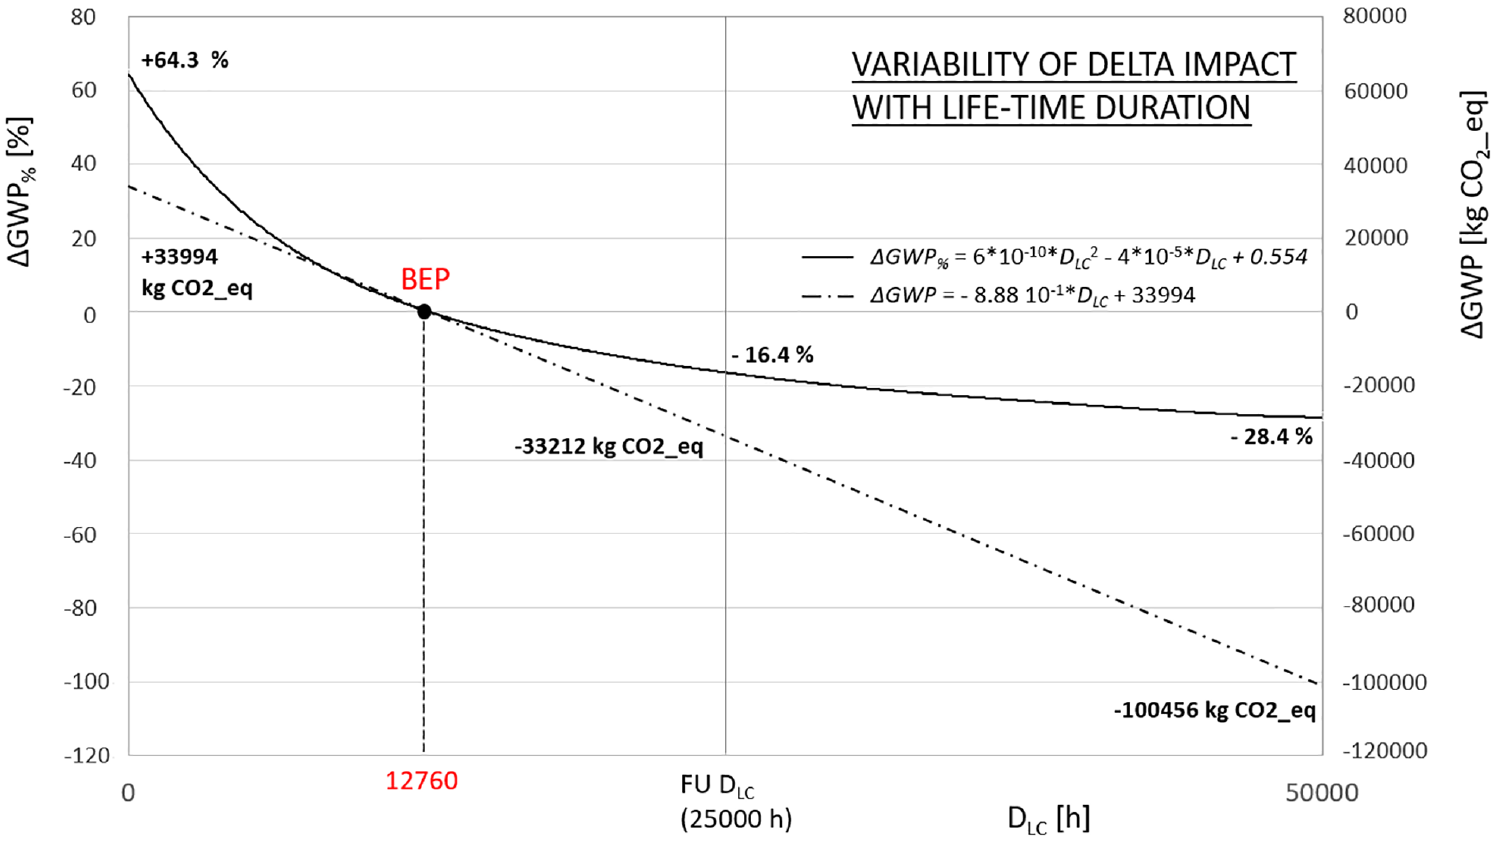
Variability of comparison results with component LC duration.
Results show that at the beginning of use stage (0 h life-time) the innovative solution involves a GWP increase, which corresponds to a very high percentage growth (almost 65%). As concerns operation, the linear variability of ΔGWP determines a parabolic trend of ΔGWP%, whose slope reduces over life-time, as GWPGFVR also varies linearly with component duration. As expected, both absolute and percentage variations are 0 at 12,760 h (BEP life-time), while at 50,000 h
- ΔGWP reduces up to −100,456 kg CO2_eq
- ΔGWP% almost reaches the asymptotic value of about −29%.
The last point of the break-even point section investigates how the consumption level of the yacht influences the results of the comparative assessment. Figure 7 reports BEP in function of use stage hourly consumption, for which a variability in the range HCMax (Maximum hourly consumption)—HCMin (Minimum hourly consumption) is taken into account. As expected, BEP reduces at consumption level increasing: this is because a higher specific consumption involves a bigger relevance of operation on the overall LC impact, thus making lightweighting more effective from an environmental point of view. Data show that, according to a parabolic trend, BEP decreases of more than three times (from 25,305 h to 8435 h) while passing from minimum (40 l/h) to maximum (120 l/h) consumption level.
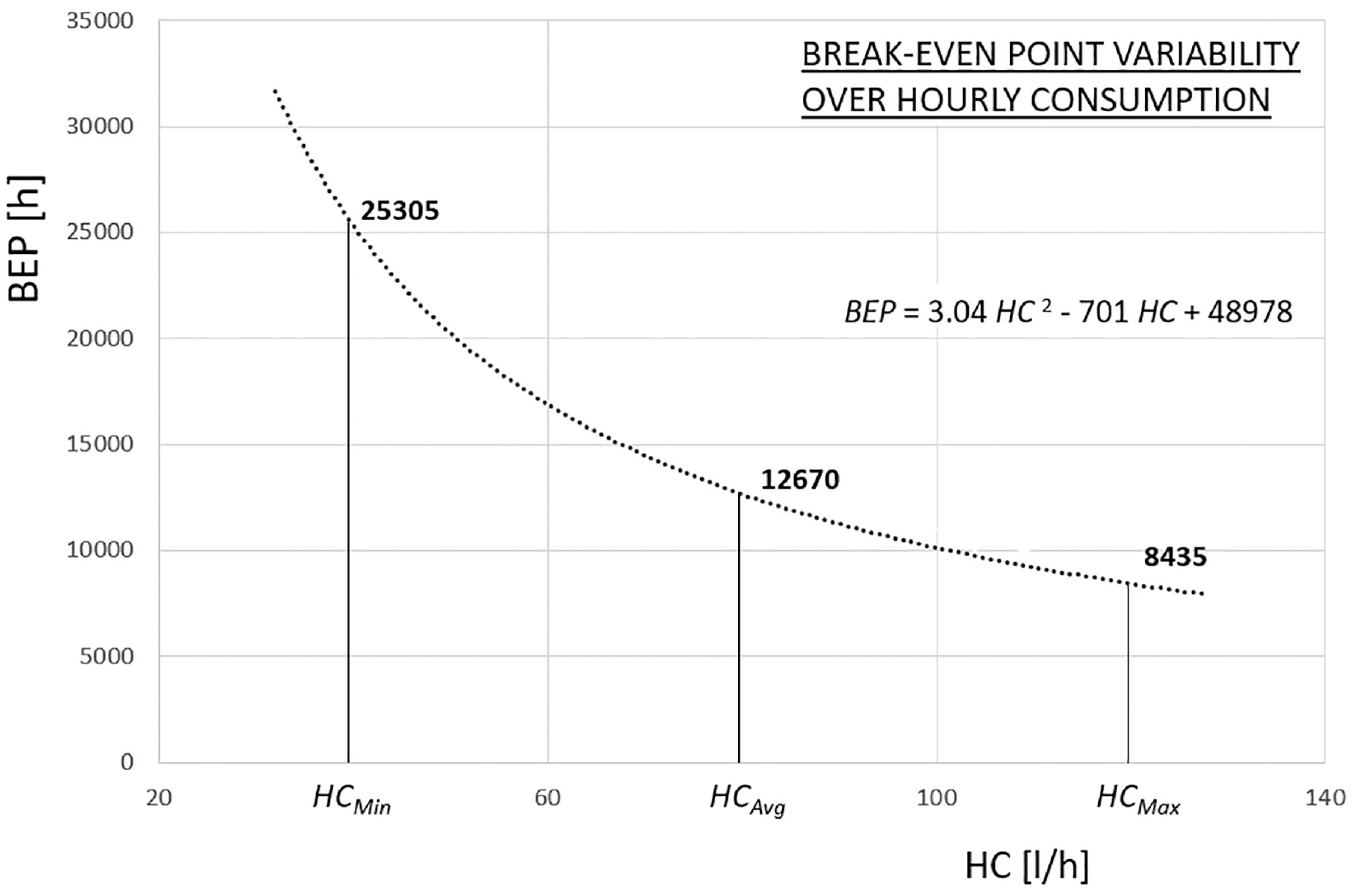
Variability of BEP in function of use stage hourly consumption.
Use stage scenarios
The discussion section closes with a scenario analysis on operation, this being undoubtedly the most influential LC stage. The analysis investigates the relevance on the overall LC impact of yacht consumption and life-time duration. The choice of these two parameters is made because they depend on operational boundary conditions (such as driving style, durability, and load conditions) which are strongly difficult to predict and therefore may involve a significant variation in total GWP. To this end, the study provides the definition of
- five consumption scenarios: HC_1 (40 l/h), HC_2 (60 l/h), HC_3 (80 l/h), HC_4 (100 l/h), HC_5 (120 l/h);
- seven duration scenarios: D_1 (10,000 h), D_2 (15,000 h), D_3 (20,000 h), D_4 (25,000 h), D_5 (30,000 h), D_5 (35,000 h), D_6 (40,000 h).
The variation of LC GWP (variation involved by CFER solution with respect to GFVR solution) is reported in Table 9 for each combination of consumption/LC duration scenarios (both in absolute and percentage terms). Data reveal that a change in yacht consumption and/or LC duration can cause a significant variation of impact, ranging from an increase of about 25% (for minimum values of consumption and life-time duration) up to a GWP reduction of more than 30% (for maximum values of consumption and life-time duration). For each consumption scenario the GWP decrease offered by lightweight solution grows at LC duration increasing; indeed, the beneficial effect of mass reduction lies exclusively in use stage and it becomes bigger while life-time increases. At the same time, the environmental profile takes advantage from higher consumption values (bigger GWP reduction while maintaining LC duration), since mass-induced use stage GWP becomes bigger at consumption level growing. Overall, the CFER design results to be environmentally beneficial for 27 out of 35 consumption/LC duration scenarios, as shown in Table 9.
Variation of LC GWP involved by CFER with respect to GFVR (both absolute and percentage variation).
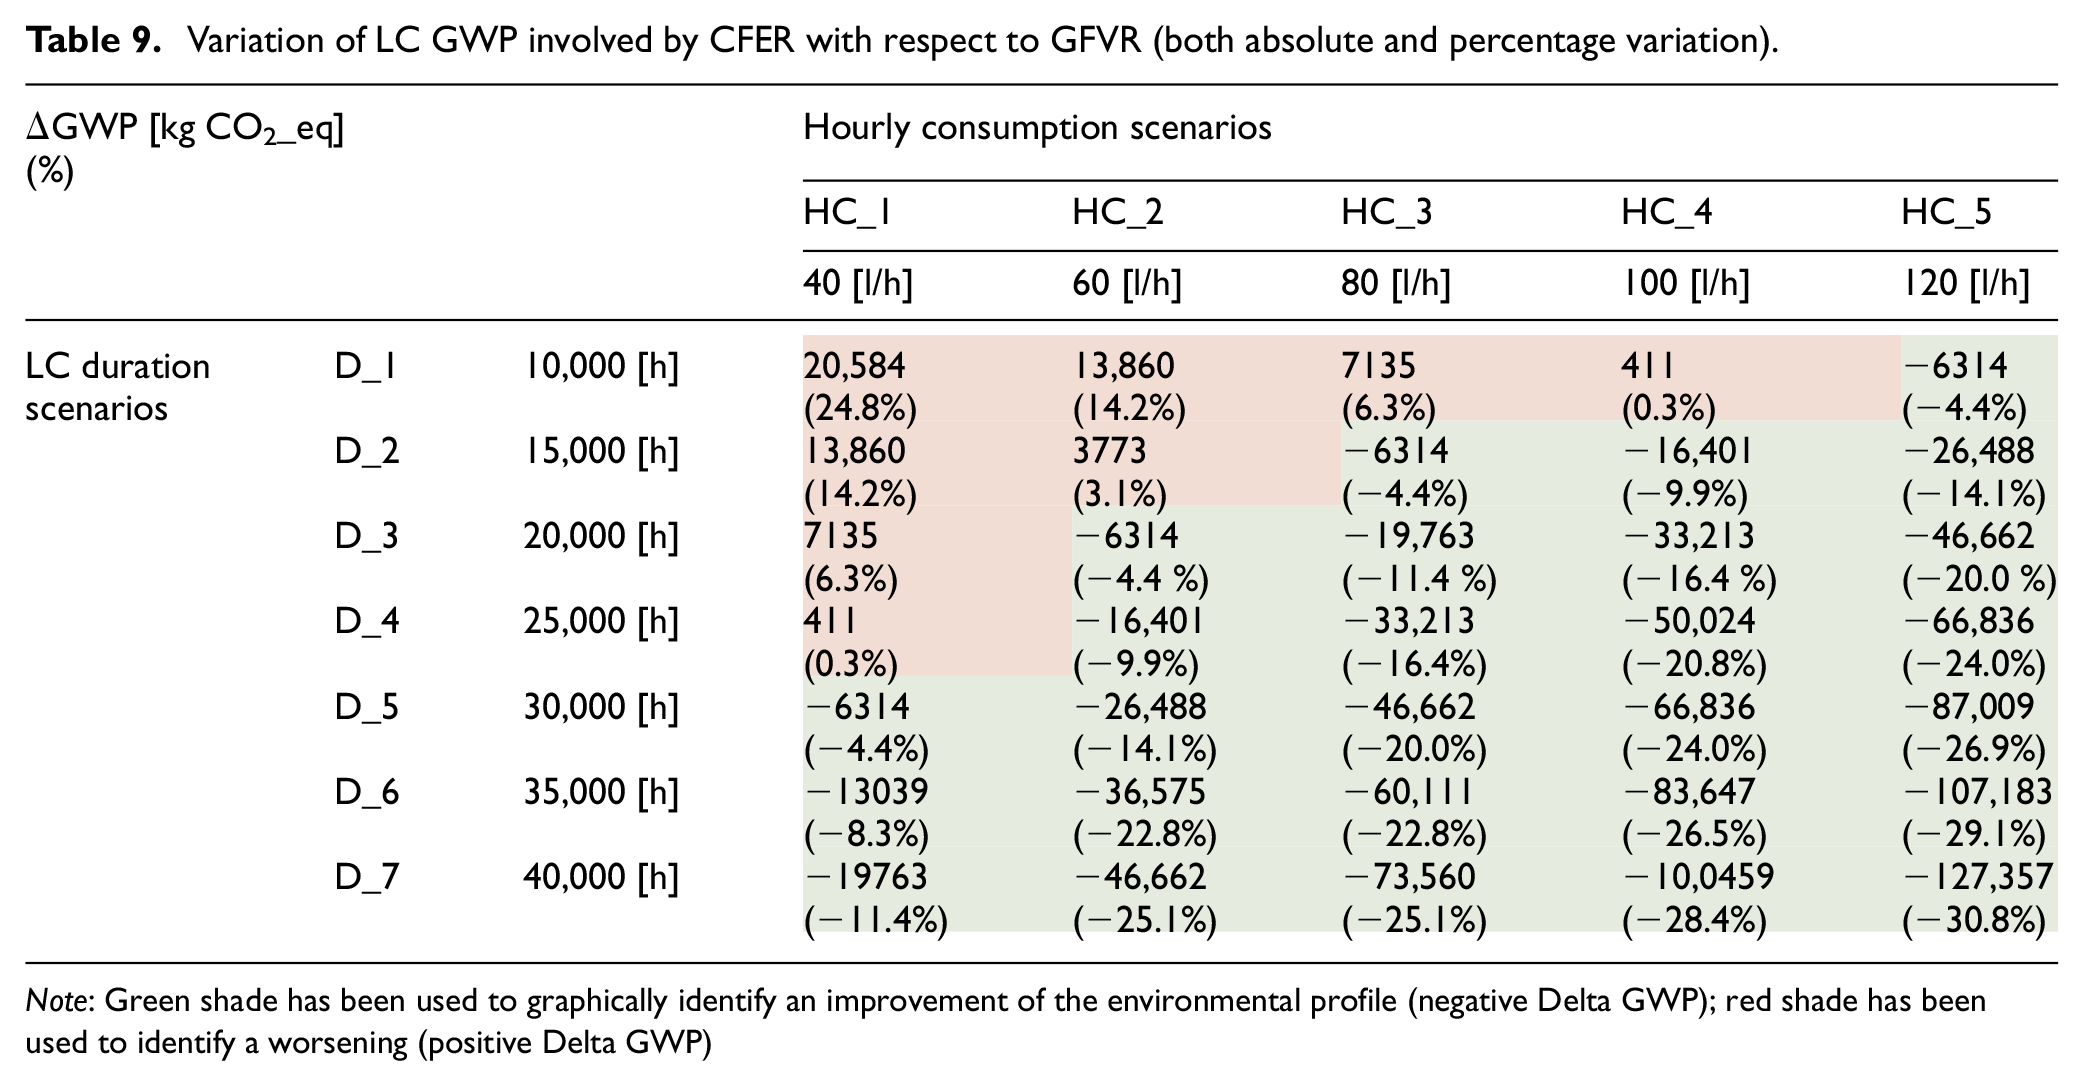
Note: Green shade has been used to graphically identify an improvement of the environmental profile (negative Delta GWP); red shade has been used to identify a worsening (positive Delta GWP)
Previous considerations on use stage scenarios are confirmed by Figure 8, which provides ΔGWP in function of life-time duration for all consumption scenarios. As shown, the trend is linear, with the absolute slope that increases at hourly consumption growing, which involves a reduction of the corresponding BEP LC duration. The diagram stresses that for life-time scenarios D_5, D_6, and D_7 the CFER superstructure is preferable for any consumption scenario. On the other hand, for lower durations the environmental convenience of the innovative solution strictly depends on the consumption level, with HC_5 being the only consumption scenario for which the lightweight design provides a GWP reduction regardless of LC duration considered.
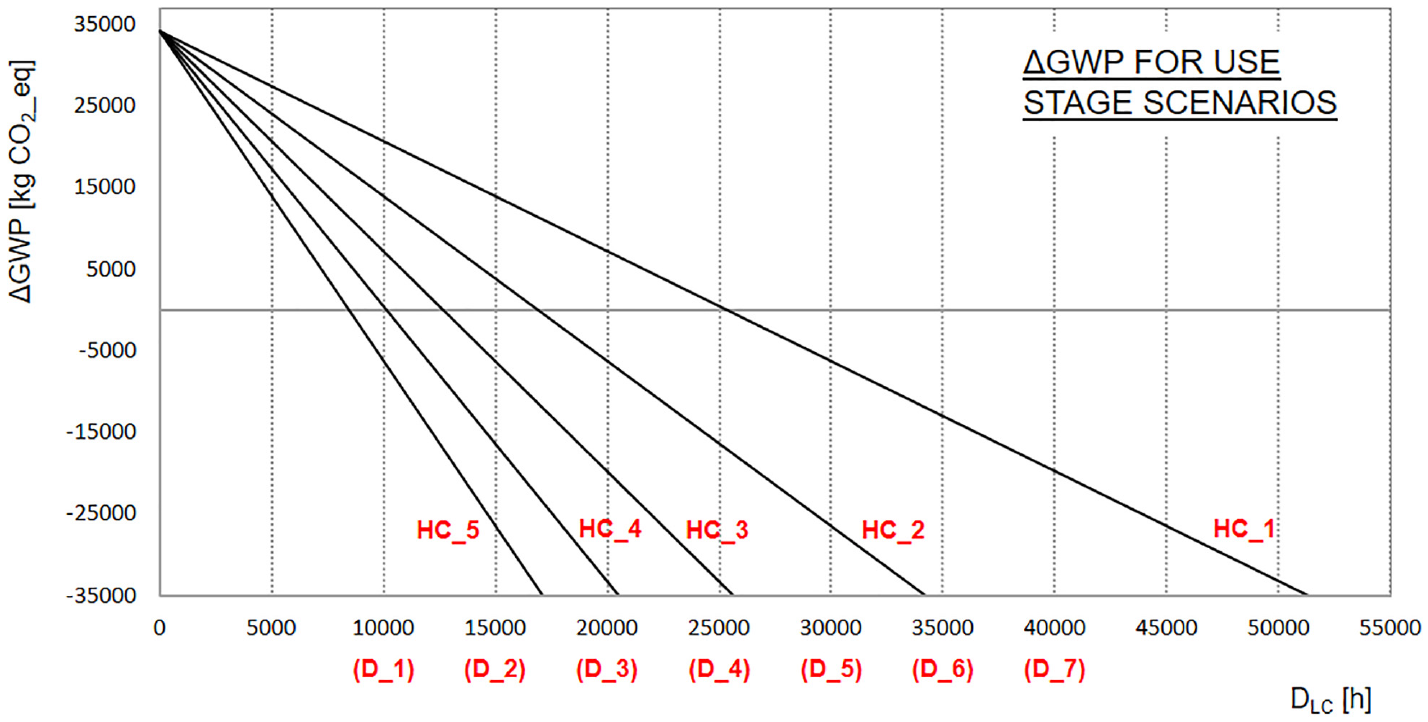
Variation of LC GWP GFVR/CFER in function of life-time duration for all consumption scenarios.
Conclusions
The paper deals with a comparative LCA in the maritime transportation field. The case study provides the comparison of two alternative design solutions for the superstructure of a yacht developed by the Azimut-Benetti company. The considered design options differ both in construction materials and in manufacturing processes, and these are Glass Fiber reinforced Vinylester-isophthalic Resin (GFVR) (assumed as the baseline solution) and Carbon Fiber reinforced Epoxy Resin (CFER) (assumed as the innovative lightweight solution). The impact is expressed in terms of Global Warming Potential (GWP) impact category, which is evaluated by the CML2001 Life Cyle Impact Assessment (LCIA) method. As regards system boundaries, the analysis investigates the overall LC of the superstructure component, highlighting contributions of the following stages: production (wich is split into raw materials, manufacturing and transportations), use (that includes fuel supply and exhaust air emissions) and End-of-Life (EoL). Data collection for Life Cycle Inventory (LCI) is mainly based on primary data, these being material composition of the component, materials/energy consumption during manufacturing and fuel consumption during operation. For the LCI modeling of raw materials and fuel supply chain secondary data coming from GaBi6 database (v2022.1) are used.
Results show that the vast majority of GFVR GWP is associated with use stage (about 76%), while for the CFER design production and use stage quota are comparable (around 49%). Such a results is due on one hand to the bigger weight of the GFVR design (which involves a higher amount of fuel and operation emissions associated with component life-time) and on the other hand to the strongly greater specific impact of the supply chain of carbon fibers, which are extensively used in the CFER design. As regards the comparison, the innovative solution provides a relevant GWP benefit (16%–17%) when considering the entire LC of the superstructure. Such a positive effect is primarily associated with the big saving in component mass (around 44%), which involves the same percentage reduction in GWP of both fuel supply and emissions during operation. That said, this very high decrease in use phase is partially counterbalanced by a decisive growth in production stage, mainly associated with decreased amount of fuel needed and lowered CO2 exhaust emissions. The sensitivity analysis reveals that the break-even point for the environmental convenience of the lightweight design occurs at a relatively high value of component LC duration (12,670 h, which is around 51% of the reference life-time for the study). For higher durations the benefit offered by the innovative design lineraly grows (due to the direct proportionality between use stage GWP and life-time), with a value of about 100,500 kg CO2 eq at 50,000 h; that said, when considering very high values of life-time (even bigger than 50,000 h) the percentage GWP saving is in the region of 28%–29%. The paper investigates also the effect that the specific consumption of the yacht has on the break-even point. Results show that at diesel consumption level increasing the break-even point reduces, passing from 25,305 h (assuming the minimum consumption of 40 l/h) to 8435 h (assuming the maximum consumption of 120 l/h). This result can be explained through the fact that an increase in yacht consumption makes bigger the influence of use stage on the overall LC GWP, with also increased environmental benefits achievable through lightweight design. Finally, a use stage scenario analysis is carried out which quantifies the combined effect on overall LC GWP of consumption level and life-time duration: results show that the CFER design takes advantage from an increase in both operation parameters.
Supplemental Material
sj-docx-1-pim-10.1177_14750902231173470 – Supplemental material for LCA approach for environmental impact assessment within the maritime industry: Re-design case study of yacht’s superstructure
Supplemental material, sj-docx-1-pim-10.1177_14750902231173470 for LCA approach for environmental impact assessment within the maritime industry: Re-design case study of yacht’s superstructure by Francesco Del Pero, Caterina Antonia Dattilo, Alessandro Giraldi and Massimo Delogu in Proceedings of the Institution of Mechanical Engineers, Part M: Journal of Engineering for the Maritime Environment
Footnotes
Declaration of conflicting interests
The author(s) declared no potential conflicts of interest with respect to the research, authorship, and/or publication of this article.
Funding
The author(s) disclosed receipt of the following financial support for the research, authorship, and/or publication of this article: Activities described here were conducted under Grant CTN01_00176_163601, Project TRIM (Technology and Industrial Research for Maritime Mobility), coordinated by National Research Council of Italy, funded by the Ministry of Education, University and Research within the National Technology Clusters initiative.
Supplemental material
Supplemental material for this article is available online.
References
Supplementary Material
Please find the following supplemental material available below.
For Open Access articles published under a Creative Commons License, all supplemental material carries the same license as the article it is associated with.
For non-Open Access articles published, all supplemental material carries a non-exclusive license, and permission requests for re-use of supplemental material or any part of supplemental material shall be sent directly to the copyright owner as specified in the copyright notice associated with the article.