
Abstract
Electric discharge machining has been established as an effective alternative process to conventional material removal processes for machining reinforced metal matrix composites. Wire cut electric discharge machining holes were produced in a metal matrix composite (10 vol% of SiC in Al6061), which were then investigated to determine the machinability of the material using this process. It was observed that the input factors such as the size of reinforced particles, wire tension and pulse-on time significantly affect diameter error, circularity and surface roughness. Pulse-on time, the interaction between pulse-on time and wire tension contribute to the maximum diameter error. The wire tension is the most significant factor to circularity, which is followed by the interaction between pulse-on time. In particular, wire tension with low and high tensions results in poor circularity. It has been found that there are more surface defects encountered when particle sizes are smaller, and circularity is improved when particles are in a medium size. In addition, the surface defect is reduced as the particles increase the melting resistance of the surface. The higher pulse-on time leads to higher heat and more time to degrade the surface. Therefore, low pulse-on time and wire tension gave better surface finish.
Keywords
Introduction
Metal alloys that are increasingly hard to be machined are currently being used to produce components, as these materials possess desirable qualities required by aerospace and automobile industries. Non-traditional manufacturing processes are gradually used to produce these parts, particularly via wire electric discharge machining (WEDM). Components to be cut are submerged in a dielectric liquid, where an electrical discharge takes place. 1 A discharge channel is created when the temperature reaches approximately 12,000 °C, removing material by evaporation and melting, which is flushed away by the dielectric fluid. A heat-affected zone (HAZ) is formed when the discharge ceases, due to the high cooling rate on the workpiece surface. Electric discharge machining (EDM) is governed by Faraday’s law, and the resulting thermal effect not only removes material from the workpiece but also changes metallurgical constituents at the HAZ.2,3
The high cost of machining metal matrix composites (MMCs) has reduced the application uptake of these advanced materials.4,5 Typically, to date, they have been machined with either an electroplated diamond-grinding wheel or carbide or polycrystalline diamond cutting tools for a conventional machining process. Non-contact material removal processes such as WEDM is an attractive alternative 6 as it eliminates the requirement for expensive tooling.7,8 Research on the EDM process for MMC components includes the assessment of die sink EDM MMCs reinforced with Al2O3 as well as corresponding matrix material (Al6061), as mentioned in Mouangue et al. 9 It is suggested that the tool wear rate and material removal rate are acceptable at low peak current, short time and longer off time. The performance of WEDM cutting MMCs is less effective when compared with Al6061 material because the removal rate is less, and thus, the tool wear is increased. Also, the off time increases as opposed to Al6061 material. Singh et al. 10 implemented the analysis of variance (ANOVA) and established the optimal levels for maximising the responses. It was noted that material removal rate was found to be higher for larger current and pulse-on time settings at the expense of side taper, radial overcut and surface finish. Tool wear rate for MMCs was also found to increase for larger current settings. Garg et al. 6 reviewed sinking EDM, WEDM and powder-mixed EDM of MMCs, all of which were intended to enhance the capability of machining performance and improve output and working conditions. Khan and Singh 11 performed EDM on MMCs (i.e. Al-SiC composites) by non-rotating and rotating electrodes. Material removal rate and electrode wear rate were the response variables in the cutting tests, and input parameters were pulse-on time, pulse-off time, voltage and peak current. Results show that material removal rate and tool wear rate are increased for rotating electrodes. Lal et al. 12 investigated the effect of pulse-on time, pulse-off time, pulse current and wire drum speed on the material removal rate for Al7075/7.5%SiC/7.5%Al2O3 MMCs. Taguchi method was used for parameter optimisation, and the level of importance was determined from ANOVA. The pulse-on time was the most significant parameter that contributed to the maximum (46.04%), the material removal rate (46.04%), followed by pulse current (34.72%), pulse-off time (10.23%) and interaction between pulse-on time and pulse-off time (5.46%). The wire drum speed had insignificant effect on the material removal rate. Tian et al. 13 introduced a probabilistic design system to analyse the effects of machining parameters during EDM. Monte Carlo simulation method and response surface method were both used in the sensitivity analysis. Discharge voltage, peak current, pulse-on time and discharge channel radius are selected as design variables. The results of sensitivity analysis meet the confidence limit of 0.95. The discharge voltage and peak current significantly affect the EDM process, whereas the pulse-on time and discharge channel radius have minor influence. Moreover, the increase in discharge channel radius can reduce the material removal rate. Conversely, the increase in other parameters can increase the material removal rate. Amini et al. 14 used an L32 orthogonal array based on the Taguchi method for design of experiments. Process modelling was carried out using a multilayer neural network to determine the most effective parameters on material removal rate and surface roughness. However, a genetic algorithm was used to optimise the process performance of WEDM. The optimisation results are shown to be in good agreement with experimental outputs. Rozenek et al. 15 showed the effects of discharge current, pulse-on time, pulse-off time and voltage on the machining feed rate during WEDM of MMCs reinforced with SiC and Al2O3 particles in AlSi7Mg alloy. The characteristics of WEDM of MMCs are similar to those of the base material (AlSi7Mg aluminium alloy). The maximum cutting speed for AlSi7Mg/SiC and AlSi7Mg/Al2O3 composite materials is approximately 3 times and 6.5 times lower than the cutting speed of aluminium alloys, respectively.
Little research in analysing diameter error and circularity during WEDM of MMCs reinforced with particles of different sizes has been discussed in previous literature review. Diameter error and circularity are regarded as important parameters in defining dimensional accuracy and tolerance of machined components. As a consequence, this research is to investigate the effects of reinforcement size, pulse-on time and wire tension on the diameter error, circularity and surface roughness during WEDM machining of MMCs.
Scope
The accuracy specification of machined holes is normally represented by their diameter error and circularity as the most important parameters. Diameter error is the difference between the measured diameter and the designed diameter, where a positive error indicates overcutting of the hole. When cylindrical fit is necessary, diameter error is the most important characteristic of a machined hole. Circularity, also known as roundness, is another important quality characteristic. Circularity is defined by two concentric circular boundaries, within which each circular element of the surface must lie. 16 It is particularly important for rotating component parts where excessive circularity values may cause unacceptable vibration and heat. Another important quality parameter for examining is surface finish, as it is significant with respect to wear, corrosion, fatigue, noise, load-carrying capacity, heat transfer and many others. Surface roughness represents the random and repetitive deviations of a surface profile from the nominal surface and can be expressed by a number of factors. Unfortunately, no single factor appears to be capable of adequately describing the surface quality. For convenience, the arithmetic average was adopted to represent surface roughness, since it is commonly used and is internationally accepted. Therefore, these quality parameters were employed to study the suitability of using WEDM machine to produce holes in MMC workpieces.
The quality parameter data were analysed by applying two static techniques including Pareto ANOVA and Taguchi’s signal-to-noise (S/N) ratio analysis. In the traditional ANOVA, average response values have been used. This strategy is particularly suitable for monitoring trends or changes in the relationship of variables. However, it does not provide the complete representation because it normally does not include data on the response scattering. The Pareto ANOVA is a method for determining the contribution of each input parameter and their interactions with output quality parameters. Further details on Pareto ANOVA can be found in Park. 17
To optimise the robustness of manufacturing process data, the Taguchi statistical method is used in applying S/N ratio to the data. The S/N ratio can be calculated using the following formula based on ‘the smaller the better’ criterion 18
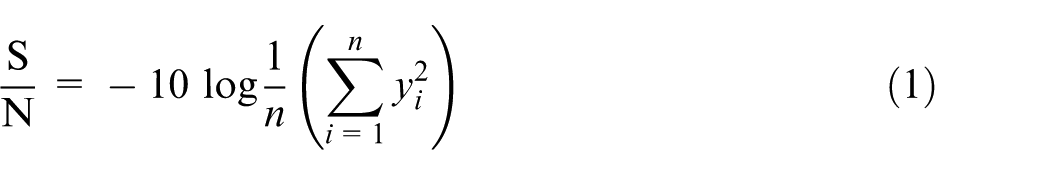
where n is the number of observations and y is the observed data.
The higher the value of the S/N ratio, the better the result becomes since it guarantees the highest quality with a minimum variance. An expanded explanation of the Taguchi method can be found elsewhere in Ross. 18 This research is limited to MMCs with three different reinforcement sizes –0.7, 3 and 13 µm – as there is a wide range of materials available for turning operations.
Experiment procedure
The hole cutting test data were obtained from a FANUC ROBOCUT α-0iD WEDM machine with a fixed input condition for each test. The machining conditions were as follows:
Wire speed: 10 m/min;
Flushing rate: 10 L/min;
Open circuit voltage: 85 V;
Servo voltage: 44 V;
Wire electrode (WE) zinc-coated brass wire of diameter: 0.25 mm;
Reinforced particle size: 0.7, 3 and 13 µm;
Wire tension: 600, 1200 and 1800 gf;
Pulse-on time: 2, 3 and 4 µs.
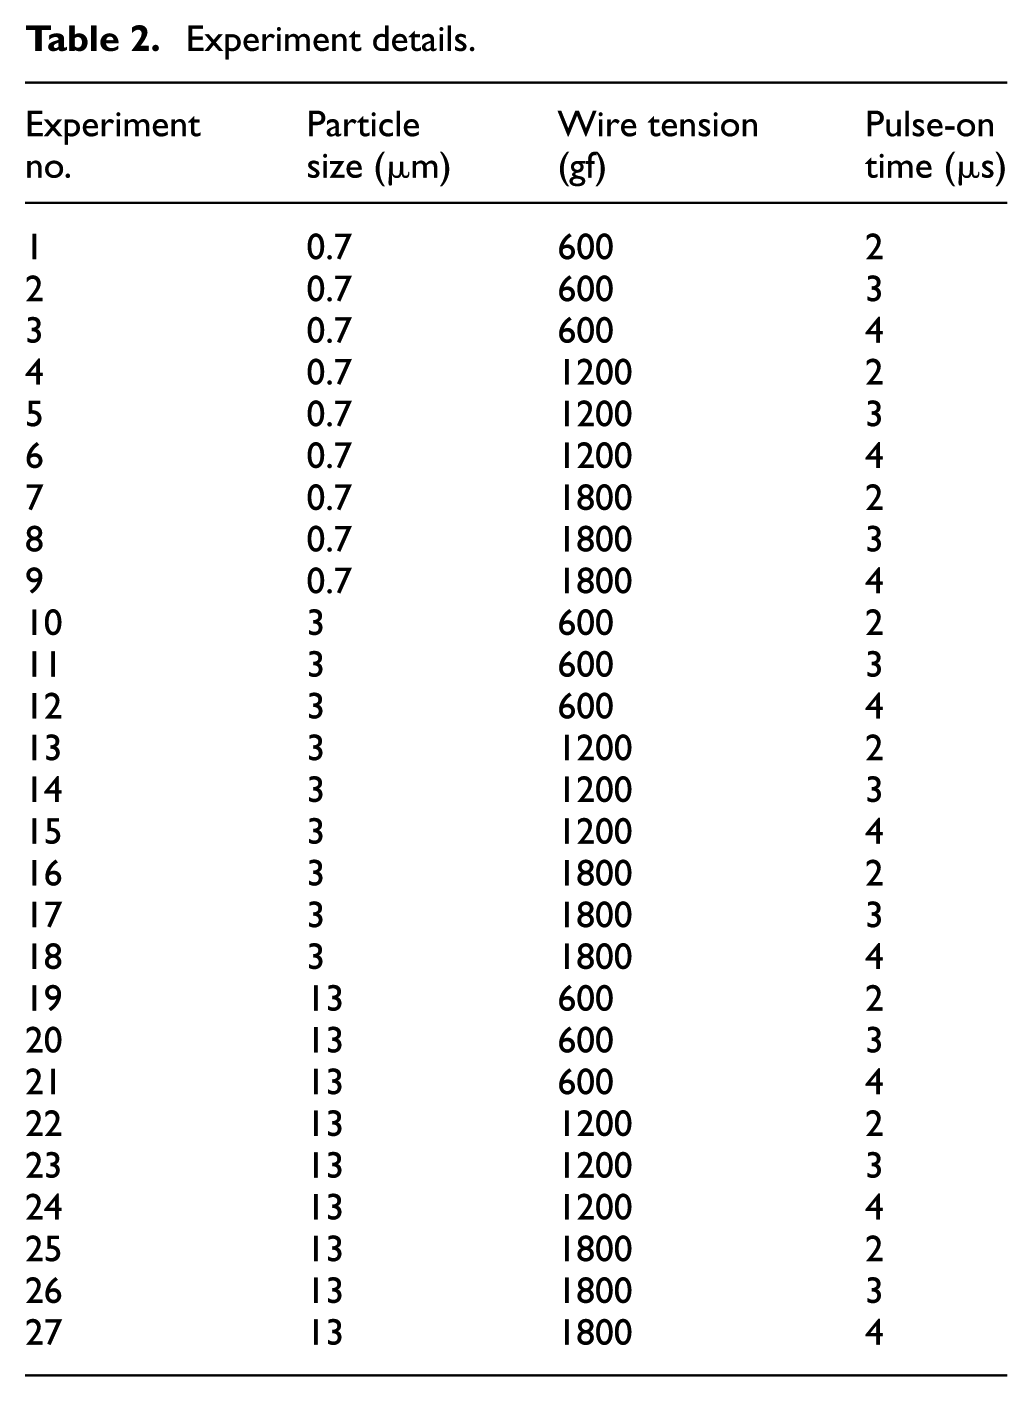
The experimental test procedure was prearranged using Taguchi’s L27 (313) orthogonal array, ensuring all the parameters were robustly examined. A copy of L27 (313) array is available in Taguchi and Taguchi. 19 A total of 27 holes were machined, namely, nine holes for each of three particle-reinforced MMCs. The output quality parameters were measured for diameter error, circularity and surface roughness.
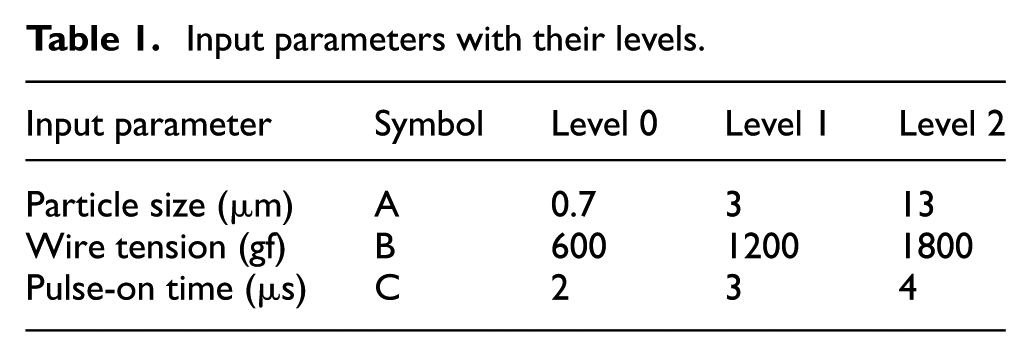
The workpieces in cutting tests were made from a rectangular plate of MMCs with the dimensions shown in Figure 1. Each workpiece is used for nine tests of different combinations of control parameters for each test. The control parameters and their levels used for analysis of first three groups are shown in Table 1, and the details of all experimental tests are given in Table 2.

Dimensions of a workpiece and holes.
Input parameters with their levels.
Experiment details.
A Discovery Model D-8 coordinate measuring machine (CMM) was used to determine the precision of the cut hole, using the Renishaw probe in a star configuration for convenience. The diameters of cut holes were determined using the standard built-in software of the CMM. Eight coordinate points were measured for establishing the diameter, and each coordinate measurement was repeated three times. These coordinate data were also used to find the circularity of every cut hole. The surface roughness parameter for each turned surface was determined (arithmetic average (Ra)) using a tally surf Surftest SJ-201P.
Results and analysis
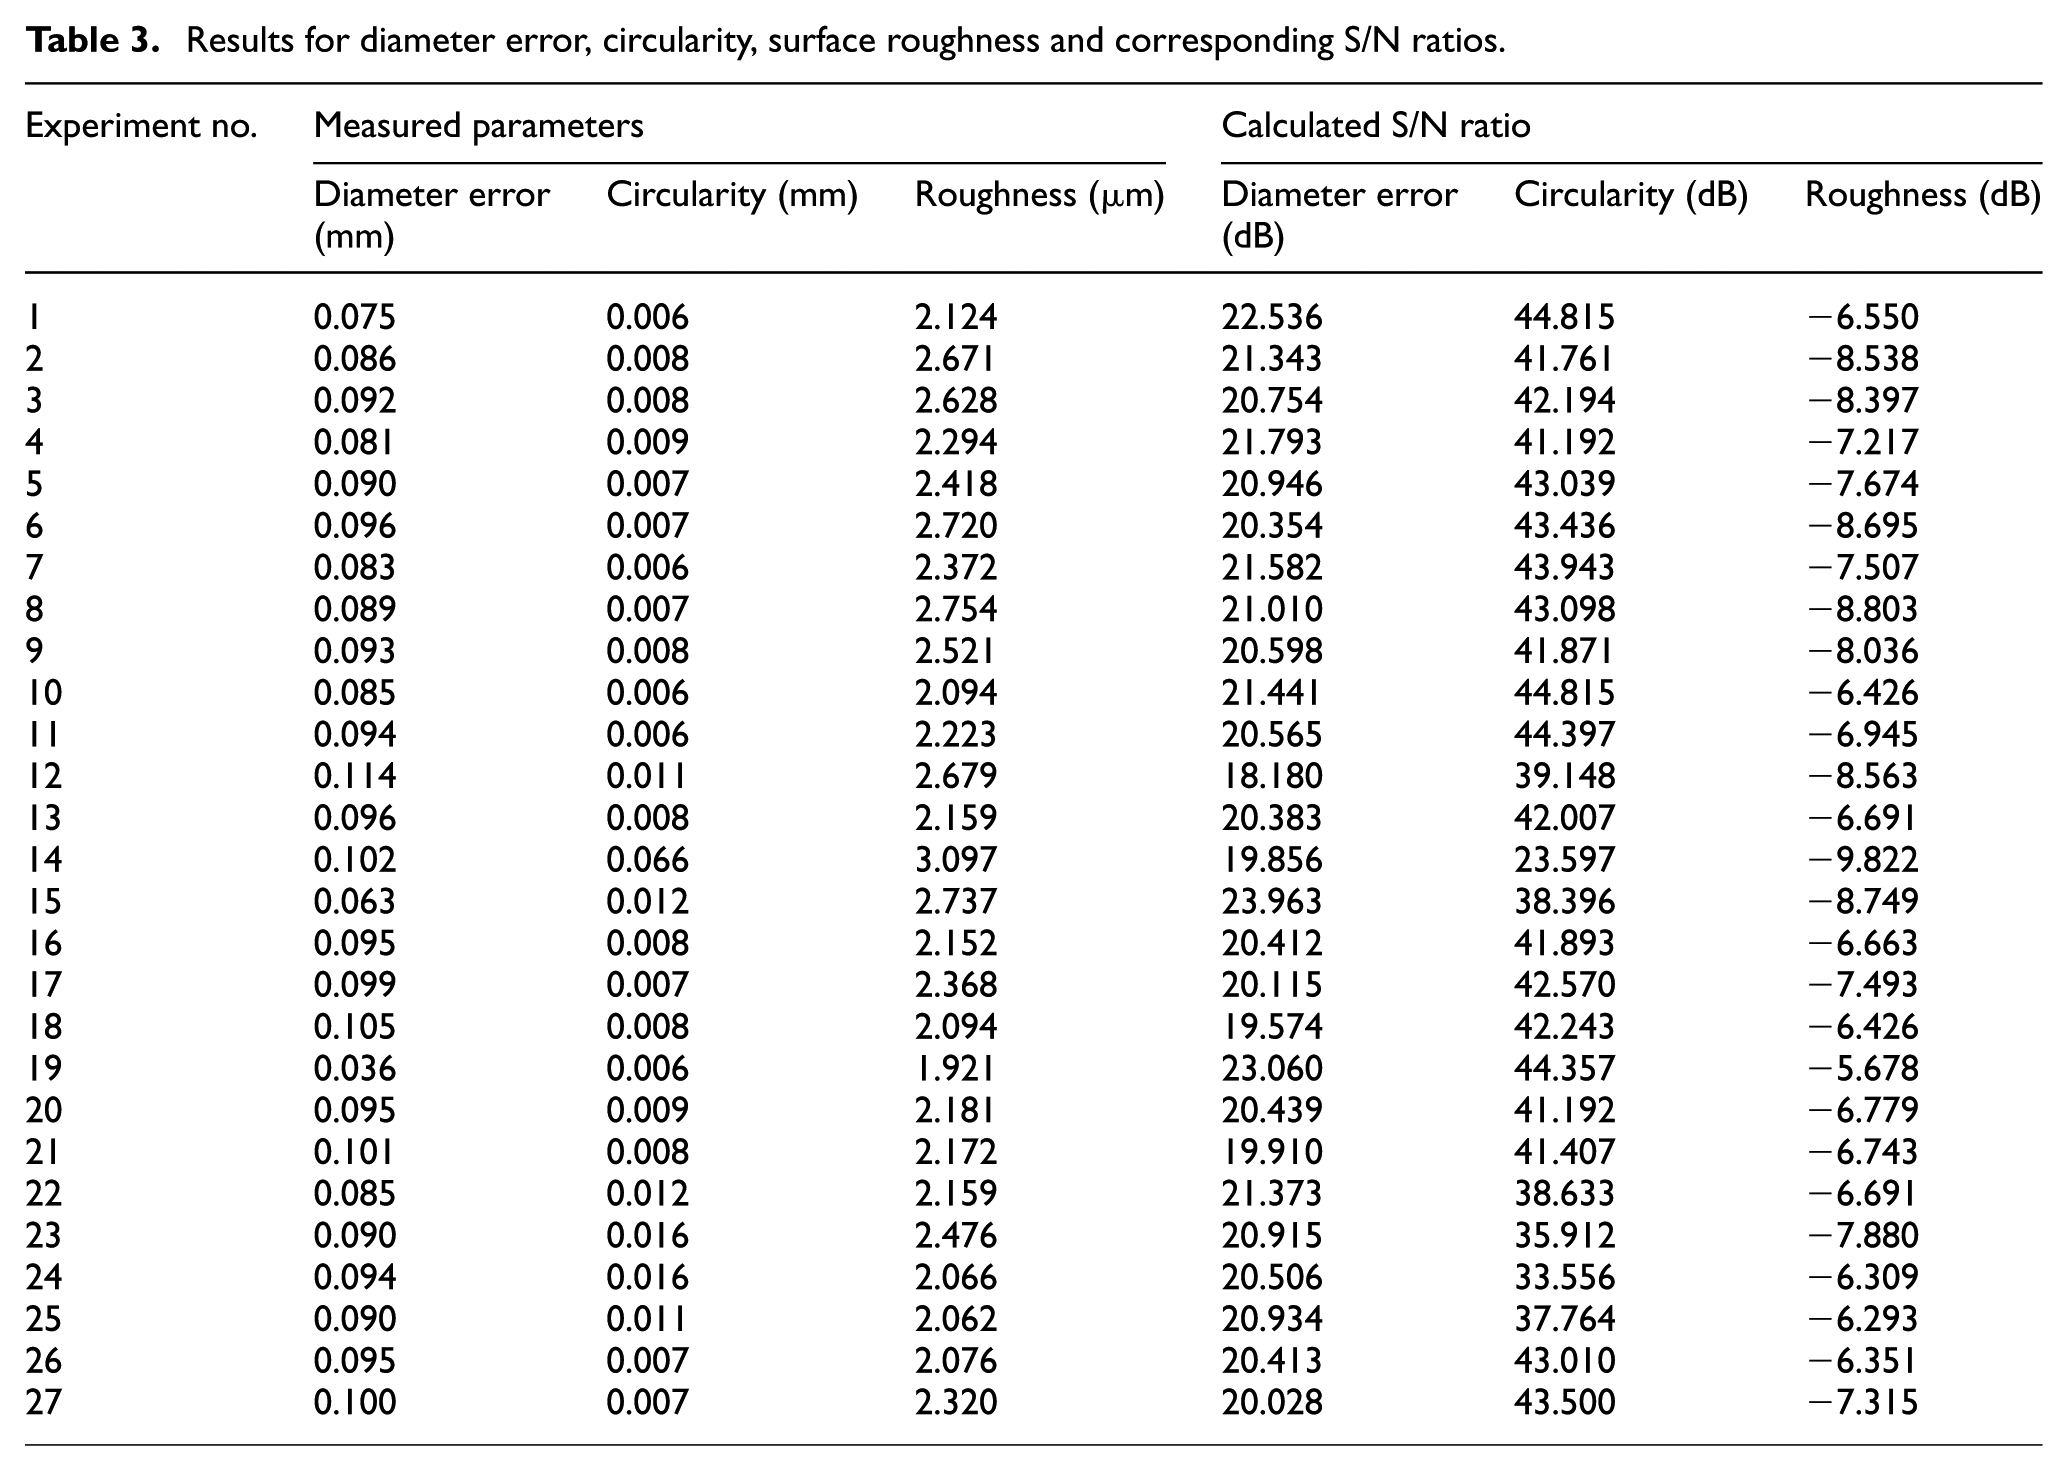
Due to the substantial amount of coordinate data and space constraints, only a sample of coordinate data has been presented in this article. For the analysis of the workpieces, all the data were considered. The multi-variability of data obtained allowed workpiece data to be present in a number of ways, with a Pareto ANOVA being conducted on all quality test parameters. The adopted format was chosen carefully to maximise the clarity of the presentation. Experimental results for diameter error, circularity, surface roughness and their corresponding S/N ratios are summarised in Table 3.
Results for diameter error, circularity, surface roughness and corresponding S/N ratios.
Diameter error
The Pareto ANOVA for diameter error given in Table 4 reveals that pulse-on time (C) has the most significant effect on diameter error with a influence ratio (P ≅ 25.25%), followed by the interaction between wire tension and pulse-on time (B × C; P ≅ 25.19%) which has almost similar contribution to that of pulse-on time. The contributions of particle size (A) and the interaction between particle size and wire tension (A × B) are almost comparable (9.87% and 9.04%, respectively). It is worth noting that the total influence of main effects is about 41.40%, compared to total impact of the interaction effects at 59.60%, thus making it difficult to optimise the diameter error by the selection of input parameters.
Pareto ANOVA for diameter error.
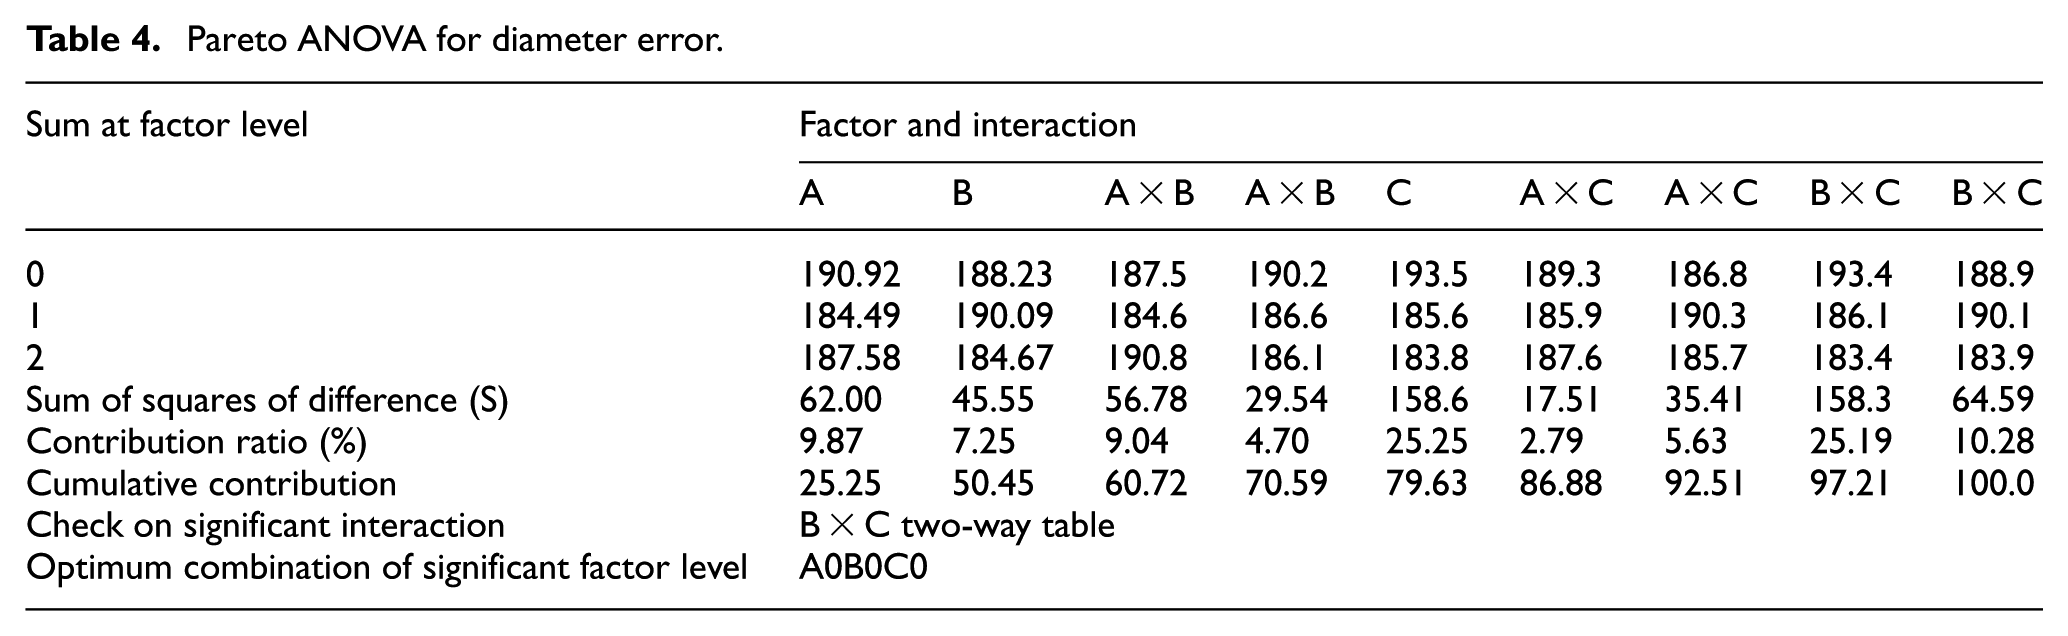
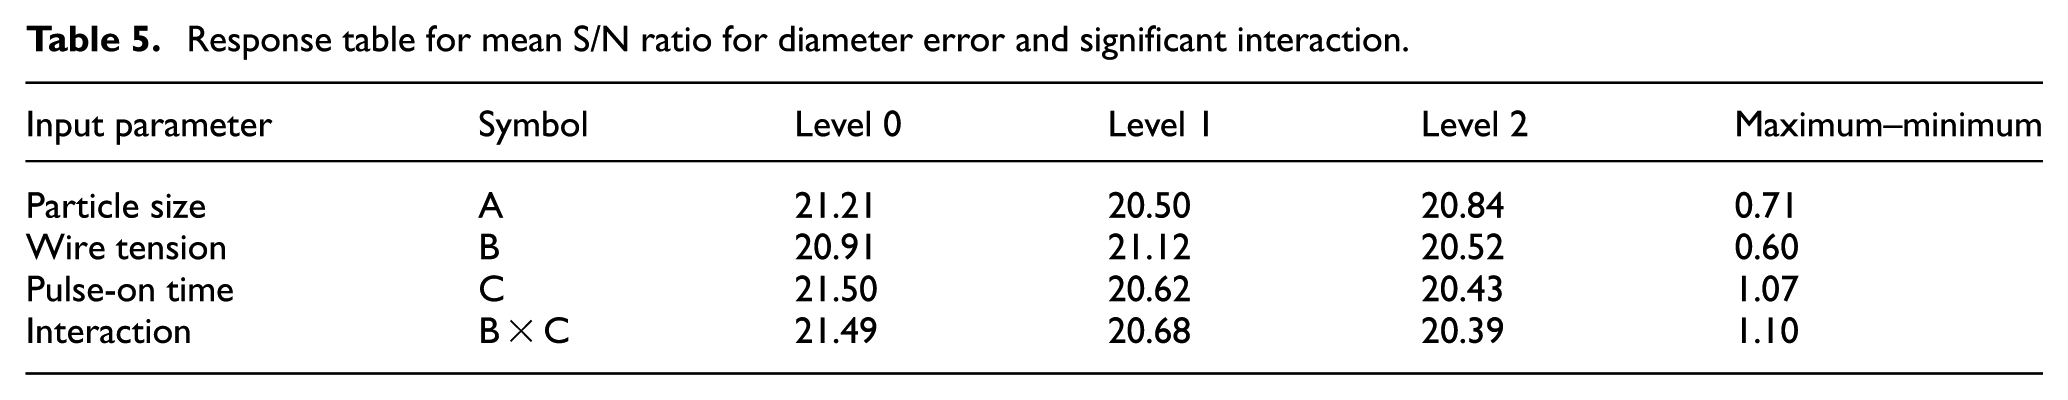
The response table and graphs for diameter error are shown in Table 5 and Figure 2, respectively, with the slopes of response graphs, representing the strength of the influence as confirmed by the ANOVA in Table 4. The low particle size (A0) was the best particle size to achieve a low diameter error as shown in Table 5. Since the interaction of B × C is significant, the B × C two-way table has been applied to select the optimum levels of B and C (see Appendix 1). The optimum combination of factors B and C in order to achieve the lowest diameter error was determined as B0C0. Therefore, the best combination of input variables for minimising diameter was determined as A0B0C0, which is based on a low level of reinforcement size (0.3 µm), the lowest level of wire tension (600 gf) and a low level of pulse-on time (2 µs).
Response table for mean S/N ratio for diameter error and significant interaction.
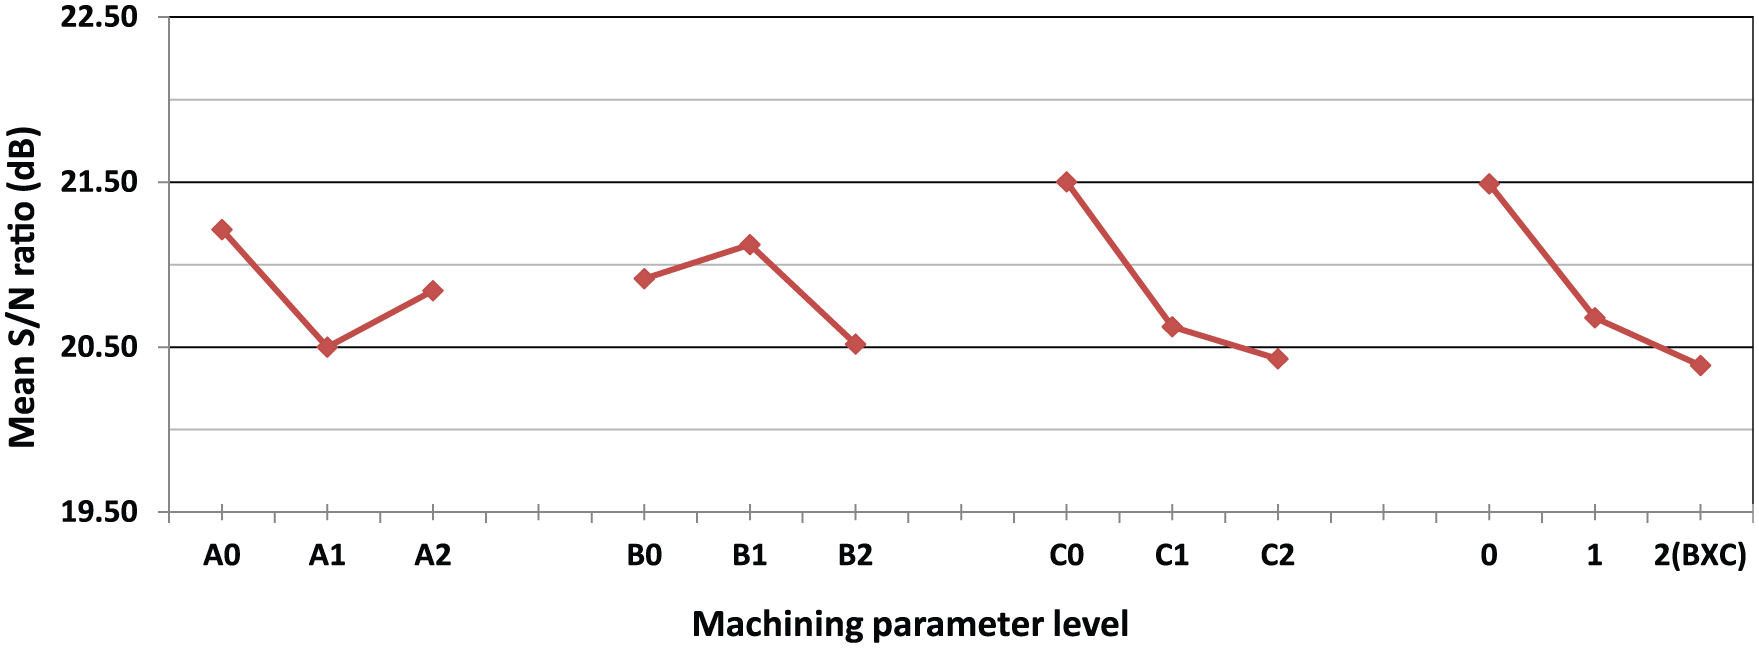
Response graph of S/N ratios for diameter error.
The average variation of diameter error as the traditional method for analysing the diameter error illustrates that the smaller pulse-on time gives smaller errors as shown in Figure 3. Similarly, the error decreases with the decrease in wire tension, and it is the lowest at lowest wire tension (600 gf). As illustrated in Figure 3, a similar conclusion can be drawn through the Taguchi method (A0B0C0). It is evidently seen that the diameter error has a minimum range.
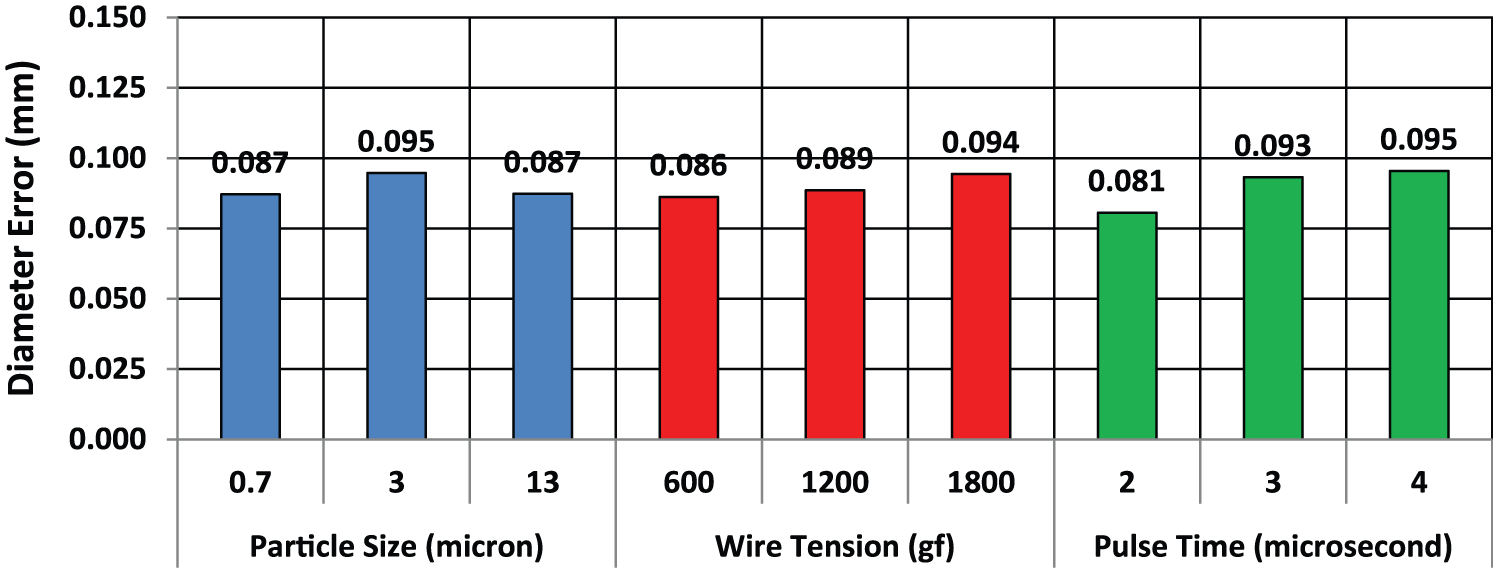
Average diameter errors for three parameters.
Circularity
The Pareto ANOVA for circularity given in Table 6 indicates that wire tension (B) has the most significant effect on circularity with a contribution ratio (P ≅ 36%), followed by the interaction between pulse-on time and wire tension (B × C; P ≅ 17%), particle size (A; P ≅ 14%) and interaction between particle size and wire tension (A × B; P ≅ 9% and 7%). The connections between reinforcement size and wire tension (A × B) and between reinforcement size and pulse-on time (A × C) also played a part, with an influence of 10.81% and 10.45%, respectively. The total contribution of the main effects is about 50%, compared to that of the interaction effects of 50%, also making it difficult to optimise the circularity error by the selection of input parameters.
Pareto ANOVA for circularity.
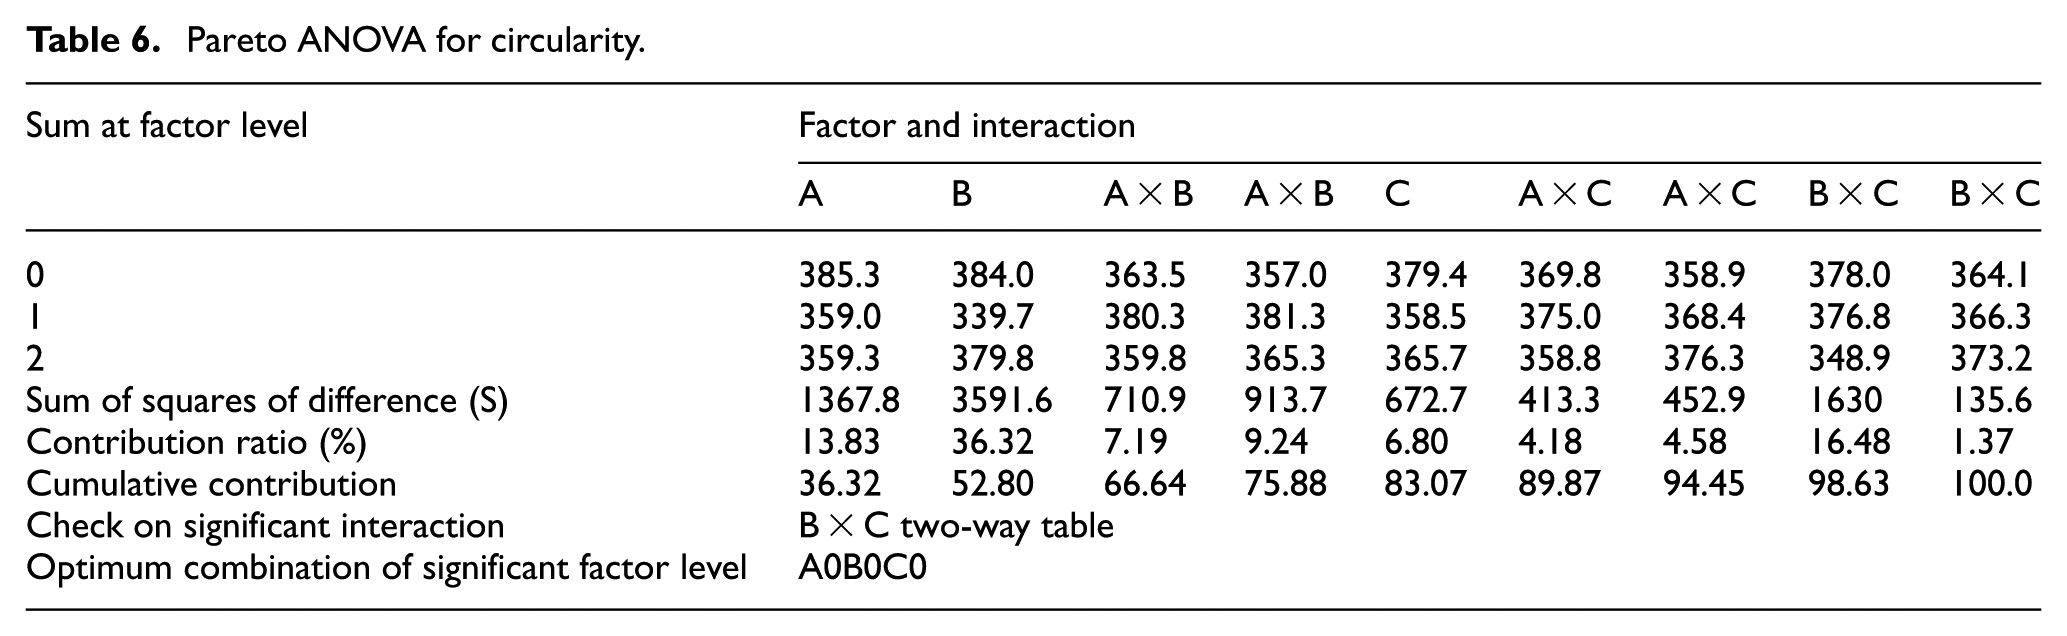
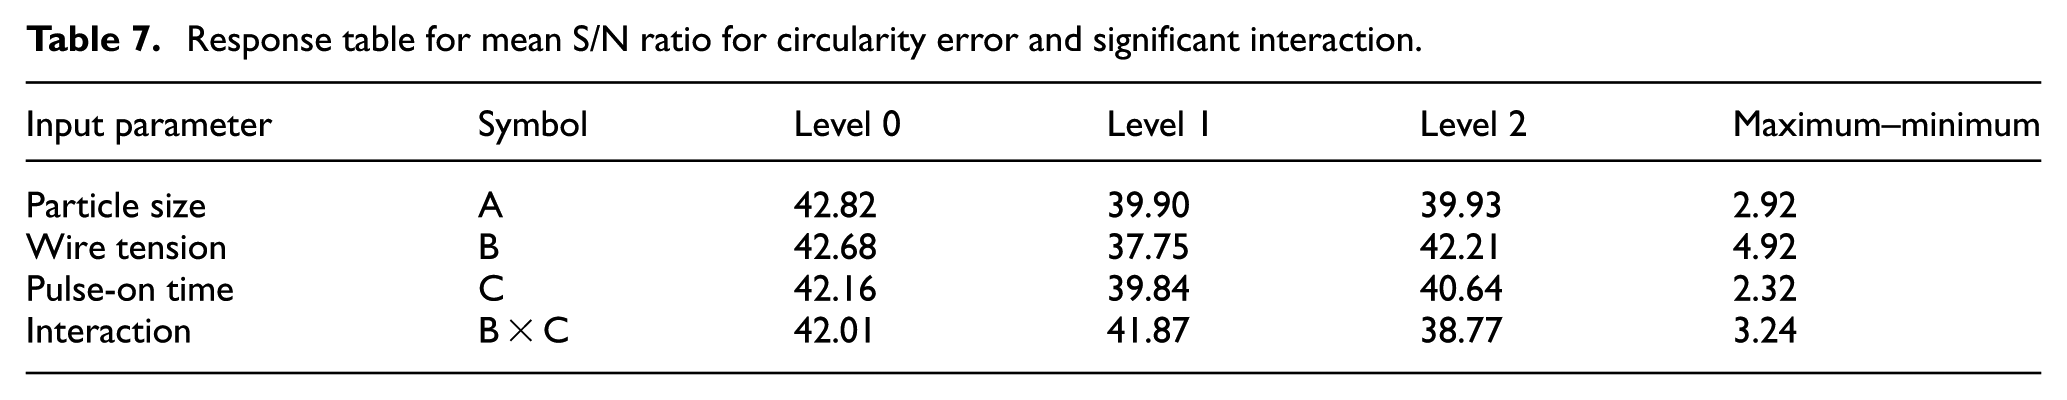
Response graph in Figure 4 confirms the findings of the Pareto ANOVA given in Table 6. The low level of reinforcement size (A0) is the best combination as shown in Table 7. As the interaction B × C was significant, B × C two-way table was applied to select their levels (see Appendix 1). From the B × C two-way table, the optimum combination of factors B and C in order to achieve the best circularity was determined as B0C0. Consequently, the best combination of input variables for minimising circularity was determined as A0B0C0, having a low level of reinforcement size (0.3 µm), the lowest level of wire tension (600 gf) and a low level of pulse-on time (2 µs).
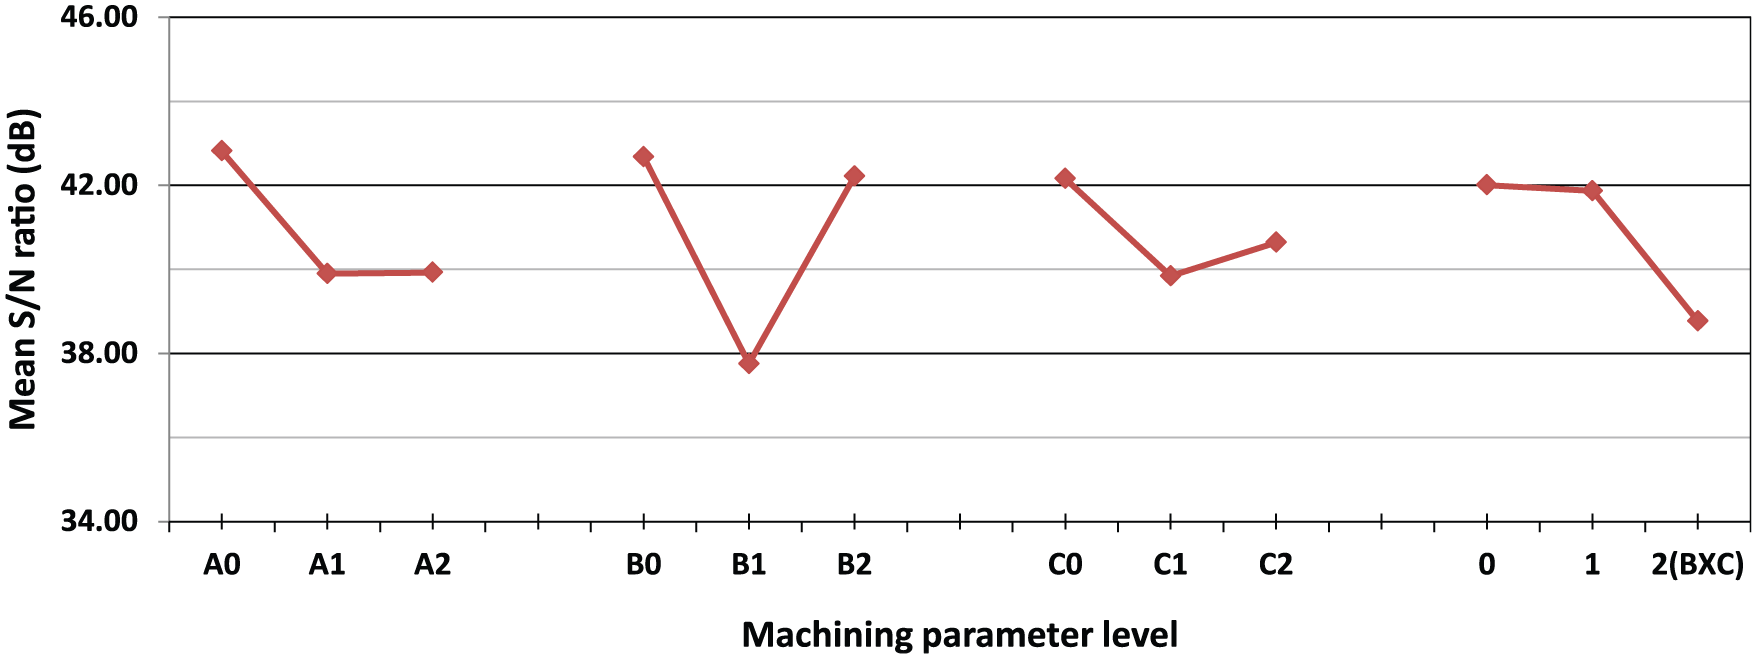
Response graph of S/N ratios for circularity.
Response table for mean S/N ratio for circularity error and significant interaction.
The tradition analyses for circularity are presented in Figure 5, which shows the average variation of circularity. The low level of particle size (0.7 µm), low level of wire tension (600 gf) and low level of pulse-on time (2 µs) give the best result. The analysis of Figure 5 leads to the similar conclusion reached through the Taguchi method.
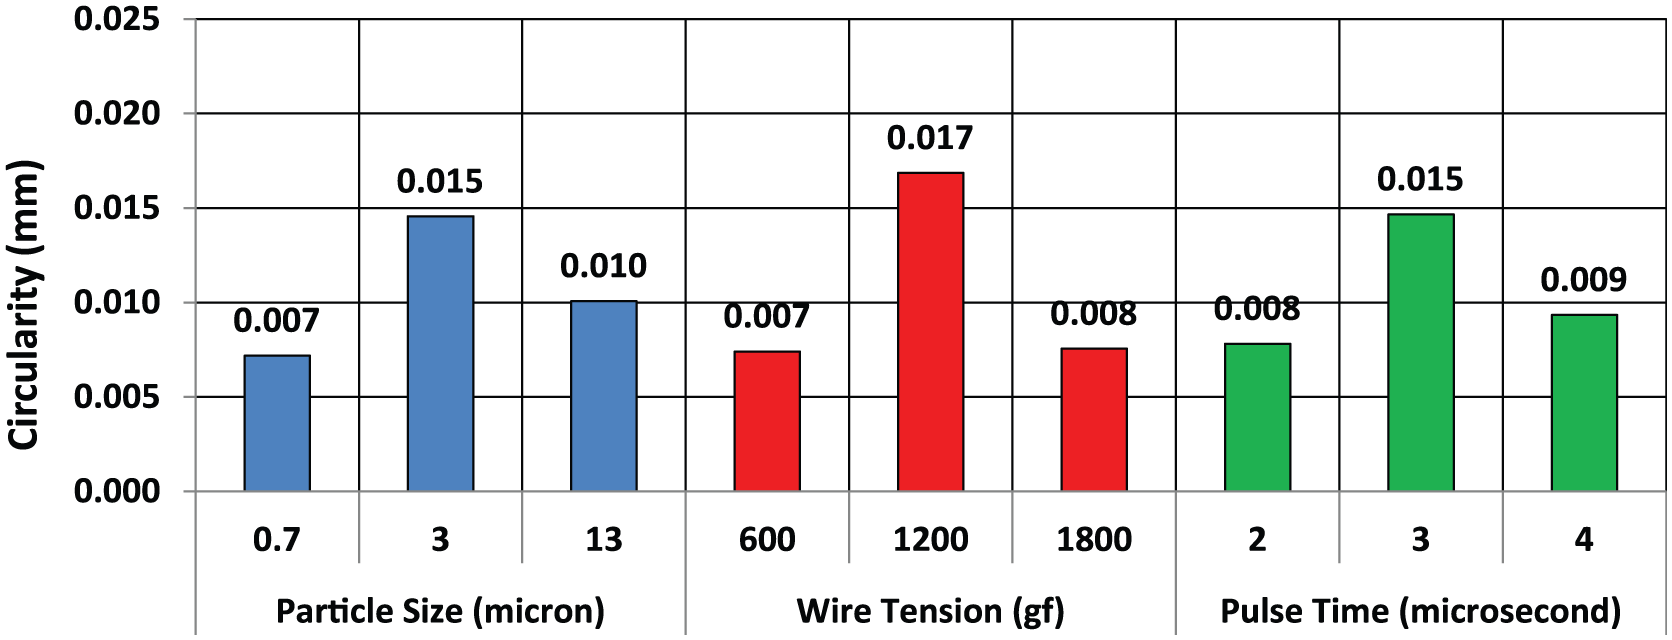
Average circularity for three parameters.
Surface roughness
The Pareto ANOVA for surface roughness given in Table 8 signifies that pulse-on time (C) and reinforcement size (A) have the most significant effect on surface roughness, having almost equal contribution ratio (P ≅ 34%), followed by wire tension (B; P ≅ 8%), the interaction between reinforcement size and wire tension (A × B; P ≅ 8%) as well as the interaction between wire tension and pulse-on time (B × C; P ≅ 8%). The total impact of the main effects is about 77.07% compared to the total contribution of interaction effects of 22.93%. Therefore, it becomes relatively easy to optimise the surface roughness in this instance by the selection of input parameters.
Pareto ANOVA for surface roughness.
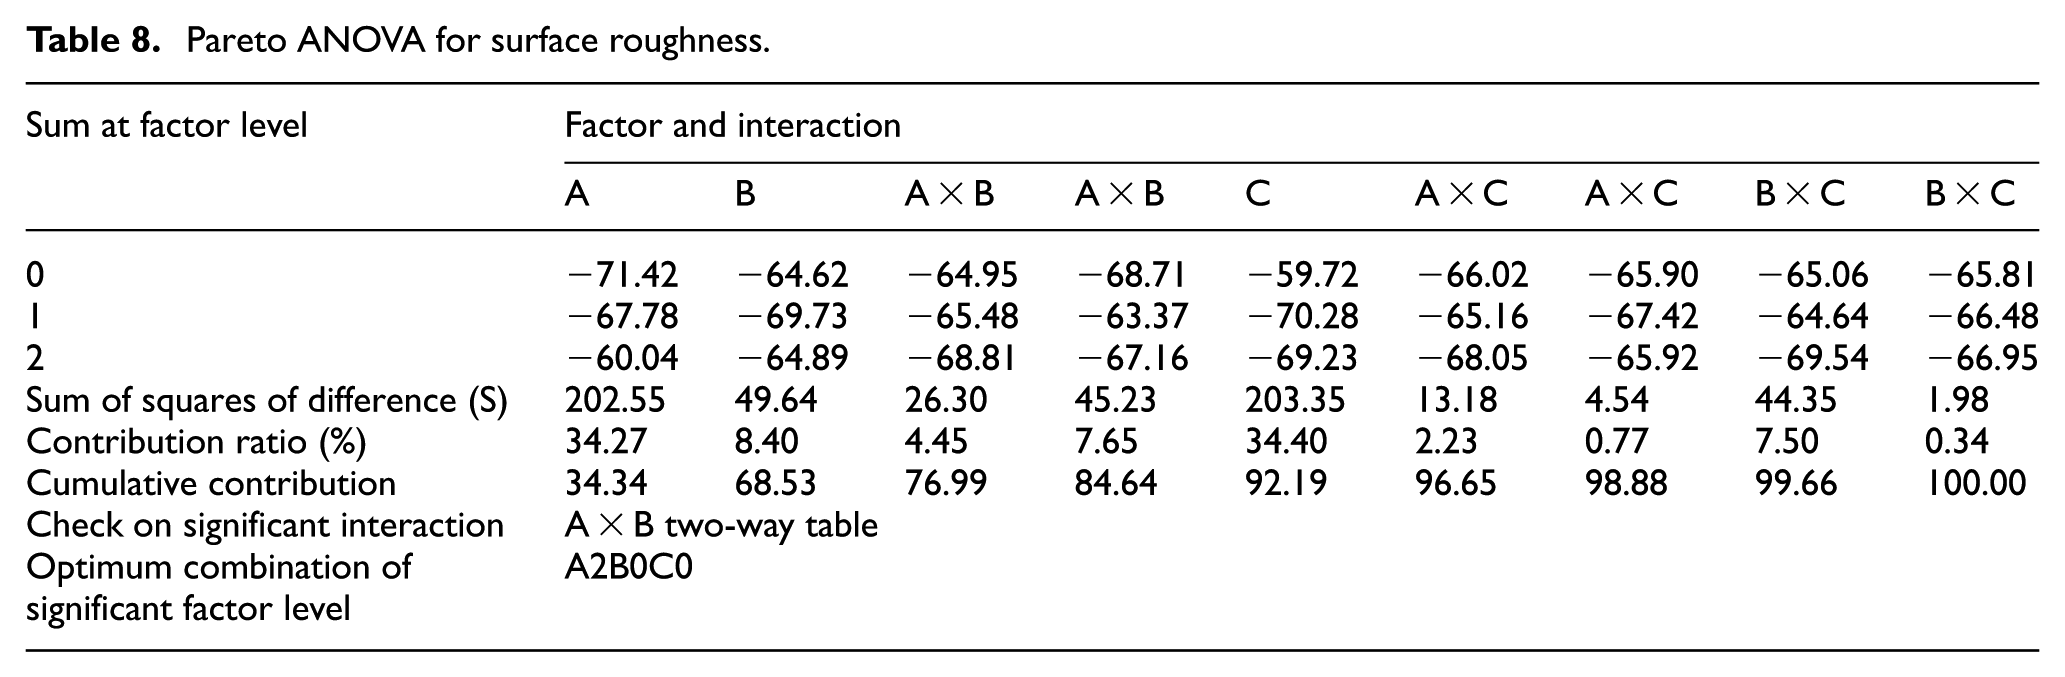
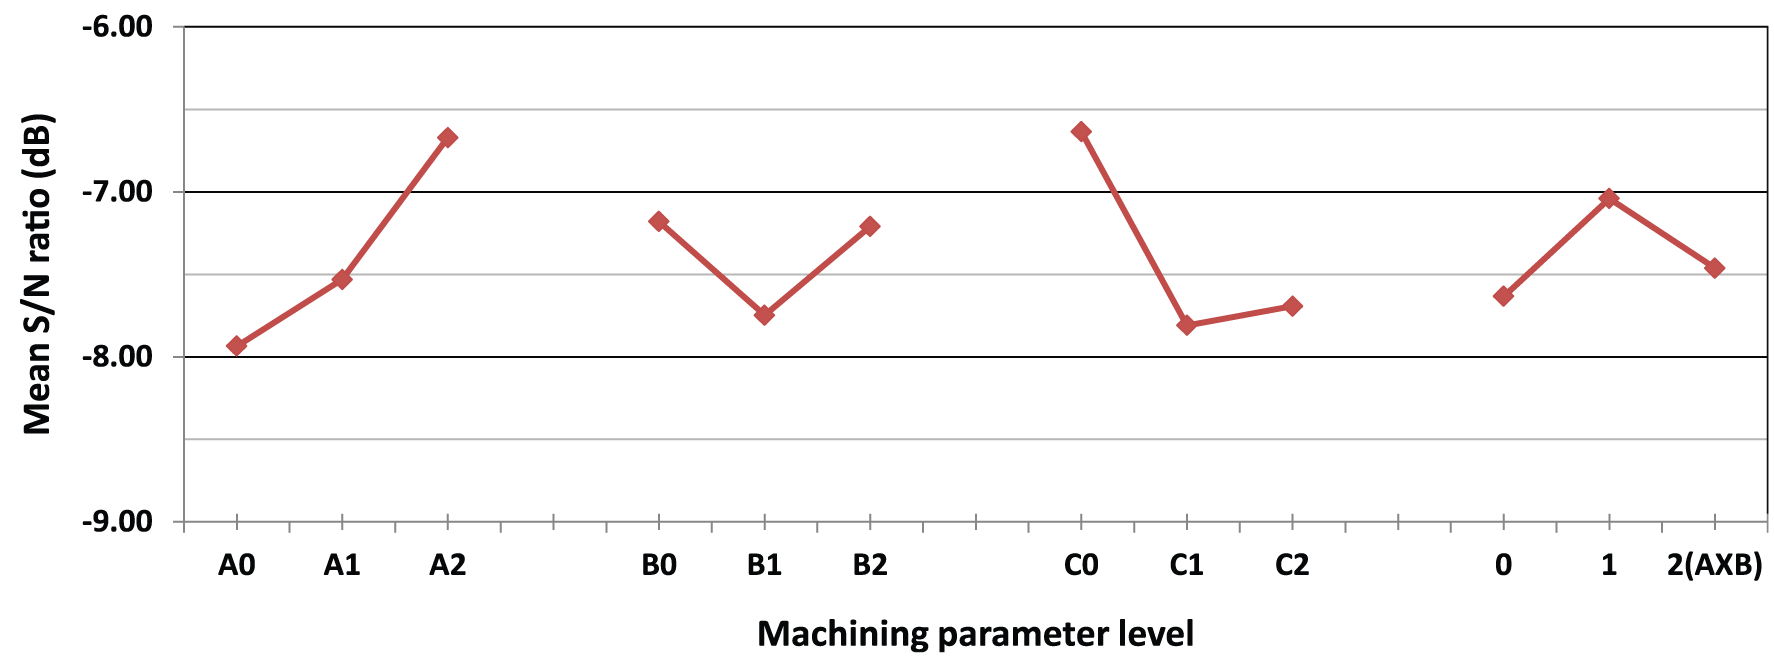
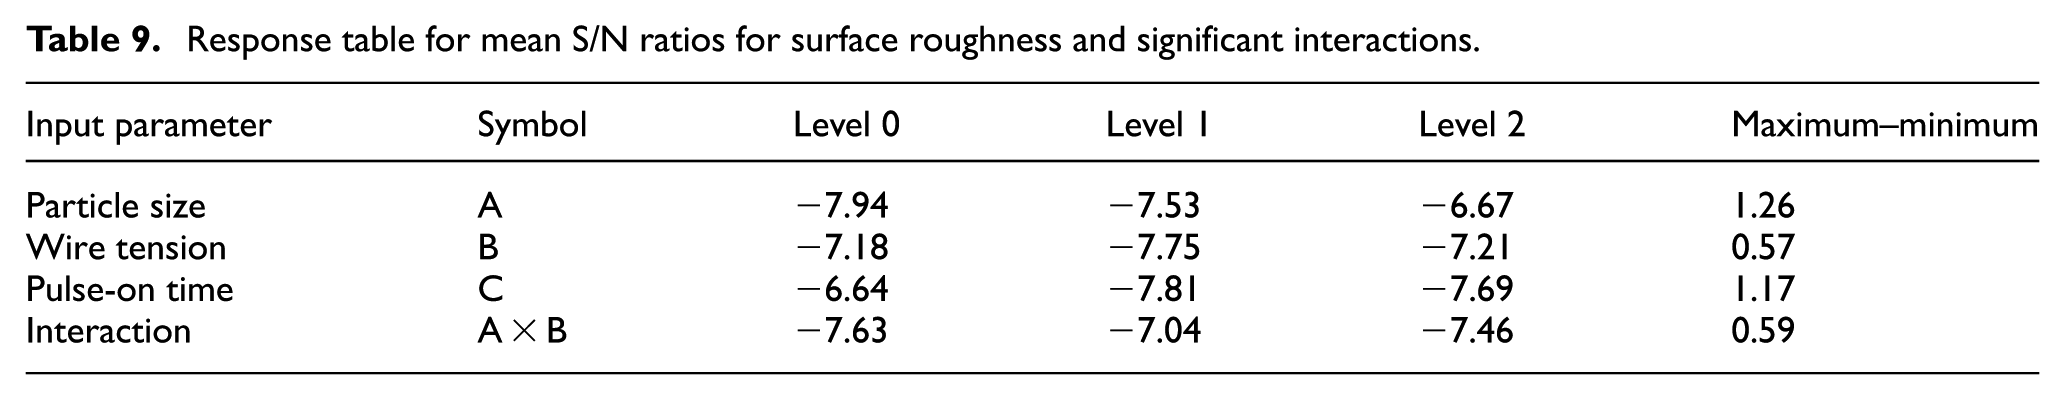
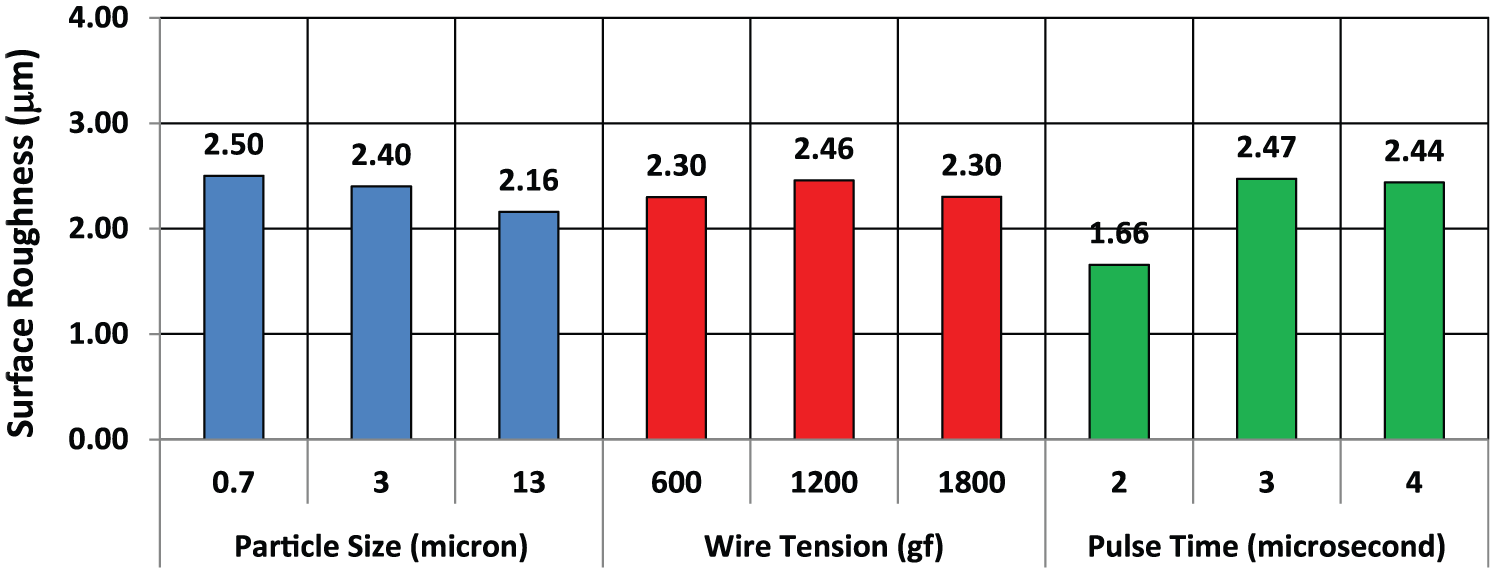
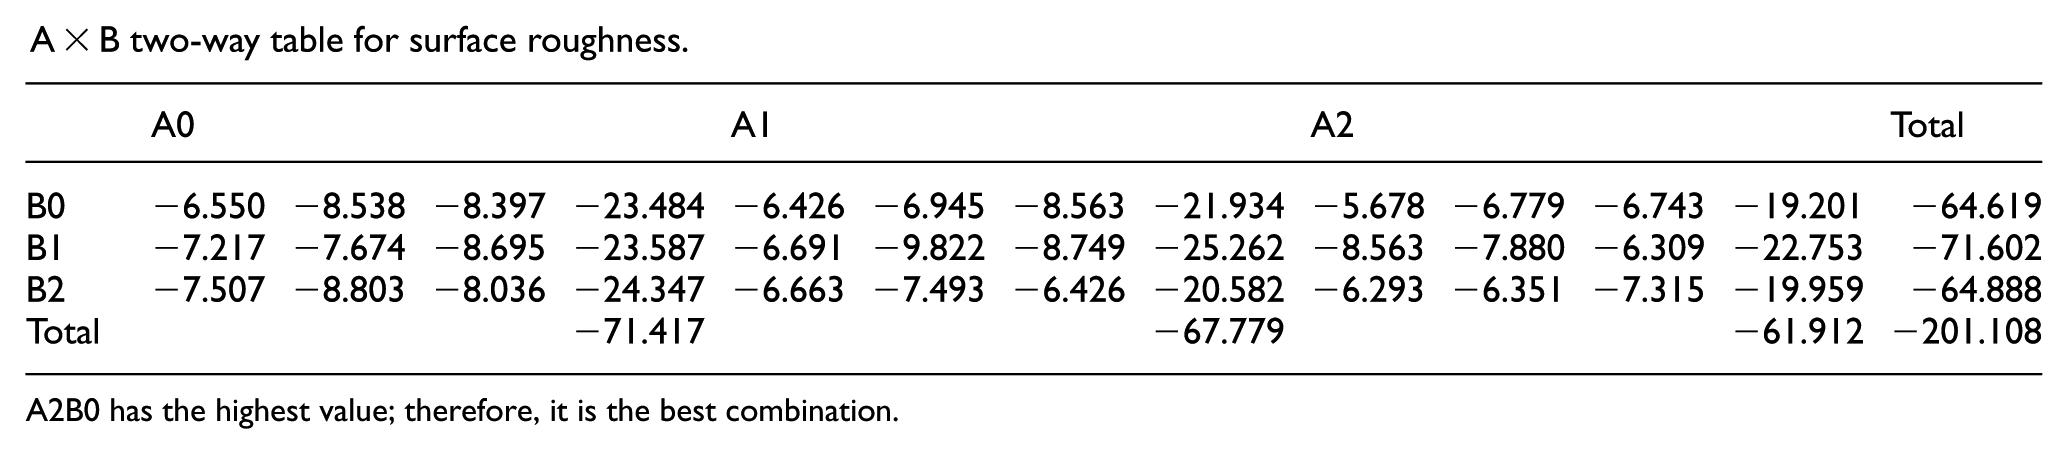
The response graph in Figure 6 confirms the findings of the Pareto ANOVA given in Table 8. Table 9 shows that the low level of pulse time (C0) was the best pulse time for minimising surface roughness. From the A × B two-way table (see Appendix 1), the optimum combination of factors A and B in order to achieve the lowest surface roughness value was determined as A2B0. Therefore, the best combination of input variables for minimising surface roughness was specified to be A2B0C0. The variation in the surface roughness for three input parameters is shown in Figure 7. The good results are obtained when three reinforcement sizes are 13, 3 and 0.7 µm. High and low wire tensions produce similar and superior surface finish compare to that of medium wire tension. Low pulse-on time gives the best surface finish, which is then followed by high and medium pulse-on times. These results are very comparable to those obtained from Pareto ANOVA and response tables.
Response graph of S/N ratios for surface roughness.
Response table for mean S/N ratios for surface roughness and significant interactions.
Average variation of surface roughness for three additional parameters.
Discussion
The results presented above indicate that input factors including size of reinforced particles, wire tension and pulse-on time showed significant effects on diameter error, circularity and surface roughness (Figures 3, 5 and 7). For the three WEDM input parameters considered, pulse-on time interaction (C), wire tension (B) and pulse-on time (C) are the major contributors to diameter error, circularity and surface roughness (Tables 4, 6 and 8, respectively). Reports of (1) overcut due to high temperature and electrode gap, (2) taper kerf due to deformation of wire and (3) surface damage due to formation of cavities by splashes of molten material have been published,20–24 as shown in Figure 8. Figure 8 demonstrates that all surfaces consist of solidified melted materials, with craters due to sparks and blisters resulting from the splashing of the molten metals. There are also reinforced particles on machined surfaces of MMCs, as evidence by energy dispersive X-ray analysis (EDXA) spectra. The presence of Si in the machined surface indicates that it diffuses from SiC particles at high temperatures. However, the presence of Zn and Cu indicates the transfer of WE material to the workpiece by spattering. The weight fraction of transferred elements depends on SiC particle size in MMCs. For example, the amount of Si is highest when the particle size is largest. However, when the size of SiC particles was smaller (3 and 0.7 µm), the amount of Si on the machined surface was slightly higher for smaller particles compared to larger particles. The reason for this is unknown, and further research is required to explain this. The presence of Cu is also noted in this case. When the particle size decreases, the weight fraction of Si decreases as well, and Cu disappears, but the amount of Zn increases. All these are affected by input parameters that influence diameter error, circularity and surface roughness. 23
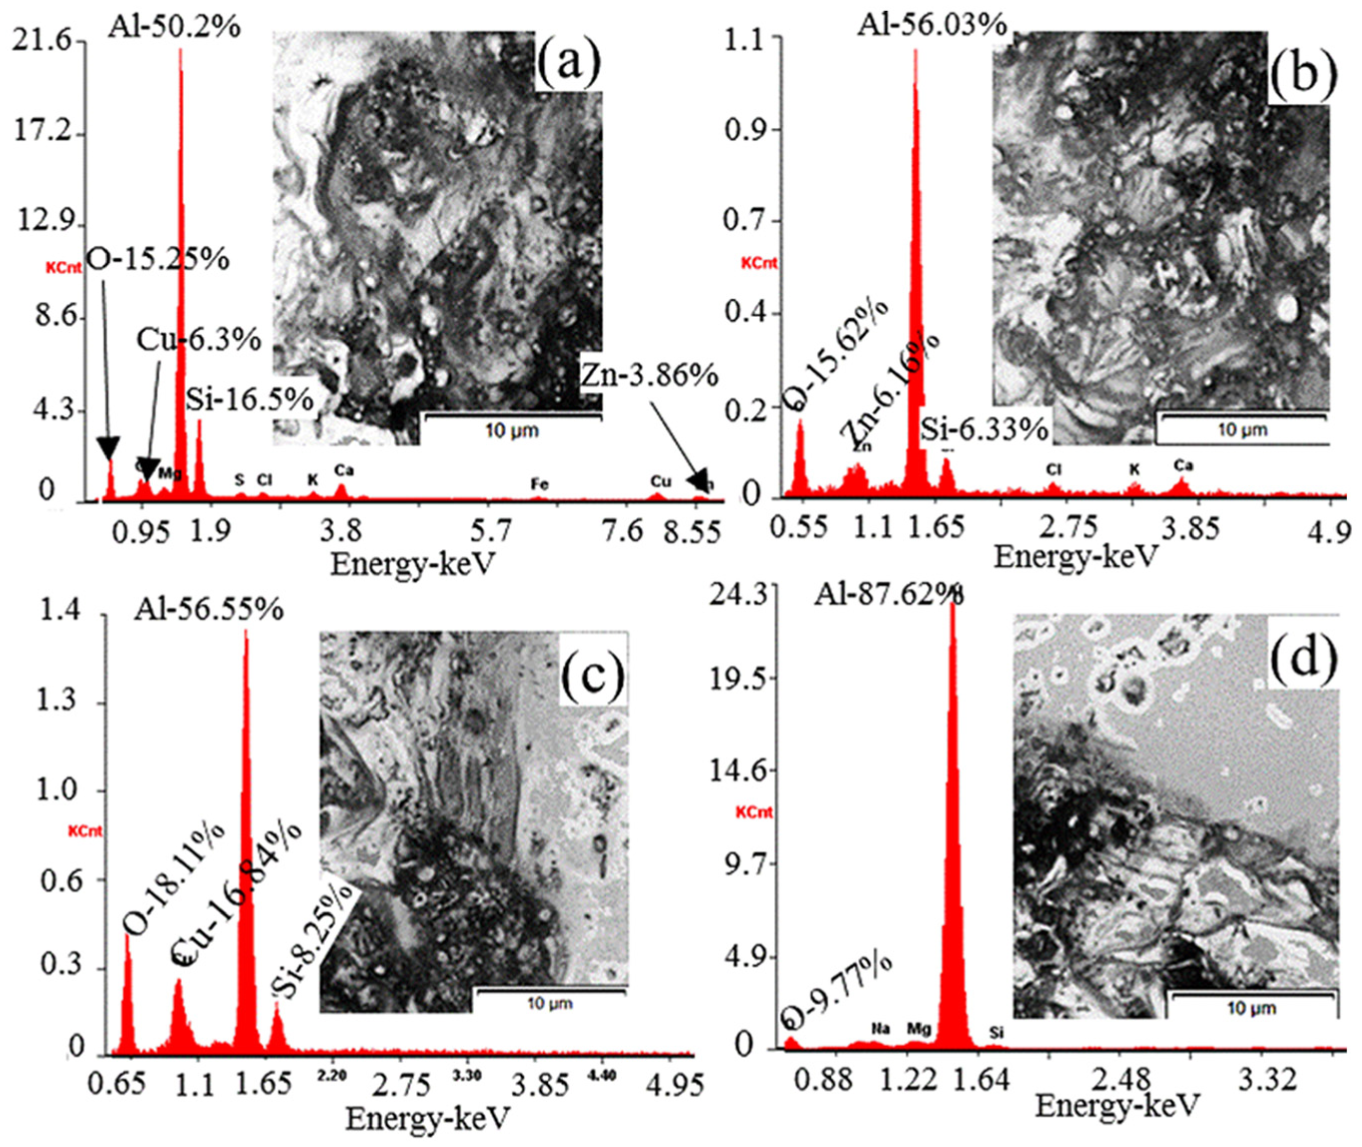
Surfaces of particle sizes including (a) 13, (b) 3 and (c) 0.7 µm and (d) matrix material after EDM. 23
The diameter error can be affected in numerous ways, such as by altering elastic deformation of the workpiece, induced by thermal distortion, projections of reinforced particles, WE deformation and flexibility of WE. The thermal distortion of the workpiece largely depends on (1) pulse-on time and (2) composition of MMCs and mismatch of thermal properties between matrix and reinforcement material. However, the wire tension affects the accuracy in following the cutting path and the interaction between reinforced particles and WE. Therefore, the effect of interaction between reinforcement size and pulse-on time (A × C) also contributes significantly to diameter error as shown in Table 4. Although the larger reinforcements in MMCs have higher capacity to resist the temperature, it is generally known that smaller particles can provide less disturbance of the wire movement from the cutting path, thus with less diameter error (Figure 2). The flexibility and rigidity of the WE depend on the tension in the wire, which is the second contributing factor to the diameter error. As the active cutting length of the WE increases, the tension in the wire is reduced, resulting in a smoother cut. It is expected when the tension in the wire is less, especially in the presence of MMCs reinforced with smaller particles. Consequently, diameter error is smaller with a low wire tension. As previously mentioned, the pulse-on time is directly related to heat generated during EDM where longer pulse-on time generates higher temperature. This temperature facilitates the vaporisation of workpiece materials and WE. When the pulse-on time is shorter and the temperature becomes lower, the rate of vaporisation is lower with less wire deformation. This observation reveals that the wire cuts less material while keeping the required WE gap. Thus, the diameter error becomes the minimum at low wire tension with an optimised thermal compatibility between the phases of MMCs.
Overcut and undercut are the primary causes of circularity error, which are affected by wire tension as well as pulse-on time. Therefore, the wire tension is most significant contributing factor to circularity error. The interaction between wire tension and pulse-on time is the second most significant contributing factor to circularity (Table 6). At low wire tension, too flexible wire makes a longer active cutting length, which can deviate from the actual path of machining. At the high wire tension, the wire becomes very rigid and interacts with reinforced particles and pulls embedded particles in softer matrices, resulting in the poor circularity of machined holes. Therefore, the best configuration is to remove material close to the shape of a circle at the medium wire tension. The pulse-on time controls the heat generation. Workpiece material does not move properly at low pulse-on time due to less heat. However, too much material is removed at high pulse-on time due to high heat. Therefore, medium pulse-on time gives the best circularity. Where reinforced particles are small, they do not exhibit much capacity to withstand the EDM temperature, as the particles dislodge from the matrices with a low melting point, thus producing an improved circular hole. The capability to tolerate the EDM temperature improves with the increase in particle size. Further increases in particle size offer significant resistance to partial material removal. It was found that the circularity decreases when the particle size was high. Therefore, particles with a medium size balance between undercut and overcut, leading to the highest circularity.
The EDM machined surfaces are generally full of solidified melted metals, splatter and blisters.22,24 Consequently, surface roughness has to be controlled by input energy and workpiece material. The pulse-on time is the main provider to heat input, which is considered as the highest contributor to surface roughness, as depicted in Table 8. The variation of surface geometry is controlled by the particle size. The higher pulse-on time leads to higher heat and more time for the surface degradation. Therefore, lower pulse-on time gives better surface finish, and the contribution of wire tension on surface roughness appears to be insignificant (Table 8). The interaction between reinforcement size and pulse-on time contributes significantly to the surface finish. This clearly shows that the large reinforcement size gives the lowest surface roughness. As previously stated, when the particles are smaller, the resistance of MMCs to high temperature is weaker. More surface defects are generated when particle sizes are smaller. With the increase in particle size, the surface defects are reduced in that the larger particles increase the resistance to melting of the surface. Accordingly, particles with the larger size lead to best surface finish, as exhibited in Figures 6 and 7. It is also shown that low wire tension gives better surface finish. It has already been mentioned that the wire is too flexible and makes a longer active cutting length at the low wire tension. This may deviate the wire from the actual path of machining but gives a smoother finish. However, the wire becomes very rigid and interacts with reinforced particles and pulls particles that are embedded in the softer matrices at the high wire tension. This results in the poor circularity and surface finish for the machined hole.
Conclusion
The above-mentioned analysis demonstrates that the reinforced particle size, wire tension and pulse-on time significantly affect diameter error, circularity and surface roughness. The following conclusions can be drawn from this investigation:
Pulse-on time and the interaction between pulse-on time and wire tension contribute most significantly to diameter error. The flexibility and rigidity of the WE depend on the tension. Thus, the wire tension affects the accuracy of cutting path and the interaction between reinforced particles and WE. A smoother cut is expected when the wire tension is less. Although the larger reinforcements in MMCs have the higher capacity to resist temperature, it is evident that smaller particles offer less disturbance of the wire movement from the cutting path, thus with less diameter error. The diameter error is the least at the low wire tension with an optimised thermal compatibility between the phases of MMCs.
The wire tension is the foremost contributing factor to circularity. The interaction between wire tension and pulse-on time is the second contributing factor in this case. The combination of over- and undercuts is the main reason of circularity error. Best circularity was obtained at the medium particle size, medium wire tension and medium pulse-on time.
The larger reinforcement size gives the lowest surface roughness. It has been found that more surface defects are generated when the particle sizes are smaller. With the increase in particle size, the surface defects diminish as the larger particles increase the resistance to melting of the surface. The higher pulse-on time leads to higher heat and more time to degrade the surface. Therefore, lower pulse-on time gives better surface finish, and the contribution of wire tension on surface roughness appears to be insignificant.
Footnotes
Appendix 1
A × B two-way table for surface roughness.
| A0 | A1 | A2 | Total | ||||||||||
|---|---|---|---|---|---|---|---|---|---|---|---|---|---|
| B0 | −6.550 | −8.538 | −8.397 | −23.484 | −6.426 | −6.945 | −8.563 | −21.934 | −5.678 | −6.779 | −6.743 | −19.201 | −64.619 |
| B1 | −7.217 | −7.674 | −8.695 | −23.587 | −6.691 | −9.822 | −8.749 | −25.262 | −8.563 | −7.880 | −6.309 | −22.753 | −71.602 |
| B2 | −7.507 | −8.803 | −8.036 | −24.347 | −6.663 | −7.493 | −6.426 | −20.582 | −6.293 | −6.351 | −7.315 | −19.959 | −64.888 |
| Total | −71.417 | −67.779 | −61.912 | −201.108 | |||||||||
A2B0 has the highest value; therefore, it is the best combination.
Declaration of conflicting interests
The author(s) declared no potential conflicts of interest with respect to the research, authorship and/or publication of this article.
Funding
The author(s) received no financial support for the research, authorship and/or publication of this article.