
Abstract
Improvement of mechanical properties of metal strips can be achieved by producing ultra-fine grained microstructure. The equal channel angular rolling process is one of the effective severe plastic deformation techniques which can lead to proper ultra-fine grained structures. In this research, the influence of process parameters such as pre–equal channel angular rolling annealing temperature, number of equal channel angular rolling passes, routes and post–equal channel angular rolling annealing on deformation behavior of 5083 Al alloy is investigated by experimental studies and numerical simulations. Metallurgical investigations revealed that grain refinement and increased dislocation density are two effective parameters on the mechanical strength improvement. The investigation of mechanical properties demonstrated that increasing number of equal channel angular rolling passes leads to a considerable increase in yield stress, ultimate tensile strength and hardness. In contrast, elongation was dramatically reduced. Also, improvement of mechanical properties reaches saturation at a critical strain level, depending on the microstructure evolution. In addition, investigation of effects of post–equal channel angular rolling annealing on the specimens annealed at 415 °C indicated that elongation and toughness increase, accompanying with a low decrease in yield and tensile strengths and hardness. In this study, the equal channel angular rolling process was numerically simulated using ABAQUS software in two different routes for three passes. It is shown that upper roller force is increased by increasing the number of equal channel angular rolling passes, but the rate of this increase is reduced at higher passes.
Keywords
Introduction
Materials are desired to have enhanced mechanical properties for practical and industrial applications. This demand has led to the introduction of various strengthening techniques. Most of these techniques are based on microstructure refinement by plastic deformation. Metal working processes like drawing, rolling and extrusion play a significant role in industry for strengthening of metals. However, these techniques may not be sufficient for producing materials with preferred properties and/or geometry. Hence, new processing techniques are developed to obviate these problems, called severe plastic deformation (SPD) techniques. Besides high strength and hardness of the material, long fatigue life and good superplastic properties can be obtained without decreasing the ductility so much as compared to conventional deformation techniques. 1 Under suitable channel geometry and process variables, strain of ∼1 can be imposed into the metal at a single pass through the die in SPD which is not possible in conventional processes.2,3 The most important advantage of these techniques is the ability of producing ultra-fine grained (UFG) microstructures. 4 UFG materials are defined as polycrystals having very small grain sizes of less than ∼1 µm with equiaxed microstructure. In addition, they have high fraction of grain boundaries with high misorientation angles and dislocation density. 5
One of the popular SPD approaches which can generate a UFG microstructure in billet or rod specimens, with no change in the primary geometry, is equal channel angular pressing (ECAP). 6 However, there are some drawbacks to ECAP method, for instance, being a discontinuous process and not applicable to sheet products.7,8 Regarding these drawbacks, a new deformation approach is developed for continuous production of sheet or strip products with UFG microstructure called equal channel angular rolling (ECAR) method by Lee et al.9,10 by modifying the ECAP process. Since ECAR method is a continuous process, it is more worthy of attention than other SPD techniques and conventional cold rolling processes.
Creating UFG microstructure by ECAR has been the center of great attention by researchers. The studies on AZ31 alloy11,12 have shown that SPD via ECAR process causes a reduction in strength and an increase in elongation. Also, the formability was increased due to change from the basal plane to non-basal plane of crystal orientation and propagation of twins after ECAR. This behavior of ECARed specimens of AZ31 is in contrast with the response of other metals such as Cu13,14 and steel.15,16 In metals like Cu and steel, the deformation via ECAR increases the strength and decreases elongation. Many researchers, studying the ECAR process, have focused on aluminum alloys and the related texture evolution and mechanical properties changes. Based on these studies, after SPD via ECAR and formation of shear texture, planar anisotropy and formability increase.17–19
Azimi et al. 20 have performed studies on ECAR of Al 1100-O, and results showed that after ECAR, hardness, ultimate tensile strength (UTS) and yield strength (YS) are considerably increased and elongation is decreased. The increase in the hardness and strength after ECAR was related to strain hardening, increased dislocation density and deformation microstructure. Tan et al. 1 have reported that mechanical properties are improved up to the critical strain level and showed that the route of ECAR process has no considerable effect on the mechanical properties. They also conducted a post-ECAR annealing at two temperatures (200 °C and 350 °C) and observed that post-annealing at 200 °C does not make any considerable change in the hardness values; however, post-annealing at 350 °C resulted in a reduction in hardness. Mahmoodi et al. 21 investigated the effect of process parameters such as the channel oblique angle, the route of feeding and the number of passes on the residual stress within a surface layer of aluminum alloy sheets during ECAR process.
The numerical studies of ECAR cover some other parameters of this process. Xu et al. 22 investigated the influences of die geometrical parameters and frictions on the deformation behavior of the pure Al sheets in ECAR. Results showed that increasing the curvature angle and the die channel angle will lead to a reduction in the amount of effective strain in the sheet. Wei et al. 23 have reported a uniform distribution of equivalent plastic strain in most workpiece parts after ECAR process. Results showed that shear deformation, stress homogeneity and strain distribution can be improved due to the friction between the die walls and the workpiece. Chari et al. 24 utilized both the response surface methodology and the finite element method (FEM) to predict the effect of process parameters on equivalent plastic strain in ECAR. The results indicated that the friction coefficient on the interface of the rolls and strip has no significant effect on effective strain, while the die channel angle is the most considerable parameter.
In the previous researches into ECAR process, experimental and numerical investigations of ECAR have not been carried out together. In addition, there are a limited number of researches on the time and temperature of post-ECAR annealing process. In numerical investigations, the materials’ flow properties, stress and strain field during ECAR are considered, but the input parameters such as routes and number of passes have not been taken into account. Hence, this article intends to investigate all of the aforementioned parameters, including pre-ECAR annealing temperature, ECAR routes (A and C), number of passes and time and temperature of post-ECAR annealing, on the microstructure evolution and mechanical properties of 5083 Al alloy by experimental and numerical procedures.
Experimental procedures
The schematic diagram of the ECAR process consisting of the die channel angle of 120° and outer corner angle of 0° is shown in Figure 1(a). According to Figure 1(a), the thickness of outlet channel (2 mm) is slightly larger than that of inlet channel (1.8 mm). Figure 1(b) shows that the experimental setup and two load cells were used to measure the upper roller force in ECAR process.
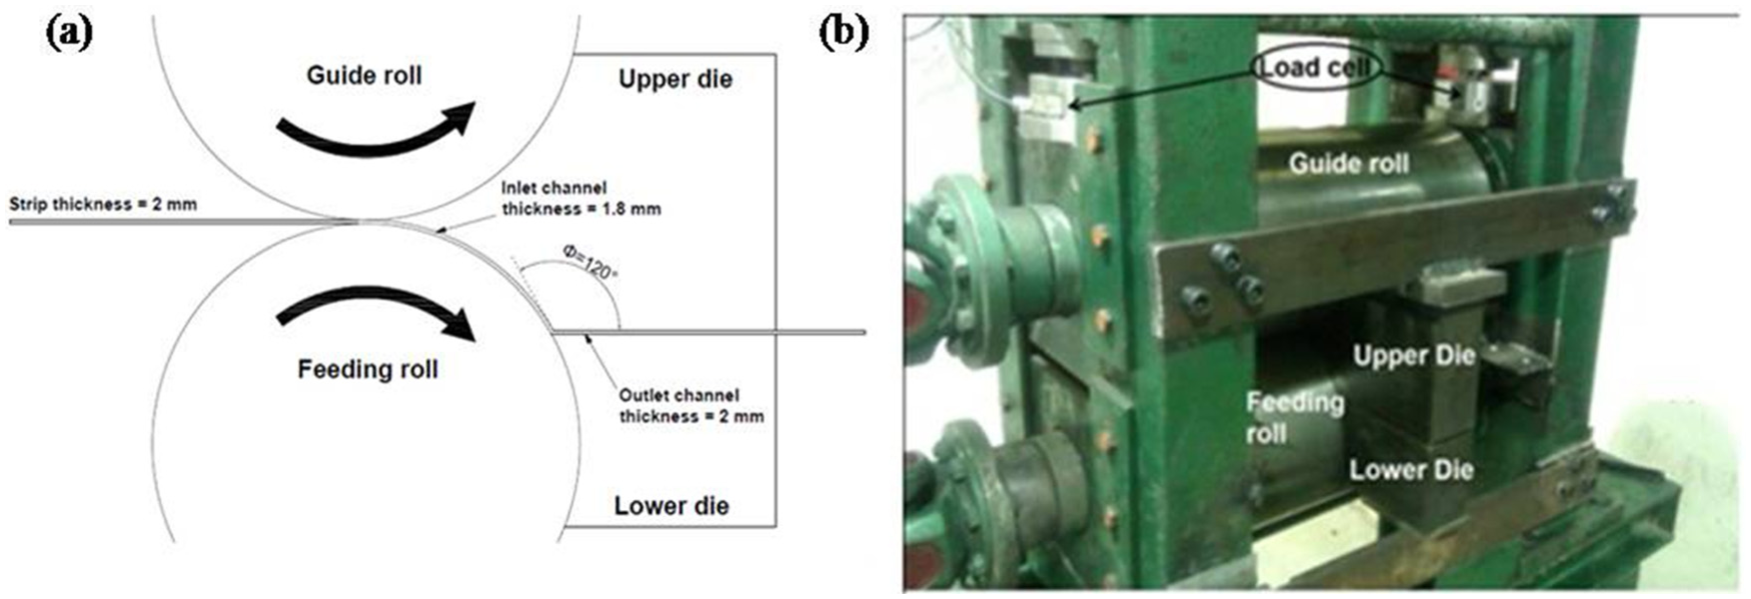
(a) Schematic diagram of the ECAR process and (b) general view of the experimental setup used for the ECAR process.
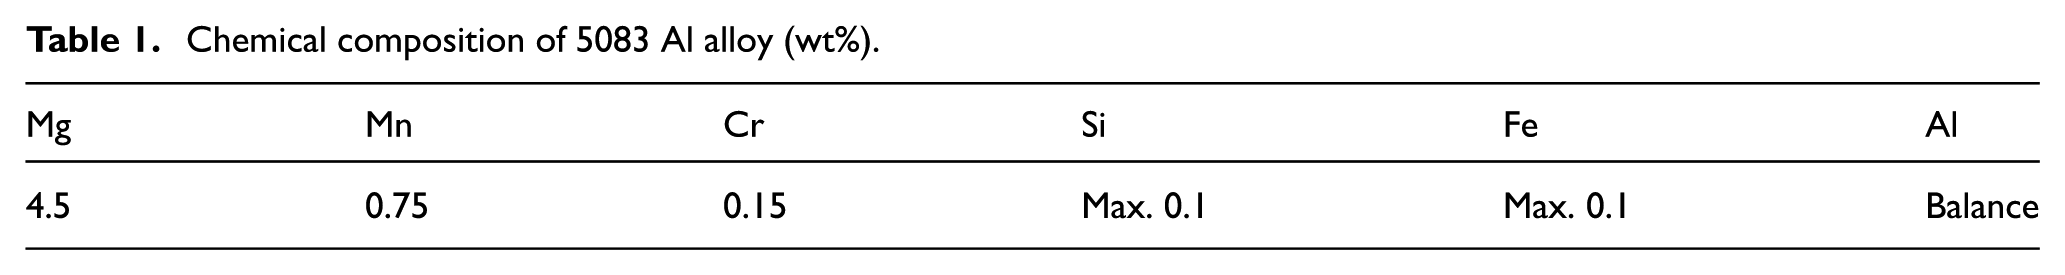
In this research, the specimens were made of 5083 Al alloy and dimensions were 300 × 30 × 2 mm3 (length × width × thickness, respectively). The chemical composition of this material is listed in Table 1. To obtain a uniform microstructure, the specimens were annealed at 345 °C and 415 °C for 1 h before ECAR. Then, ECAR process was applied on the specimens with rollers’ angular speed of 1.15 rad/s at room temperature, using a laboratory-scale deformation setup. The samples were fed through the rolls with route-A (RA), without changing the feed direction between subsequent passes and with route-C (RC), with changing the feed direction by 180° after every ECAR pass (Figure 2). Vickers hardness test with a load of 10 kg for 15 s was used to determine the hardness of the specimens’ top surface. To clarify the validity and repeatability of hardness tests’ results, all measurements were conducted five times for every specimen, and the mean value of their results was reported as the true value. The maximum deviation from the mean value was ±4%. Tensile specimens were machined parallel to the deformation direction according to ASTM-E8 standard with the 50-mm gage length. Tensile tests were performed by a universal test machine (100-kN screw-driven universal testing machine; Zwick, Ulm, Germany) at room temperature and constant speed of 10 mm/min.
Chemical composition of 5083 Al alloy (wt%).
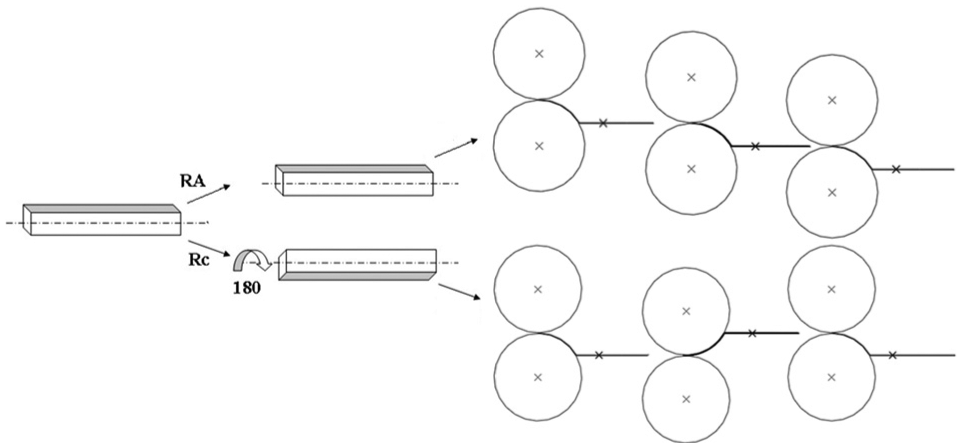
The two routes (RA and RC) of the ECAR process.
The microstructural change with increasing number of ECAR passes was examined using transmission electron microscope (TEM) and optical microscopy (OM). The images were taken from the longitudinal section of samples that are subjected to different ECAR passes. Sample preparation for OM includes grounding the strips by abrasive papers and then etching electrochemically using a 2.5% HBF4 solution at room temperature. The voltage and current used for electrochemical etching were 20 V and 0.2 mA, respectively. The OM device used polarized light to study the microstructure evolution of the grains, before and after ECAR process. TEM investigations were conducted by a Philips CM200 microscope operated at 200 kV. The disk specimen with 0.5 mm thickness was cut using electrical discharge machining (EDM) and then was mechanically ground to 200 µm thickness for TEM analysis. Electropolishing process with a solution of 25% HNO3 in methanol at about −20 °C and a voltage of 15–20 V was utilized in TEM examinations. Furthermore, to investigate the post-ECAR annealing effect, some of the deformed specimens via the ECAR were annealed at 200 °C and 300 °C for 30 min and 1 h.
Finite element analysis
To examine the magnitude and distribution of effective strain in the specimens, ABAQUS/Explicit was used as finite element software to simulate the ECAR process by assuming a plane strain state. In the performed simulations, the rollers and lower and upper dies were defined as discrete rigid bodies. The Coulomb friction model was utilized on the interface of the rolls and the strip. The constant angular speed of rollers and friction coefficient on the interface of the rolls and the strip were 1.15 rad/s and 0.13, 25 respectively. The friction on the interface of the strip and the die is modeled using the constant shear model
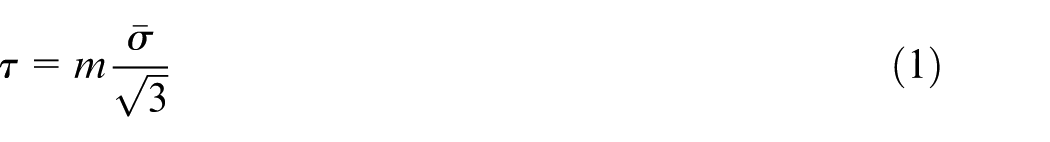
where
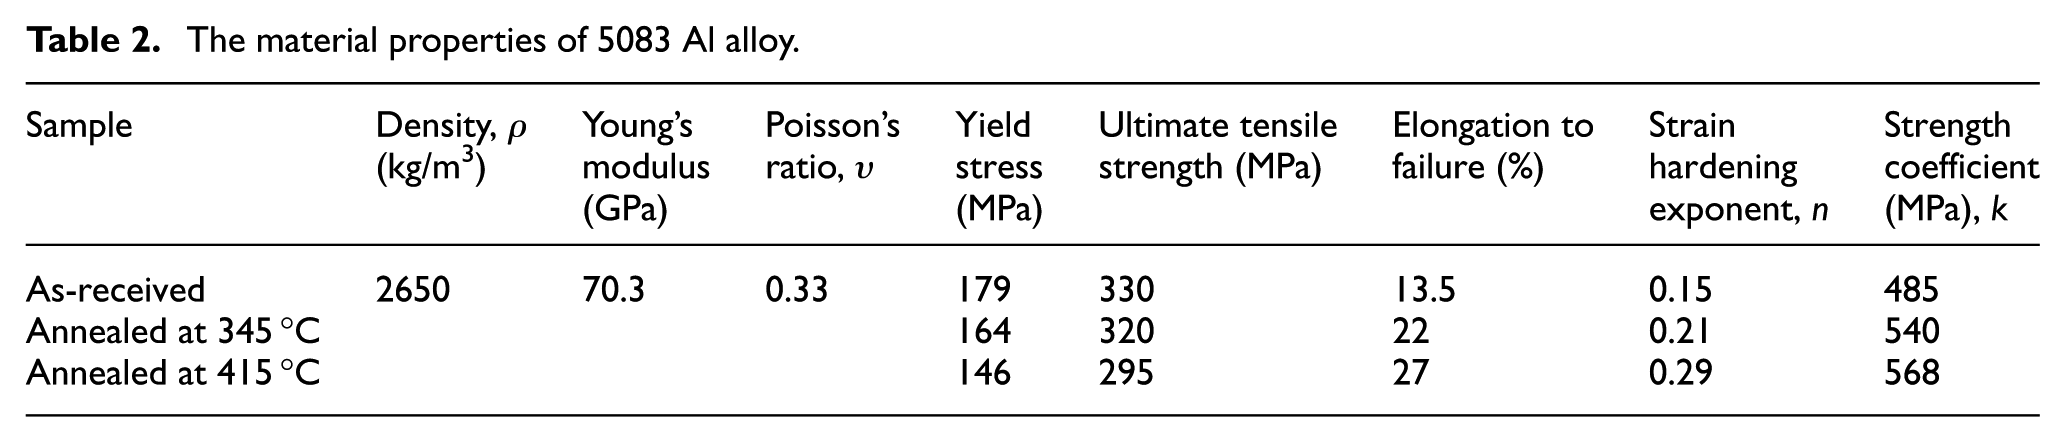
The material properties of 5083 Al alloy.
The strip was meshed using plain strain, four-node bilinear, CPE4R element. In this simulation, the strip is divided into 8900 nodes and 8001 elements.
Therefore, in Chari et al., 24 the validation of the FEM simulation has been done and confirmed by comparing of the inclination angle with an analytical approach. Moreover, using some analytical equations, the obtained strain from the simulation was compared with the analytical relations. The amount of upper roller force attained from simulation is verified with the experimental ones. Thus, ECAR process is simulated in two routes (A and C) for three passes, and the amount of strain and distribution of strain in thickness direction is obtained. The finite element model for ECAR process is shown in Figure 3.
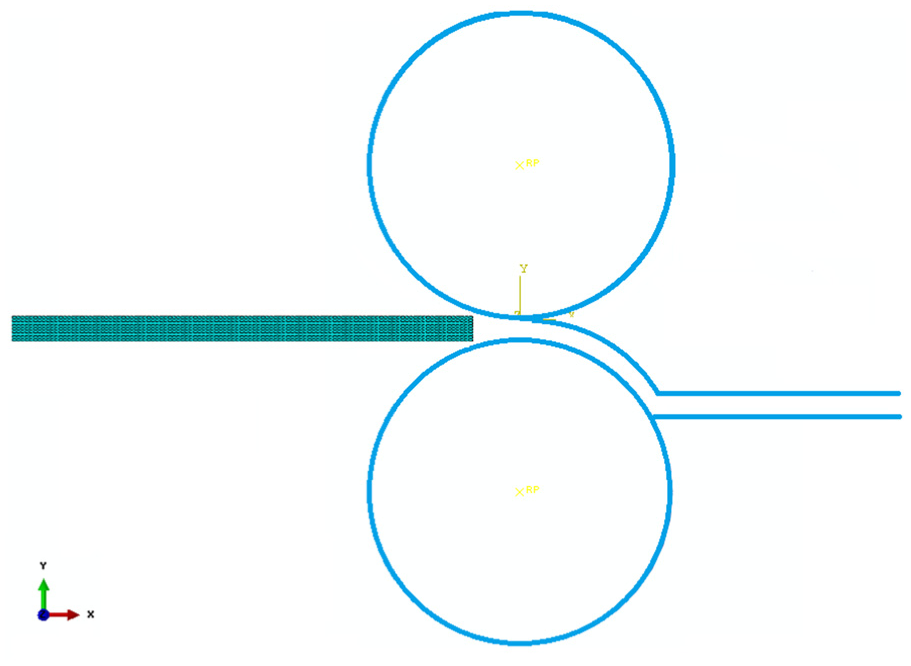
The finite element model for the simulation of the ECAR process.
Results and discussion
Numerical results
Because of direct dependency of microstructure evolution and deformation behavior on the effective strain distribution, analysis of the effective strain created in the specimen is of great importance. 22 Figure 4 shows the equivalent plastic strain contours in the two routes (RA and RC) for three passes in the intersection of the ECAR die channels. Although deformation during ECAR is not a perfect simple shear, both the numerical analysis9,27 and the experimental observation10,28 have shown that simple shear is the dominant mode of deformation. Figure 4 shows that the deformation in the die channel is not completely homogeneous along the through thickness direction, in particular, at the bottom and top surfaces. It can be understood from Figure 4 that the strain uniformity is decreased by increasing the number of ECAR passes. Generally, the non-uniformity of effective strain is due to both the friction and the geometry of forming tool. 26 Also, it can be observed that the strain uniformity in RC is higher than RA.
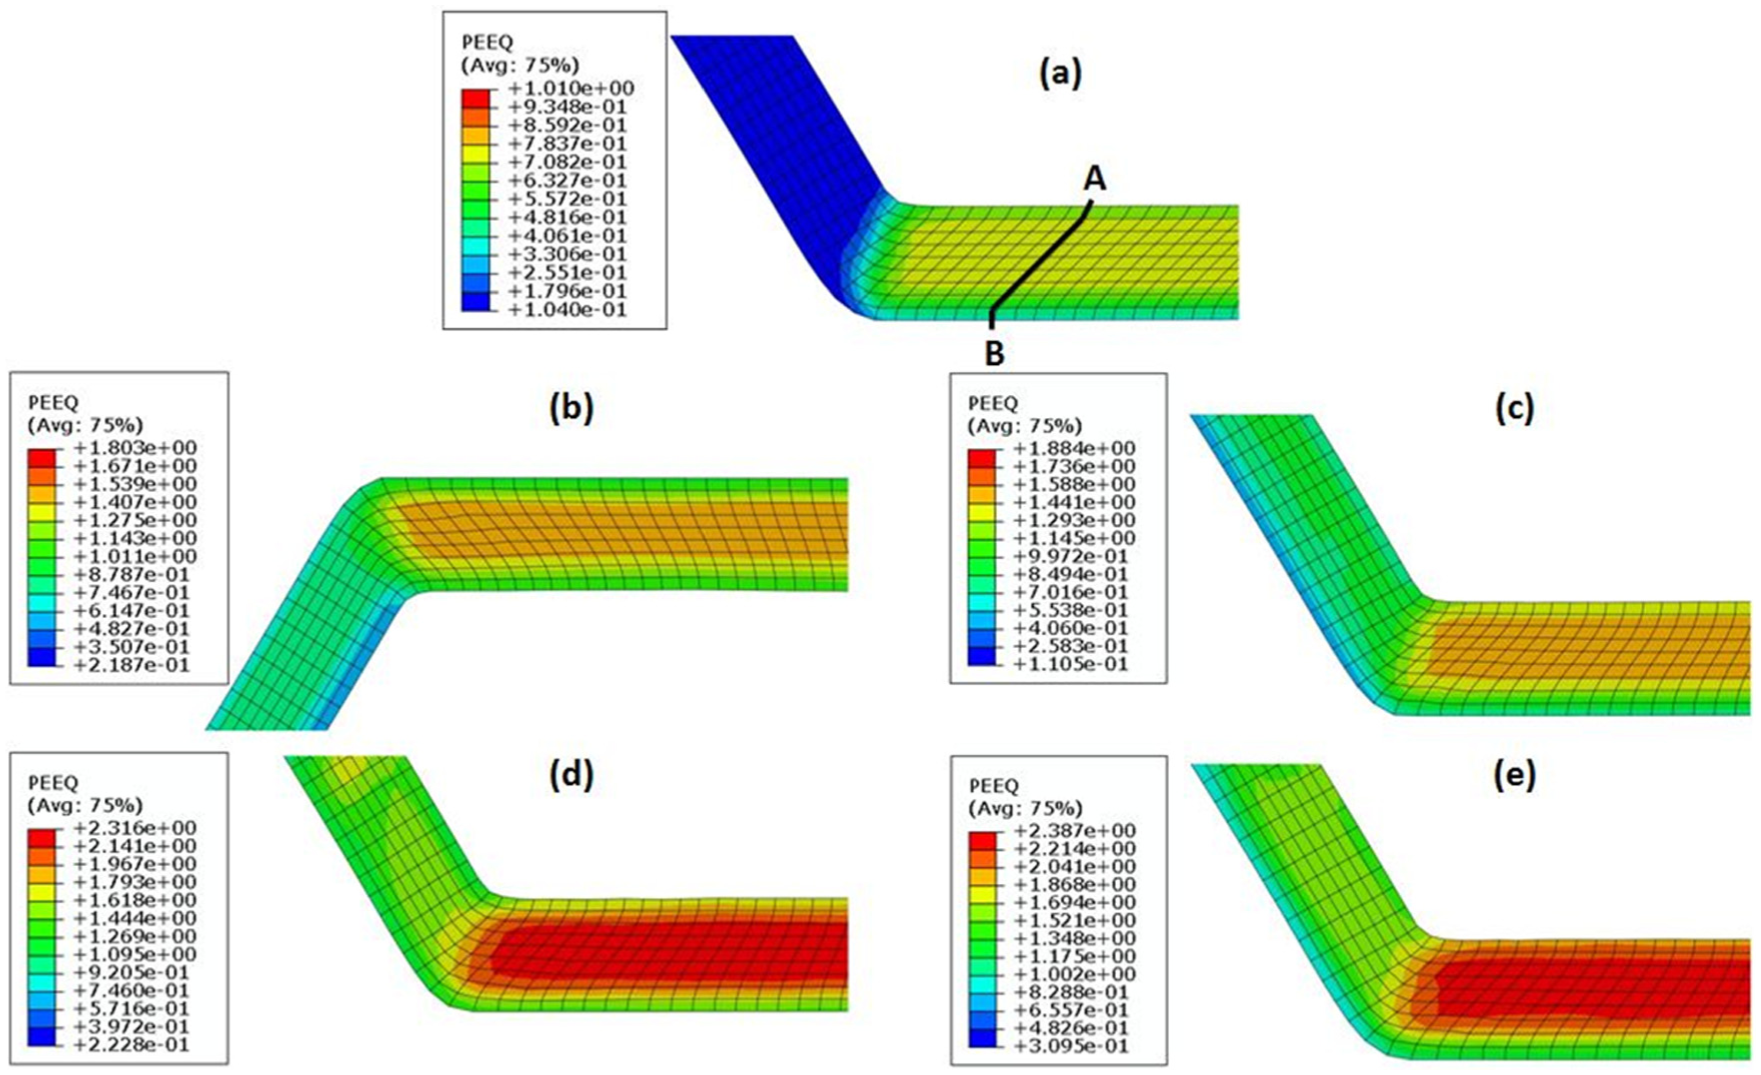
Equivalent plastic strain contours for channel angles of 120°: (a) one pass; (b) two passes, RC; (c) two passes, RA; (d) three passes, RC; and (e) three passes, RA.
Figure 5 illustrates the magnitudes of equivalent plastic strain in the middle of the sample in the longitudinal direction. As it can be understood from Figure 5, the sharp increase in the equivalent plastic strain value for every pass indicates two different regions of the specimen. The first part of the curve relates to the section of specimen which is not ECARed. Plastic strain in this part of specimen during the ECAR process is much lower than ECARed section of the strip. In addition, equivalent plastic strain is increased in subsequent passes. Equivalent plastic strain during first, second and third passes is 0.74, 1.49 and 2.24, respectively, in the middle path of the strip. Also, the routes in ECAR process do not have a significant effect on the amount of equivalent plastic strain in middle path of the strip.
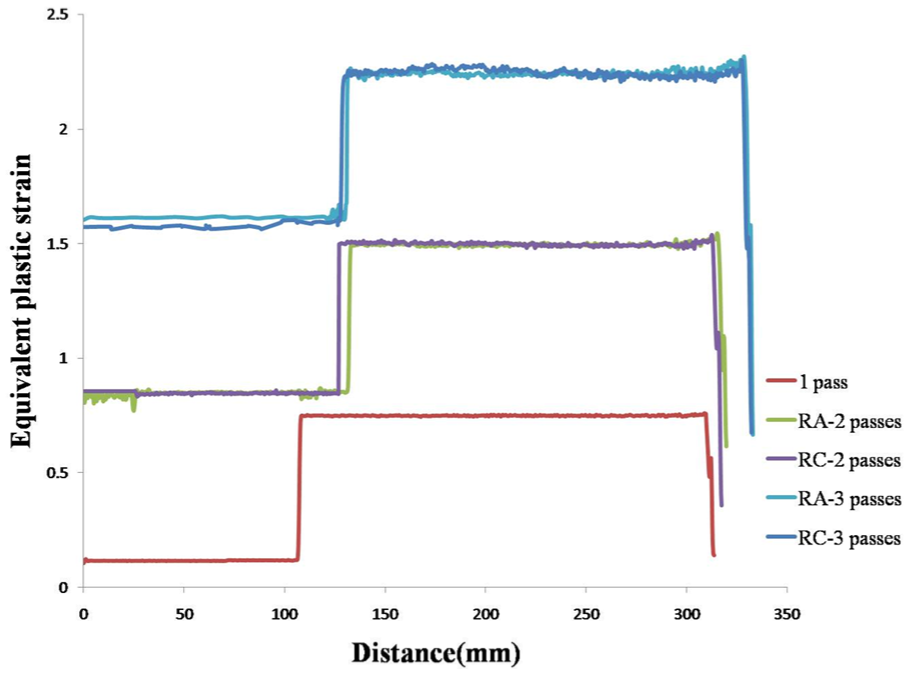
Effect of the routes (RA and RC) and number of ECAR passes on the equivalent plastic strain in the longitudinal section of the samples.
Figure 6 shows the effective strain distribution of the deformed strip along A–B section (as shown in Figure 4(a)) for three passes. For RA, it can be observed that the maximum amount of strain occurs in the area near the top surface of the strip. Additionally, strain in top surface is higher than the bottom surface, and this difference is increased in subsequent passes. This different deformation behavior relates to the die intersection geometry, creating a dead zone at the outer corner of die. 29 On the other hand, in RC, where the strip is 180° rotated, the maximum strain point tends to middle path of the strip. The difference between the strain amount in top and bottom surfaces decreases in RC with respect to RA, signifying that the uniformity of plastic strain distribution is improved.
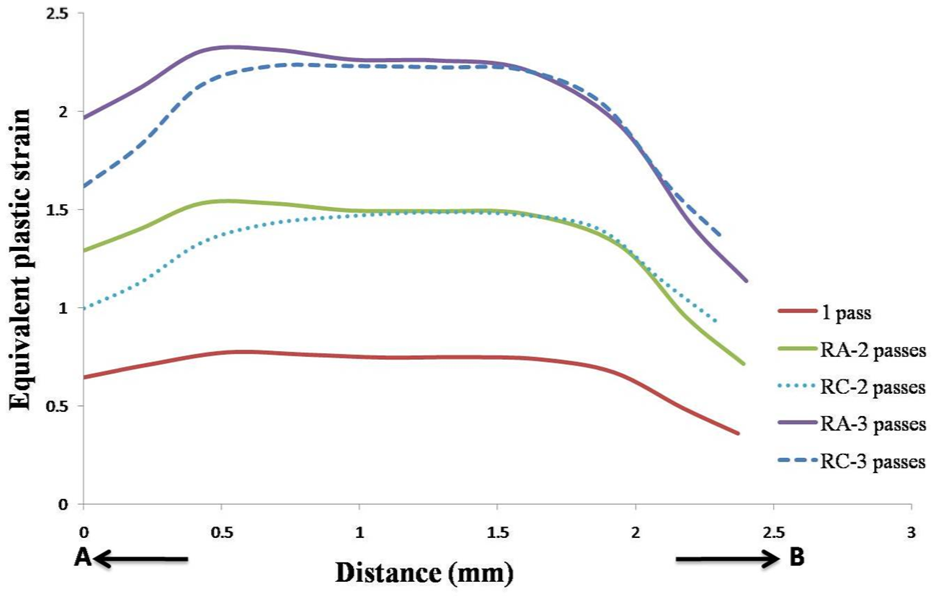
Effect of the routes (RA and RC) and number of ECAR passes on the equivalent plastic strain across A–B section.
Figure 7 shows the magnitudes of upper roller force after ECAR process in two routes (RA and RC) for three passes. According to Figure 7, upper roller force is increased in subsequent passes with a decreasing rate. Because of more uniform plastic strain distribution in RC with respect to RA in thickness direction, the upper roller force in RC is lower than in RA for both experimental and numerical results.
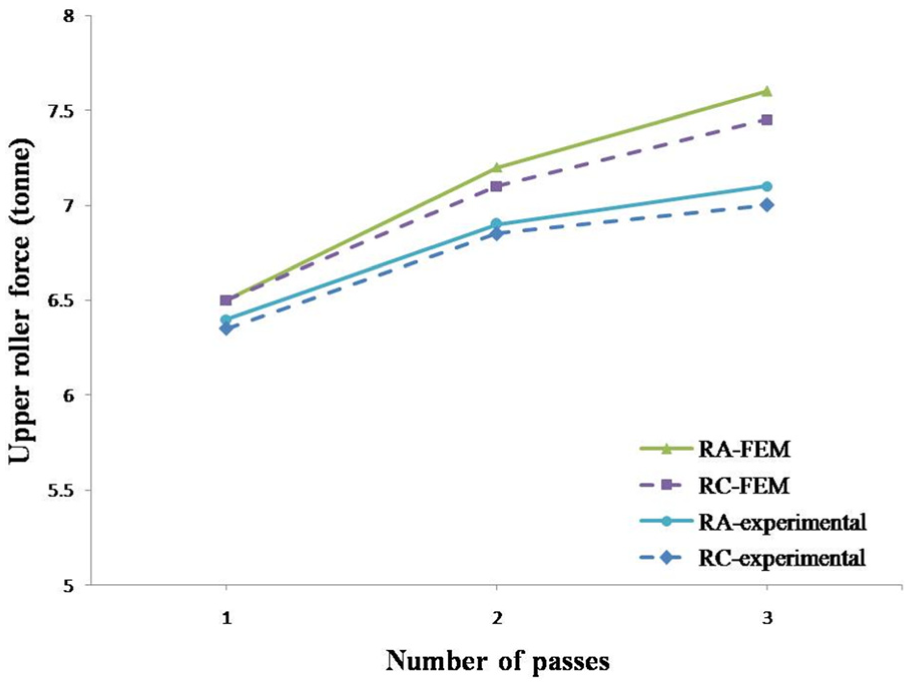
The magnitudes of upper roller force after ECAR process in two routes (RA and RC) for three passes.
Experimental results
Figure 8 shows the ECARed strip samples of 5083 Al alloy after five passes with RA and RC in the as-received and 345 °C-annealed states. As it can be seen in Figure 8, the specimens are divided into two regions. The first region is the terminal section of the specimen which does not pass from outlet channel, and SPD is not applied to this part. The second region is where the shear deformation is imposed to strip (ECARed section of the strip) and grain refinement is occurred.
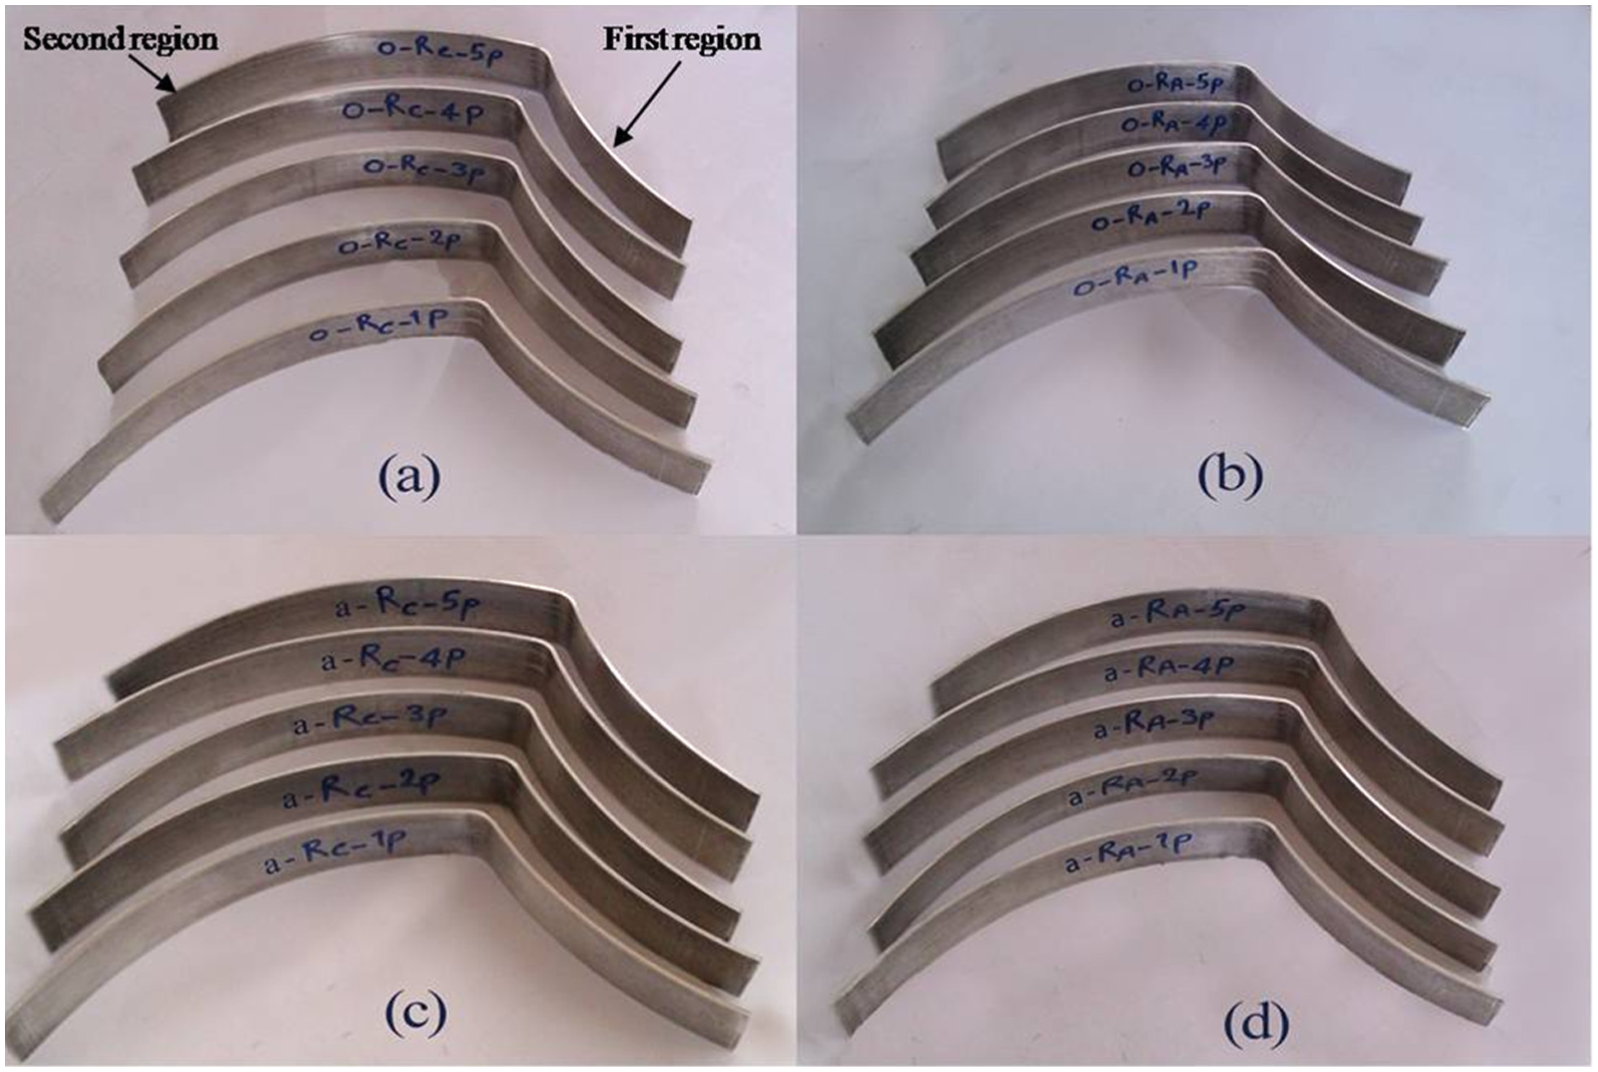
ECARed specimens: (a) as-received, RC; (b) as-received, RA; (c) annealed at 345 °C, RC; and (d) annealed at 345 °C, RA.
Microstructure evolution
Figure 9 demonstrates the optical micrographs recorded from the rolling surface of the as-received strips before and after ECAR process via RC. According to Figure 9(a), the elongated grains caused by the rolling process are observed in the as-received specimens. Figure 9(b) shows that the maximum grain refinement occurred after the first pass. Also, it can be understood from Figure 9(c) that the next passes do not have a considerable effect on grain refining process, and a steady state was achieved after the first pass. In addition, grains were slightly elongated in the longitudinal axis of specimen after the ECAR process via RC.
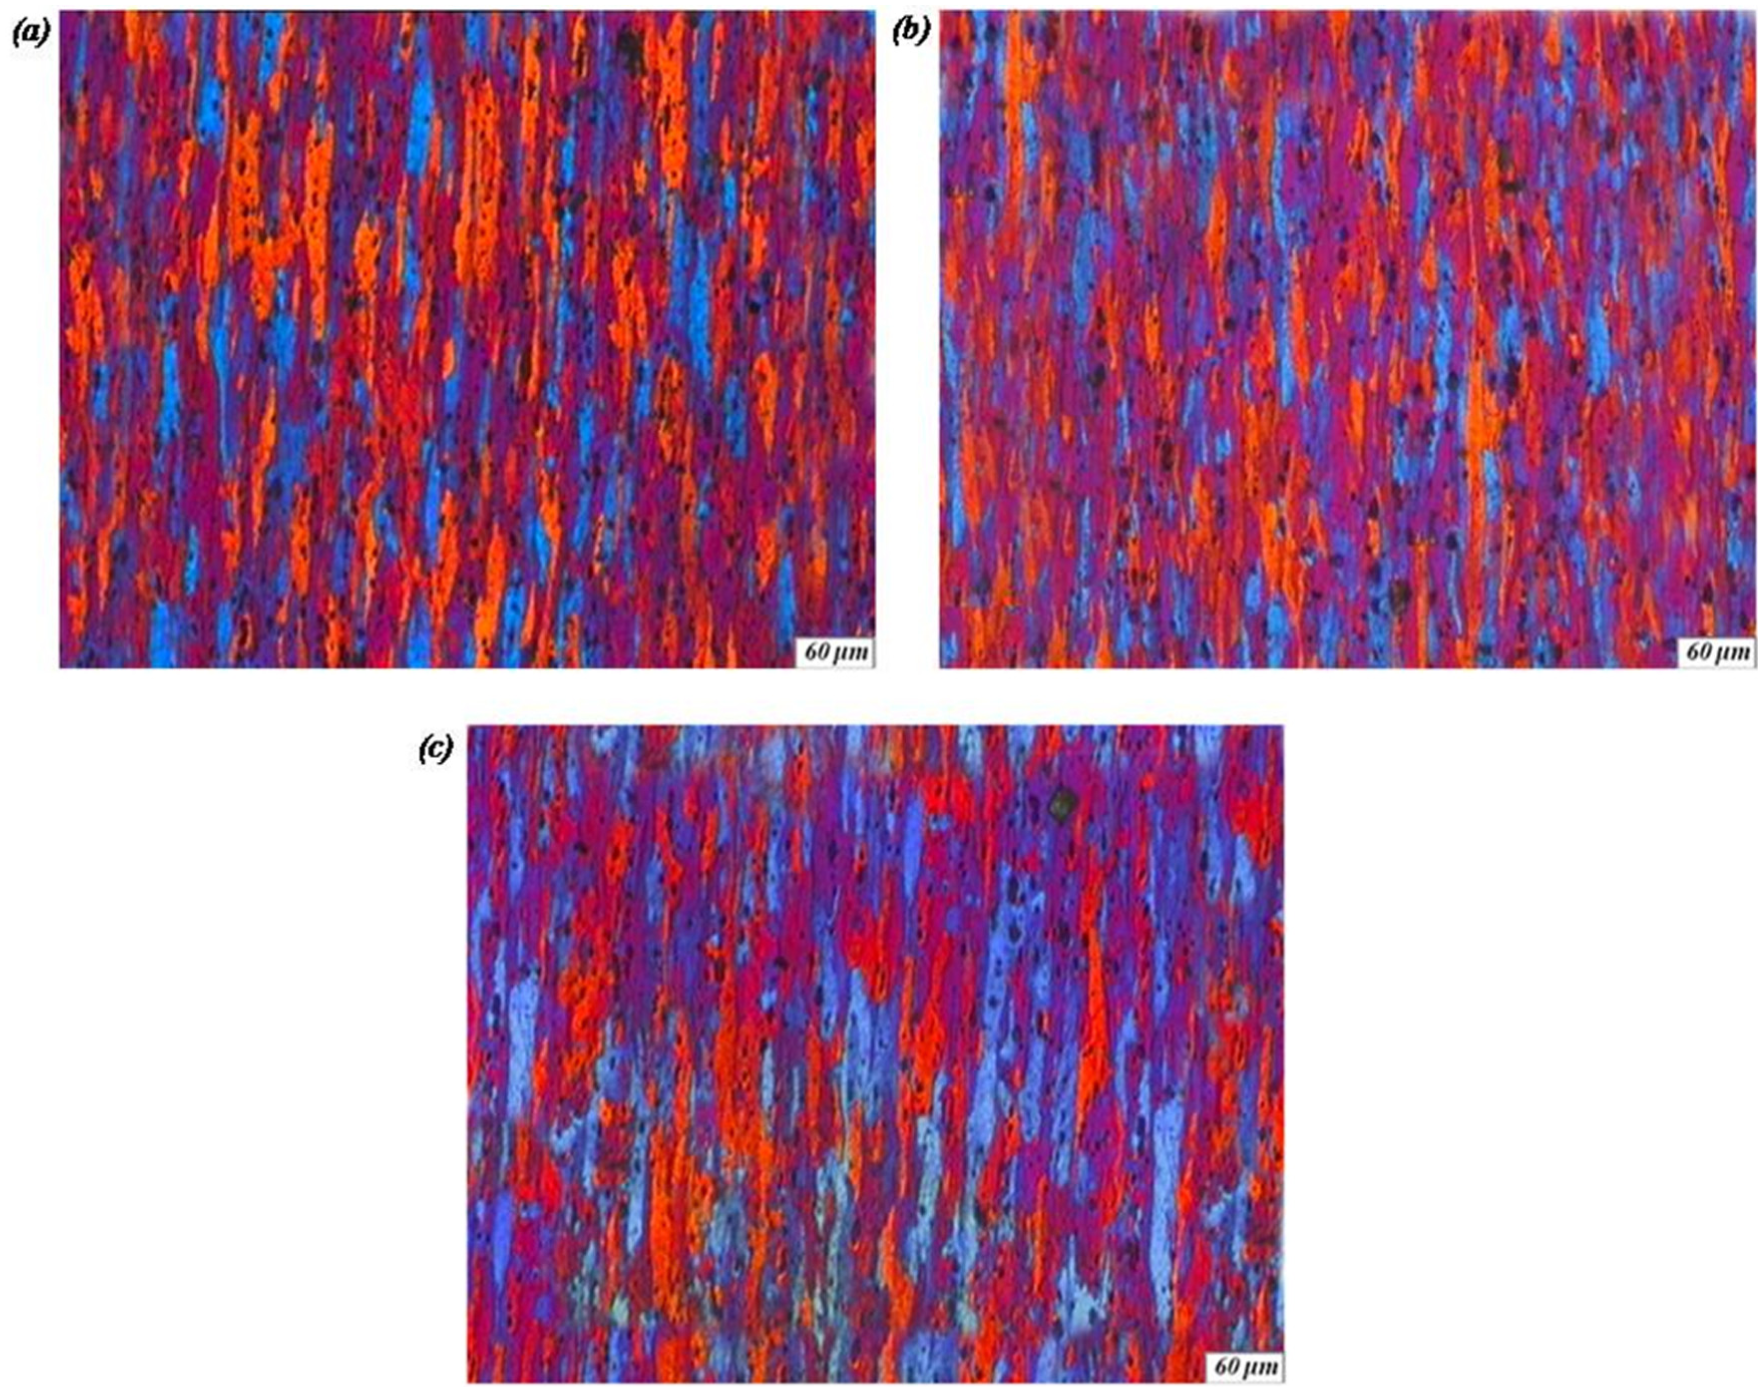
Optical micrograph of the strips before and after ECAR via RC: (a) as-received, (b) with one pass and (c) with three passes.
Figure 10 demonstrates the optical micrographs of the strips annealed at 345 °C before and after ECAR in RC. After annealing at 345 °C for 1 h, recovery and primary stages of static recrystallization occur. According to Figure 10(a) and after annealing at this temperature, the elongated grains caused by the rolling process were already present, and the grain size was hard to measure. As it can be seen in Figure 10(b), the grain size of the specimens annealed at 345 °C significantly reduces after one pass. As the number of passes increase to three (Figure 10(c)), it is observed that the grain refinement is occurred. But, the next passes have no considerable influence on the grain refinement (Figure 10(d)). Actually, grain refining rate reduced to the third pass, and then grain refining is saturated. This behavior has also happened in other SPD techniques.30,31
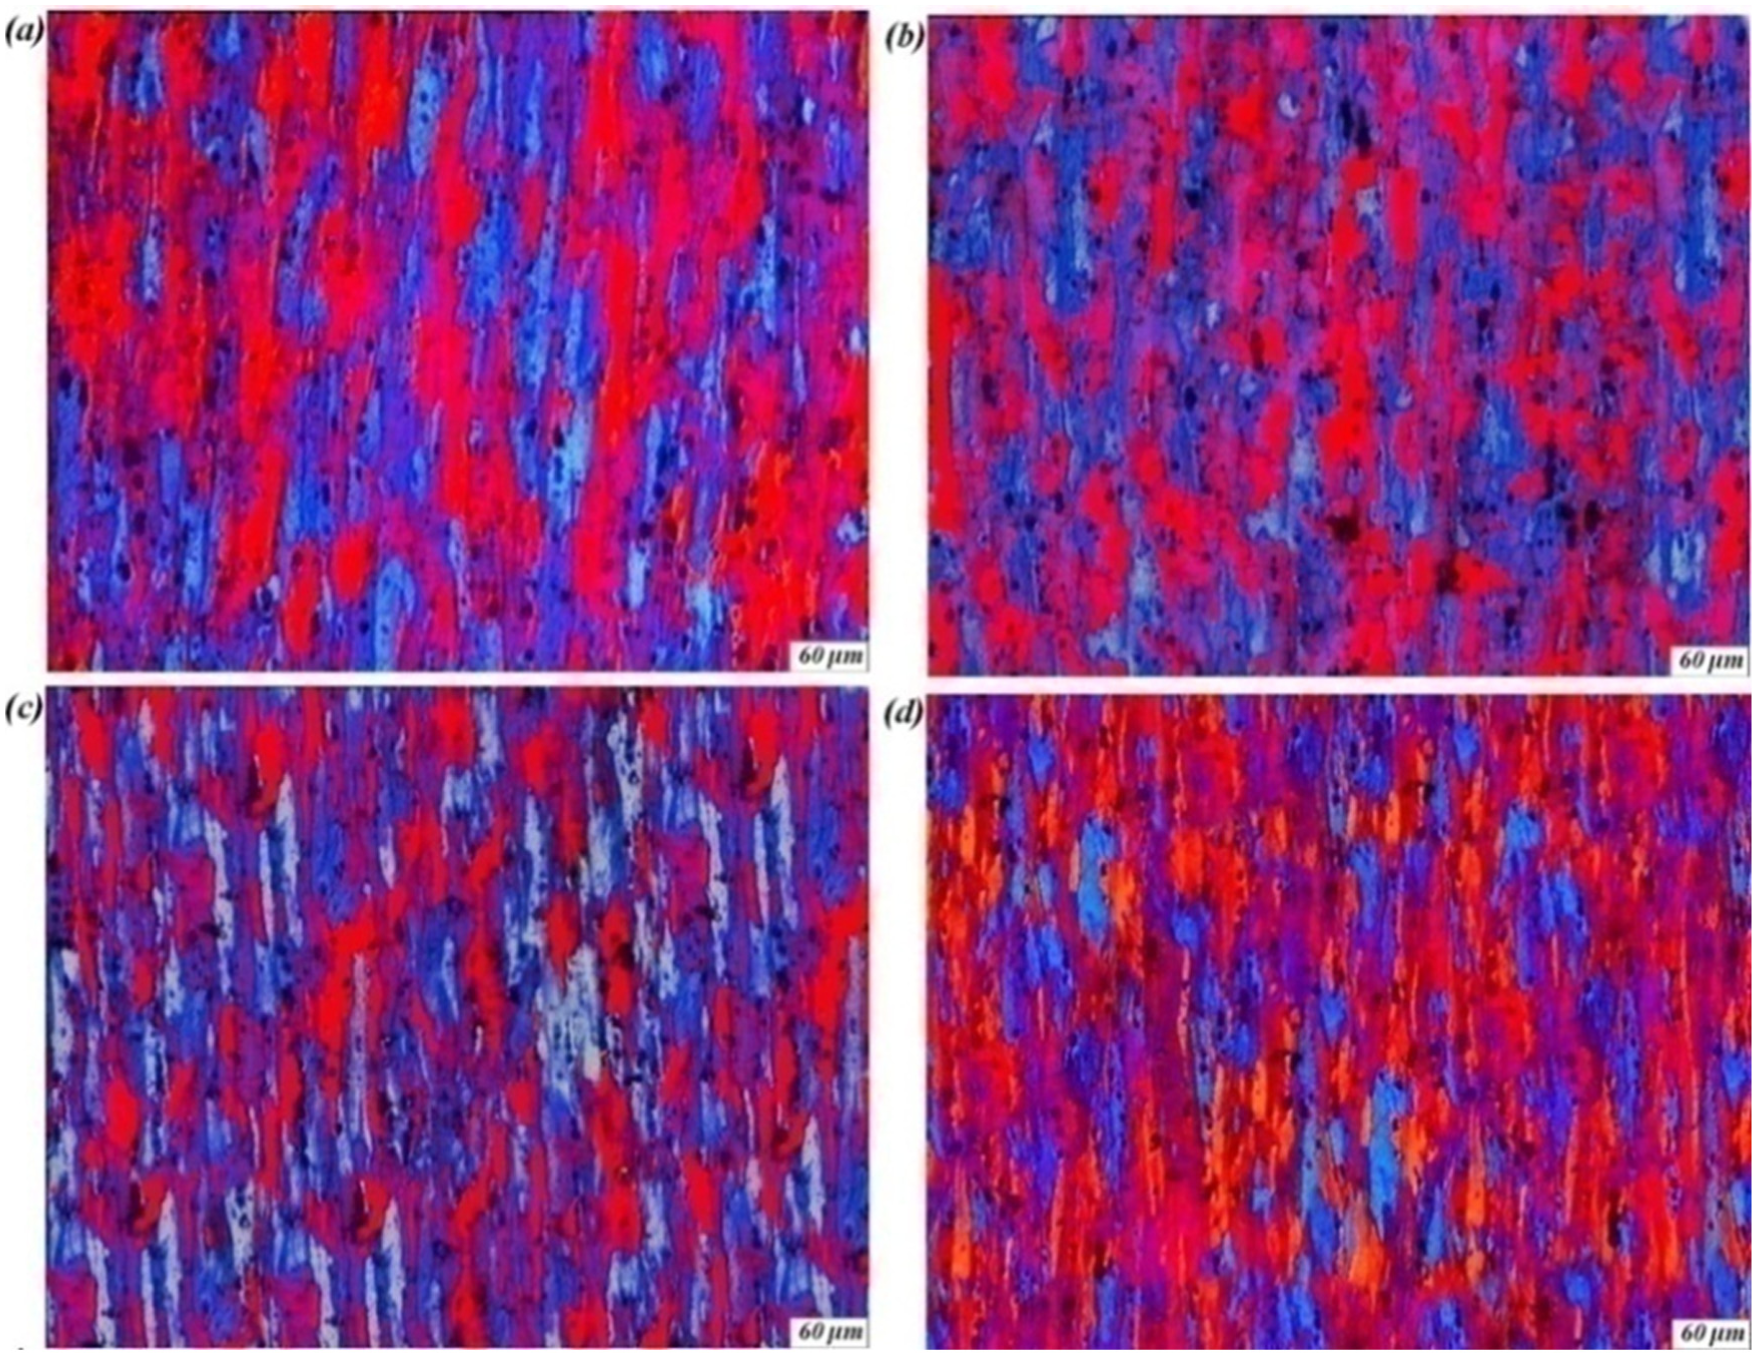
Optical micrograph of the strips before and after ECAR via RC: (a) annealed at 345 °C, (b) with one pass, (c) with three passes and (d) with five passes.
Figure 11 demonstrates the optical micrographs obtained from the strips annealed at 415 °C before and after ECAR in RC and post-annealing at 200 °C. After annealing at 415 °C, complete static recrystallization and grain growth were developed. Grains of specimens were sized by ImageTool software. Figure 11(a) is an optical micrograph prior to the ECAR and shows a relatively uniform and coarse grain microstructure with an average grain size of ∼40 µm. According to Figure 11(b), in the one-pass ECARed specimens, grain size is reduced from 40 to 17 µm. On the other hand, it can be understood from Figure 11(c) that the grain refinement rate reduced in next passes, and after the third pass, the grain size reached to about 8 µm. The main alloying elements in 5083 Al alloy are magnesium and manganese, which act as point defects within the lattice, so are obstacles to dislocation motion. The mechanism by which Mg atoms strengthen the material is through solute strengthening. Unlike Mg, Mn is expected to be in precipitate state. Precipitates strengthen the material by acting as obstacles to dislocation motion. 32
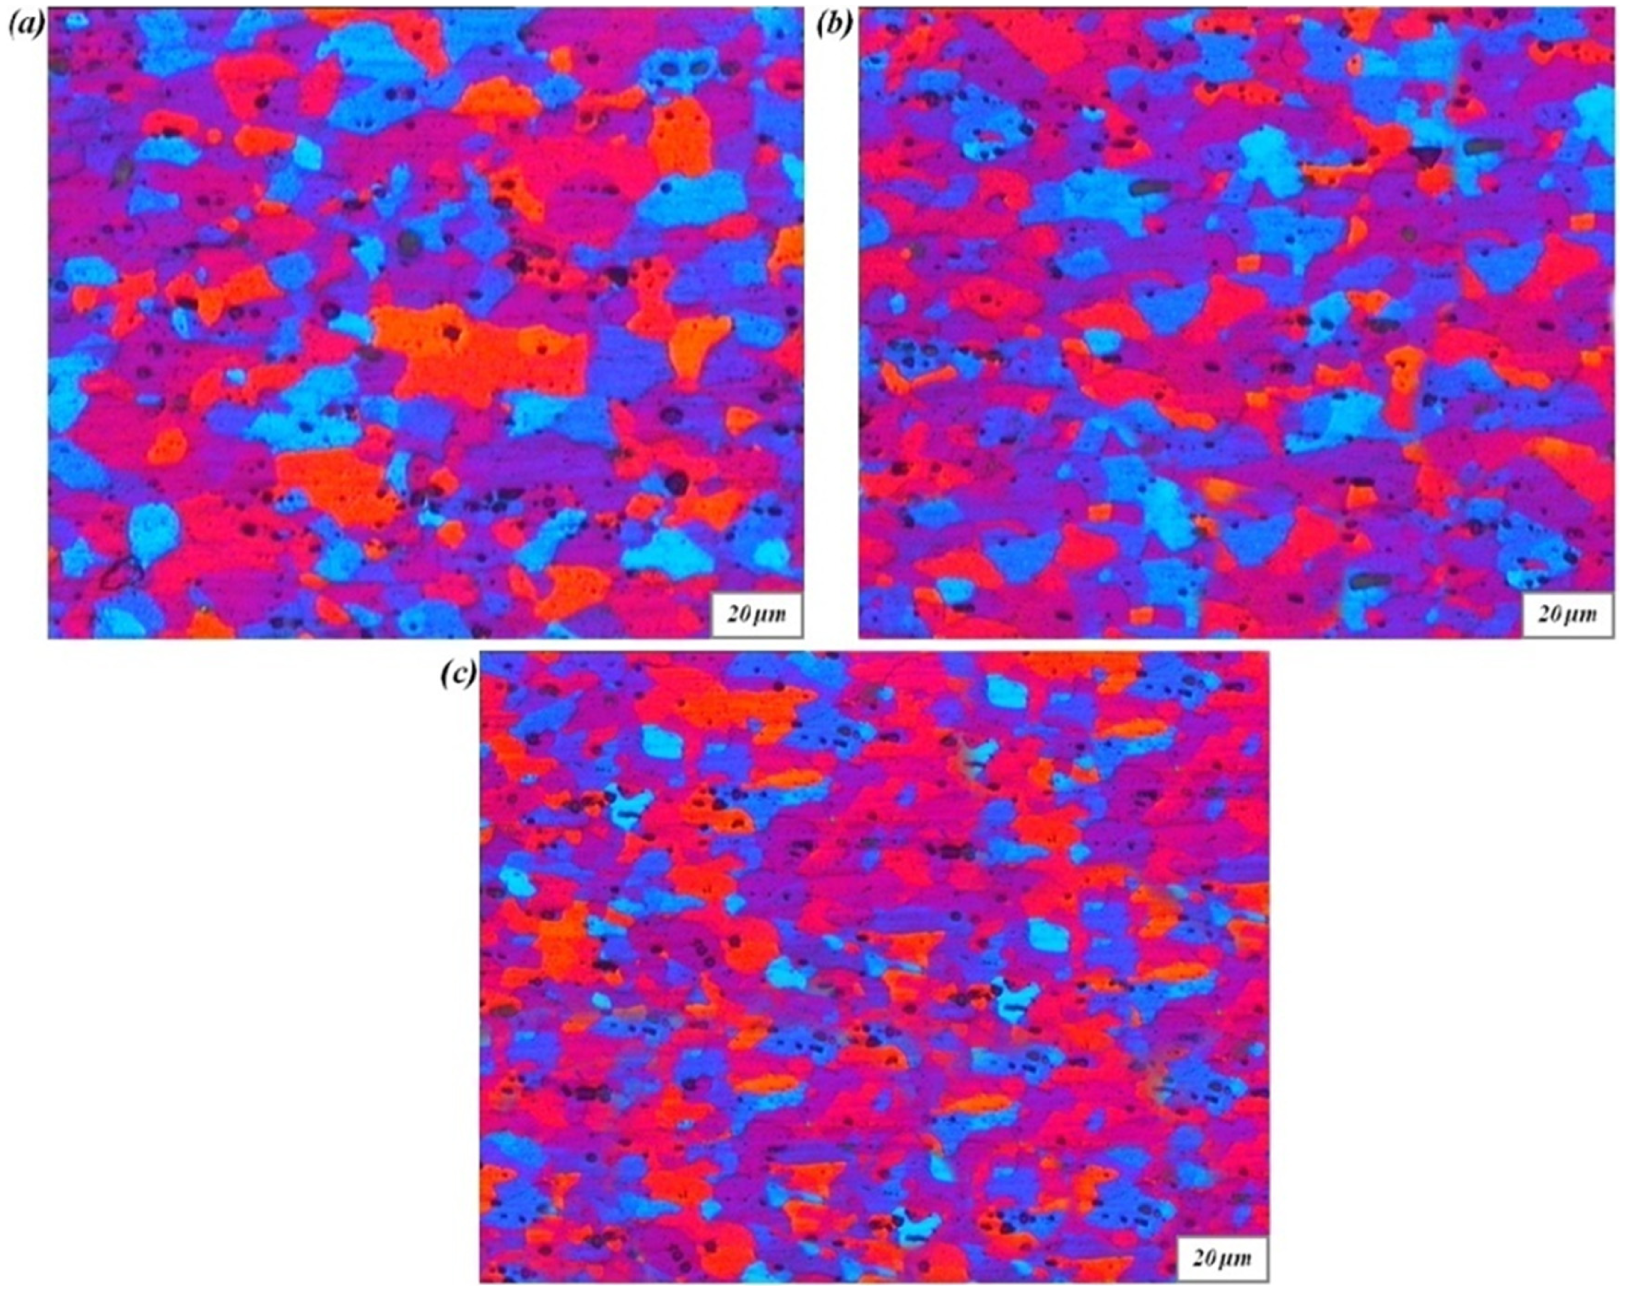
Optical micrograph of the strips before and after ECAR via RC and post-annealing at 200 °C: (a) annealed at 415 °C, (b) with one pass and (c) with three passes.
Figure 12 shows the TEM micrographs of the specimens annealed at 415 °C after three passes of ECAR via RC. Figure 12(a) demonstrates three types of boundaries, which are generated at different strains after SPD in a sequential structural evolution. This phenomenon includes dislocation cells, polygonized dislocation walls (PDWs), partially transformed boundaries (PTBs) and grain boundaries (UFGs). Many researchers have suggested mechanisms for the formation of the UFG under specific experimental conditions; however, the detailed mechanism of the transformation from a PDW into a grain boundary is not clearly explained yet. In fact, PDWs first transform into PTBs and then transform into grain boundaries, the reason of this transformation process is expected to be an increase in dislocation density in these boundaries. During SPD, a cell structure generated by dislocation tangle is first transformed into a granular one. When further strains are applied, these granular structures are transformed to the UFG structure by the partial annihilation of dislocations of opposite signs at cell boundaries. 33 Valiev et al. 34 proposed that the transformation mechanism from PDW into a grain boundary structure can be caused by an increase in dislocation density inside these boundaries during straining. According to Figure 12(b), the image shows a large population of dislocations that is spread both inside the grains and at the grain limits. The dislocations belong to all slipping planes and look so messed up because of the plastic strain accumulated in the structure. As seen in Figure 12(b), grain structures could be hardly detected probably due to high level of straining, the formation of complex dislocation loops and tangles, the structure consisting of grain remainders and fibrous structure.
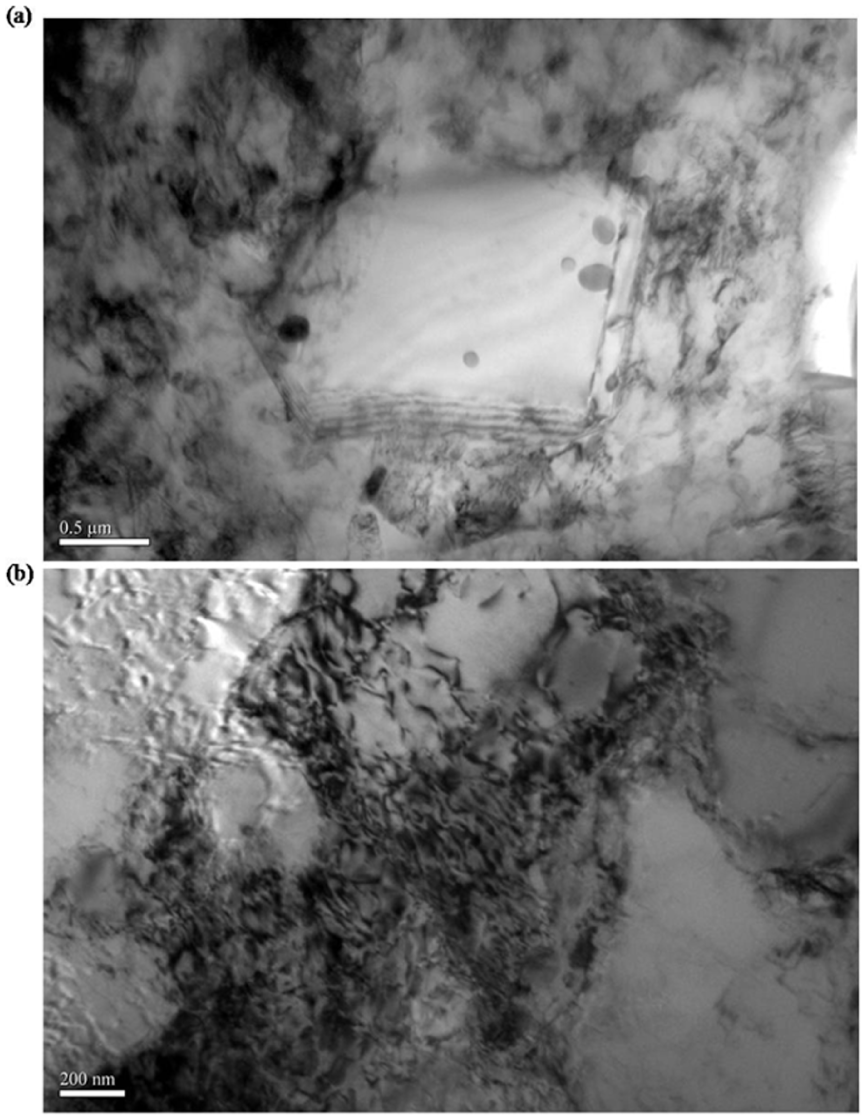
TEM images of the specimens annealed at 415 °C after three passes of ECAR via RC (a) scale bar, 0.5μm and (b) scale bar, 200 nm.
Figure 13 shows optical micrographs of the strips annealed at 415 °C after three passes of ECAR in RC and post-annealing at 200 °C and 300 °C. Post-annealing is conducted to improve the uniformity of the equivalent plastic strain after ECAR and to reduce residual stresses, rearrangement and annihilation of dislocations. Also, post-annealing process makes the grains more uniform and equiaxed. According to Figure 13(a), after post-ECAR annealing at 200 °C, the average grain size was measured about 8 µm. As it can be seen in Figure 13(b), after post-ECAR annealing at 300 °C, the grain size is increased to 15 µm. Post-annealing of 5083 Al alloy in 300 °C leads to create new grains at the subgrain boundaries that had enough time for their apparent growth. Thus, new grains grew and formed equiaxed grains. Regarding to Figure 13, if the post-ECAR annealing temperature increases, the grain size increases, and the effect of grain size refining by ECAR process is decreased. Therefore, the post-ECAR annealing temperature has a specified difference with the recrystallization temperature.
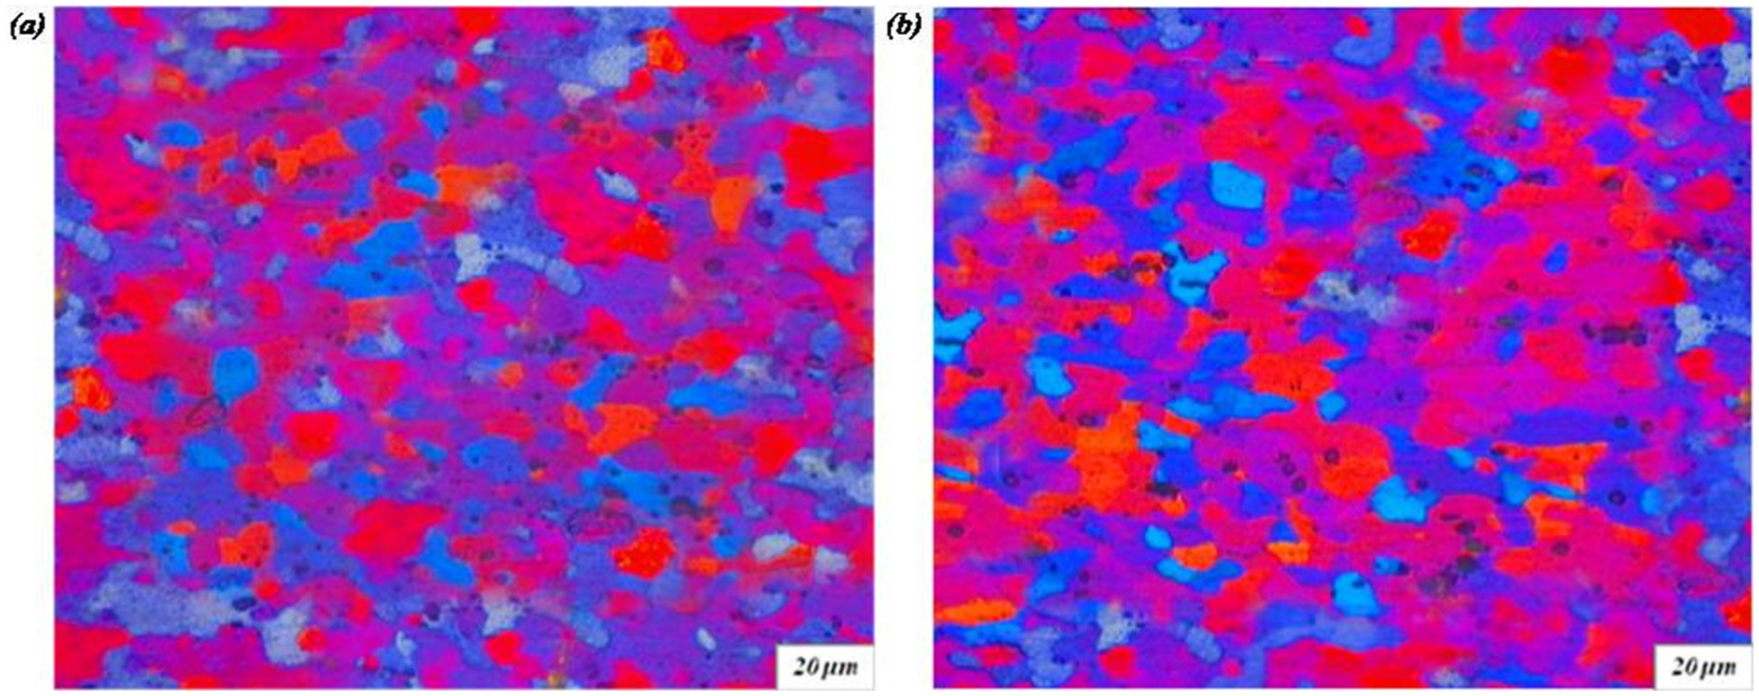
Optical micrographs of the specimens annealed at 415 °C after three passes of ECAR via RC and post-annealing at (a) 200 °C and (b) 300 °C.
Tensile behavior
Figure 14 is a graphical illustration of the tensile properties of the test pieces as a function of the number of passes and routes. Since the mechanical properties are very closely related to the strain introduced into the material, the tensile properties of the strip were measured as a function of the number of ECAR passes (accumulated strain). As can be seen in as-received specimens (Figure 14(a)), UTS and YS are increased from 330 to 372 MPa and from 178 to 314 MPa, after the first pass, respectively. In contrast, the elongation is reduced from 13.5% to 8%. After the first pass, the strain hardening, increased dislocation density and formation of the UFG microstructure can improve the mechanical strength. For further ECAR passes, almost no considerable change in mechanical properties was observed. This steady behavior might be explained by the softening process caused by annihilation of the dislocations. As can be seen in the specimens annealed at 345 °C (Figure 14(b)), UTS and YS are increased from 320 to 346 MPa and from 163 to 265 MPa, after the first pass, respectively. In contrast, the elongation is reduced from 22% to 13%. During the first pass, the density of dislocation at the boundary and inside of primary coarse grains increases, and strain hardening is the main mechanism of strengthening. Until the third pass and in RC, the UTS and YS have increased up to 371 and 316 MPa, respectively. After the third pass, the elongation decreases to 7.8%. After the first pass, until the third one, the strain hardening has no significant role in the strengthening mechanism. The main cause of strengthening is attributed to conversion of grain boundaries from the low angle to the high angle and the grain refinement. 35 According to Figure 14(b), after the third pass, the mechanical properties are not altered remarkably by increasing the number of passes. Also, it can be understood from Figure 14(b), the UTS and YS in RC are slightly higher than those of RA. After each pass, rotation of the specimen around the longitude direction by 180° improved the uniformity of plastic strain distribution. This may be the main reason for better mechanical properties of ECARed specimens with RC compared with RA. According to Figure 14(c), the YS of the samples annealed at 415 °C is 145 MPa, but it has been increased up to 287 MPa after three passes in RC. Thus, the ECAR process has improved the YS by a factor of approximately two with respect to the annealed ones. In addition, UTS is increased from 295 to 338 MPa, while the elongation is reduced from 27% to 8.6%. Hence, improvement of strength properties of the three-pass ECARed specimens have been more considerable with respect to one-pass ECARed ones.
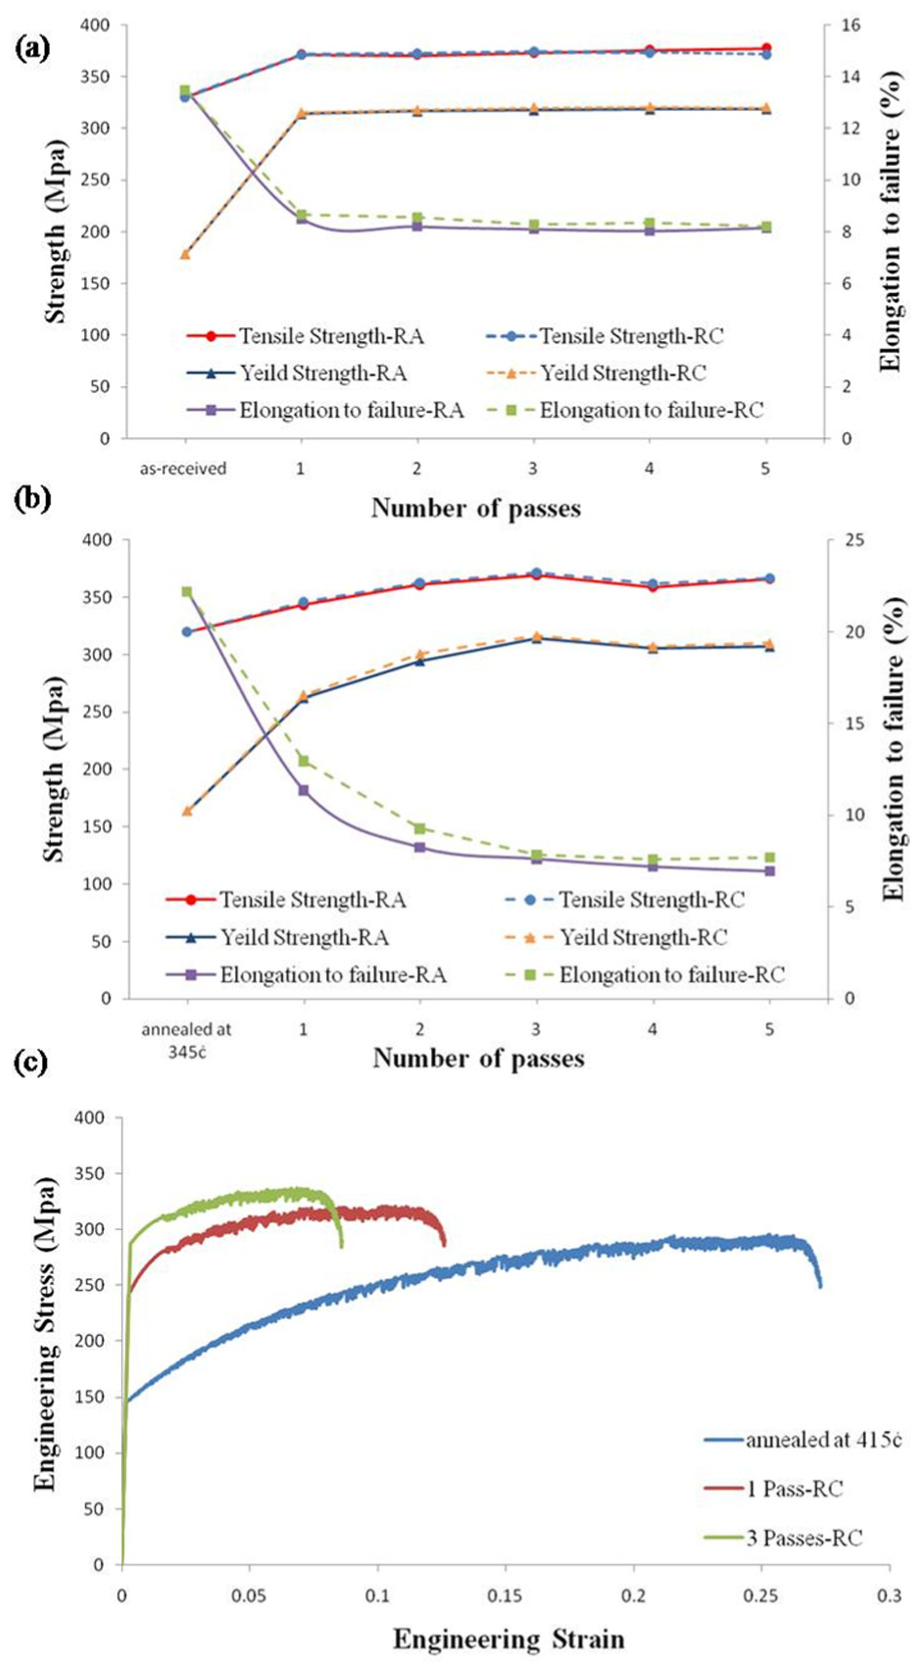
The variation of tensile properties as a function of the number of ECAR passes: (a) as-received, (b) annealed at 345 °C and (c) annealed at 415 °C, RC.
Hardness
Experimental results indicate that the hardness response to ECAR process partially resembles the strength response. Figure 15(a) graphically illustrates that after the first pass of ECAR, the hardness of the as-received strips increased remarkably. This behavior indicates to the increased dislocation density and the formation of the UFG microstructure. For subsequent ECAR passes, almost no considerable change in hardness was observed. The steady behavior of hardness after the first pass of ECAR is because of the accumulative strain level which has reached to the critical strain level.6,9 According to Figure 15(b), in the specimens annealed at 345 °C and RC, there is an increase in the hardness value by 7.7% after the first pass. The rapid increase in hardness at the first pass can be related to strain hardening effect due to formation of subgrain boundaries instead of grain refinement. After the first pass, the hardness has further increased up to the third pass, and the strain hardening is not influential in the hardening mechanism. Thus, the most important reason of hardness increase is the formation of the UFG microstructure as stated by Hall–Petch relation. 35 It is noteworthy that there is an increase in the hardness value by 18.5% after the third pass which was expected to be more (Figure 15(b)), indicating the reducing rate of the hardness enhancement. Also, hardness enhancement is saturated after the third pass. It can be observed that the hardness of RC is slightly higher than that of RA, because of a more uniform distribution of plastic strain in RC. According to Figure 15(c), up to three passes in RC for the samples annealed at 415 °C, the hardness values are increased significantly by 44%. The increase in hardness at the beginning of ECAR process is related to the rapid increase in the dislocation density and strain hardening effect which results in strengthening of the material. On the other hand, in the further passes up to the third one, the grain refining acts as the strengthening mechanism.
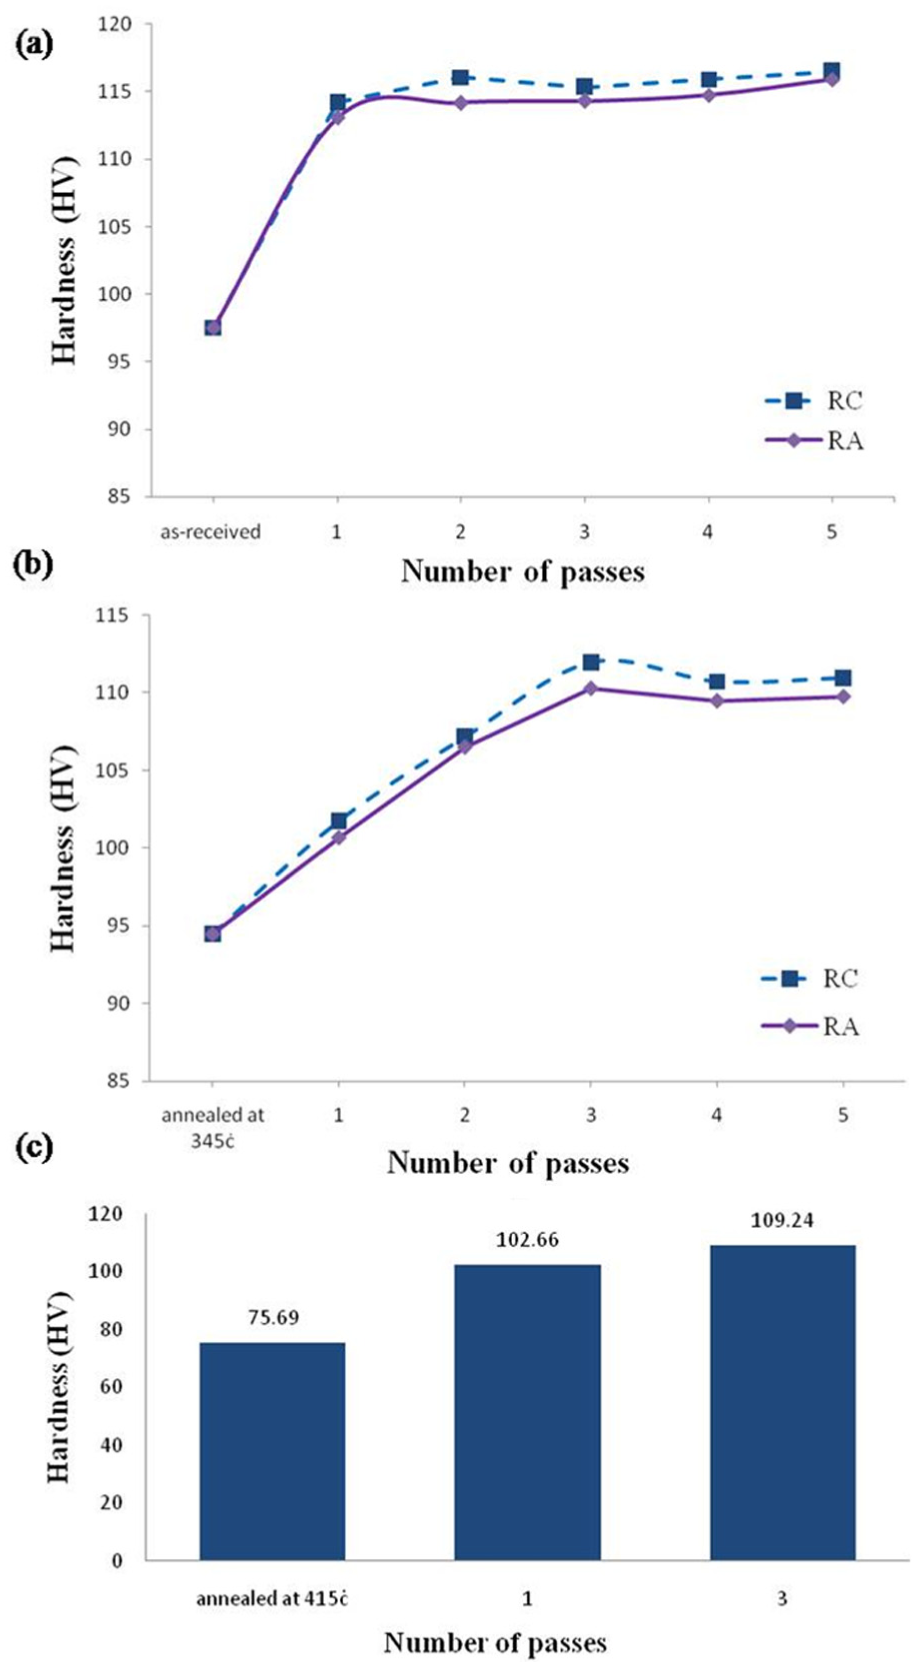
Variation of hardness of the specimens after ECAR process with respect to the number of passes: (a) as-received, (b) annealed at 345 °C and (c) annealed at 415 °C, RC.
Effect of the post-ECAR annealing on mechanical properties
Figure 16 is a graphical demonstration of the tensile properties variation in the specimens annealed at 415 °C after ECAR in RC and post-annealing at 200 °C and 300 °C. According to Figure 16 and after post-annealing at 200 °C, YS and UTS are reduced from 287 to 240 MPa and from 337 to 331 MPa, respectively, while the elongation is increased from 8.6% to 17.5% in the three-pass ECARed specimens. As a result, toughness is increased due to the reduction in residual stresses, rearrangement and annihilation of dislocations. As it can be seen in Figure 16, after post-annealing at 300 °C, YS and UTS are reduced from 287 to 185 MPa and from 337 to 313 MPa, respectively, while the elongation is increased from 8.6% to 22% in the three-pass ECARed specimens. Thus, it can be understood from Figure 16, the UTS and YS are higher after ECAR and post-annealing at 200 °C, compared with the same values in post-annealing process at 300 °C. In addition, the elongation after post-annealing at 300 °C is greatly increased. Since there is a sharp decrease in strength value after post-annealing at 300 °C, it is more convenient to reduce the temperature to 200 °C and obtain a higher strength value.
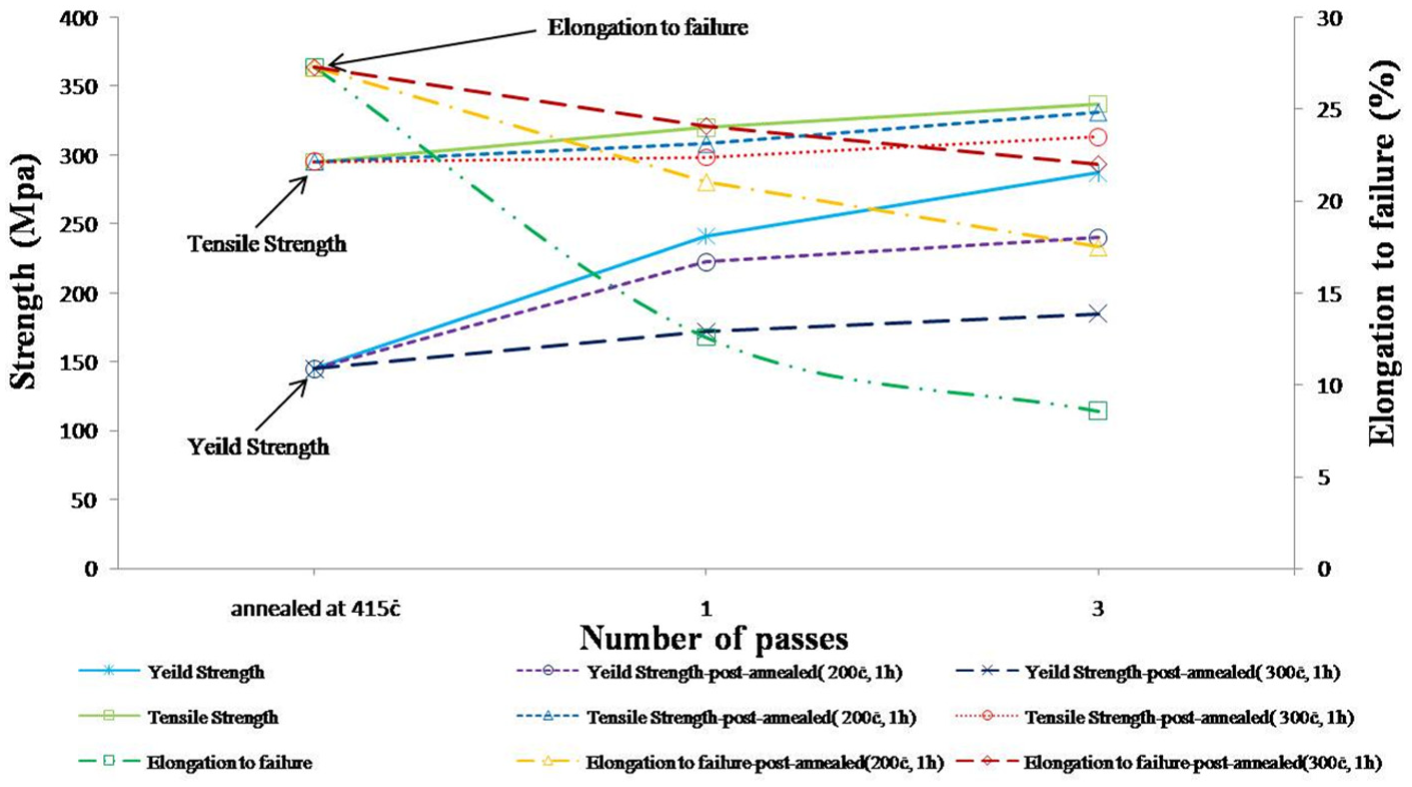
Tensile properties variations of the specimens annealed at 415 °C after ECAR process in RC and post-annealing at 200 °C and 300 °C.
Figure 17 shows the hardness variation in the specimens annealed at 415 °C after ECAR in RC and post-annealing at 200 °C and 300 °C (for 0.5 and 1 h). Post-annealing of the samples after ECAR process can provide a time for the rearrangement of dislocations in samples’ microstructure. Post-annealing at 200 °C for 1 h resulted in a 10% decrease in hardness after one-pass ECAR and 11% after three-pass ECAR. Whereas, post-annealing at 300 °C resulted in a 24% reduction in hardness value after one-pass ECAR and 27% after three-pass ECAR. It is observed that the reduction in hardness values in the three-pass ECARed specimens is higher than one-pass ECARed ones. The reason of this phenomenon can be the more strain hardening amount which exists in the strips after three passes. Actually, the key point behind the thermal stability of the severely deformed materials is the reduced mobility of the boundaries even at higher temperatures. This phenomenon could also take place in previous works.1,36 The amount of reduction in hardness values after post-annealing at 300 °C is higher with respect to 200 °C due to more recovery that happens at higher temperatures. The decrease in the hardness values might be due to the grain growth effect, besides the rearrangement and annihilation of dislocations. As it can be seen in Figure 17, the result of increasing post-annealing time is a more decrease in hardness value. In addition, with increasing post-annealing temperature, the effect of time variations is reduced.
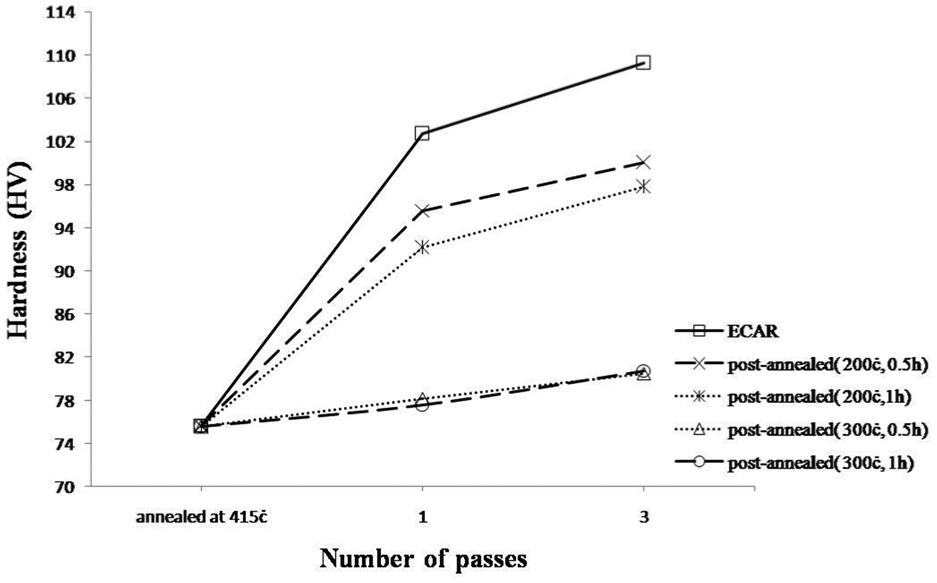
Hardness variations of the specimens annealed at 415 °C after ECAR process in RC and post-annealing at 200 °C and 300 °C (for 1 and 0.5 h).
Conclusion
Finite element analysis and experimental procedures have been carried out to study the ECAR process of 5083 Al alloy strips, in order to understand the influence of process parameters including pre-ECAR annealing temperature, routes, number of passes and post-ECAR annealing temperature on mechanical properties and microstructure of the strips. The following conclusions can be drawn:
Results of optical microscopic examination on the specimens annealed at 345 °C showed that the grain refinement occurred until the third pass, and the next passes have no significant influence on the grain refinement. Also, ECAR process up to three passes and post-annealing at 200 °C on the specimens annealed at 415 °C led to an average grain size reduction from 40 to 8 µm.
Applying SPD by the ECAR process up to three passes on the samples annealed at 345 °C causes a considerable increase in the hardness, UTS and YS values, and in contrast, a reduction in the elongation. While considerable changes in the mechanical properties and hardness of the as-received specimens happen only in the first pass.
The route of ECAR process has a slight effect on improvement of mechanical properties. The better mechanical properties of ECARed specimens with RC compared with RA are due to the more uniform distribution of plastic strain.
Based on the results of mechanical tests, the post-ECAR annealing leads to a decrease in the hardness, UTS and YS values and an increase in elongation. As a result, toughness is increased because of reduction in residual stresses, arrangement and annihilation of dislocations. Because of a sharp decrease in hardness and strength after post-annealing at 300 °C compared to post-annealing at 200 °C, it is more appropriate to select the latter as the post-ECAR annealing temperature.
According to the numerical simulation results, the amount of equivalent plastic strain in middle path of the strip is increased in further passes, and the routes in ECAR process have little effect on the amount of equivalent plastic strain. But in RC, the distribution of plastic strain along the strip thickness is more uniform with respect to RA.
Footnotes
Declaration of Conflicting Interests
The author(s) declared no potential conflicts of interest with respect to the research, authorship and/or publication of this article.
Funding
The author(s) received no financial support for the research, authorship and/or publication of this article.