
Abstract
When a composite laminate is tailored to suit its design intent, it is possible to improve the individual ply shapes to reduce component mass. If the laminate is going to be manufactured using an automated deposition system such as an automated fibre placement machine, then the design of the laminate will also influence the material deposition speed. This article identifies methodologies for indicating the likely impact on automated manufacture at the design optimisation stage by evaluating the ratio of ply perimeter to ply surface area when the laminate is defined as a simplified array of cells which are filled or unfilled to create a two-dimensional representation of the ply shape. A set of recommendations are made for using the methodology for improving deposition speed.
Introduction
Composites materials are a very attractive choice to the designer because of their superior performance when compared to metals. Composites offer designers the flexibility to customise structures to attain higher performance with lower overall costs. Structural engineers are able to exploit the quasi-isotropic nature of the laminate to tailor the sequence of layers in any area of the component to suit different structural requirements. In this work, we define ‘composite’ as carbon fibre–reinforced plastics (CFRPs).
The use of composite materials in aerospace primary structures has been growing rapidly, with companies such as Airbus introducing all-composite aircraft such as the A350 XWB, and Boeing creating the 787 Dreamliner. This had led to an increase in the use of automated deposition technologies such as automatic tape laying and automated fibre placement. 1
In automated composite deposition, carbon-fibre tape (for automated tape laying (ATL) machines) or groups of individual carbon-fibre tows (for automated fibre placement (AFP) machines) are applied layer-by-layer onto a tool. These layers are defined as plies, and each ply has a principle fibre orientation which is defined as a principle fibre angle whose deviation is measured from a fixed axis for the component. Designers may vary the quantity of the plies with specific fibre orientations and change their position or sequence within the laminate to alter the structural behaviour of the laminate. These changes are often carried out by a structural optimisation tool which will indirectly change the shapes of the plies at each layer in the structure as it attempts to achieve the best sequence of ply orientations beneath various points on the surface of a laminate while maintaining the minimum laminate thickness. In some structural optimisation methods, a series of surface points are identified and the structure beneath them is optimised locally, treating the laminate at each point as independent from its neighbouring points. When the laminate is manufactured, it is built up from a number of global layers, not isolated patches, requiring the designer to attempt to re-join these fragmented plies that have the same orientation to create larger, more continuous ply shapes.
The main research question investigated by this article is as follows: how can we indicate the likely speed of production of a laminate during the early laminate definition stages without having a detailed design to run a production simulation from?
In industry, it is accepted that up to 80% of the manufacturing cost of a structure cannot be changed once the concept configuration has been fixed. 2 Only half of the literature articles reviewed as part of this study are in a position to influence more than 20% of the manufacturing cost through the application of design for manufacture principles. This is because these articles are focused on the conceptual design of components. Out of the remaining half, only three articles spanned a large enough portion of the design lifecycle to include the physical manufacture of a component, and a further eight contained research that includes an element of manufacturing design, such as a process simulation.
The challenge of being able to make a design configuration decision and understand the impact of that decision regarding the cost, complexity and suitability of its manufacture is yet to be addressed and is the main driver for this study. In the aerospace industry, most of the recent CFRP designs are now utilising automated deposition technology. The design and manufacturing of these composite structures are typically interdependent. The design will significantly influence manufacturing characteristics such as process efficiency, quality and processing time, and, respectively, manufacturing will impose constraints to the design and determine the manufacturability of the structure. 3
The technology is new and novel, and very little research has been carried out into ways of optimising a design to suit the AFP manufacturing process.
Methodology
A number of proven best-practice ideas have emerged from a review of published literature articles, and the opportunity exists to utilise these ideas in an industrial context. The most interesting articles that have high potential to be applied to an industrial use-case address three main research topics:
The steering of AFP fibres and the exploitation of the effects for structural and manufacturing benefits;4–9
The capture of key manufacturing knowledge and its exploitation at early design stages;10–18
The use of multi-objective optimisation to consider the requirements of multiple disciplines concurrently.7,12,19–22
This study takes the concept of capturing key manufacturing process knowledge and attempts to exploit is at an early design stage as the concept has not yet been applied for manufacturing knowledge specific to automated deposition.
With manufacturing cost being driven by process cycle times, which are, in turn, influenced by the product design, accurate and reliable cost estimation can only be obtained at a later stage of the development process when more information and data are presented. 23 Typically, the earliest that an estimation of the automated deposition cycle time can be produced is when a laminate design can be used to run a digital process simulation. The downside of using a digital process simulation is the requirement of the digital tools to run from a detailed computer-aided design (CAD) model, which is labour-intensive to produce. It is therefore very desirable to be able to perform a lightweight simulation or estimation of the production process cycle time before any labour is used creating a CAD model of the laminate. This study evaluates an opportunity to model the conceptual laminate design as a series of simplified two-dimensional (2D) arrays, or tables, specific to each layer in the laminate, and then draw comparison between the area and boundary length of each layer relative to a detailed design, simulation and physical ply layer manufacture.
Results
Representing the laminate with a simplified 2D array for each ply has been adopted because the approximate shapes are very similar to the structural model of an aircraft structure such as a wing skin or fuselage panel. The sizing data are stored in a compatible format.
Figure 1(a) represents a table which records the intended thickness of each cell in the panel, and this can be directly mapped between the CAD model (Figure 1(b)) which is a surface with three-dimensional (3D) geometry and ply data attributed to it, illustrated as a top-view. Figure 2 illustrates a 45° ply from the laminate shown in Figure 1(a) and the approximate shape of the ply in table format.
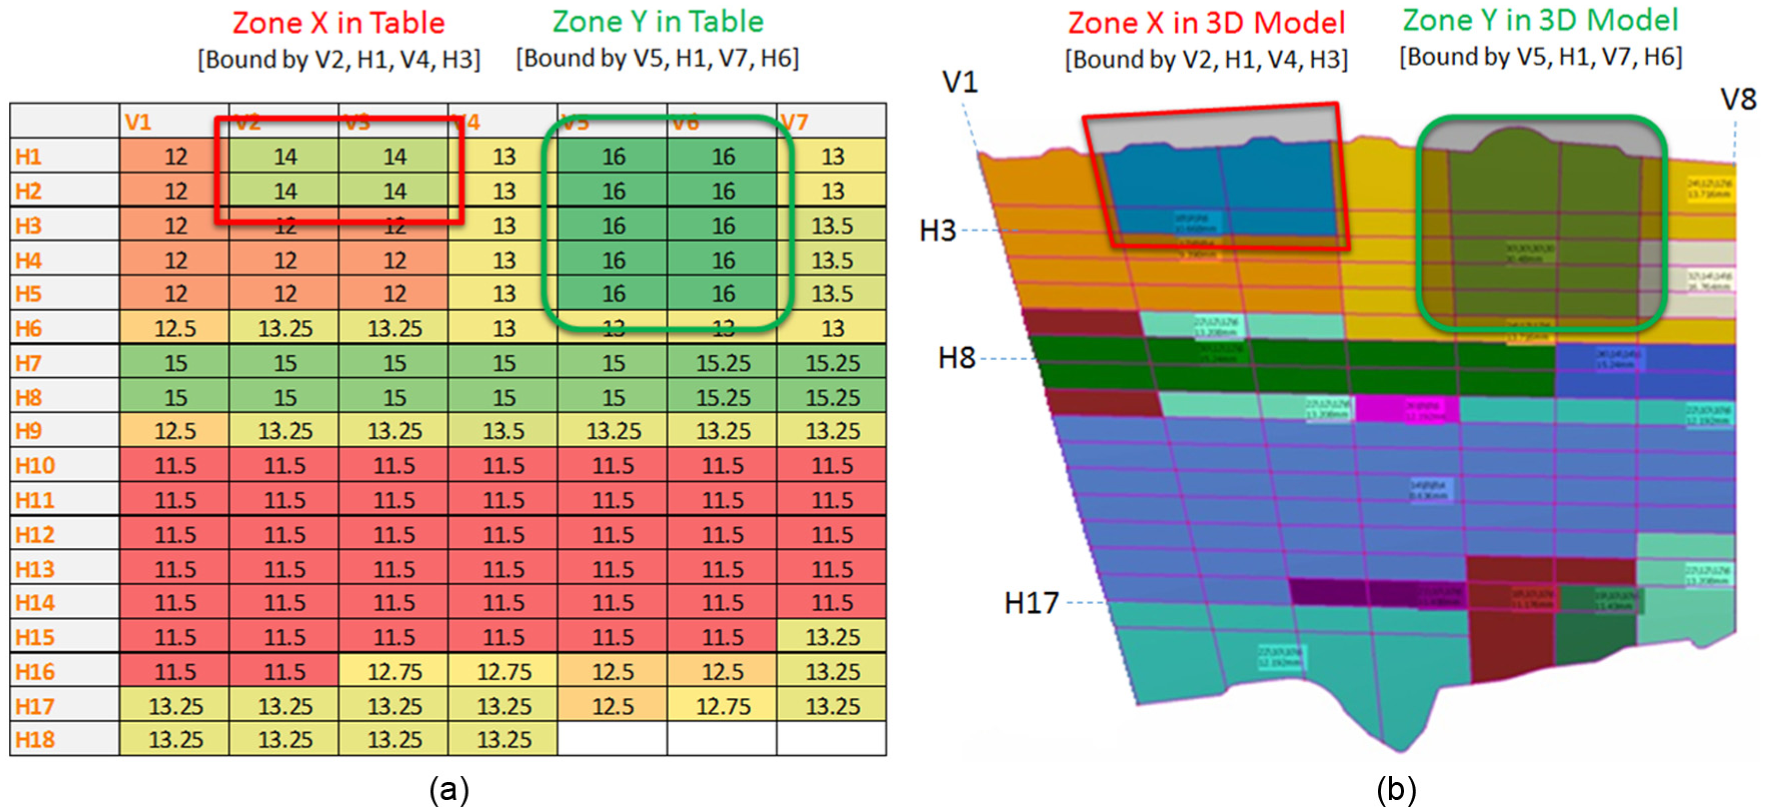
Example composite panel represented as (a) table representation and (b) CAD geometry.
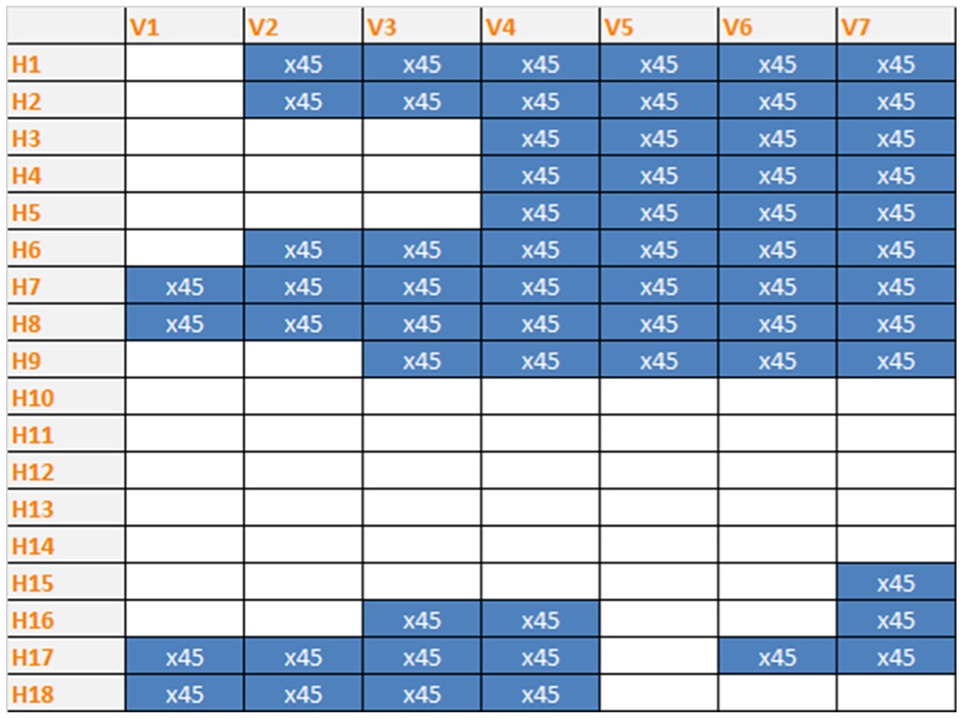
Sample ply representation generated from laminate definition data.
This Excel-based table representation of each ply area coverage allows a designer to make changes to the laminate definition before progressing to a 3D CAD model. The 2D array format is common with most outputs from grid-based structural optimisation tools. The manufacturing constraints, in the form of machine motion for each ply shape, therefore need to be represented in this table format for the ply shapes.
Representing the kinematics of the deposition machines
Production speed improvement for an AFP machine requires the amount of time that the AFP machine is laying at full speed to be increased, while the time that the machine accelerates, decelerates and moves from position to position without laying material needs to be reduced.
The typical machine motion for laying a course of material over an omega cross-sectioned component is shown in Figure 3. The machine accelerates along the tool surface until it approaches the start of the ply; at this point, the machine slows down as it feeds material onto the roller. The machine accelerates up towards maximum deposition speed. The machine motion then decelerates as it approaches the end of the ply boundary so that the material can be cut.
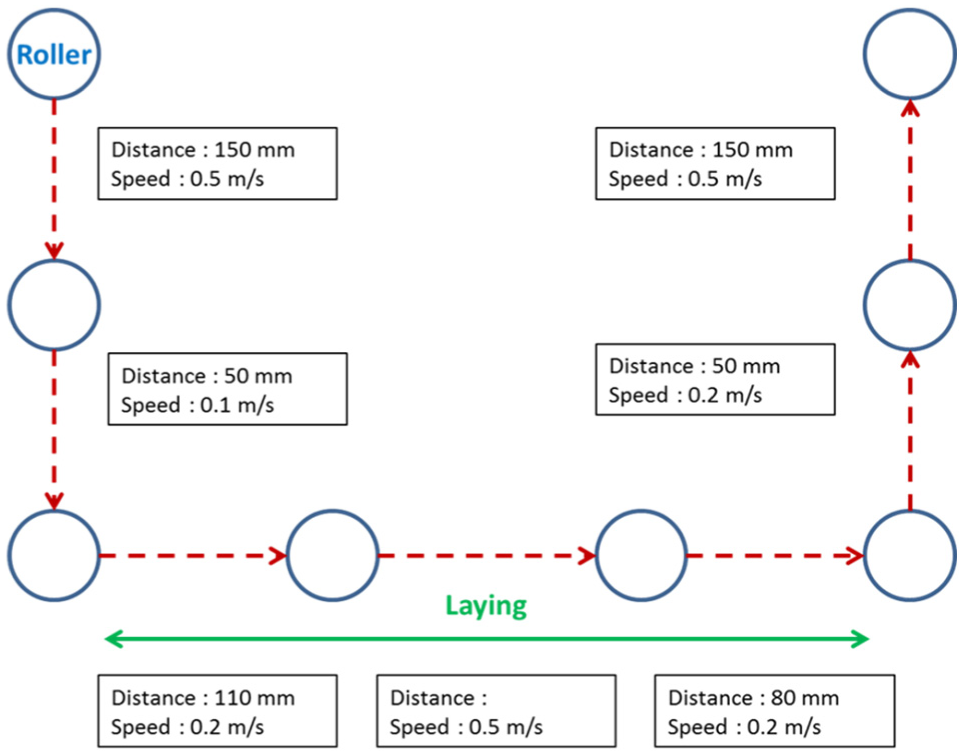
Schematic of machine motion.
The deceleration can be directly linked to the ply boundary where the machine trajectory is slowed down to perform cutting, turning or non-value-add motion moving to the start of the next course. This suggests that a ply with large surface area coverage but a small perimeter boundary will be faster to produce than a cell with smaller area coverage and a larger ply perimeter, or a fragmented ply shape with high complexity and high aspect ratio. In these cases, a designer can improve the manufacturing speed by reducing the amount of distance that an AFP machine must travel without depositing material, as this is non-value added in the cycle time.
Comparison of kinematics to ply model
For each ply in the laminate, the fibre direction is identified, and the cells can be assumed to either contain or not contain material occupancy. By travelling through the cells in the array one-by-one, the comparison of each cell to its neighbouring cell can establish if a ply boundary is present, or if the cell is continuous with its neighbouring cells. Looking at each ply as an array and building, a score that represents the ratio of number of boundaries by the number of cells occupied by material allows a designer to create a numerical ply continuity score for each ply shape generated.
The continuity score is calculated according to the following rules:
In a given direction, each cell will contribute a score of 1 to the tally (Cdirection = number of cells/direction).
In a cell-by-cell move in the given direction, any change in the occupancy status reduces the directional continuity score tally by 1 (Cdirection − 1).
The total tally is obtained by multiplying all directional tally (Ctotal = Cdirection,1 × Cdirection,2).
This is illustrated in Figure 4 with a worked example in figure 5 does still correspond to the correct figures.
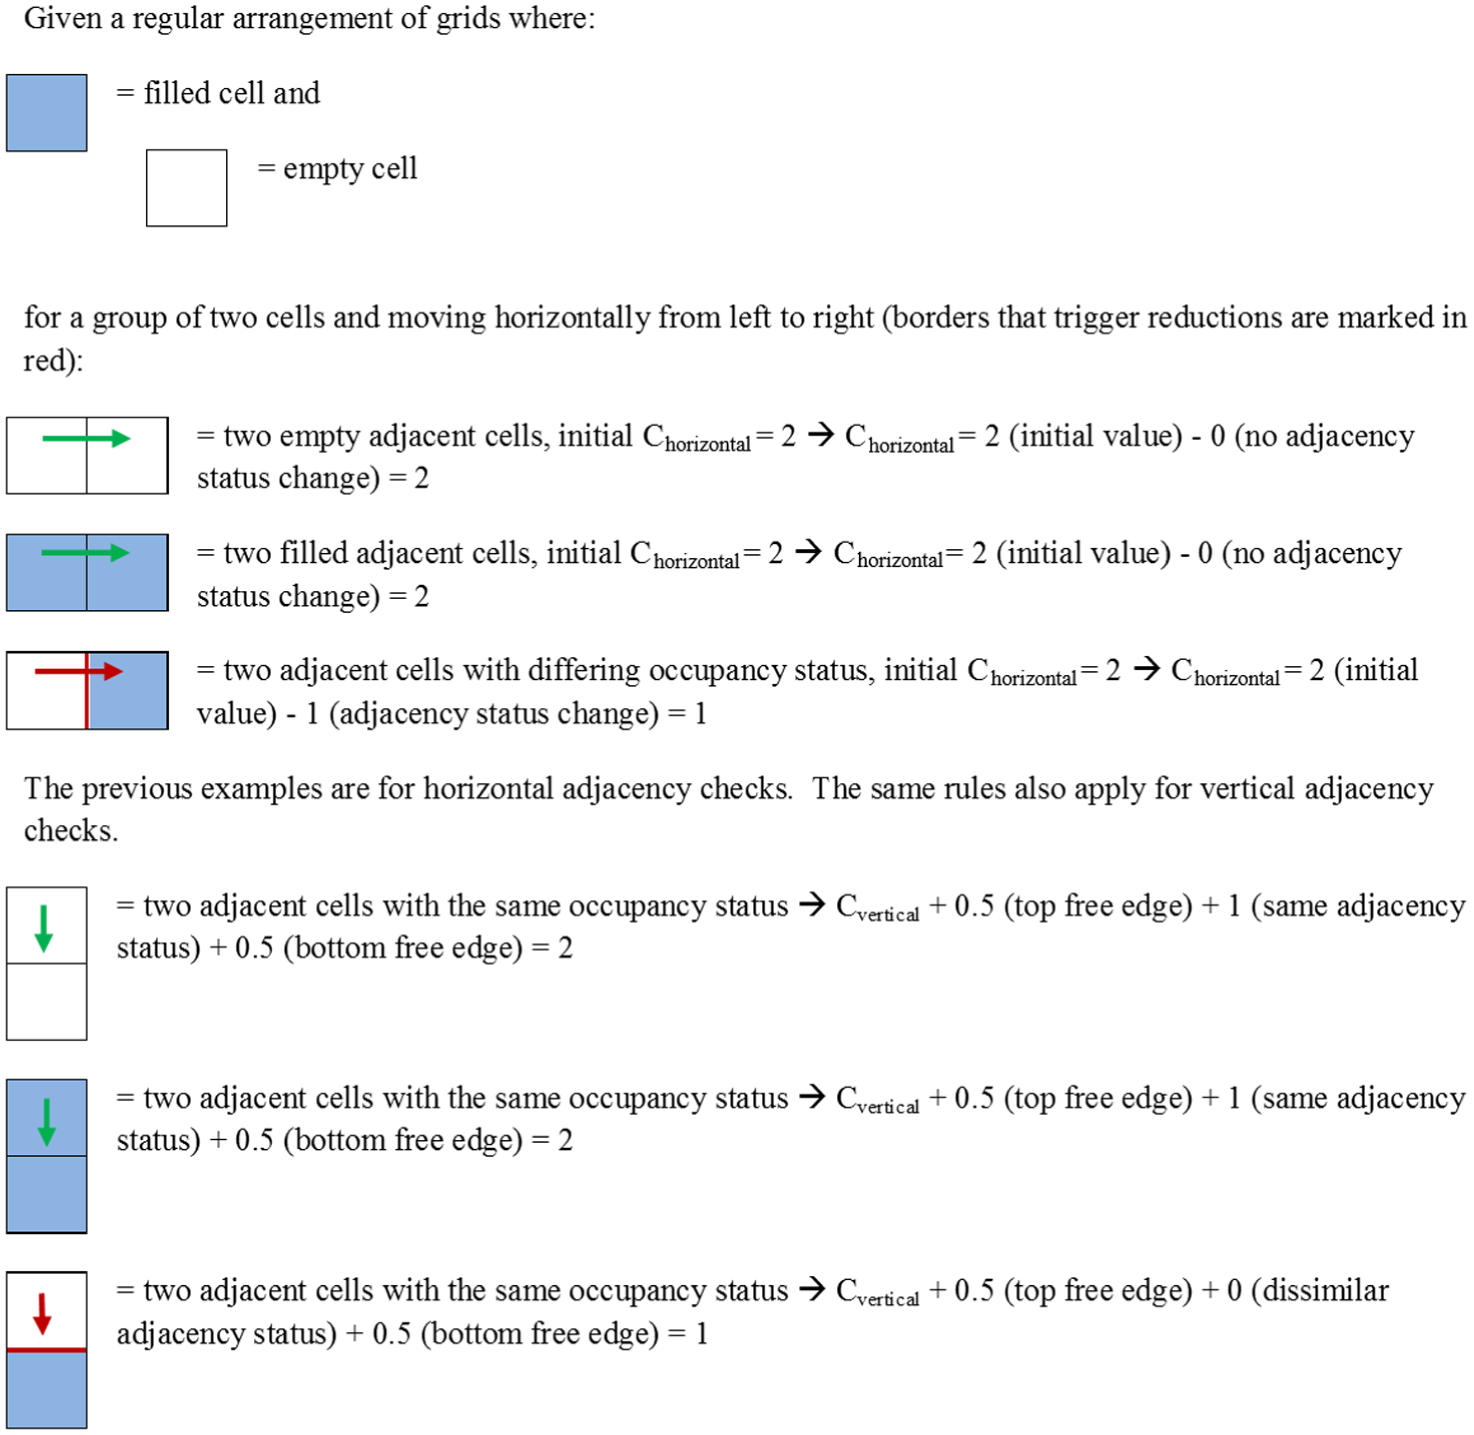
Illustrated guide to applying ply scoring methodology.
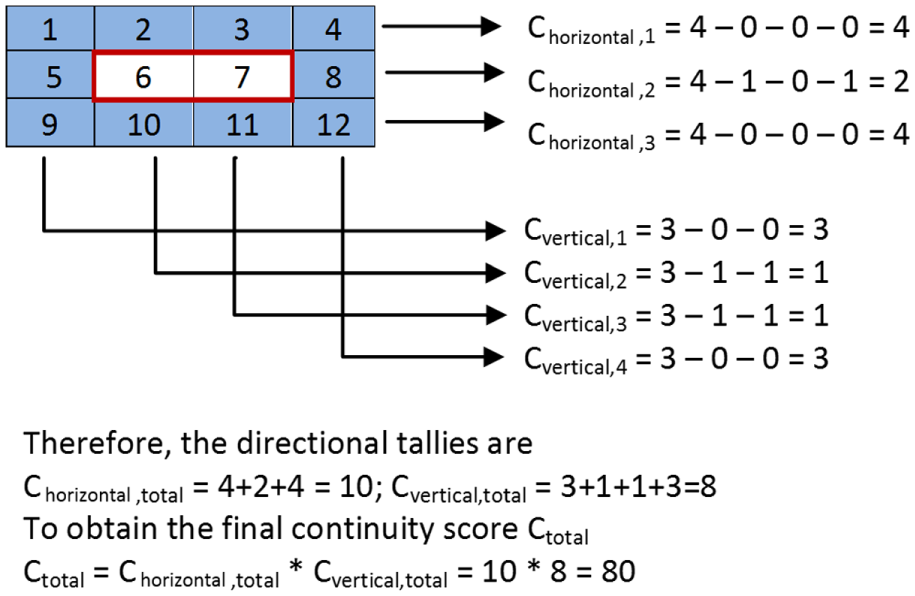
Example of 12-cell array being scored for ply continuity.
An approximation error exists because the method does not account for true 3D ply shapes, only a 2D approximation with no reference to the dimensions of the cells, which may not be square in the 3D design. There is also a likely error derived from not being able to predict the behaviour of the machine at each boundary interface. The method does not distinguish between a machine turning, cutting or moving at a boundary.
Figure 5 shows a 12-cell array scoring 80 from a potential 144, so the continuity score for this shape is 55%.
In this example, the indicator of machine deposition speed is a summation of the ply continuity score for each of the plies in the laminate, represented as a percentage. An actual time is not calculated, as this method is only appropriate to compare two designs to establish which option is likely to be faster to manufacture.
Validation through simulation
In order to test the method of scoring the continuity of plies as an indication of cycle time, four laminate panels were designed and scored using the ply continuity method. These laminates were then modelled in CATIA and their manufacture was simulated using software from MAG Cincinatti called ACES v2 to derive a predicted cycle time for AFP manufacture.
All four laminates have the same surface area and the same number of plies and ply orientations. Only the boundary of the laminate was changed each time to increase the complexity and fragmentation of the ply shapes. The first, simplest and last, most complex coupons are illustrated in Figure 6 showing the simulation being visualised.
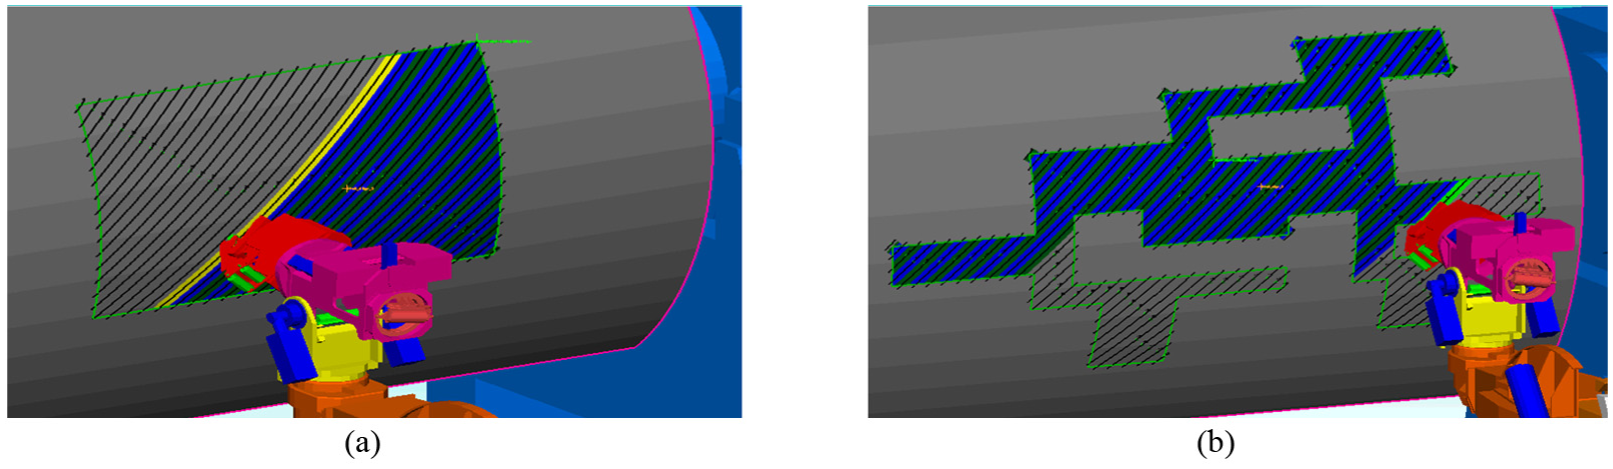
Screen shots from simulation for (a) coupon 1 and (b) coupon 4.
The coupons were digitally simulated to obtain estimated cycle times, and the results are shown in Figure 7. This shows that when the area of each coupon is kept constant, but the complexity is changed to increase the perimeter, the machine deposition time increases. ACES v2, configured with Coriolis machine parameters, was chosen to perform these simulations.
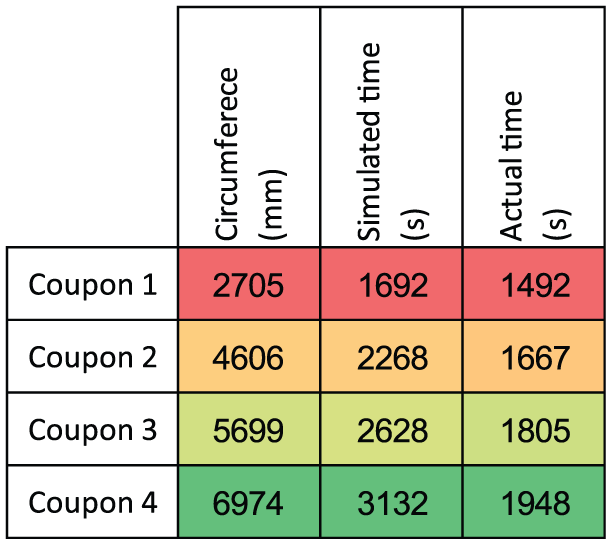
Graph showing the four coupons’ simulated cycle time versus ply boundary length.
The four coupons were manufactured using a Coriolis AFP machine to obtain accurate and realistic cycle times to validate both the simulation results and the ply continuity scores. An example of coupon 4 at each stage of the lifecycle is shown in Figure 8. Figure 9 shows the results for the four coupons.
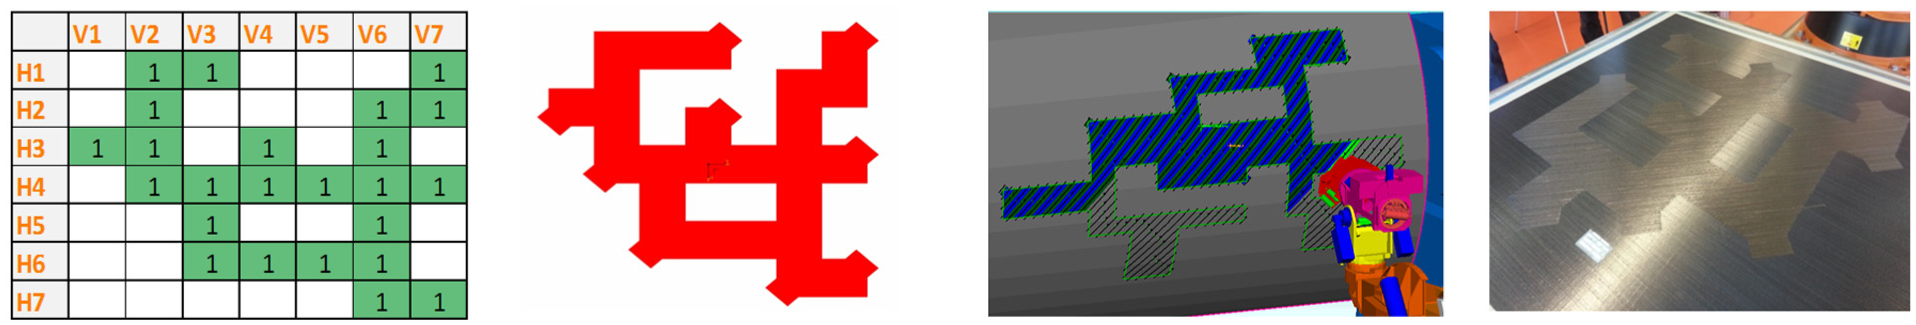
Stages of design lifecycle for coupon 4.
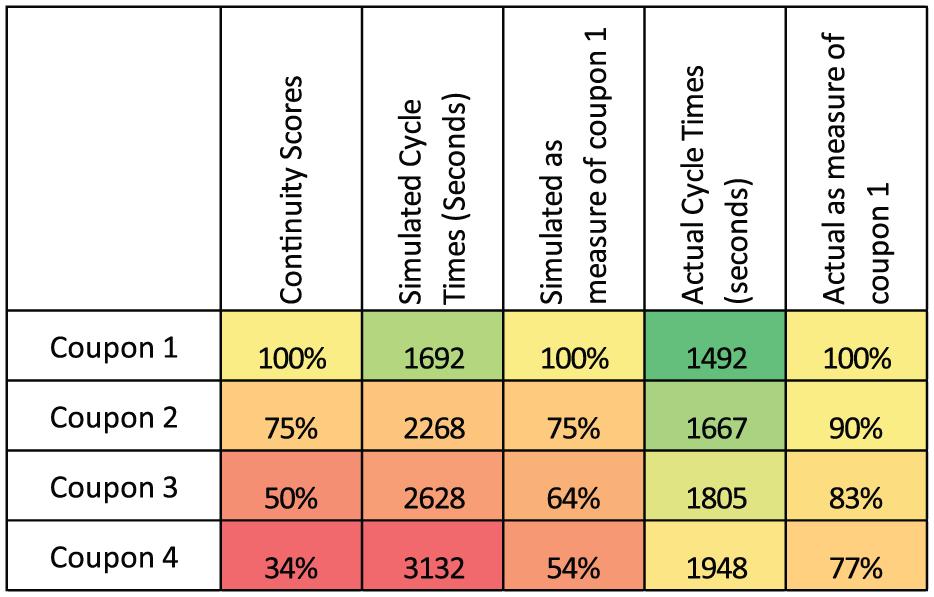
Results from scoring matrix, simulation and physical trials compared.
To be able to convert the increasing cycle times from the simulation and the physical trials into a percentage that is comparable to the continuity score, the results for the square coupon (coupon 1) have been taken as the optimum 100% solution. The times for other components are inverted (1/time) and then divided by the time for the first coupon to generate a percentage value.
The continuity scores and the simulated cycle times follow the same trend, but as complexity increases the basic continuity score and the higher fidelity process simulation both start to diverge from the actual cycle times.
Figure 10 shows the results displayed graphically, with coupon ply perimeter in millimeters displayed on the x-axis and the percentage score displayed on the y-axis. The common trend of increasing perimeter/area ratio to decreasing production cycle time can be seen.
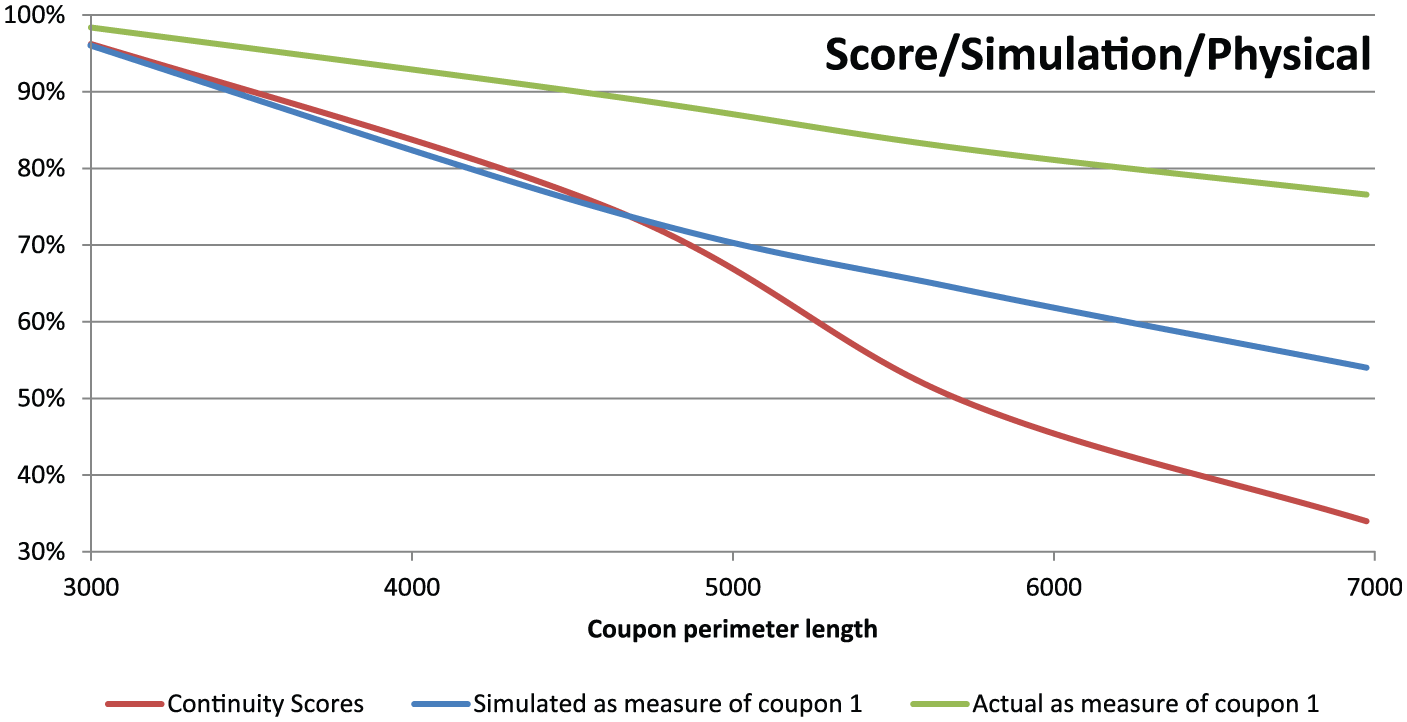
Graph showing score, simulation and trial results.
Discussion
The simulated data for the four coupons provided a smooth profile in the graph illustrated in Figure 10. The increase in coupon perimeter is not uniform for the CAD data, but the Excel table is not able to capture the magnitude of the increase because it does not account for exact geometrical measurements, only an approximation of shape and scale. While for both the simulation results and the continuity scores each coupon decreases in manufacturing speed, the exact amount of decrease is not well aligned. The coupons were also smaller than ideal for this kind of research because the flat tool available for the trials was limited to 1.2 m × 1.2 m in size, and the CAD models had to be scaled down to fit. While the Excel file is dimensionless and therefore unaffected by the scaling, the gaps between ply boundaries in the more complex coupons were very close together, restricting the opportunity for the AFP machine to accelerate to full speed during the simulation and physical trials.
As a recommended future work, the strategy for scoring ply shape continuity can easily be automated. For industrial use, the strategy is embedded in Excel using a C++ script. The strategy also has the potential to be used to score solutions as part of an optimisation program. Potential concept design solutions can be uniquely identified by listing their global ply orientation sequence as binary string, with each different solution being evaluated using a scoring criteria such as the continuity score. The use of a genetic algorithm could mix the ply orientation sequences of the highest scoring concepts to attempt to produce a concept with low calculated mass and low production times. The continuity scoring method does uncover a risk though, where any ply shape that only contains a single cell would score very high for continuity. In an optimisation routine, it is possible that the tool would converge on a laminate entirely made up from single-cell ply layers, which would not be fast to manufacture or structurally sensible due to the lack of material continuity. To counter-act this phenomenon, a second scoring method would be required to maintain the smallest quantity of ply layers possible, requiring a multi-objective approach to be adopted.
Another recommended future work includes incorporating the strategy, along with a minimum thickness rule into an optimisation tool, and also retrospectively scoring other composite structures that have already been manufactured to obtain more feedback on the suitability of the strategy.
Conclusion
The simulation, physical and estimated values all follow the same trend. The greater the complexity of the ply shapes, the more the results diverge as the simulation and ply continuity score fail to capture the full effects of complexity.
To perform a simulation of the deposition process, the designer is required to create a high-fidelity CAD model of the laminate, specifically defining the boundary of each ply and the orientation of the fibres. This process requires a skilled designer and takes time. For a large and complex structure like a carbon-fibre aircraft wing, the design process can take over 6 weeks. Because the scoring methodology is able to identify the correct trend in deposition time relative to ply shape complexity, the basic laminate design can be evaluated for production speed without the need for a higher fidelity design. This enables multiple basic laminate designs to be quickly evaluated for production potential before committing design resource to their development. Prior to this study, it was not known whether the variance in each alternative design could be modelled to estimate cycle time without the presence of a detailed design. The study proves that the variations in the laminate conceptual design can be evaluated during a conceptual design review, without the need of detailed design data.
The alignment of the simulation results to the physical trials enables a number of scaled simulations to be carried out to compare the scoring methodology for larger laminates and also more complex surfaces without further expensive validation through physical trials. This will enable the scoring methodology to be updated and improved in further work, and for it to be validated with only digital simulation and not costly physical manufacturing trials.
The definition of the ply shapes of the four coupons did not account for the minimum cut length required in the manufacturing process to produce 45° and 135° plies. A minimum cut length of 90 mm was required for the AFP machine configuration used in the physical trials, but this is only applied to external corners in specific directions. When each coupon is compared, the quantity of corners that needed to be extended for minimum cut length constraints did not uniformly increase as the complexity of each coupon increased. The additional surface area and associated deposition time to manufacture these minimum cut length features impacted the cycle times of the AFP production, and while this is accounted for in the simulation, the scoring methodology does not identify or account for minimum cut length complexity. The study suggests that while not all the complexities are represented in the continuity scoring method, it is still able to predict a trend when comparing multiple design solutions, and this can be used to aid concept selection.
Footnotes
Acknowledgements
This work could not have been achieved without Hugo Gaignebet, who during his internship at Airbus Group Innovations, built all the simulations referenced in this article and managed the physical trials as part of his internship project.
Declaration of conflicting interests
The author(s) declared no potential conflicts of interest with respect to the research, authorship and/or publication of this article.
Funding
The author(s) received no financial support for the research, authorship and/or publication of this article.