
Abstract
According to the increasing needs of three-dimensional printing technologies to satisfy high-level requirements, customization, and complicity, the quality of three-dimensional printed part becomes an important issue due to the layer-wise nature of additive manufacturing process. The objective of this study is to propose a methodology to identify the quality of three-dimensional printed parts with circular holes in the laser aided additive manufacturing process. We utilize a response surface methodology to represent the relationship between input variables (chord height tolerance and diameter of a hole) and response (geometric error) for evaluating the geometric accuracy of the three-dimensional printed parts with the diameter of holes. From the calculated response surface methodology, we conclude that the proposed methodology can be utilized as a process design guide to guarantee the quality of a part printed from the laser aided additive manufacturing process. The efficiency and limitations of the proposed methodology are verified by conducting a case study.
Keywords
Introduction
Total quality management enhances companies’ competitiveness by improving product quality that impacts product innovation significantly. 1 According to the increasing needs of three-dimensional (3D) printing technologies to satisfy high-level requirements, customization, and complicity, a laser aided additive manufacturing (LAAM) technology has widely adopted in various industries such as automotive, aerospace, and defense.2,3 In a part produced by the LAAM technology, quality is an important issue due to inevitable phenomenon from the layer-wise nature of an additive manufacturing process.4,5
In selective laser melting (SLM) process which is one of LAAM technologies, the laser scan could be classified into two different modes as their roles: fill and contour scans. The fill scan takes charge of filling the volume area. The contour scan makes the geometric shape of a part. The quality of the fill scan dominates the mechanical properties such as the density, hardness, and tensile strength.6–8 While the contour scan significantly affects the geometric/dimensional accuracy and the surface quality.9,10 Thus, although the shape of a part is changed, the optimized parameters of the fill scan are almost the same. However, for improving the geometric accuracy, the optimized parameters of the contour scan should be slightly changed due to the change of the heat accumulation condition, resulting from the contour shape of a part and the finite laser beam size. 11 It is impossible to change the process parameters during the process. It leads to the geometric error with the shape of a part even though the same process parameters are used. Therefore, the estimation of the geometric accuracy of a fabricated part on an optimized process condition should be studied with the shape of the part.
In order to identify parameters affecting the geometric accuracy during the whole LAAM process, we need to understand the general LAAM process. Kulkarni et al. 12 explained the layered manufacturing (LM) process as three process modules and two data transfers. The three process modules are modeling tasks, process planning tasks, and materials/process tasks. The two data transfers are the transfers of the stereolithography (STL) model data and the process parameters. In the first data transfer, STL model data are generated from a 3D modeling and transferred into the process planning tasks. In the generated STL model data, the surface has been represented by the planar triangles tessellated from the 3D modeling. In the representation of the curved surface, the tessellation introduces the approximation error known as chordal error. 13 The approximation error distorts the shape of a part. Therefore, the geometric accuracy of a feature with the curved surface is significantly dependent on the quality of the representation of the STL model. The quality of the STL model is controlled by the chord height tolerance in a commercialized 3D modeling software. The chord height tolerance is defined as the maximum distance from the actual surface to the facet face and acts as the transformation rules. 14 The small tolerance makes the denser STL facets but increases the file size that lead to the more computational load and pre-processing time. Navangul et al. 13 and Zha and Anand 15 have developed the modification algorithms of STL model to minimize the chord error with unnecessary increase in the file size. The algorithms have not been realized in the commercialized package until now. The uniform chord height tolerance has been widely used. It means that the geometric error caused by the chord height tolerance is inevitable. Although the geometric error from the tessellation of STL model has been studied for a long time in the computer-aided design (CAD)/computer-aided manufacturing (CAM) field, there is little research to show relationship between the chord height tolerance and the real geometric error in a fabricated part. In this study, we propose a methodology to represent the relationship for supporting a process design guide that guarantees the quality of 3D printed parts by LAAM process.
To predict the quality of a part in the wide range, the proposed methodology should include a numerical model to generalize the relationship between input and output variables. A few researchers have studied numerical models to identify the generalized relationship between input and output variables.16–18 Among the numerical models, a response surface methodology (RSM) is useful when the detailed theoretical knowledge of the model does not exist. 19 In this study, the relationship between the input variables and an output variable is hard to be expressed theoretically because each of input variables and an output variable represent the different properties. Hence, we use the RSM to represent the relationship between input variables and output variable. From the calculated RSM, we concluded that the RSM is suitable to numerically represent the relationship between chord height tolerance and geometric error, and enables a process designer to enhance the understanding of the relationship as a form of the design guide. The efficiency and limitations of the proposed methodology are verified through a case study.
The remainder of this study is organized as follows. Section “Experimental details” describes an experimental method to identify the relationship between the chord height tolerance and the measured geometric error for 3D printed parts. Section “Results and discussion” shows the results including a case study for verifying the proposed methodology. Conclusion and future work are presented in section “Conclusion and future work.”
Experimental details
Equipment and materials
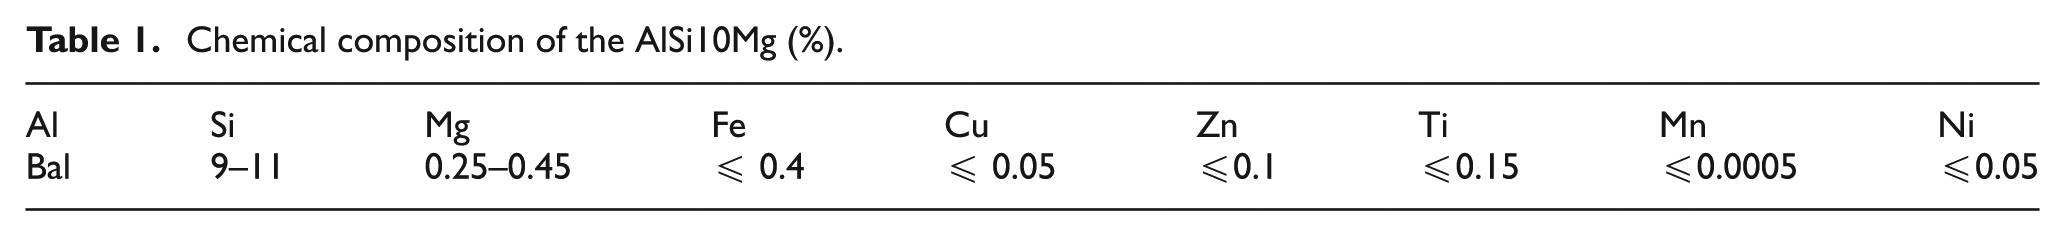
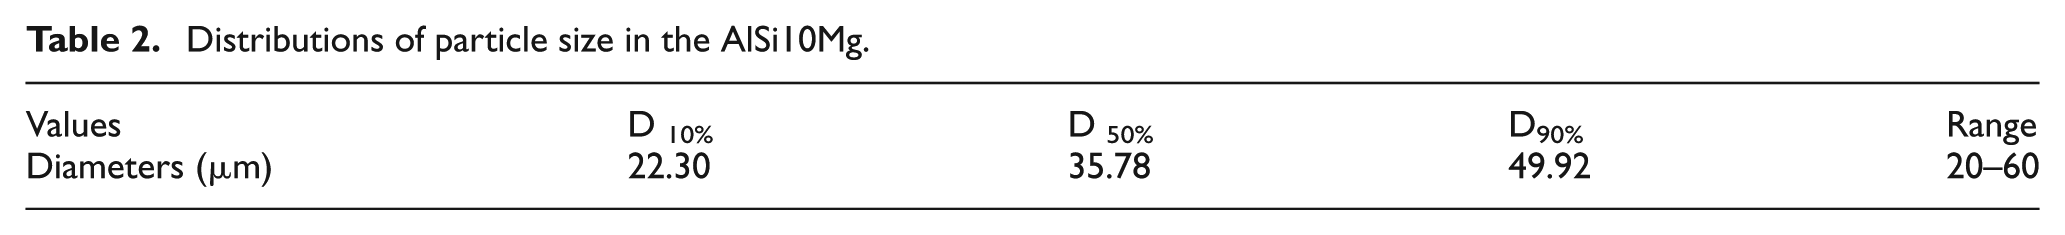
This study uses the SLM process as shown in Figure 1. For the fabrication of specimens, the machine developed by the SLM solution GmbH was used with the 400 W Ytterbium fiber laser which has the 80-µm spot size onto a built area and Gaussian beam profile. 20 The maximum scan speed is 20 m/s. The working chamber is filled with argon gas to prevent the oxidation during process. Material is AlSi10Mg that is a widely used for the aluminum casting. 21 The chemical composition and the distribution of the powder particle size are shown in Tables 1 and 2, respectively. A low-magnification digital microscope is used to measure the dimensions of specimens.
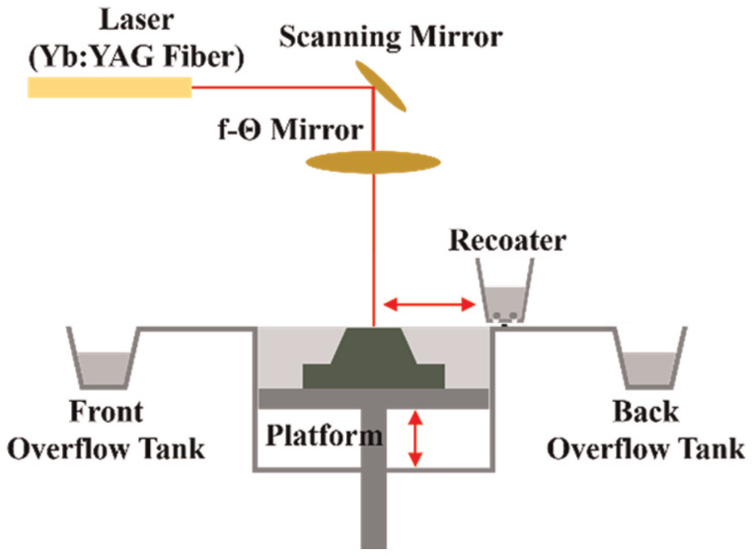
Schematic diagram of SLM process.
Chemical composition of the AlSi10Mg (%).
Distributions of particle size in the AlSi10Mg.
Fabrication of specimens
In order to identify the relationship between chord height tolerance and geometric error in a curved surface, specimens with curved shape should be fabricated. However, in the cases, it is hard to estimate the influence of the chord height tolerance on the geometric error due to the continuous change in the curvature of radius in the curve surface. Thus, specimens with diverse dimensional circular holes were fabricated. As shown in Figure 2, build orientation is fixed to remove the influence of the build orientation for the geometric error. As 3D modeling with a certain diameter is transformed into STL models with different chord height tolerances, the circular shape is represented by a polygonal shape. The number of the polygon sides is dependent on the chord height tolerance. Figure 3 shows the different polygonal shapes in the same diameter and the different chord height tolerances. As shown in Figure 3, it is hard to directly control the ideal geometric error caused by the chord height tolerance. Thus, in this study, the regular polygon is used to control the ideal geometric error. The relationship between the number of the regular polygon sides and the ideal geometric error can be expressed as follows
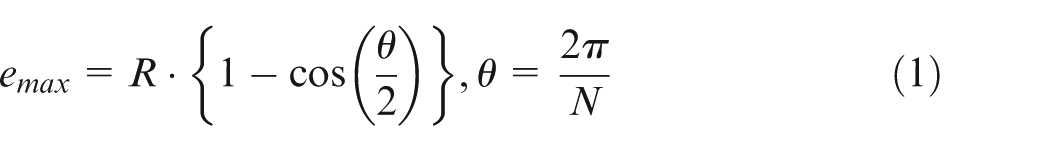
where emax is the ideal geometric error caused by the chord height tolerance, R is a hole radius,
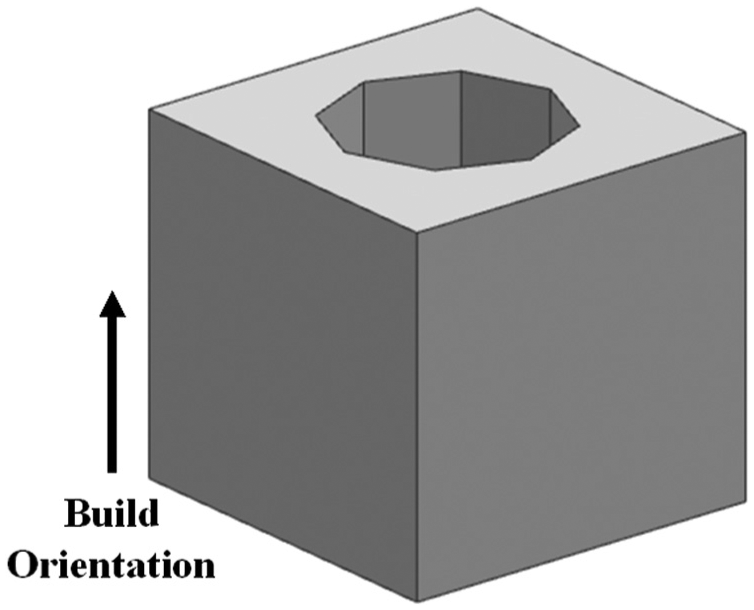
Geometry of a part with regular polygonal hole and the build orientation.
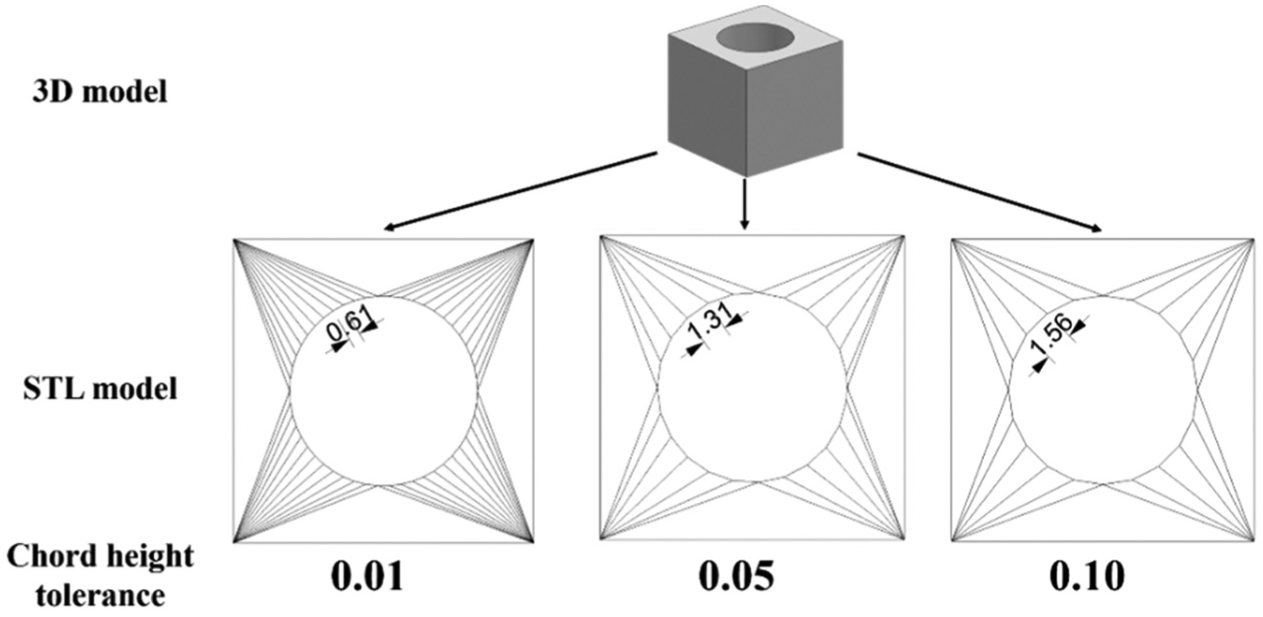
Geometric change in STL format as the different chord height tolerances.
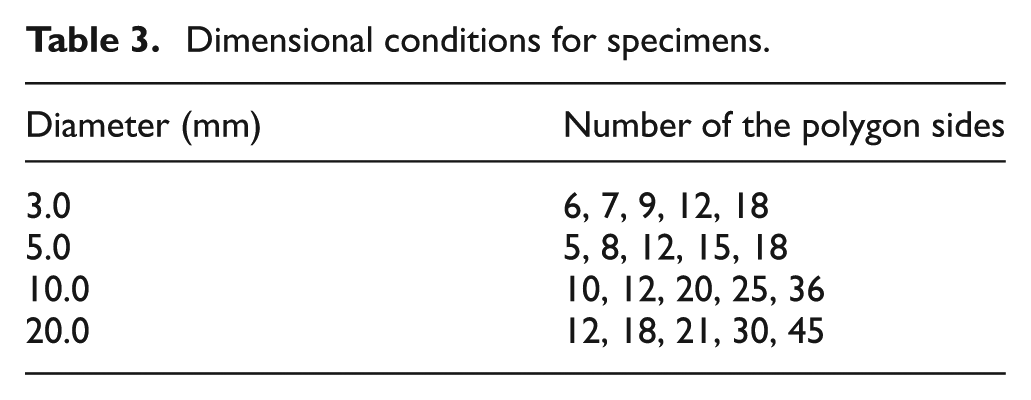
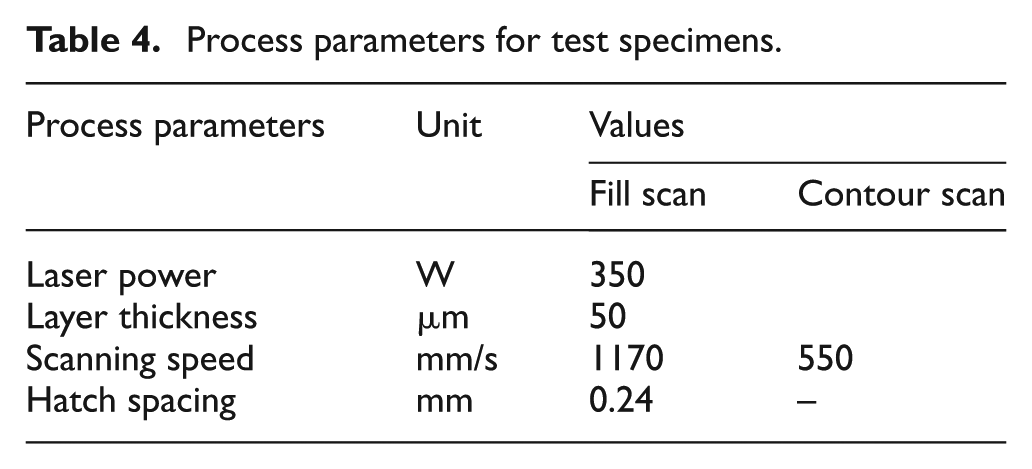
Table 3 shows the dimensional conditions of fabricated specimens. The range of the fabrication condition was determined after the pre-fabrication to narrow the range of the fabrication conditions. From the pre-fabrication, we found the range in which the geometric error disappeared. Considering the range, the numbers of polygon sides with the distinguishable geometric errors were set. The number of specimens in each diameter is set as 5 more than the number needed in the general design of experiments (DoE) to accurately capture the trend of the geometric error. In Table 4, process parameters appear for fabricated specimens. Process parameters were obtained from the density optimization studies.22,23
Dimensional conditions for specimens.
Process parameters for test specimens.
Definition of geometric error
Figure 4 shows the specimens with the different number of the polygon sides in the same diameter. In a part with the large number of the polygon sides in Figure 4(a), the shape of the regular polygon is close to a circle. In the opposite case as shown in Figure 4(b), the polygonal shape is clearly observed. It means that the improper chord height tolerance could cause geometric error during the SLM process. When the polygonal shape is observed, two different circles can be obtained as shown in Figure 4(b): circumscribed and inscribed circles. In the definition of the geometric error, these circles provide a meaningful cue. In the case of the circumscribed circle, the diameter of the circle means the smallest diameter of a fine surface hole obtained after the machining. The amount of removal to obtain the fine surface hole could be calculated from the difference between circumscribed and inscribed diameters. The amount of removal could be understood as the geometric error. Therefore, in this study, the geometric error is defined as the difference between circumscribed and inscribed diameters.
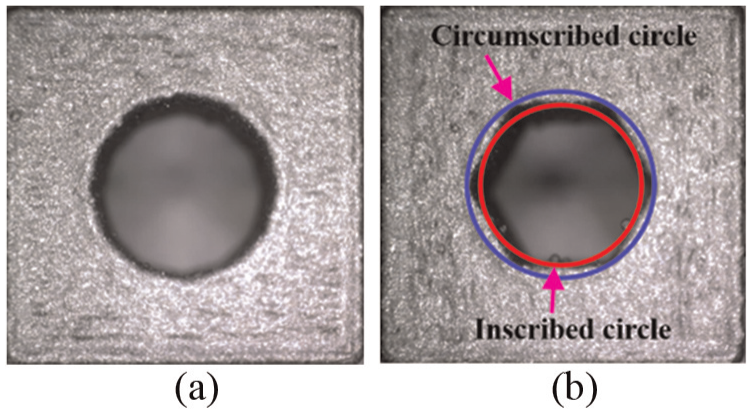
Different shapes of circular holes with the number of the polygon sides: (a) without geometric error and (b) with geometric error.
RSM
RSM has been widely used to build a numerical model for identifying the relationship between input variables and an output variable. 24 It is the reason that the RSM allows to understand the relationship between input variables and a response even though the theoretical model to represent the relationship does not exist. Two procedures are needed to build an accurate response surface. First step is to find an approximate function and the second step is to build the DoE. As an approximate function, a low-order polynomial is commonly used to reduce the effects of noise and use the derivative-based algorithms. In this study, the second-order polynomial was used, because it can give a better result than a first-order polynomial when the regression coefficients called as tuning parameters are estimated by minimizing the sum of the squares of the errors. 22 A general second-order polynomial form is as follows
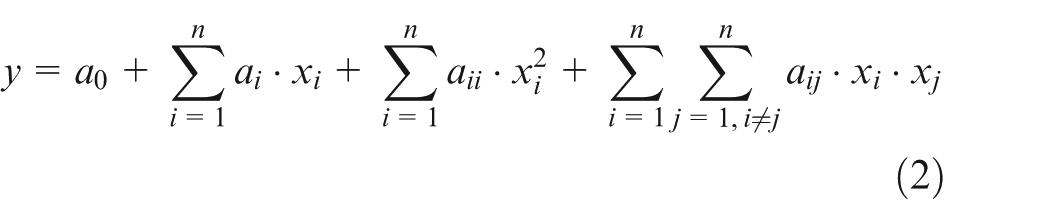
where y is the response;
In DoE for RSM, there are various design methods such as full-factorial design, central composite design, and D-optimal design.25,26 The determination of the DoE method is dependent on the number of the input variables. The full-factorial design is useful when the input variables are less than five. If the number of the input variables increases, other method should be considered to reduce the number of experiments. In our study, the full-factorial DoE is selected due to the small number of the input variables (less than five). However, it is impossible to design experiment conditions consistent with the experiment conditions of the general full-factorial DoE because the distinguishable geometric errors in each diameter appear in the different number of the polygon sides. Therefore, we design the experiment conditions close to the experimental conditions of the full-factorial DoE, in which conditions can include the conditions to guarantee the appearance of the different geometric errors as mentioned in section “Fabrication of specimens.” The tuning parameters were obtained using a least square method. In the calculation of the tuning parameters, the matrix form transformed from equation (2) was used.
Results and discussion
Measurement of the geometric error
The measurements were conducted using a low-magnification digital microscope and the results are shown in Figure 5. As shown in Figure 5, the geometric error nonlinearly decreases with the number of the polygon sides and increases with the diameters of holes at the same number of the polygon sides. Theoretically, the ideal geometric error caused by the chord height tolerance is close to zero when the number of the polygon sides close to be infinite, but the real measured geometric error quickly converges on zero in the finite number of the polygon sides. It is attributed to a bluntness effect which results from the heat accumulation in the corner between neighboring two sides of polygon as shown in Figure 6. It could be said that the relationship between the ideal and real geometric errors with the diameters is determined by the degree of the bluntness effect. Actually, the bluntness effect is significantly affected by the process factors such as the characteristics of a material and process parameters. 27 In this study, the bluntness effect was only affected by the geometric factor (diameter) and the process parameter (chord height tolerance) because the material, process parameter, and build orientation were predetermined. Thus, it could be understood that Figure 5 shows the change in the bluntness effect with respect to the diameter and the number of the polygon sides (means the ideal geometric error).
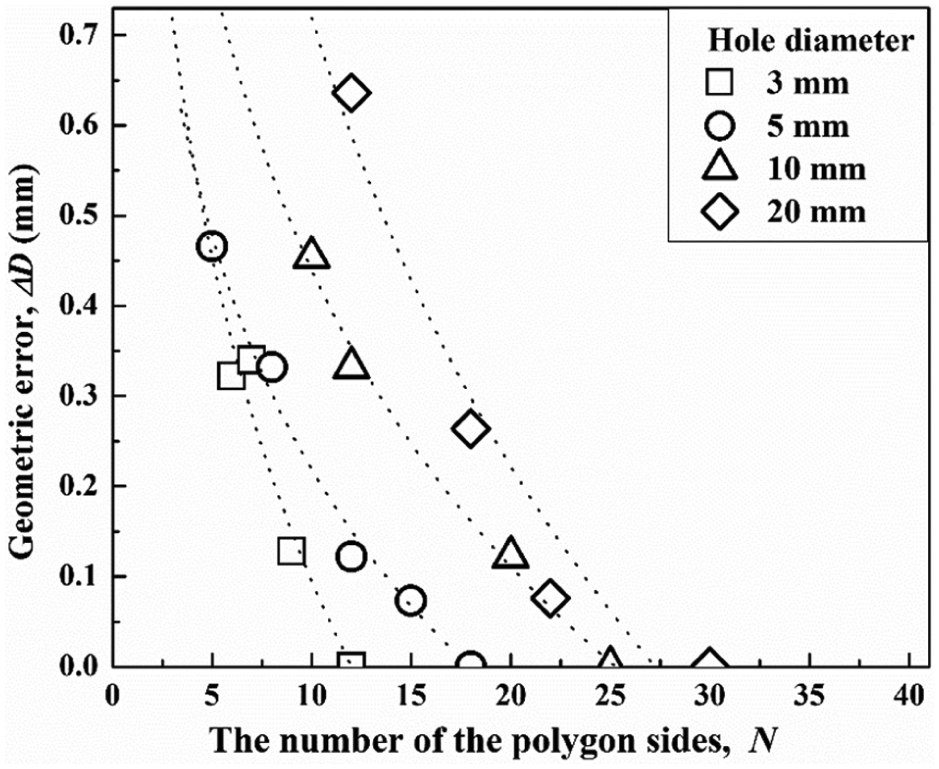
Measured geometric errors with the number of the polygon sides and the hole diameters.
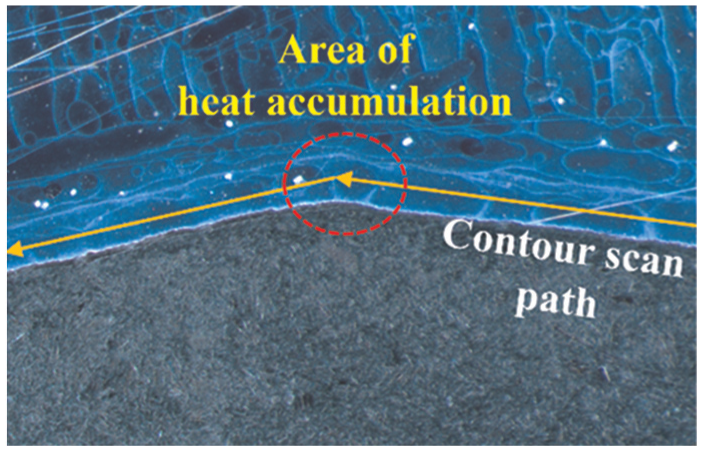
Bluntness effect in the corner between neighboring two sides of polygon.
Calculation of tuning parameters in RSM
As shown in the previous section, geometric errors were changed with the diameter and the number of the polygon sides. The trend of the geometric errors was determined by tuning parameters in equation (2). Thus, the accuracy of RSM is dependent on the accuracy of calculated tuning parameters. In this study, the chord height tolerance and the diameters of holes were used as the input variables, and the geometric error was used as the response. The chord height tolerance corresponding to each polygon shape was obtained from equation (1). The calculation of tuning parameters was conducted using equation (3) transformed from equation (2) as follows
where
Tuning parameters were obtained using a least square method. The calibration of the tuning parameters was conducted using the data in 3, 10, and 20 mm diameters. The verification of the tuning parameters was performed using the data in 5 mm diameter. The tuning parameters obtained from the calibration were a0 = −0.0335, a1 = 0.0002, a2 = 2.5501, a11 = −0.0007, a22 = −4.7189, and a12 = 0.0899. Figure 7 shows the comparison between the measured and simulated results for the geometric error in 5 mm diameter.
Comparison between the measured and simulated geometric errors at the 5-mm-diameter hole.
The comparison in Figure 7 shows that the calculated RSM accurately predicts the geometric error. Based on the calculated RSM, Figure 8 graphically shows the response surface of the geometric error with respect to the chord height tolerances and the hole diameters. In Figure 8, the geometric error increases with the chord height tolerance in the same diameter, but decreases with the diameters in the same chord height tolerance. From the response surface in Figure 8, the geometric errors for the diverse diameters and chord height tolerances within the calibration range could be predicted. However, if the geometric error happens in a certain condition, it means that the shape of a hole is not a perfect circle and need a machining of a level of semi-finishing.28,29 It can lead to increasing the cost of the fabrication of a part. Thus, in viewpoint of the cost, it is important to find the conditions without the machining process. The condition without the geometric error can be obtained when the
Response surface plot showing the effect of the chord height tolerance and the hole diameter.
In the range from 5 to 20 mm, the chord height tolerances without the geometric error were calculated by solving equation (4) as shown in Figure 9. The calculated chord height tolerances could be considered as a threshold tolerance for the presence of the geometric error. The threshold tolerances show two different trends. In the range of less than 5 mm diameter, the threshold tolerances are almost constant. It is the reason that the degree of the bluntness effect is considerable to the diameter of hole and the effect makes a corner between neighboring sides blunter. However, the bluntness effect decreases with the diameter in the region of more than 5 mm and the threshold tolerances linearly increase with the diameter. When a part with a hole or curved surface is designed, a process designer should consider the threshold tolerance for the quality of a fabricated part. For example, when a process designer want to fabricate a part with 8-mm-diameter hole, the threshold tolerance in 8 mm diameter is obtained by solving
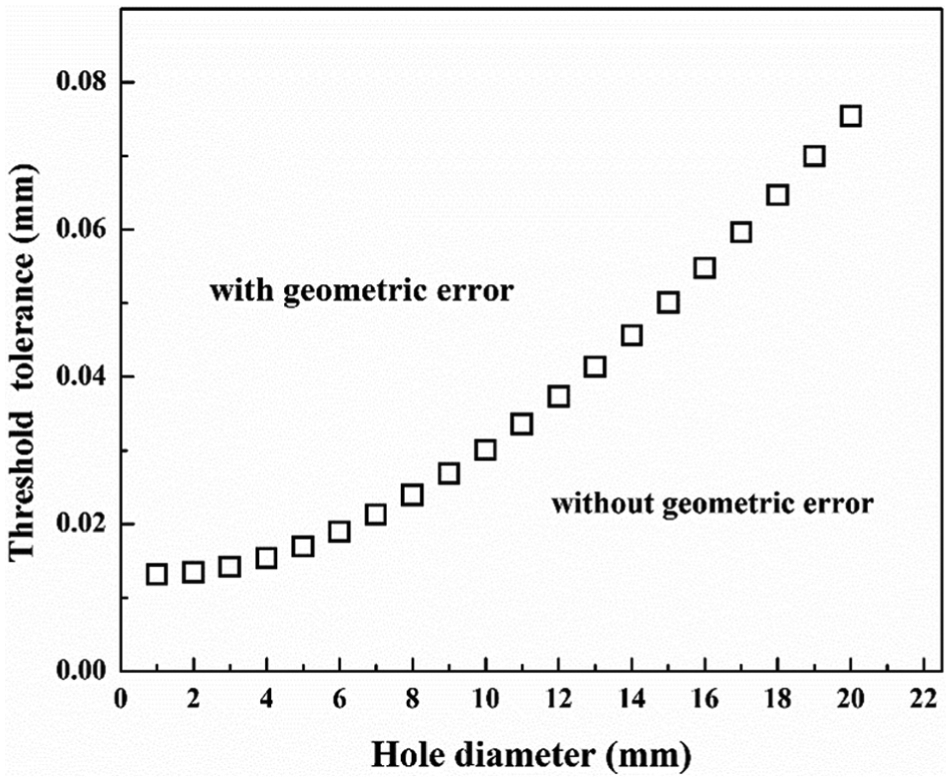
Threshold tolerance with the diameters for the geometric error.
Case study
In the previous section, we discussed the influence of the geometric error with the hole diameter and the chord height tolerance. In this section, we conduct a case study to demonstrate the verification and usefulness of the proposed methodology. The 3D modeling for the case study is shown in Figure 10. The maximum diameter of the fabricated is 34.00 mm and the minimum is 4.60 mm. The fabrication was conducted using the optimal process parameters shown in Table 4. The fabrication direction was determined by considering the overhang as shown in Figure 10(c). The 3D modeling was transformed into STL model using the five different chord height tolerances as 0.02, 0.05, 0.08, 0.10 and 0.12 mm. The fabrications to measure the geometric errors were conducted as shown in Figure 11, and the measured results are shown in Figure 12. Figure 12 shows the trends of the geometric errors when a part with multi-holes is built. As shown in Figure 12, the geometric errors are only observed in 10.97- and 34.00-mm-diameter holes. The geometric errors in 34.00 mm diameter start to increase in 0.05 mm chord height tolerance, and the increase in the geometric errors in 34.00 mm is significantly steeper than one in 10.97 mm. The tendency of the geometric errors originates from the variation of the number of the polygon sides. Figure 13 shows the variation of the number of the polygon sides with the chord height tolerance. The number of the polygon sides in each hole decreases with the chord height tolerance, but the number of the sides in the smaller holes less than 34.00 mm hole converges into about 20. It means that the ideal geometric errors for each of the hole are different though the same chord height tolerance is used, and the ideal geometric error in the largest diameter hole is most sensitive with the chord height tolerance. Thus, the chord height tolerance should be determined based on the largest hole diameter when a part with multi-holes is built. In Figure 12, the comparison between the measured and simulated geometric error was conducted in case of 10.97 mm diameter, because the ideal geometric error does not increase with the chord height tolerance in 4.60 mm diameter and the 34.00 mm diameter is out of the calibration range. The comparison shows that the response surface model is useful to predict the geometric error within the calibration range. However, it should be noted that the range of the experiments for the response surface model should be well designed considering the size of a part.
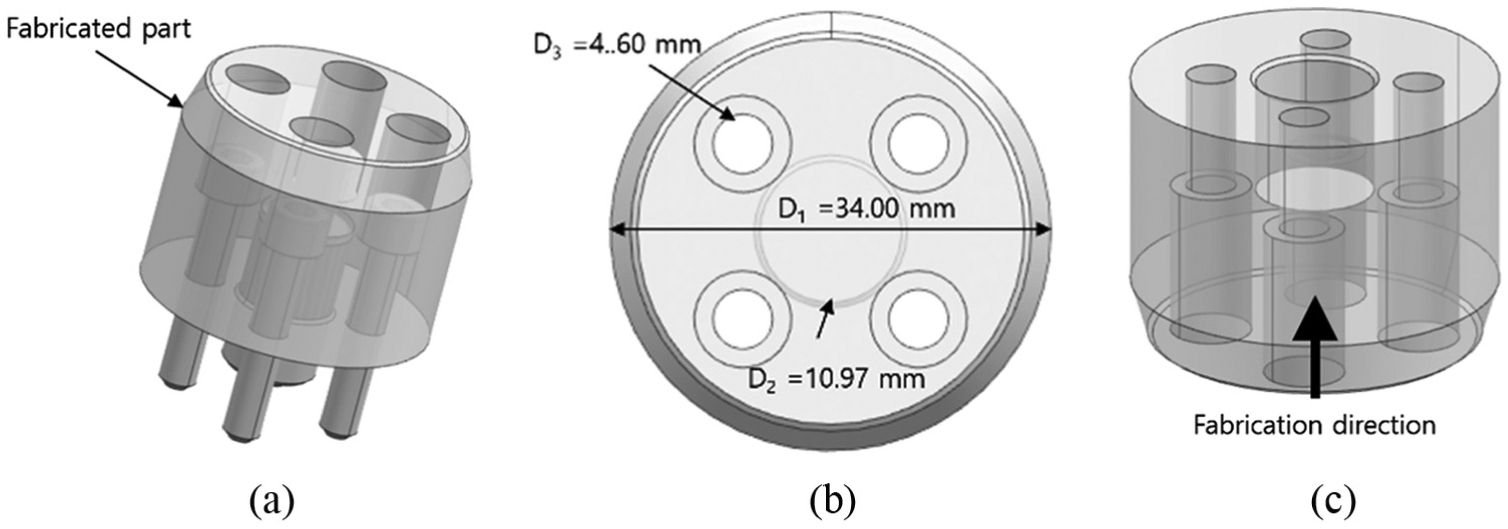
A 3D model for the case study: (a) full 3D model, (b) dimensions of holes, and (c) fabrication direction.
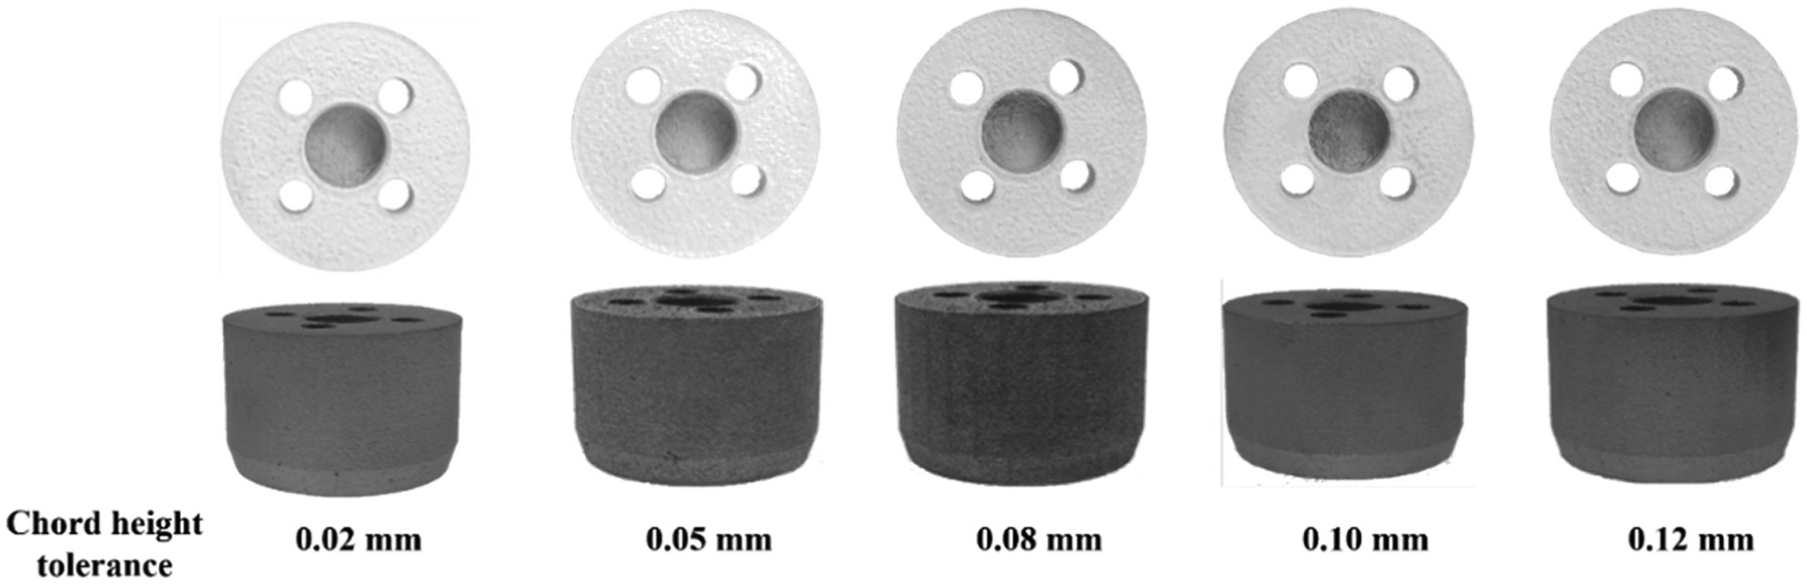
Fabricated parts with the different chord height tolerances.
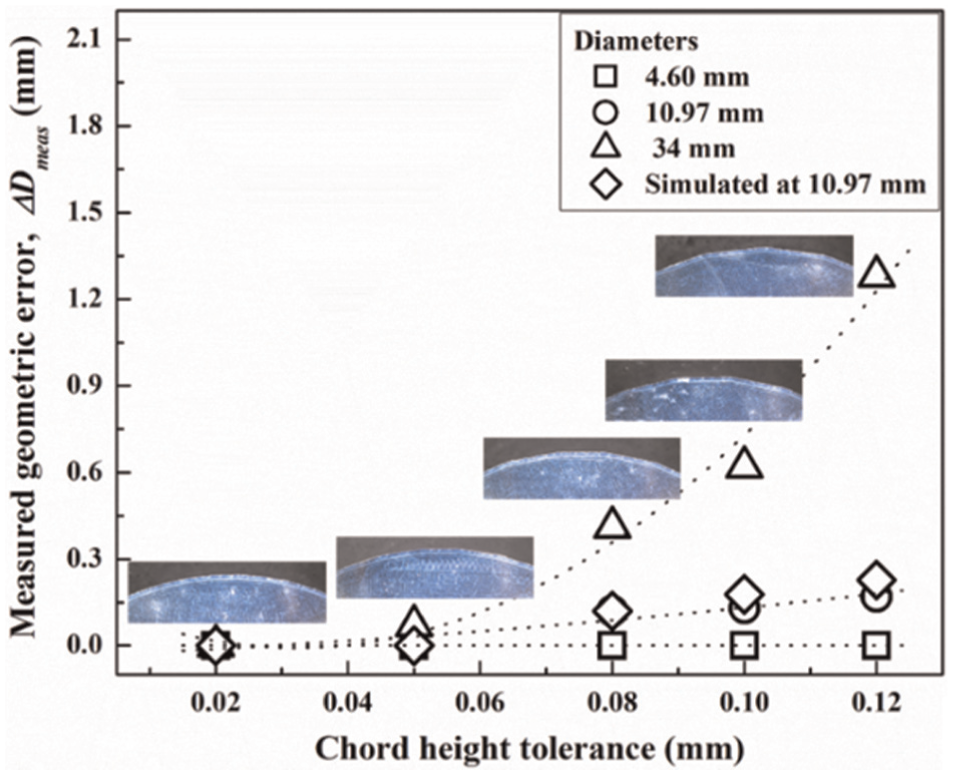
Geometric errors with the chord height tolerance in the case study.
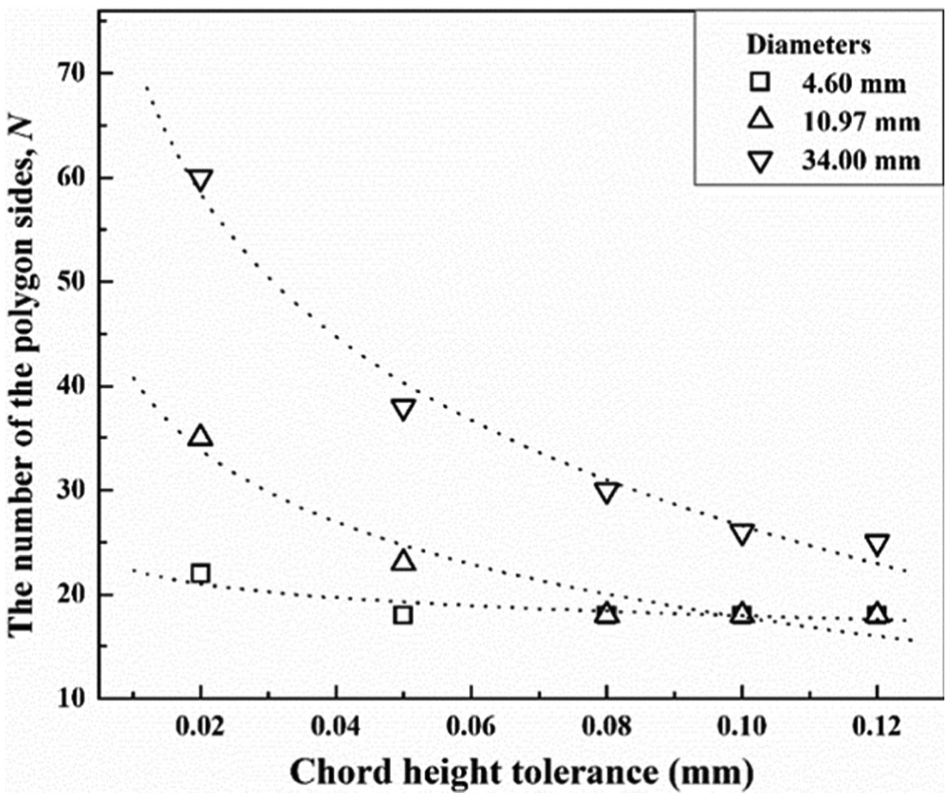
Variation of the number of the polygon sides with the chord height tolerance for the transformation of 3D model with multi-holes.
Discussions
As mentioned in the sections above, the proposed methodology is based on the experimental observation and utilizes an RSM calculated using the experimental data. Due to the characteristics of an RSM utilized in the proposed methodology, two issues appear. One is the number of experiments. As mentioned in section “Fabrication of specimens,” although DoE is established after the pre-fabrication, the number of experiment data would not be enough to capture the trend of response with input variables, because the proposed methodology is based on the experiment data. Hence, in the build of DoE for the proposed methodology, the most important thing is to find the narrow experimental range. It means that the number of experiments is dependent on the amount of experience of a user or a process designer. Although a designer has no enough experience, this issue can be solved by the low-height fabrication as about 10 layers and the measurement on the substrate without time-consuming. 30 Another is the range of the diameters of holes to calibrate an RSM. When the fabrication of a part with a diameter beyond the calibrated range is planned, the calibrated RSM would be unavailable because the largest diameter in a part with multi-holes is most sensitive with the chord height tolerance. In the case, the RSM should be updated by additional experiments. As mentioned above the paragraphs, although the proposed methodology has a few disadvantages, it should be noted that the methodology can provide a design guide to guarantee the quality of a part before the fabrication.
Conclusion and future work
In this article, we proposed a methodology to identify the design quality of 3D printed parts with circular hole design based on an RSM. To evaluate the geometric accuracy of the 3D printed parts, we investigated the relationship between the chord height tolerance and the geometric error in the laser aided additive manufactured part with the diameter of hole. The relationship was affected by the bluntness effect in a corner between two neighboring scans. An RSM is calculated using the measured geometric errors. The calculated RSM was verified by comparing the measured and simulated geometric errors. The threshold tolerance was obtained from the calculated RSM. From the calculated RSM and the threshold tolerance, we concluded that the RSM was suitable to reveal the relationship between the geometric error and the chord height tolerance with a small number of experiments, and threshold tolerance can provide a process design guide to guarantee the quality of a fabricated part. A case study was conducted to demonstrate the usefulness of the proposed methodology.
The proposed methodology can predict the quality of a 3D printed part before fabrication and provide a process design guide to guarantee the quality using SLM process. To improve the accuracy of the proposed methodology, it needs to deepen the understanding of the bluntness effect with various materials. The understanding of the bluntness effect is significantly helped to make process planning in the fabrication of a part with a sharp edge during SLM process. It is the reason that the minimum edge radius in a sharp edge is determined by the bluntness effect. In future work, we will study the bluntness effect to estimate the geometric accuracy in a sharp edge. In addition to the bluntness effect, we will investigate more input variables such as laser power, scan speed, and build orientation to enhance the usefulness of the proposed methodology.
Footnotes
Declaration of conflicting interests
The author(s) declared no potential conflicts of interest with respect to the research, authorship, and/or publication of this article.
Funding
The author(s) disclosed receipt of the following financial support for the research, authorship, and/or publication of this article: This research was supported by SERC, A*STAR Industrial Additive Manufacturing Programme, and an AcRF Tier 1 grant (RG94/13) from the Ministry of Education, Singapore.