
Abstract
Fluid jet polishing is an emerging process which possesses the advantages of localized force and less heat generation, as well as the stable and controllable material removal function without tool wear. Due to the complex machining mechanism, it is still difficult to model the material removal rate and predict the surface generation for fluid jet polishing. In this article, theoretical and experimental investigation of three-dimensional-structured surface generation by fluid jet polishing has been carried out. A surface topography simulation model is established for predicting the three-dimensional-structured surface generation by fluid jet polishing. A series of polishing experiments have been conducted to optimize the process parameters of fluid jet polishing and the fabrication of three-dimensional-structured surfaces. In terms of the pattern of three-dimensional-structured surfaces generated, the simulation results are found to agree with the experimental results.
Keywords
Introduction
Three-dimensional (3D)-structured surfaces have been applied widely and differently such as self-adhesive sensors, compound lenses for holography in phonics products, bionic applications and bio-medical areas. Although there have been some research studies on the manufacture and machining of 3D-structured surfaces, the research work is still far from complete. The current fabricating process, for instance, laser and etching, for 3D-structured surface generation is expensive and time-consuming. The study of mechanical polishing (MP) in 3D-structured surface generation was conducted and reported as a technical feasible way to create structures.1,2
With a rapid growth of the need of aspheric optical components for different applications and their stringent quality requirements, fluid jet polishing (FJP) was developed by a group of researchers at Delft University of Technology in 1998. 3 It is a two-body process which is similar to the abrasive slurry jet (ASJ) system, but at a relatively low pressure.
FJP is a promising ultra-precision machining technology. Premixed slurry is ejected out from a nozzle to the workpiece at appropriate speed. 4 As direct contacts do not exist in the process and the slurry remains circulating, FJP has low tool wear rate. The circulating slurry also assists in minimizing the problem of thermal effect and removing the debris from the workpiece. Different sizes of the nozzle are available. Comparing with traditional polishing tools, the diameter of the slurry beams is relatively small. This allows the FJP to machine samples with small and complex curvature.
The removal function of FJP is a Gaussian profile which is stable and controllable. The shape of the function is sensitive to the polishing position. 5 In recent years, The application of FJP has no longer been restricted to remove tool marks for the achievement of super-finished surfaces, but also been used for controlling the form accuracy of such surfaces. 6 FJP shows a great potential with regard to the application value in the generation of 3D-structured artefacts and patterns on surfaces.
As FJP is still evolving to the industry, the research on FJP is very limited. Although some researchers have made effort to model FJP, their models are not practical and mainly focus on glasses in the optic grade, but not metals. There is a lack of research on the FJP process on metals. Up to present, there is still a lack of deterministic models that have been developed with consideration of all these operational parameters so as to predict the material removal rate (MRR) accurately. In this article, a surface topography simulation model was successfully built for the modelling of the polishing strategy and the prediction of the surface generation in FJP.
In 2006, Fang et al. 7 conducted research on a mathematical model of FJP with the aid of steady flow equations, that is, the Bernoulli equations. Still, they used Preston’s equation as the basis of their model. In the same year, they presented a dwell function algorithm in FJP and described the process with the same equation. 8
Another group of researchers, 9 however, thought that Preston’s 10 equation failed to explain the removal function accurately. They proposed a model with the use of wave energy. In their case, Zeng’s 11 model and Gaussian function were applied. Li et al. 6 explained the material removal with a turbulent flow system too. They did not build any removal models, but modelled the stress distribution on the surface of the workpiece during the process. Up to present, there is still a lack of deterministic models developed with consideration of all these operational parameters to predict the MRR accurately.
Finnie 12 proposed models to predict the amount of MRR with the considerations of fluid flow conditions of the amount, direction and velocity of the abrasives attacking the target surface. For ductile materials, Finnie first developed models for a single abrasive grain. Bitter 13 built his model with the consideration of repeated plastic deformation and the cutting wear. His cutting models were constructed on the basis of Finnie’s model. The total material loss is the sum of the loss caused by repeated deformation and cutting wear. The predicted values of Bitter’s model had good agreement with the experimental data. Since then, numerous single-particle models have been developed based on Finnie’s and Bitter’s models. However, most of them were either purely theoretical or empirical. This can be an obstacle for engineers. 14
Booij et al. 15 discussed the theoretical dependence of several important parameters (i.e. slurry concentration and impact velocity) of FJP on the MRR and built models with the aid of finite element analysis and Finnie’s models of MRR of one particle. Beaucamp et al. 16 have developed a computational fluid dynamic model by phase field methods to simulate the interface between fluid and air. Gnanavelu et al. 14 built a material-specific wear map by computational fluid dynamic simulations and experiments. Matsumura et al. 17 proved the feasibility of using FJP to machine micro grooves and polish micro channels with computational fluid dynamic analysis. Almost all these models are helpful to understand FJP from a micro point of view. They, however, mainly consider the prediction of MRR only and are not able to simulate 3D-structured surface generation.
The generation of 3D-structured surfaces and patterns using FJP should get more attention from different areas. As a result, this article not only aims to determine the technical feasibility of generation of 3D-structured surface by FJP but also attempts to modelling the mechanism of FJP. Here, the empirical modelling approach is used to simulate the 3D-structured surface generation by FJP. To simulate the generation of 3D-structured surface, the shape of tool influence function (TIF) is a key issue. Current models suggested by other researchers are only able to estimate the MRR. The empirical method is more pragmatic.
In Part A, the process factors of FJP are investigated and optimized using Taguchi’s approach. The spacing limit of FJP is studied in Part B. In Part C, the FJP surface topography simulation model is verified by simulations and polishing experiments. It is found that the simulation results by the model agree reasonably well with the experimental results in terms of form error and the feature parameters of the 3D-structured surfaces.
Polishing mechanism of FJP
The configuration of FJP is shown in Figure 1. Figure 1(a) shows the motion axes of the polishing machine. There are three linear axes (X, Y and Z) and three rotational axes (A, B and C). The slurry nozzle is mounted on the B axis, and the fluid jet is released from the slurry nozzle. The workpiece is mounted on the C axis. The polishing mechanism by FJP is further illustrated in Figure 1(b), including some polishing parameters such as tool offset and inclination angle. The tool offset affects the expansion of the fluid jet when released from the slurry nozzle, and hence results in shear force or MRR. Inclination angle affects the shape of influence function or structured surface patterns. The control of these polishing parameters provides an important means to generate different structured surface patterns.
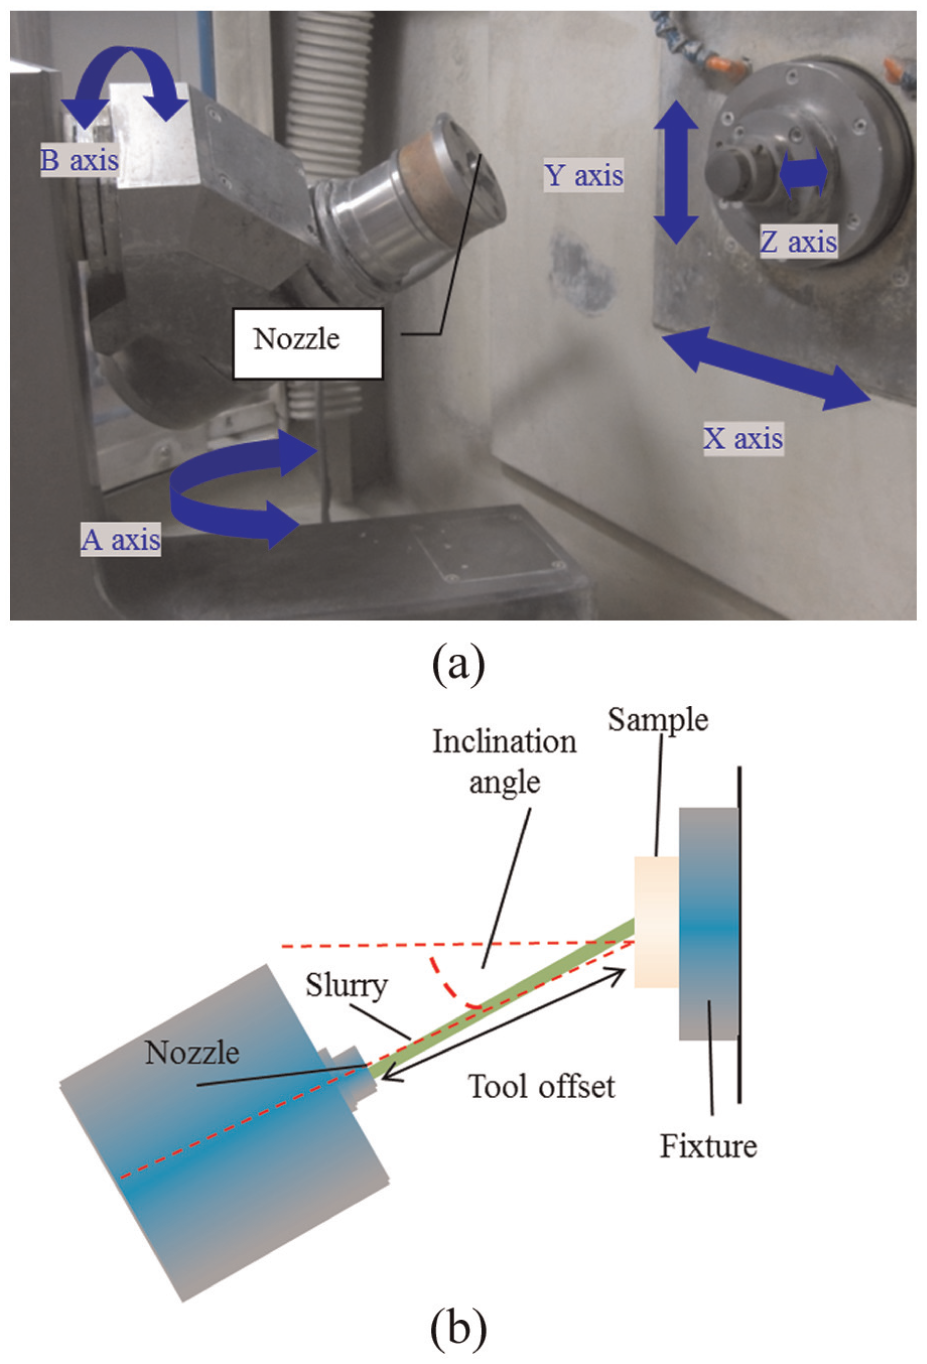
Configuration of fluid jet polishing: (a) multi-axis ultra-precision polishing for fluid jet polishing and (b) parameters of fluid jet polishing.
In FJP, the mechanism of material removal is a complex process, which is still not well understood. Generally, the workpiece material is removed or deformed by shear stress and pressure caused by the fluid jet. One popular theory, multiphase fluid theory, can be used to explain the material removal mechanism during the FJP process. 16 Polishing fluid, polishing particles and workpiece are involved in the polishing process. As shown in Figure 2, the polishing particles in the fluid play the role of (a) penetrating, (b) cracking, (c) cutting or (d) ploughing, and hence reinforce the material removal by the fluid jet. This is very similar to the natural phenomenon of a tsunami, with its serious demolishing effect when it contains stones.
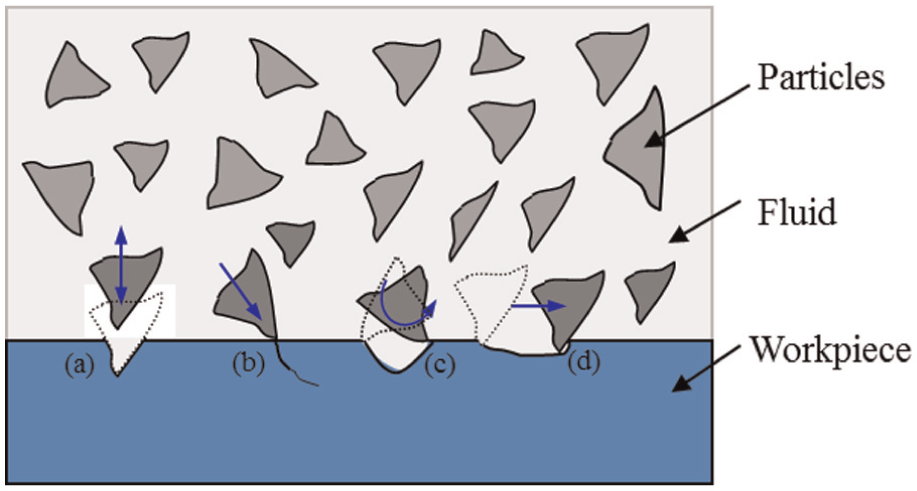
Material removal mechanisms in the FJP process.
In the FJP system, the material removal mechanisms are influenced by several operation parameters such as the slurry concentration, the particle size, the particle type, the slurry pressure, the machining time, the inclination angle, the tool offset and the kind of workpiece material. This is due to the cutting, collision and shearing actions between the abrasive particles and the surface of metal workpieces. 4
Modelling and simulation of 3D-structured surface generation by FJP
Computer-controlled ultra-precision polishing (CCUP) is a precision surface finish processing which is capable of fabricating surfaces with sub-micrometre form accuracy and surface finish in nanometre range. Its removal behaviour is characterized by an influence function.18,19 FJP is a type of CCUP.
The surface generation by CCUP is characterized by the polishing TIF instead of the pure geometry of a cutting tool. This is different from cutting processes. As shown in Figure 3, the TIF carries the information of a number of factors such as polishing methods, machining parameters, material property of the workpiece, geometry of the workpiece and polishing slurry. It is important to develop the TIF for various workpiece materials, tool materials and geometry of the workpiece in CCUP to simulate and predict the surface generation from a macro view.
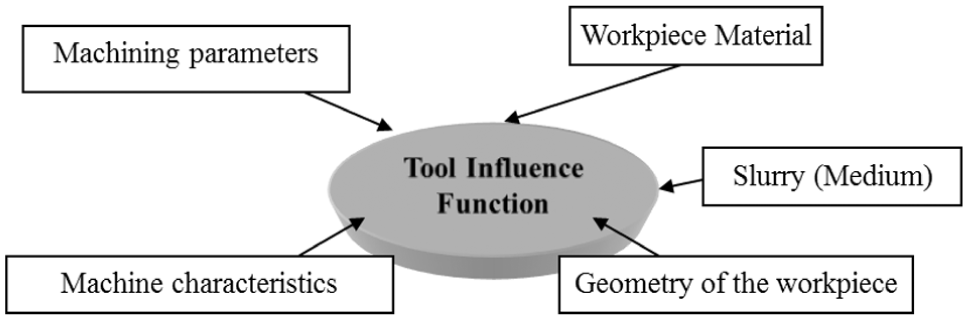
Factors affecting the tool influence function (TIF).
To determine the TIF, a spot is polished and created on a surface. The information it carried is then extracted by the measuring system to identify the properties of the polished spot under a set of pre-determined parameters for prediction, calibration and form correction. With the data of the TIF, the polishing tool can be commanded where it should stay longer or shorter for removing more or less materials from the surface, respectively.
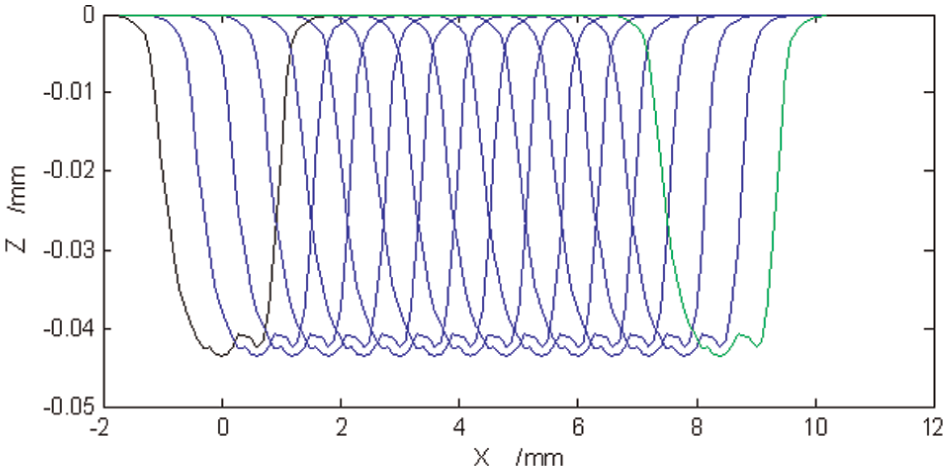
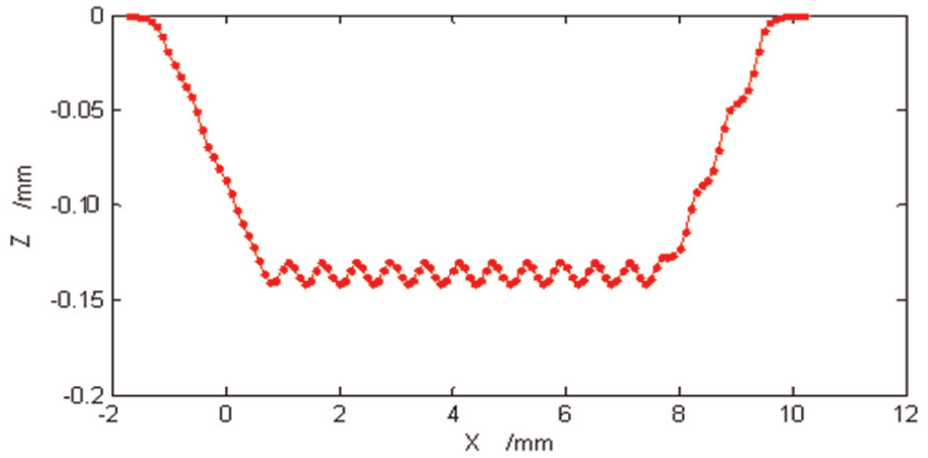
Figure 4 shows the flowchart of modelling and simulation of 3D-structured surface generation by FJP. In the first step, the TIF for FJP is tested and a point cloud of the TIF is obtained and projected. The profile of the point cloud is then extracted (Figure 5). With the profile, the surface is then simulated by giving a polishing distance of the tool path (Figures 6–8). The surface is then simulated based on experimental results and the planned polishing tool path. Unlike the TIF of MP, the shape of TIF of FJP is directional if there is an inclination angle. The shape of TIF in the X–Y plane is different from the Y–Z plane. During the simulation, the profile of the point cloud of the chosen plane is used. Hence, the polishing path planning is determined based on the surface requirements to be generated.
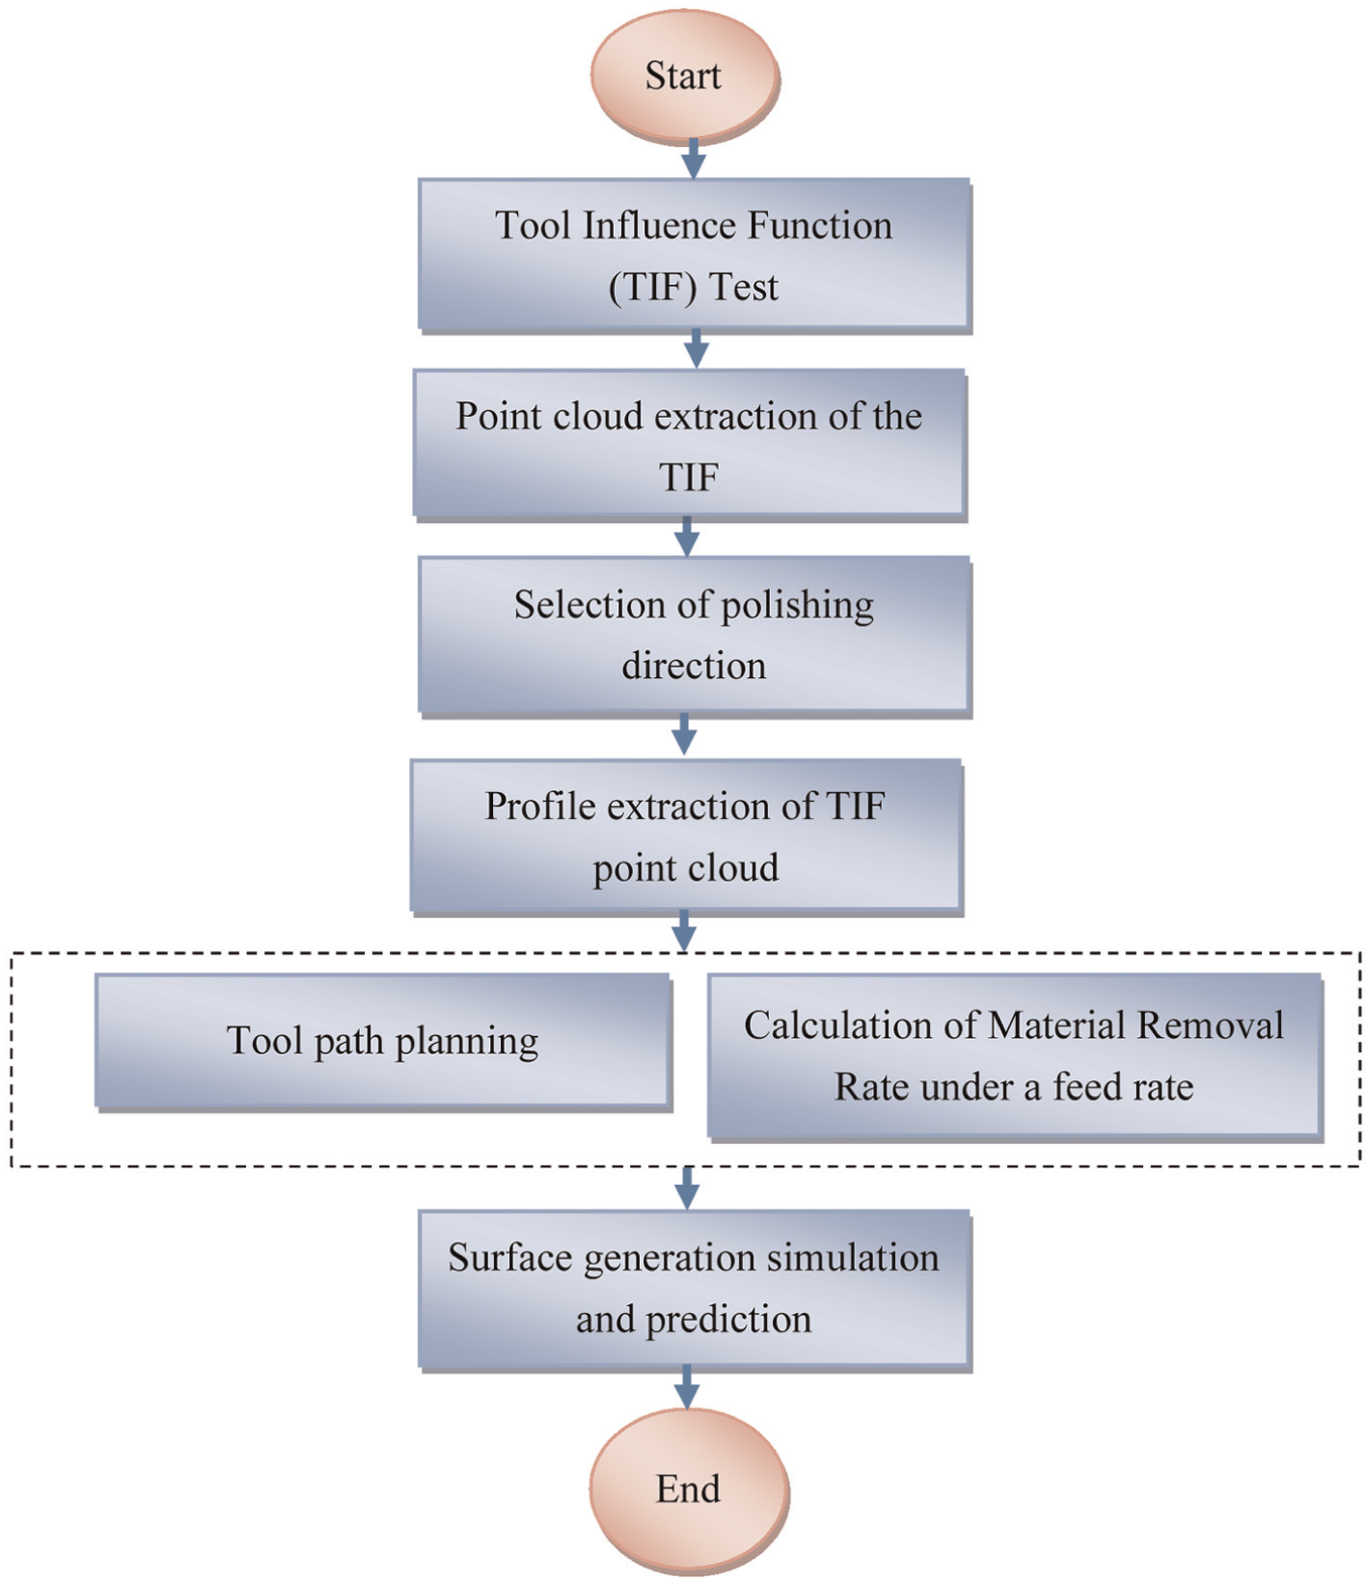
Flowchart for the modelling and simulation of 3D-structured surface generation by FJP.
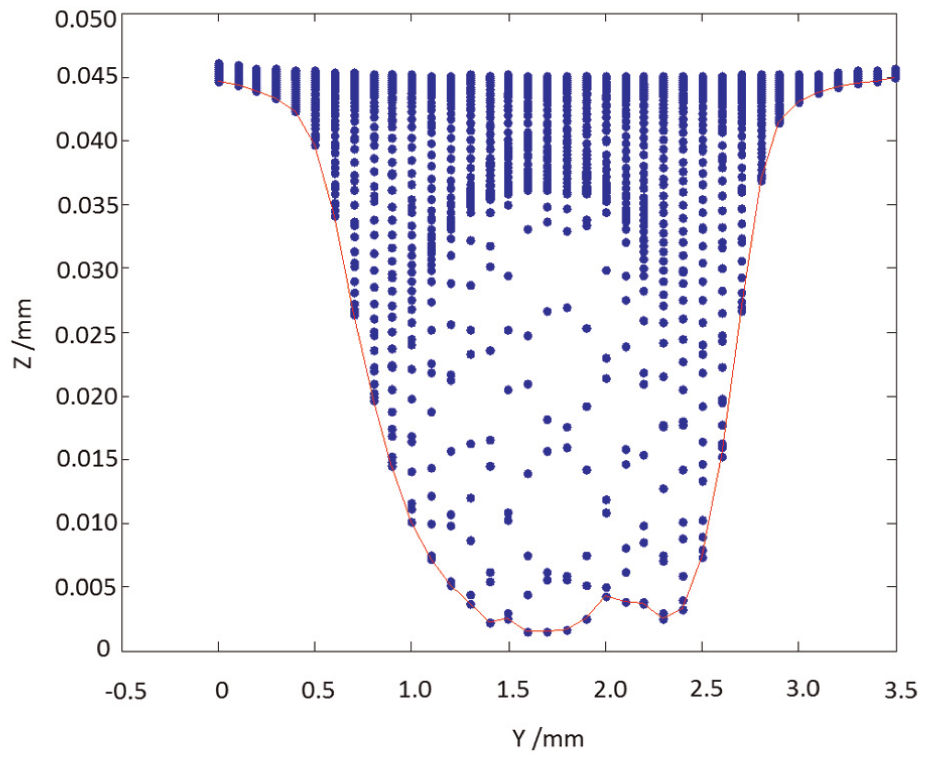
Projection of TIF on the Y–Z plane.
Projection of IF on the Y–Z plane (cross-section in feed rate direction).
Cross-sectional view of the simulated surface.
Cross-sectional view of the simulated surface after the removal of unpolished area.
Experimental setup
Part A: experimental investigation and optimization of process parameter of FJP
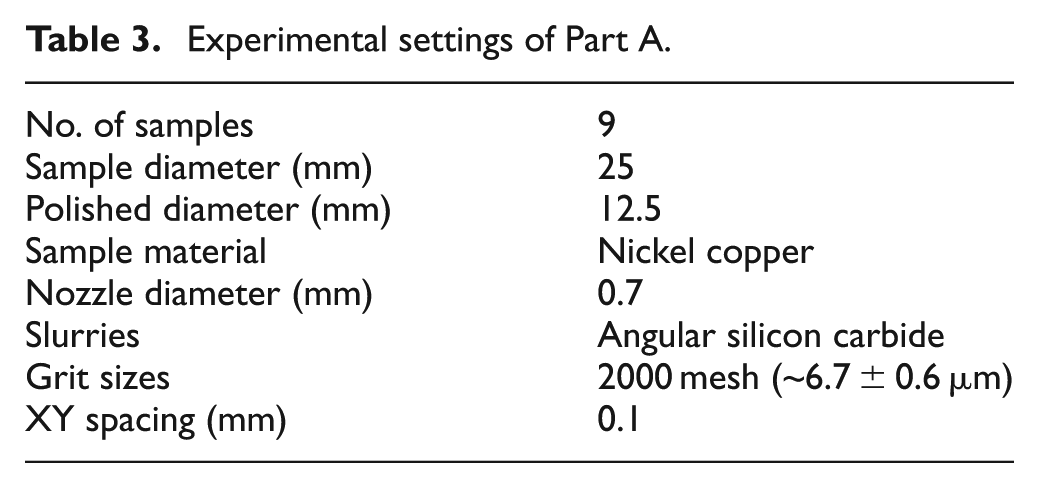
In Part A, the factors and the optimal set of parameters in FJP were studied. This experiment aimed to optimize the process parameters for FJP so as to obtain better surface quality, and the impact/contribution of an individual controllable factor was chosen. To reduce the wear of abrasives during the experiments and retain an original surface for reference, only a part of the sample was polished as shown in Figure 9. In this study, the grit used in all experiments was angular silicon carbide with a particle size of 6.7 ± 0.6 µm. This was chosen because silicon carbide is well-known to have a good MRR to metal samples. This particle size was used to ensure a certain level of MRR.
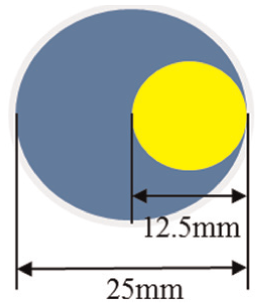
Polished area of FJP process optimization.
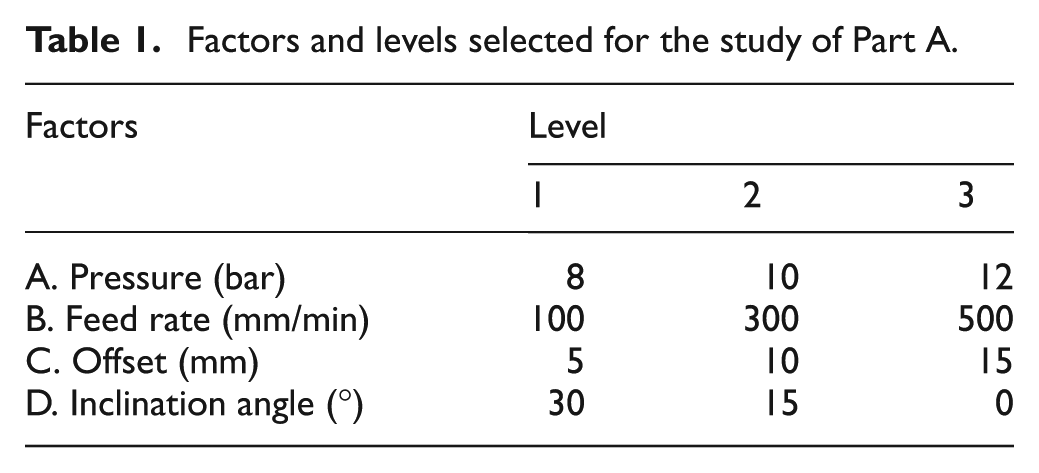
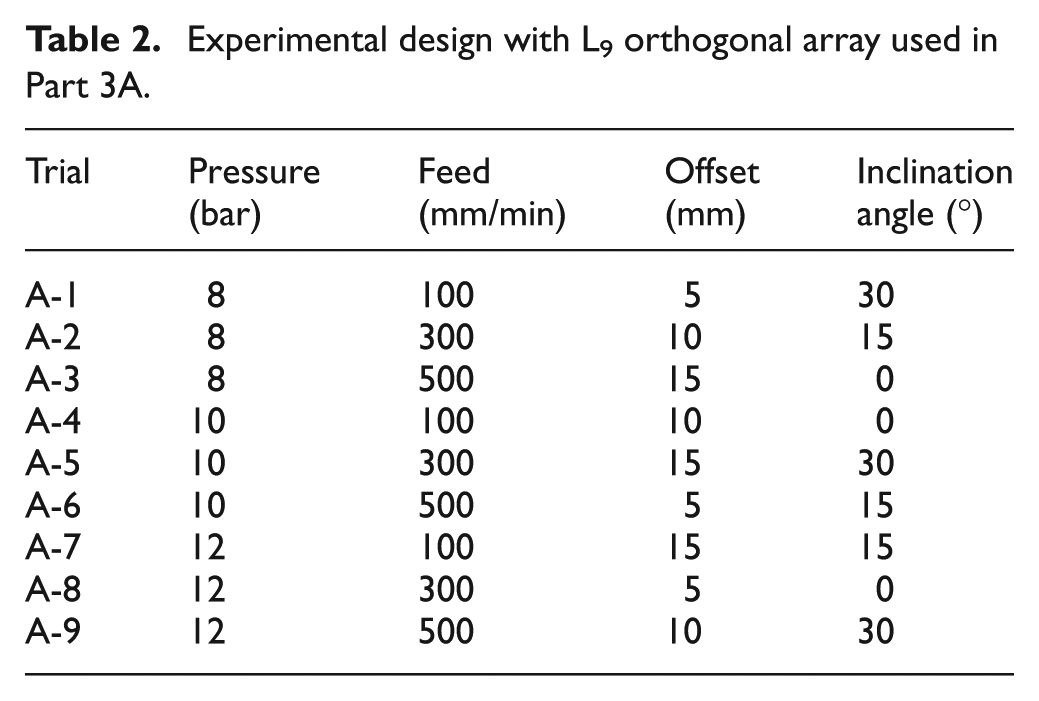
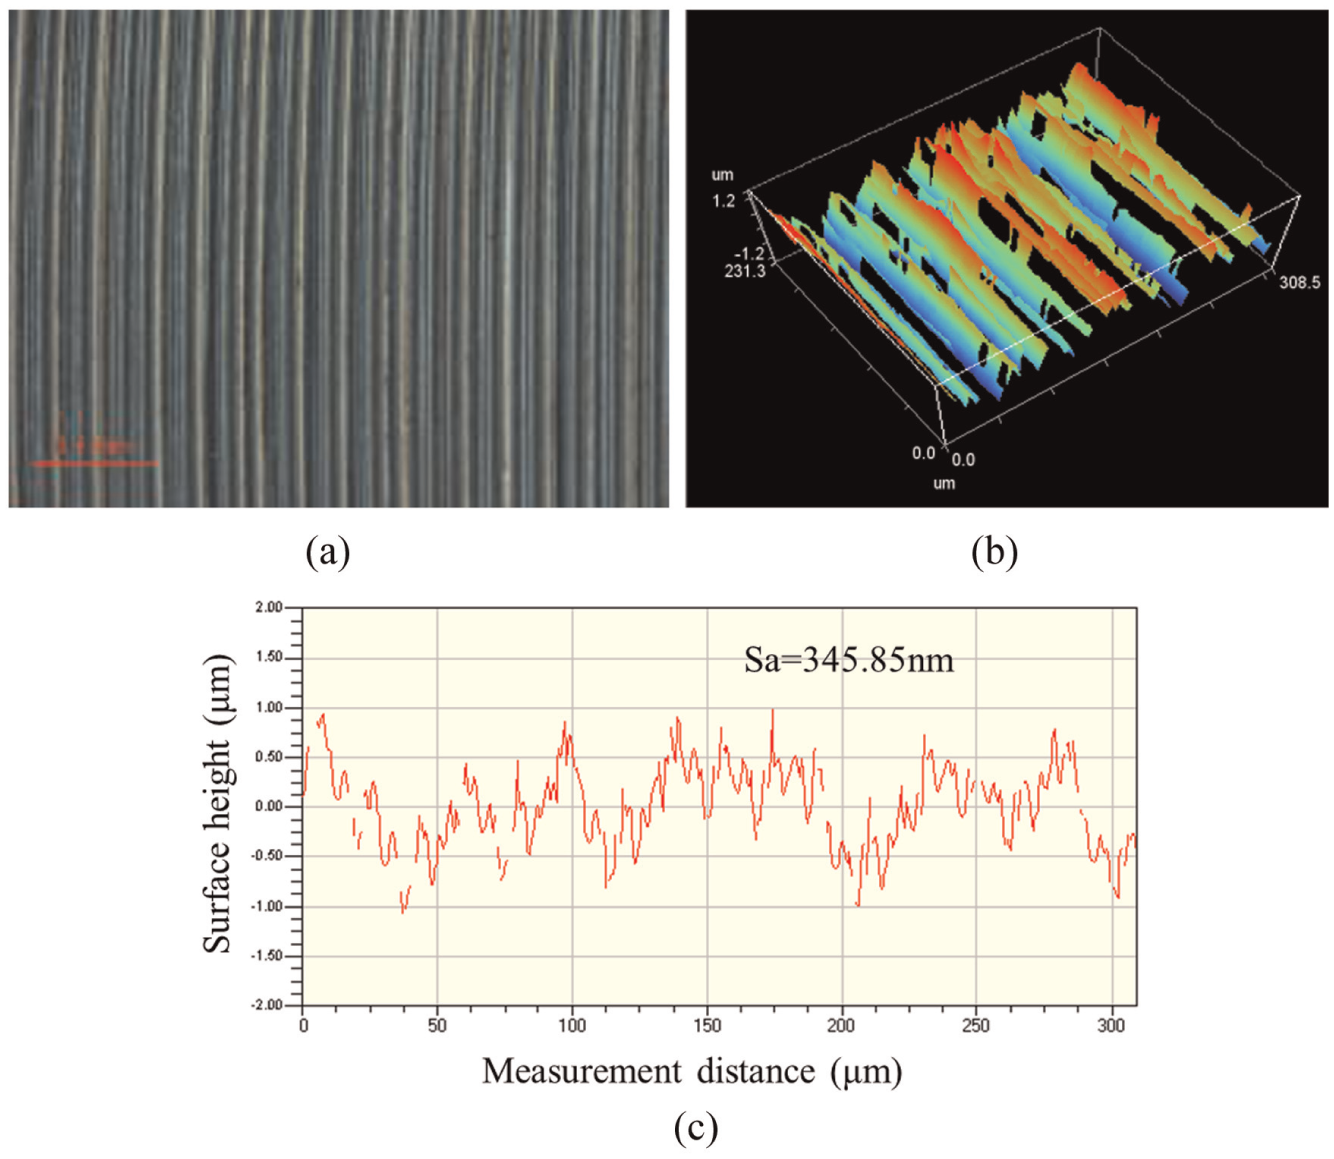
In this experiment with four factors at three levels each, a standard L9 orthogonal array (OA) was selected as it provides the minimal number of trials for four-factor experiment. The factors and the levels are tabulated in Table 1, and the parameter setting of this experiment is shown in Table 2. The general experimental settings are shown in Table 3. The material of the sample was NiCu, and the micrograph of the 3D surface topography and the two-dimensional (2D) XY direction of cross-sectional profile before FJP are shown in Figure 10. Each of them was rough cut by conventional turning.
Factors and levels selected for the study of Part A.
Experimental design with L9 orthogonal array used in Part 3A.
Experimental settings of Part A.
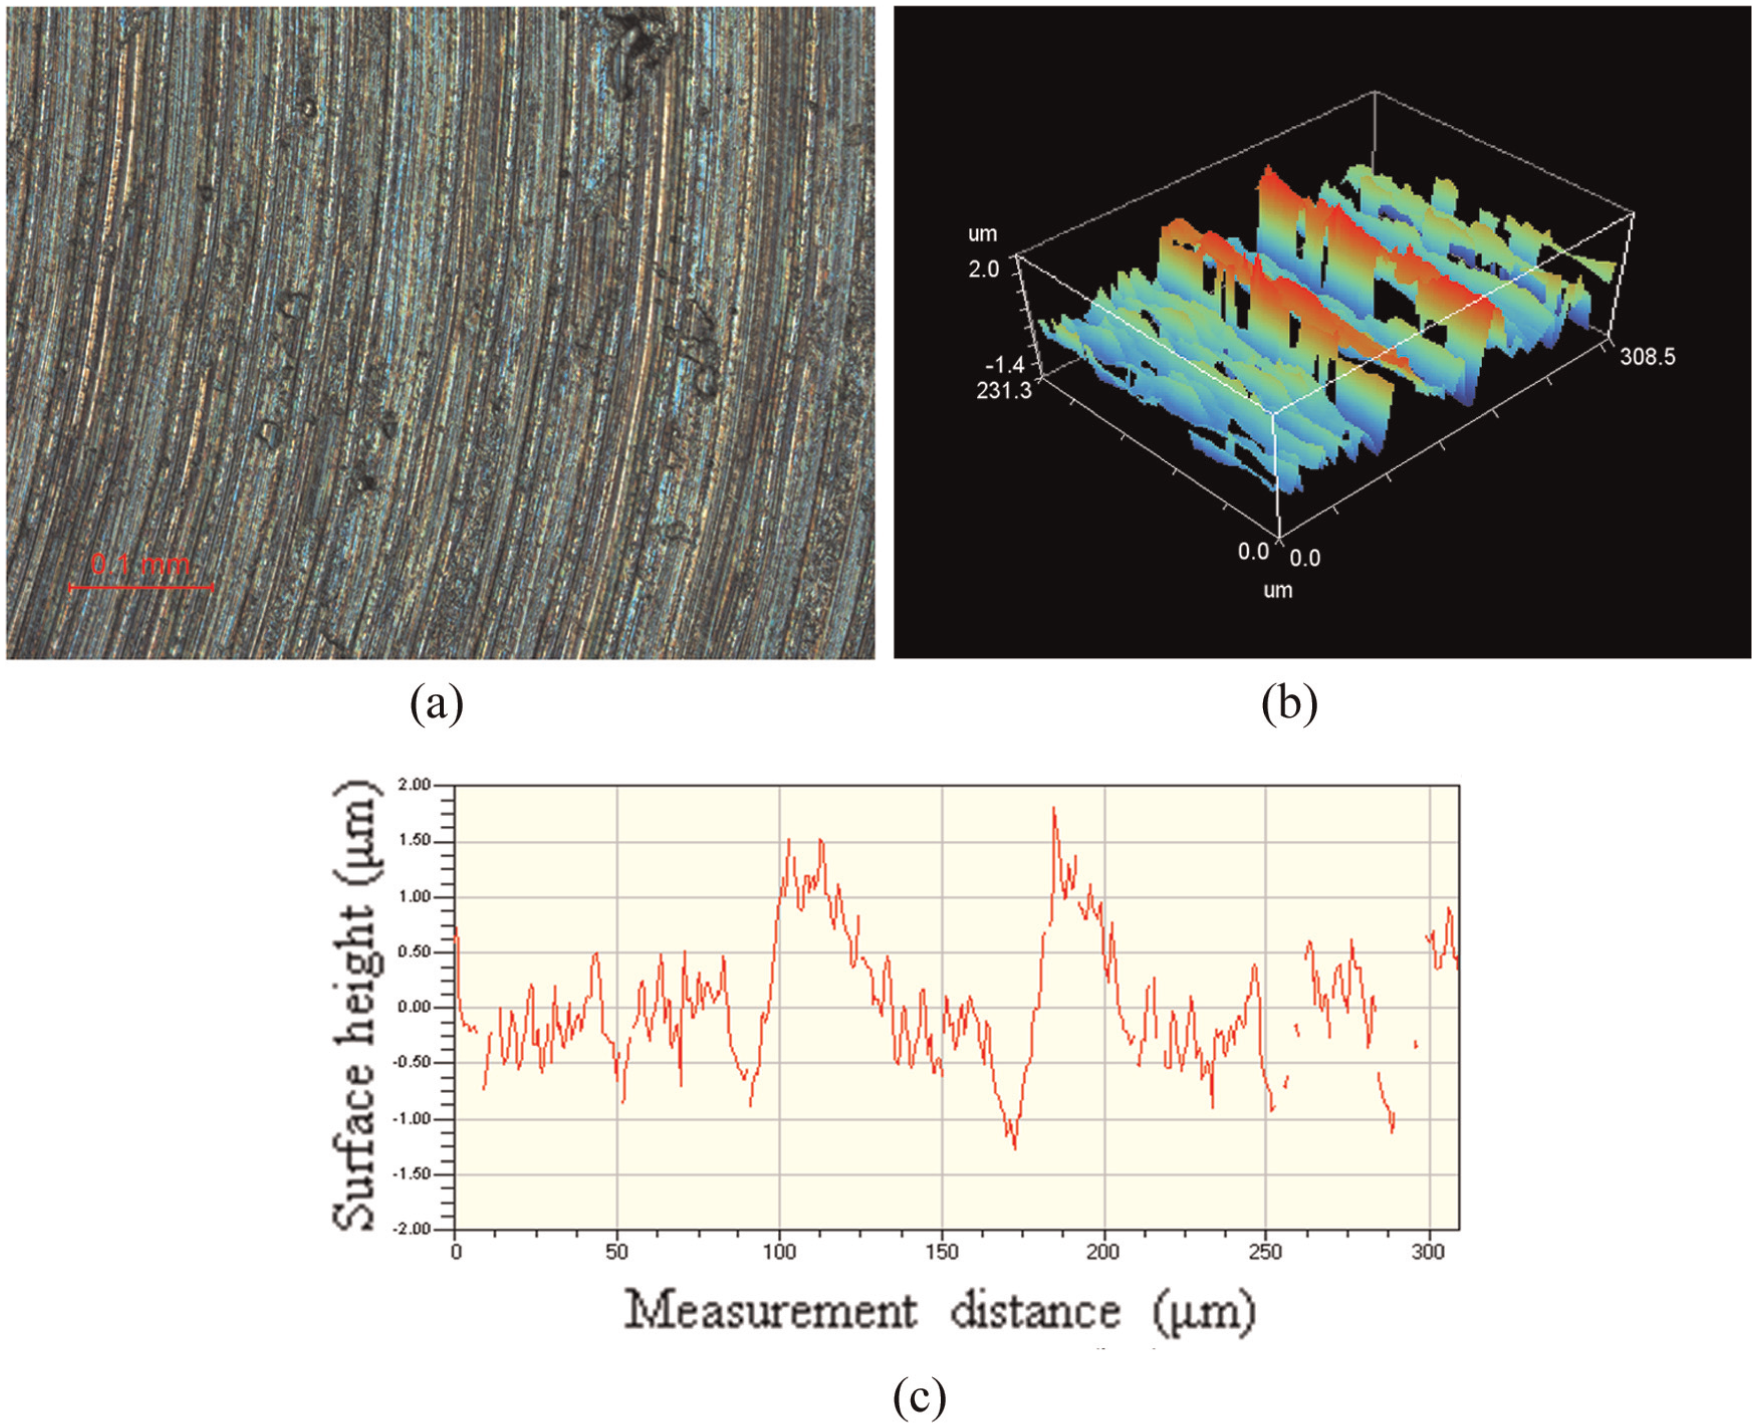
Surface conditions after conventional turning: (a) 20× micrograph, (b) 3D surface topology and (c) 2D surface profile.
Part B: study of polishing spacing limit in the generation of 3D-structured surfaces
There are different needs of polished surfaces. In the surface processing industry, some people may ask for surface with 3D structures that can enhance the function of the surface such as wettability of the surface so as to increase the adhesive force between the coating materials and the workpiece surface. However, 3D-structured surface should be eliminated to maintain the lens functions in the optic industry. The understanding and simulation of surface generation of FJP is very crucial so as to fit the polished workpiece for different requirements.
Although 3D-structured surface generation by FJP is a novel way, there is a limit in the dimension in generating 3D structures on the workpiece surface. The limitation is dominantly caused by the diameter of the slurry beam. The structures may be removed by a smaller polishing spacing in the next step. To investigate the spacing limit, a series of experiments were undertaken with the use of horizontal and vertical raster polishing strategies. A similar experiment was carried by the research team of the authors for the investigation of MP perviosuly. 1 As shown in Figure 11, the workpiece surfaces used in the experiments are divided into four areas as follows:
Non-polishing area (N) which was not polished;
Horizontal polishing area (H) which was polished horizontally;
Vertical polishing area (V) which was polished vertically;
Cross-polishing area (X) which was an overlapping area.
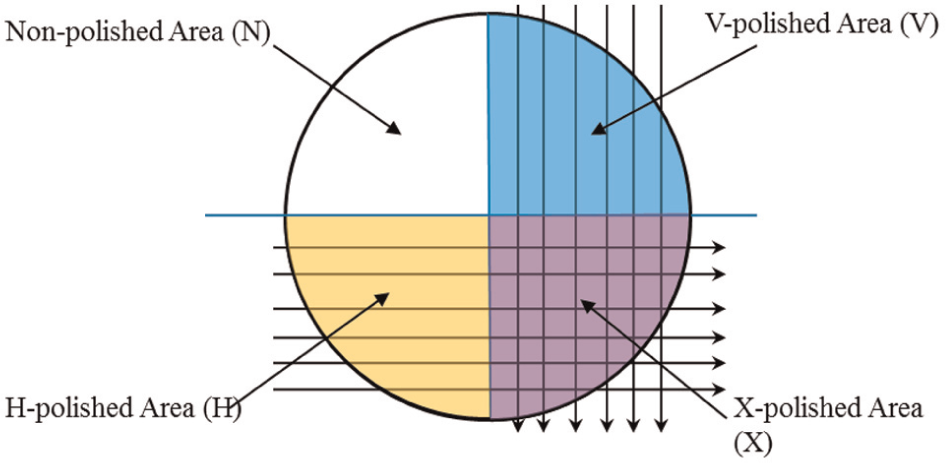
Polished areas for each sample.
In Part B of the experiments, flat nickel copper samples with a diameter of 12.5 mm were machined by single-point diamond turning. Table 4 shows the design of the experiment. The value of inclination angle and tool offset used are optimized using Taguchi’s approach in Part A.
Experimental design for studying polishing spacing limit.
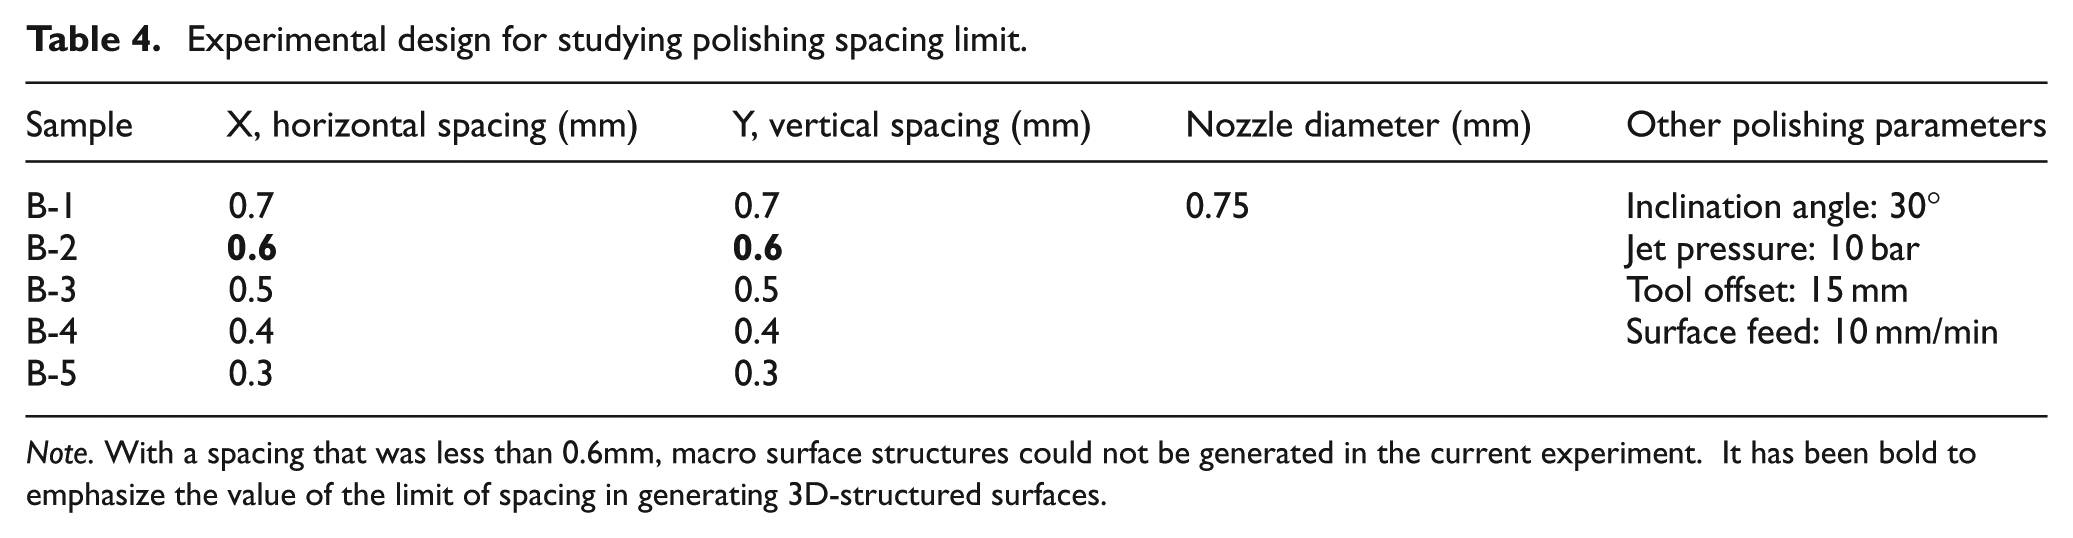
Note. With a spacing that was less than 0.6mm, macro surface structures could not be generated in the current experiment. It has been bold to emphasize the value of the limit of spacing in generating 3D-structured surfaces.
Part C: surface topography simulation model for 3D-structured generation by FJP
Relationship between MRR and time
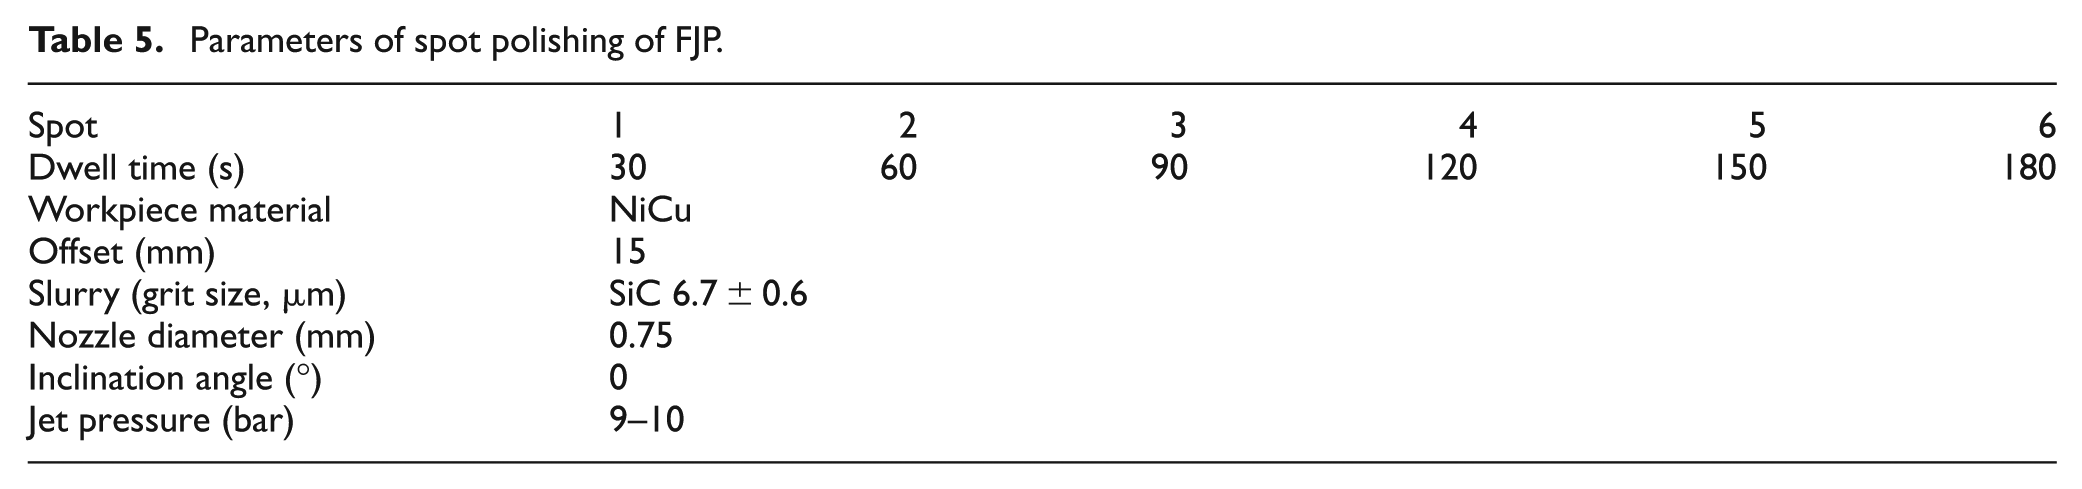
As mentioned in Fang et al.’s 8 work, the amount of glass material removed has a linear relationship with processing time and the MRR. To further ensure the linear relationship with MRR and time of NiCu, an experiment was conducted. Six spots were generated on a flat NiCu surface by FJP process with different dwell time and measured by Wyko NT8000. The spot polishing parameters are shown in Table 5.
Parameters of spot polishing of FJP.
Experimental verification of the surface topography simulation model for 3D-structured generation by FJP
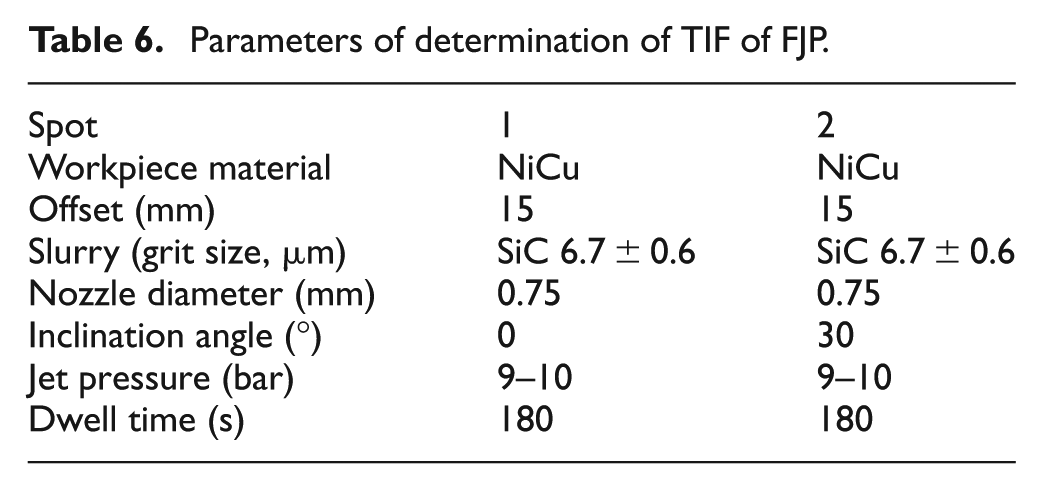
Experiments conducted in Part C focuses on the experimental evaluation of the surface topography simulation model for 3D-structured surface generation by FJP. The evaluation starts with the determination of the TIF by polishing tests. The polishing parameters for influence function tests are shown in Table 6. The spot data were measured by Form Talysurf Series 2 with the Y axis to obtain 3D measurement results.
Parameters of determination of TIF of FJP.
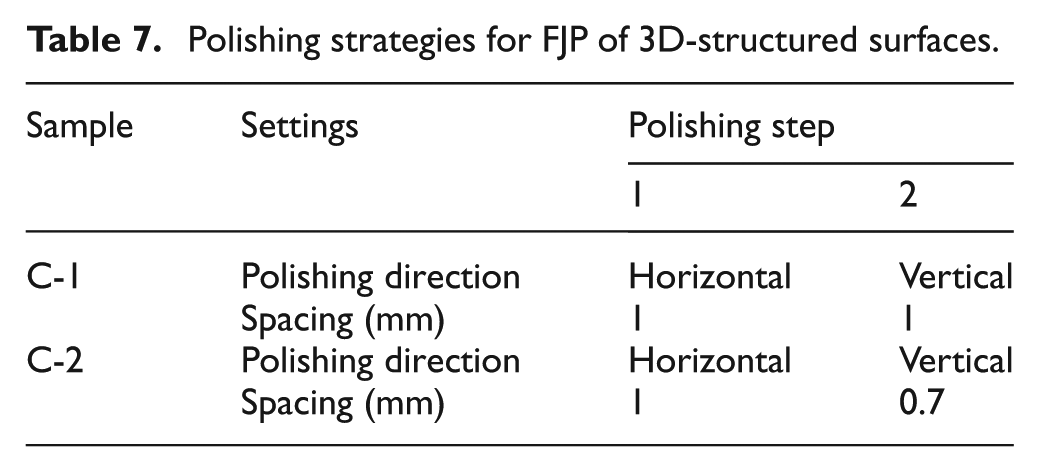
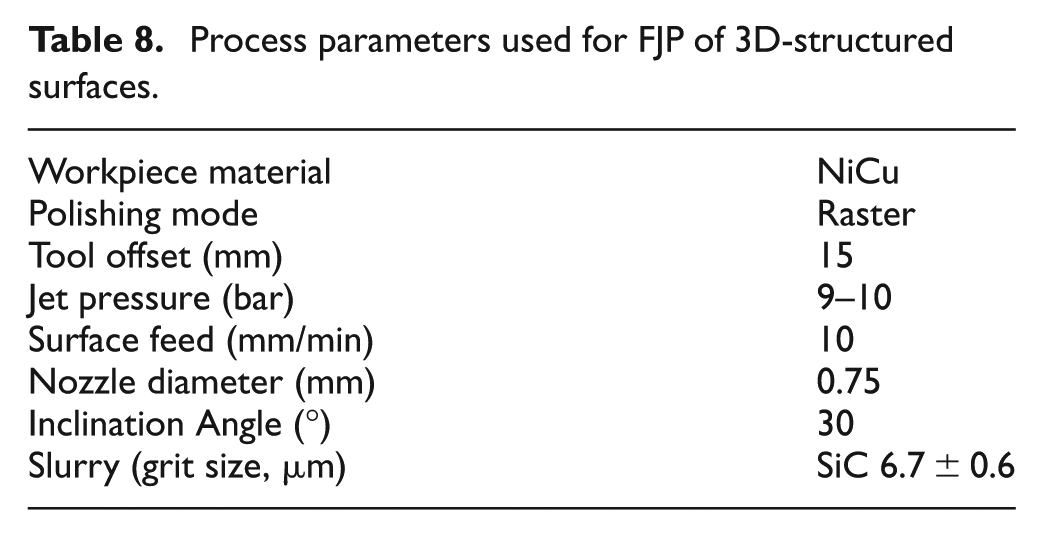
Hence, 3D-structured surfaces were polished based on various polishing strategies. The polishing trajectories of each polishing step and the polishing parameters for 3D-structured surface generation are shown in Tables 7 and 8, respectively. The surface topography simulation model was used to simulate and predict 3D-structured surfaces based on the experimental data of TIF. A series of polishing tests were conducted to polish the 3D-structured surfaces made of NiCu. The polished 3D-structured surfaces were measured by a non-contact 3D optical system, Wyko NT8000 from Veeco Inc., USA. Hence, the predicted and the measured results of the 3D-structured surface generation by FJP were compared.
Polishing strategies for FJP of 3D-structured surfaces.
Process parameters used for FJP of 3D-structured surfaces.
Results and discussion
Part A: experimental investigation and optimization of process parameter of FJP
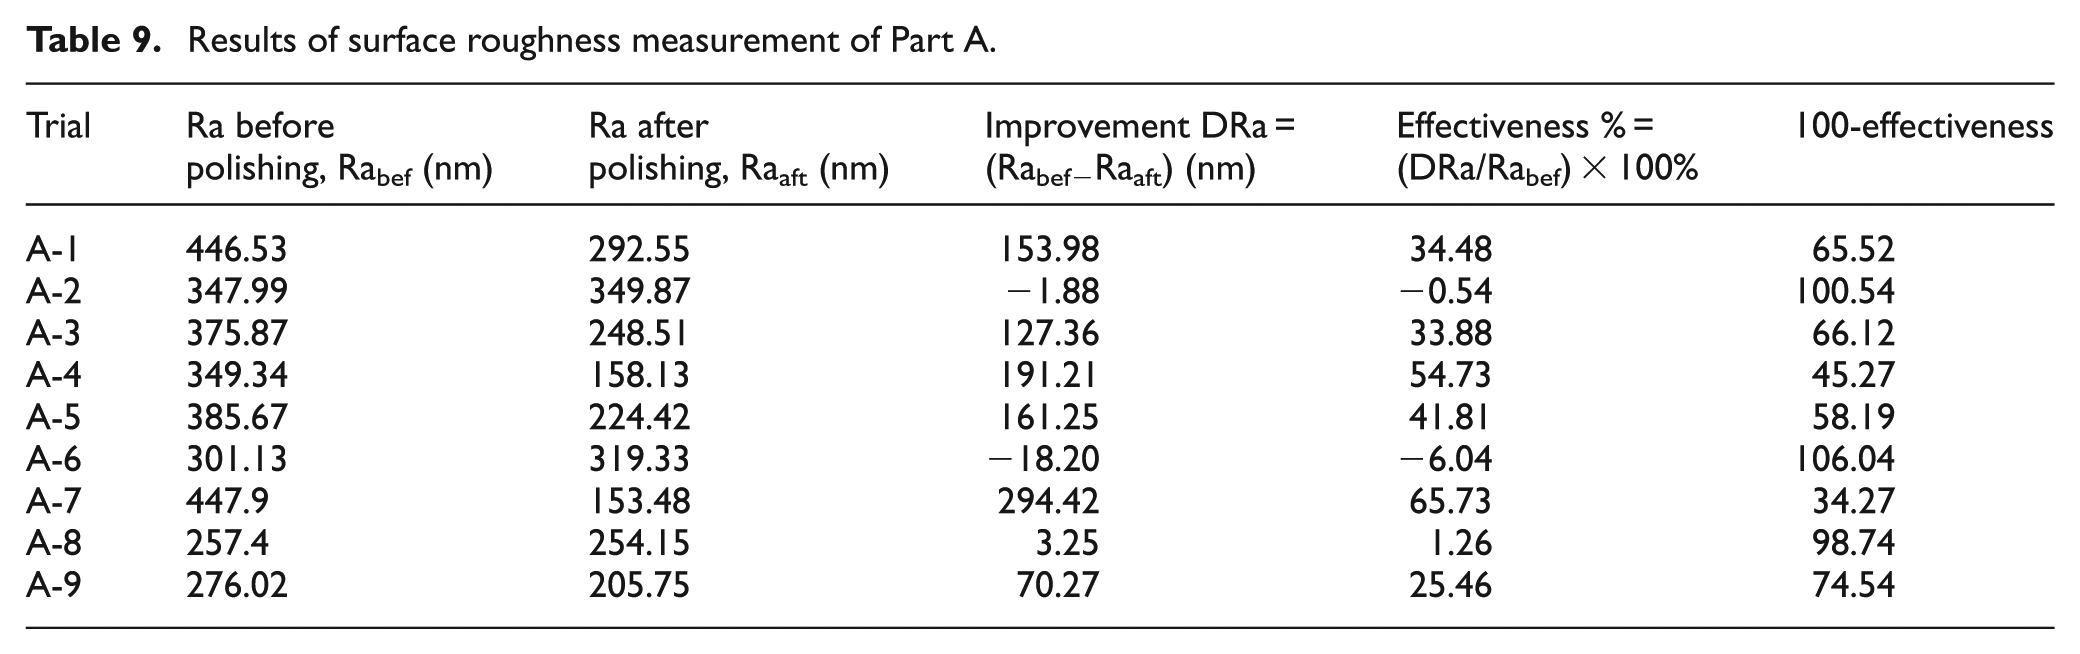
Table 9 shows the measurement results of surface roughness in terms of arithmetic roughness
Results of surface roughness measurement of Part A.
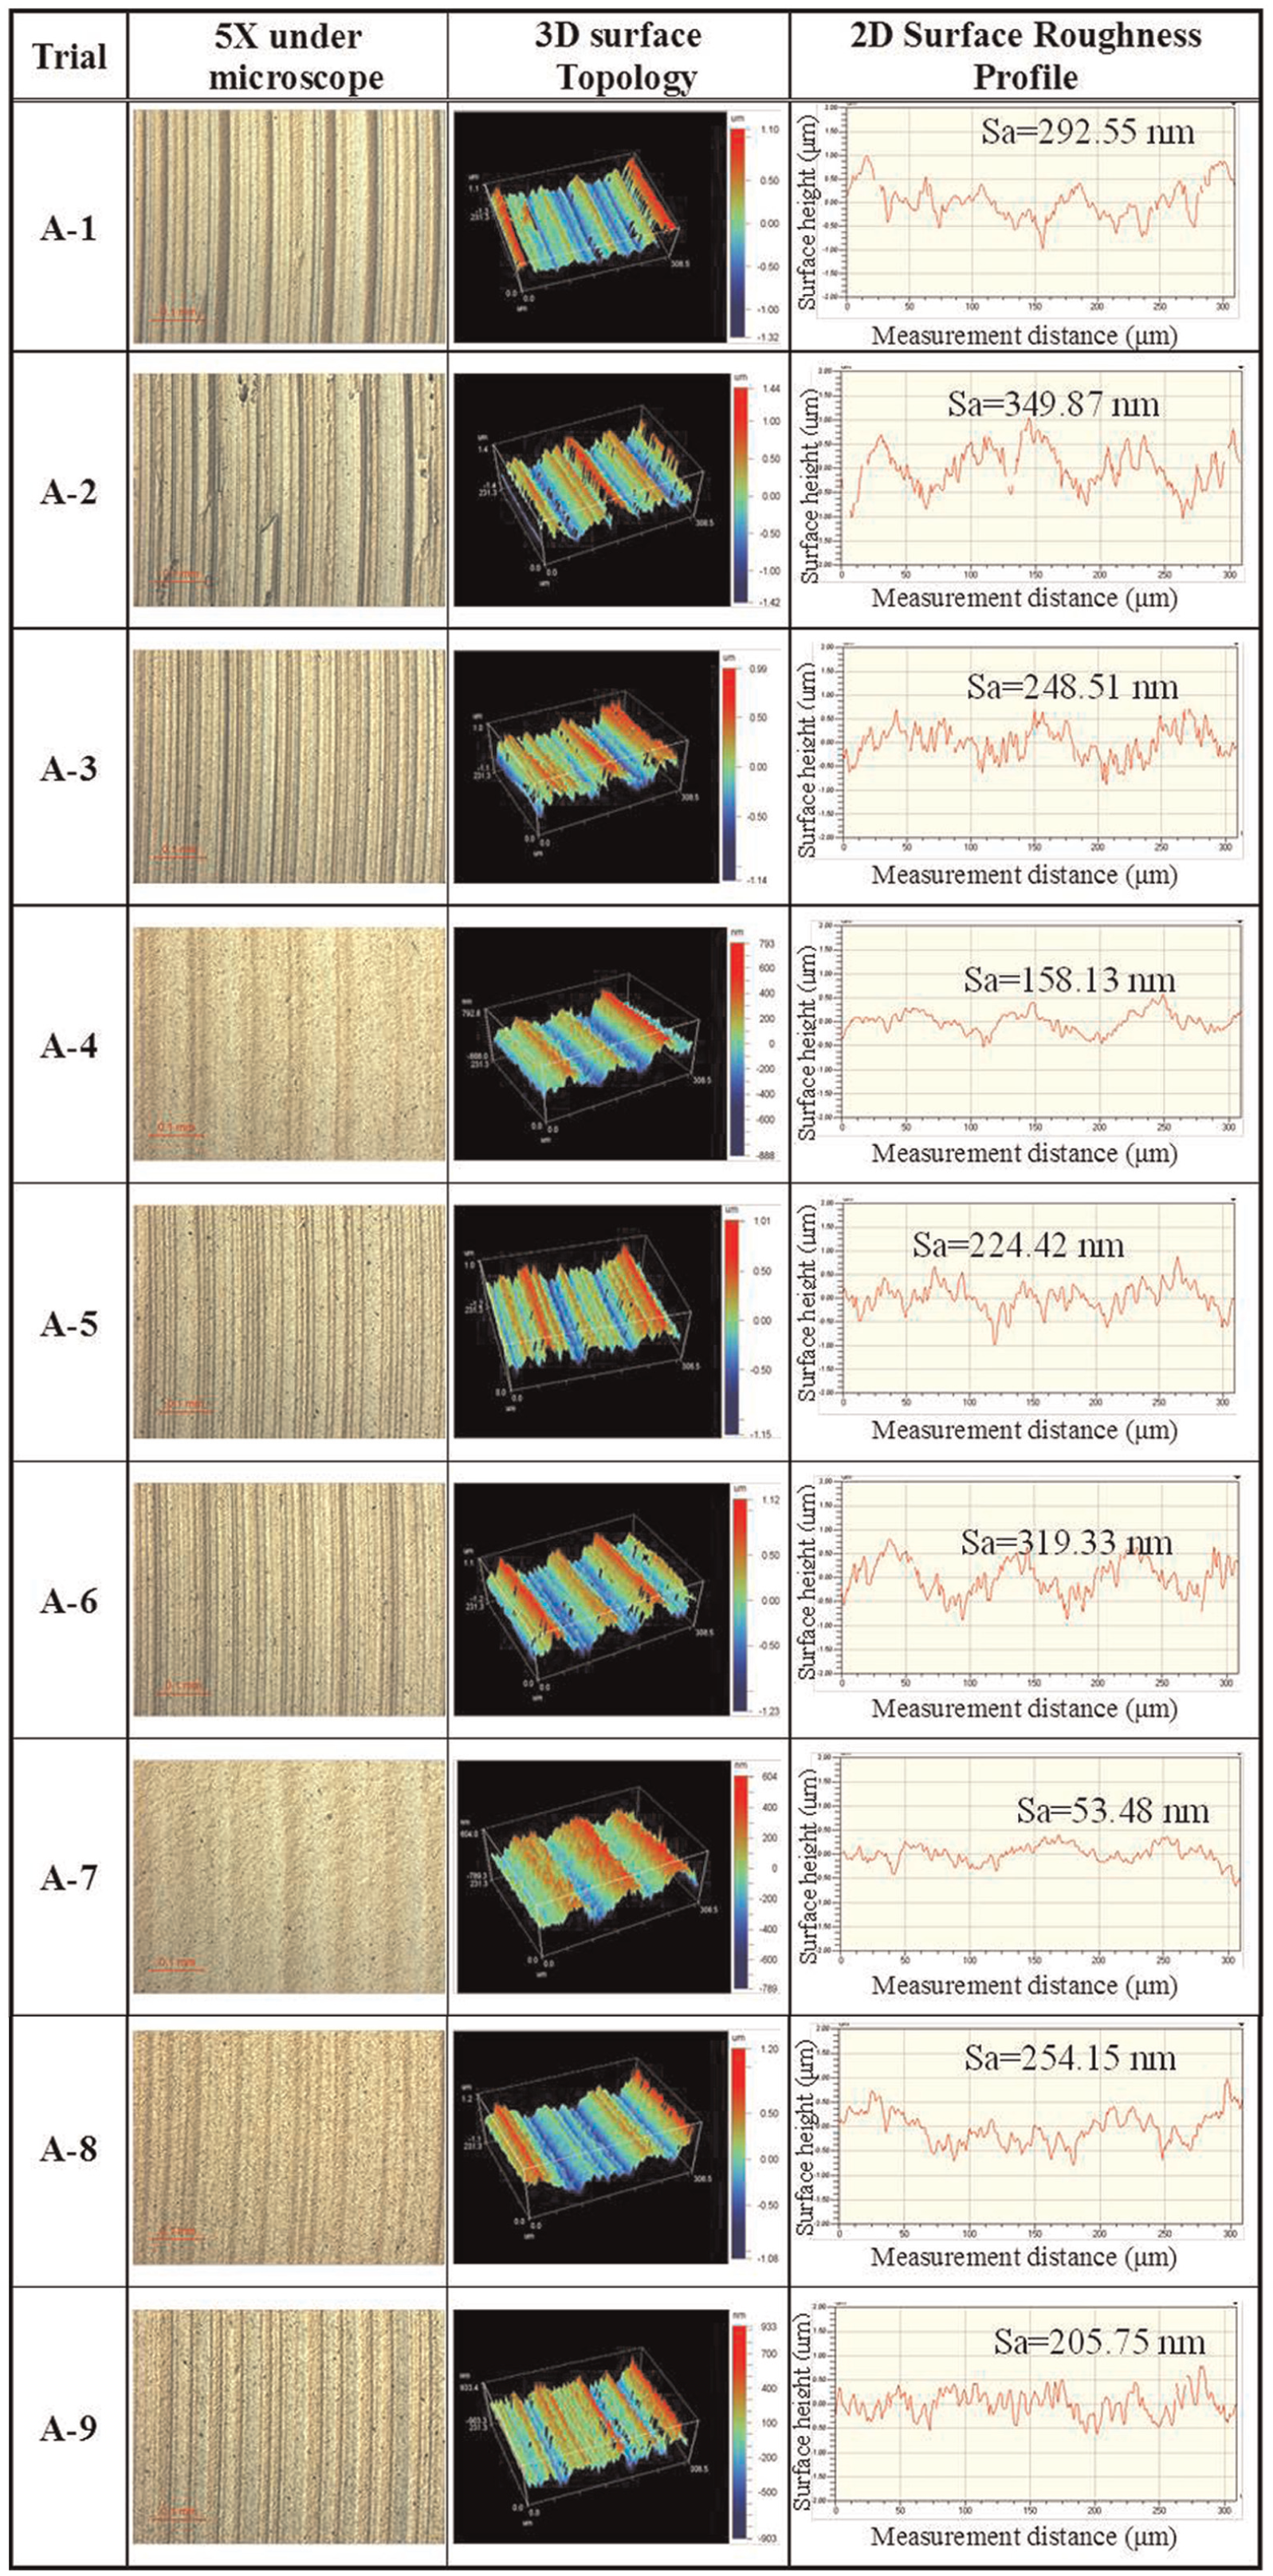
Variation of surface texture, surface topography and surface roughness profile under various conditions after FJP.
With different combinations of parameters, the surface topography and surface roughness of the polished surfaces were different despite using the same size of abrasives in this case. It is interesting to note that the combination of parameters used in Trial A-7 gave the most significant reduction in the value of surface roughness. The tool marks produced by conventional turning were obvious less although they could not be completely removed. The process parameters used in Trials A-2 and A-4 contributed very insignificantly to both improvement of the surface roughness and removal of tool marks. These results infer the importance of the parametric optimization in the FJP.
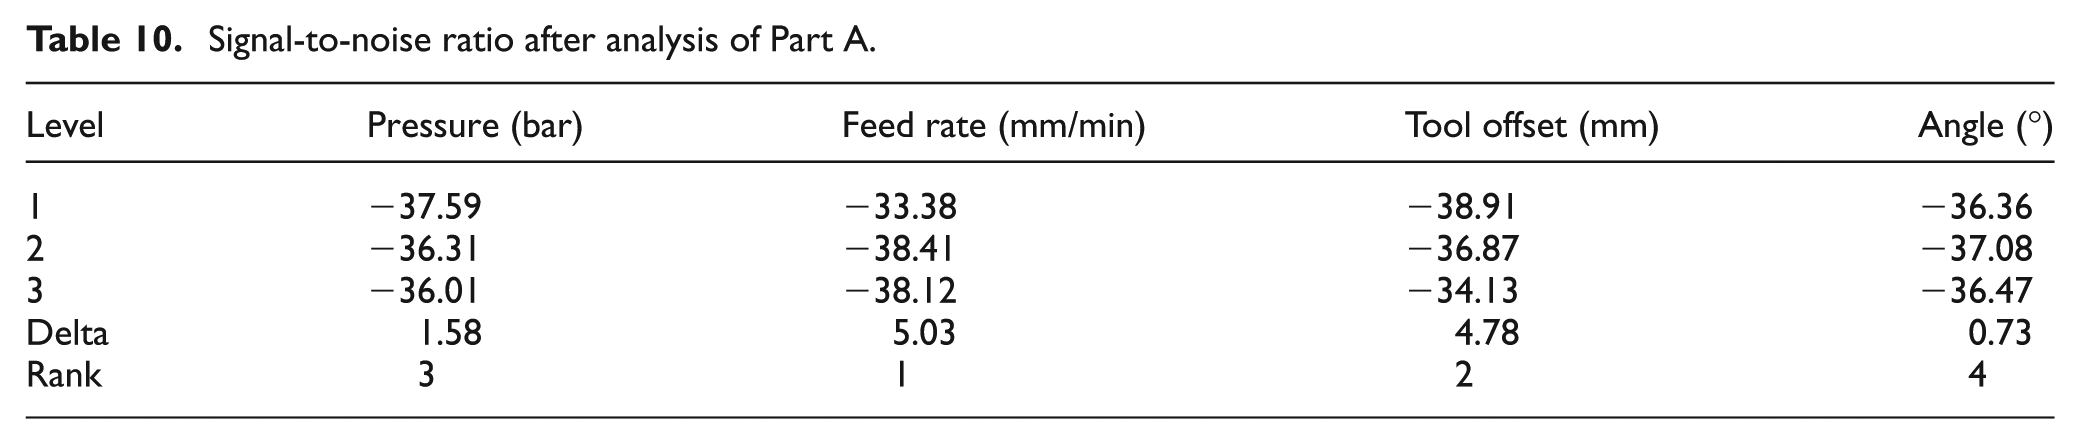
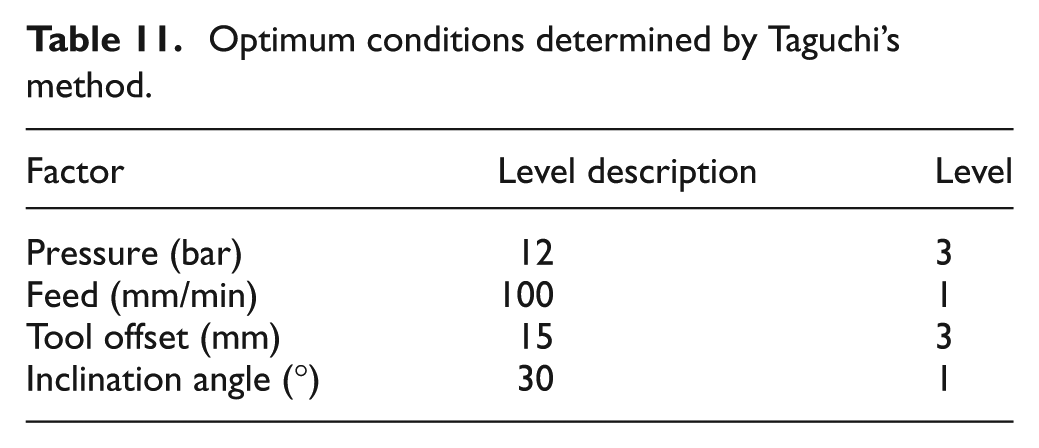
In this experiment, Taguchi’s method was used to design the experiments, and the results were analysed with the use of the signal-to-noise (S/N) ratio. In the calculation process of the S/N ratio, as negative numbers are not allowed, the integer 100 was used to analyse the percentages of improvement. Due to this reason, the S/N ratio characteristic of ‘smaller the better’ was chosen in the current analysis. Based on the results of Taguchi’s analysis as shown in Table 10, the optimum polishing conditions were identified and are summarized in Table 11.
Signal-to-noise ratio after analysis of Part A.
Optimum conditions determined by Taguchi’s method.
The feed rate and tool offset were found to have relatively greater magnitude, while the pressure had less and inclination angle had the least. The main effects of different parameters in FJP were plotted according to the S/N ratio as shown in Figure 13.
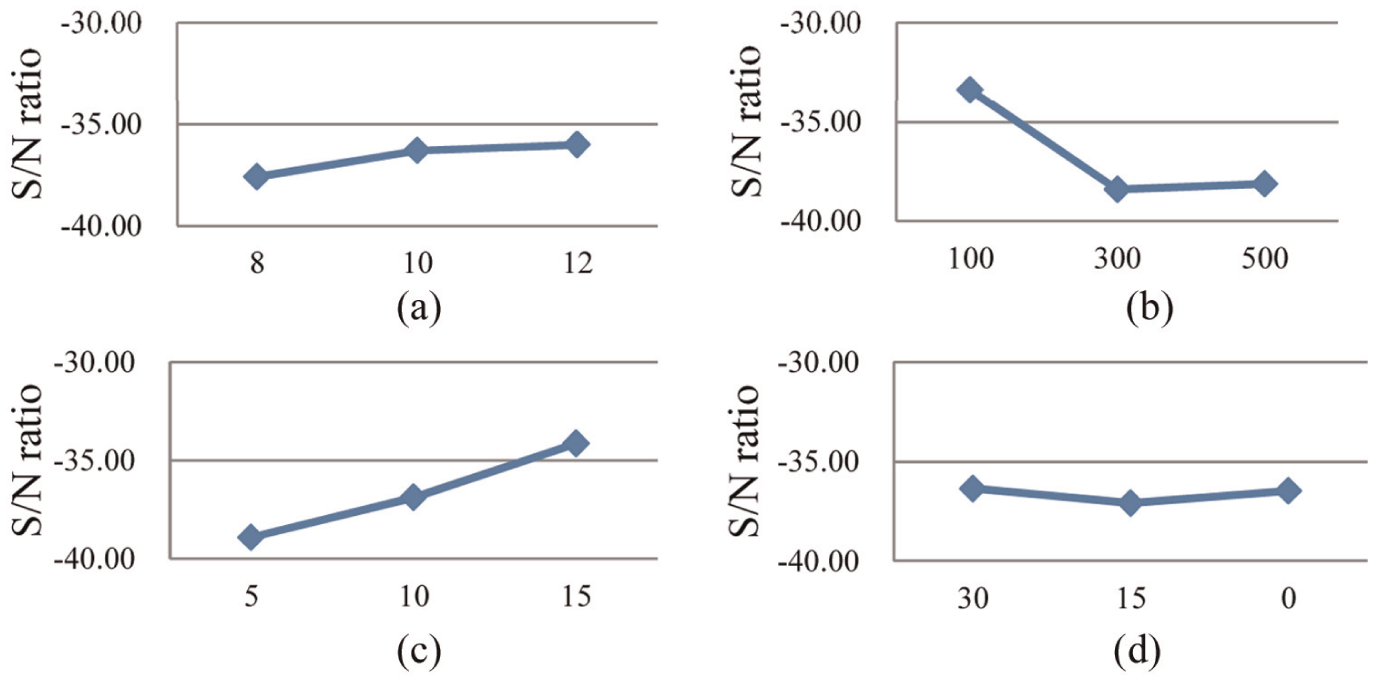
Main effect plot of Part A: (a) pressure, (b) feed rate, (c) offset and (d) inclination angle.
There appear to be linear relationships among the arithmetic surface roughness, pressure and offset distance. As the values of pressure and offset distance increased, the surface roughness underwent more improvement. This may be due to the fact that a larger pressure gives more energy to the grit in the slurry, and the impact of grit on the surface is larger. This increases the MRR. If the offset distance is too short, the force of grit impacts on the surface may be too large, and this results in the generation of deep pits. This causes poor surface roughness. Unlike MP, the process of FJP almost generates no scratch marks, but considerable amounts of pits. The slowest feed rate of 100 mm/min in the current experiment gave more time for the slurry to remove more materials from the target surface. Although the inclination angle showed the least sensitivity in the experiment, an angle of 30° of inject slurry enabled the grit to perform cutting and sliding so as to increase the effectiveness of polishing.
A verification experiment was carried out with the optimized parameters, and the results of the experiment are shown in Figures 14 and 15. It is interesting to note that the value of surface roughness was significantly reduced from 345.85 to 145.71 nm with more than 57% improvement.
Surface conditions before the verification test of FJP: (a) 20× micrograph, (b) 3D surface topology and (c) 2D surface profile.
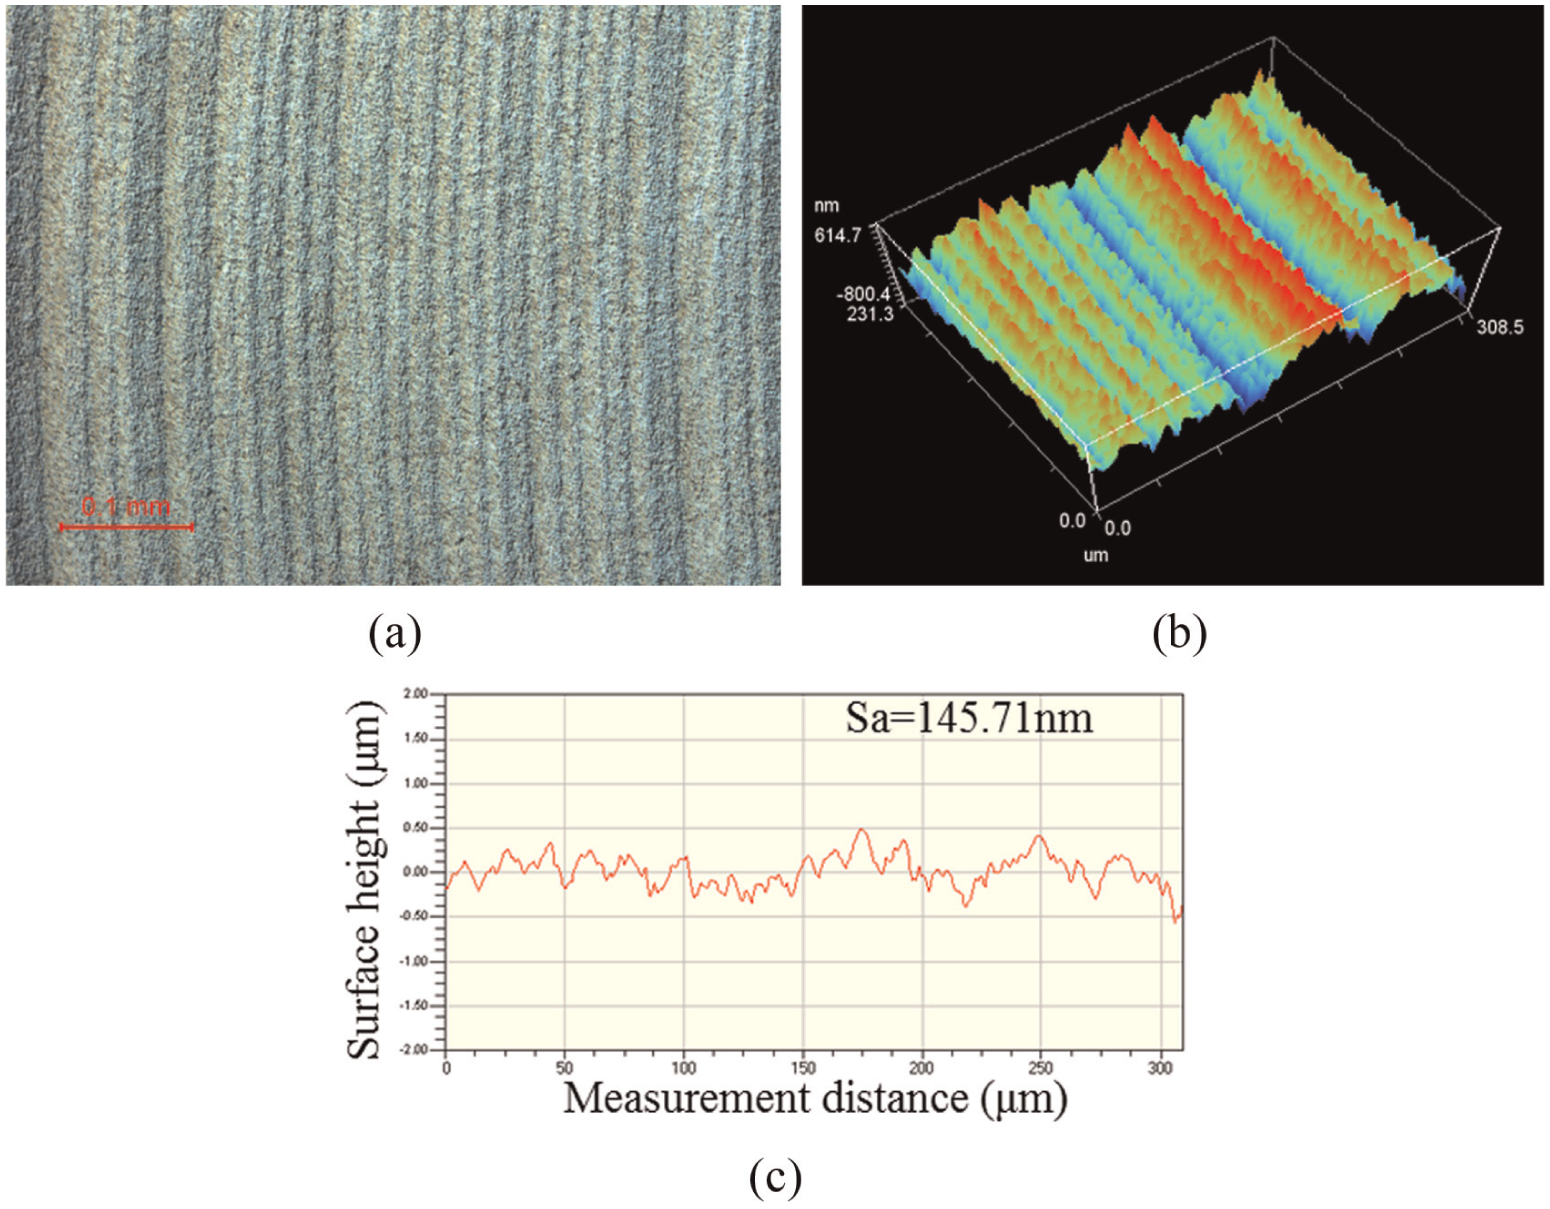
Surface conditions after the verification test of FJP: (a) 20× micrograph, (b) 3D surface topology and (c) 2D surface profile.
Part B: study of polishing spacing limit in the generation of 3D-structured surfaces
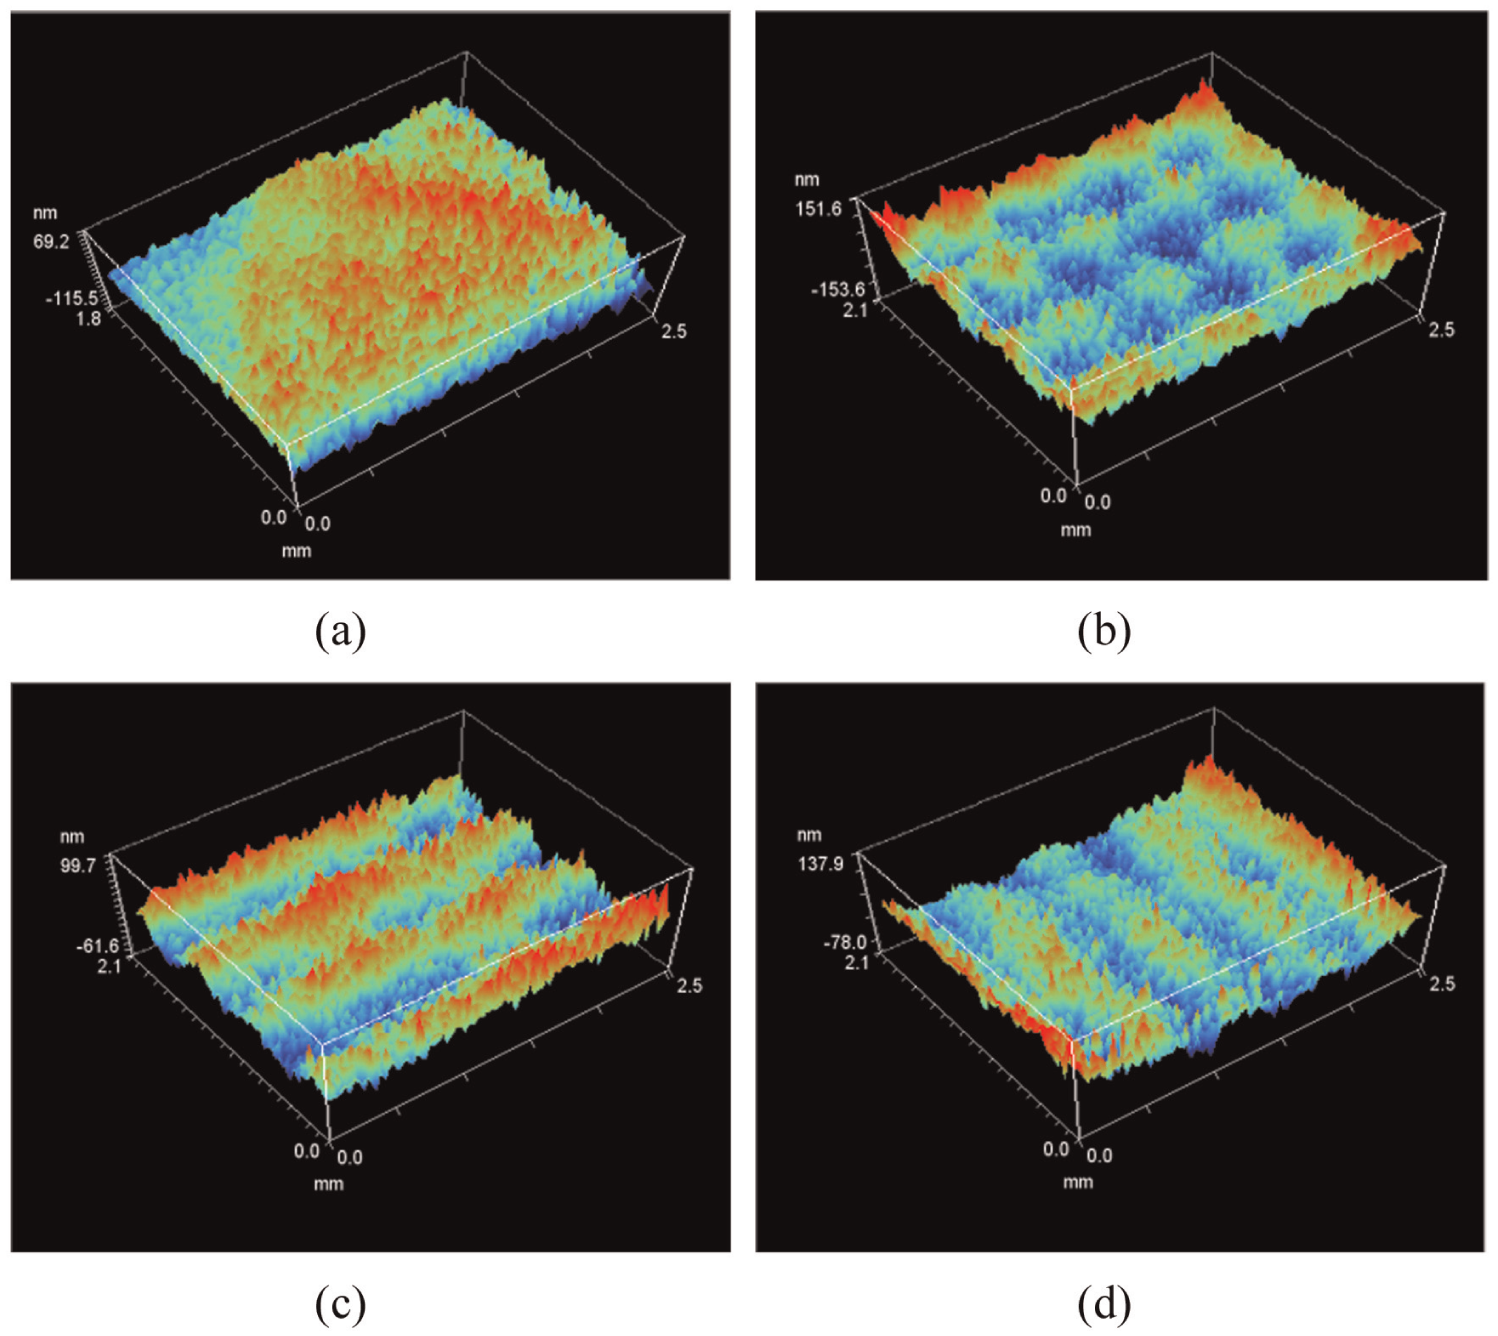
Figures 16–20 show the measured surface topographies of the 3D-structured surfaces polished under different polishing spaces as shown in Conditions B-1 to B-5, tabulated in Table 1. The polished surfaces have periodic patterns. When the polishing spacing is reduced to below 600 µm, the process is unable to generate any periodic patterns on the surfaces. The limitation exists in the contact area of the water beam ejected from the nozzle and the surface. These results provide an important means for choosing polishing spacing to fulfil the requirements of different polished surface conditions from the macro point of view. Smaller polishing spacing in the process increases the production time of a single workpiece. From the results of these two experiments, a spacing of less than 0.6 mm under the current experimental conditions can generate surfaces without any macro patterns. A smaller spacing only increases the polishing time.
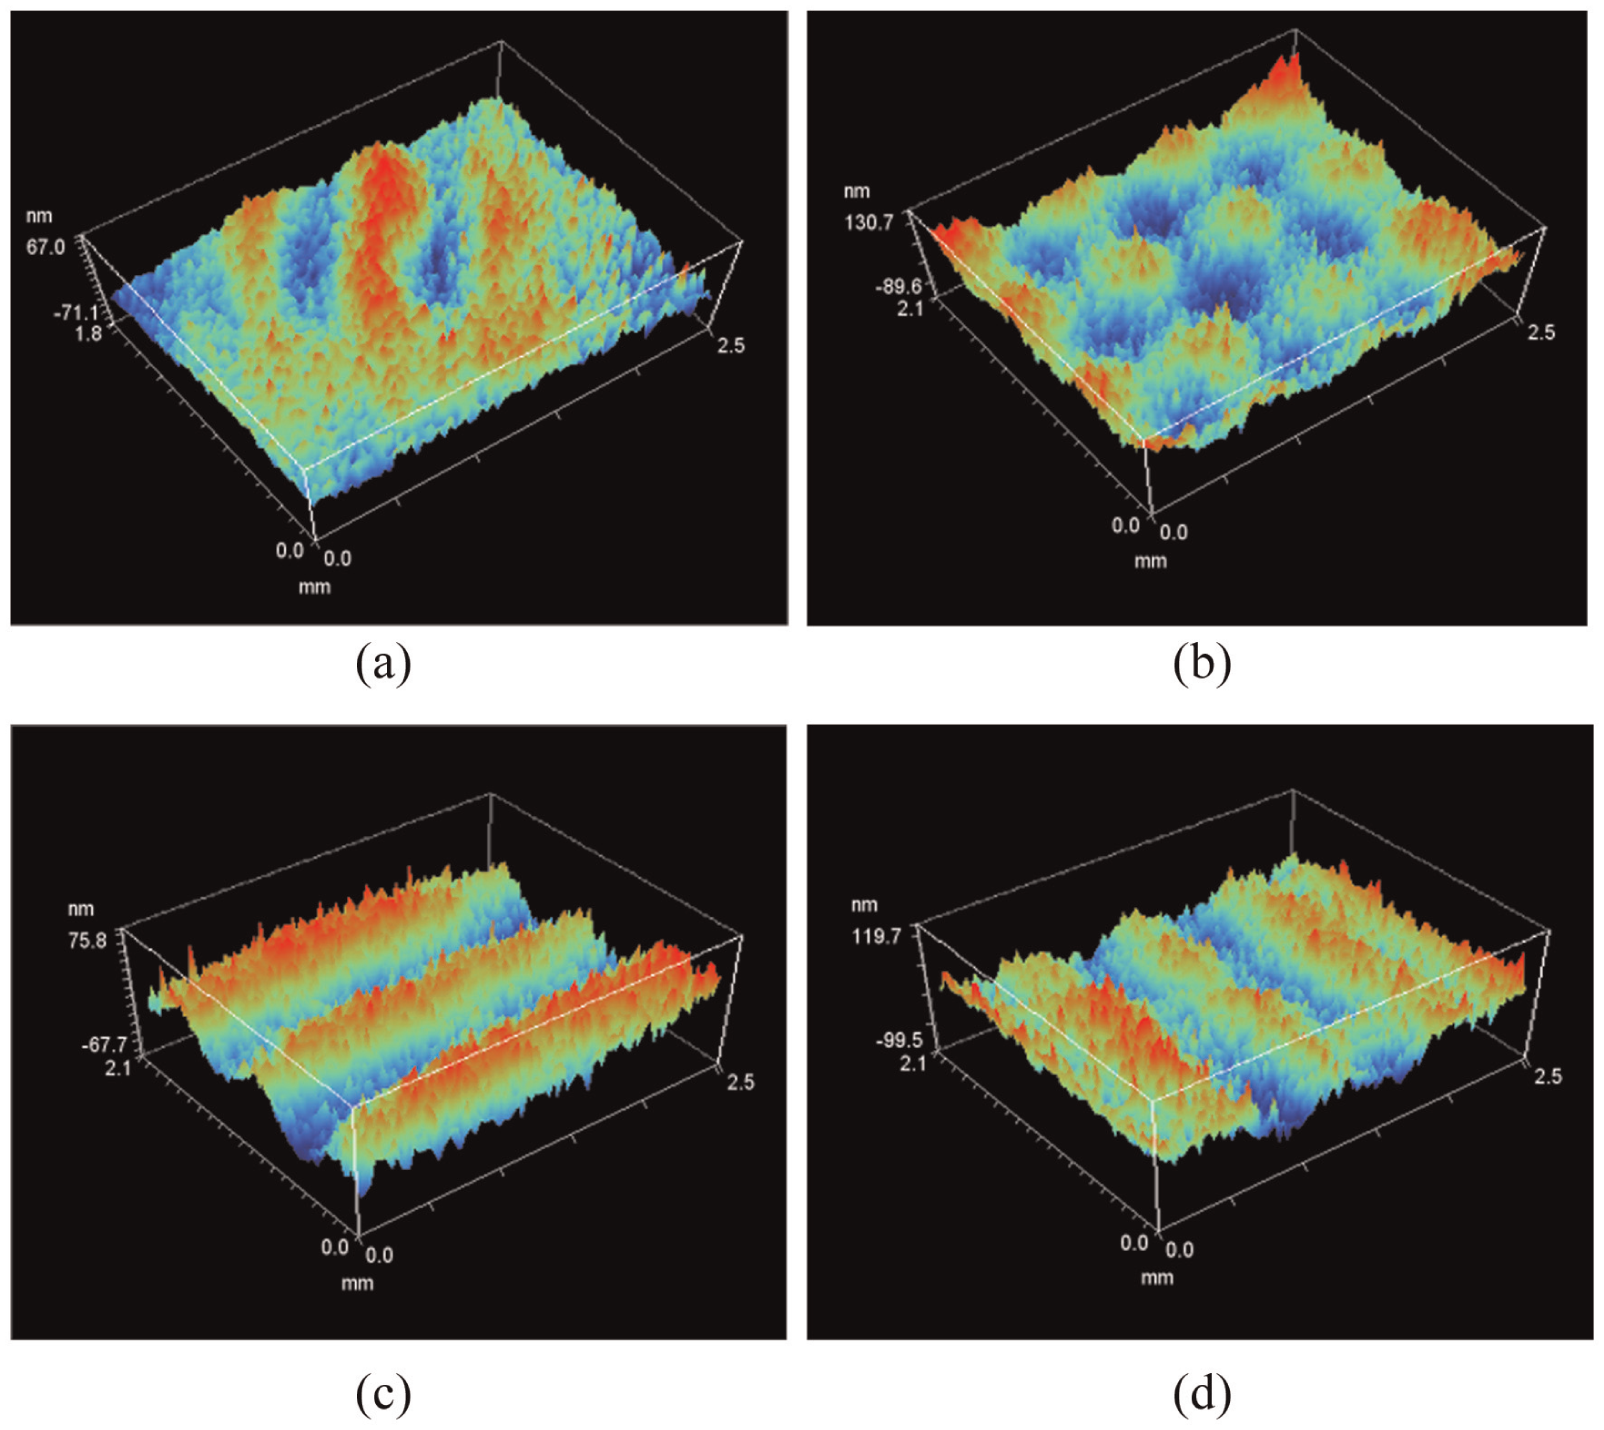
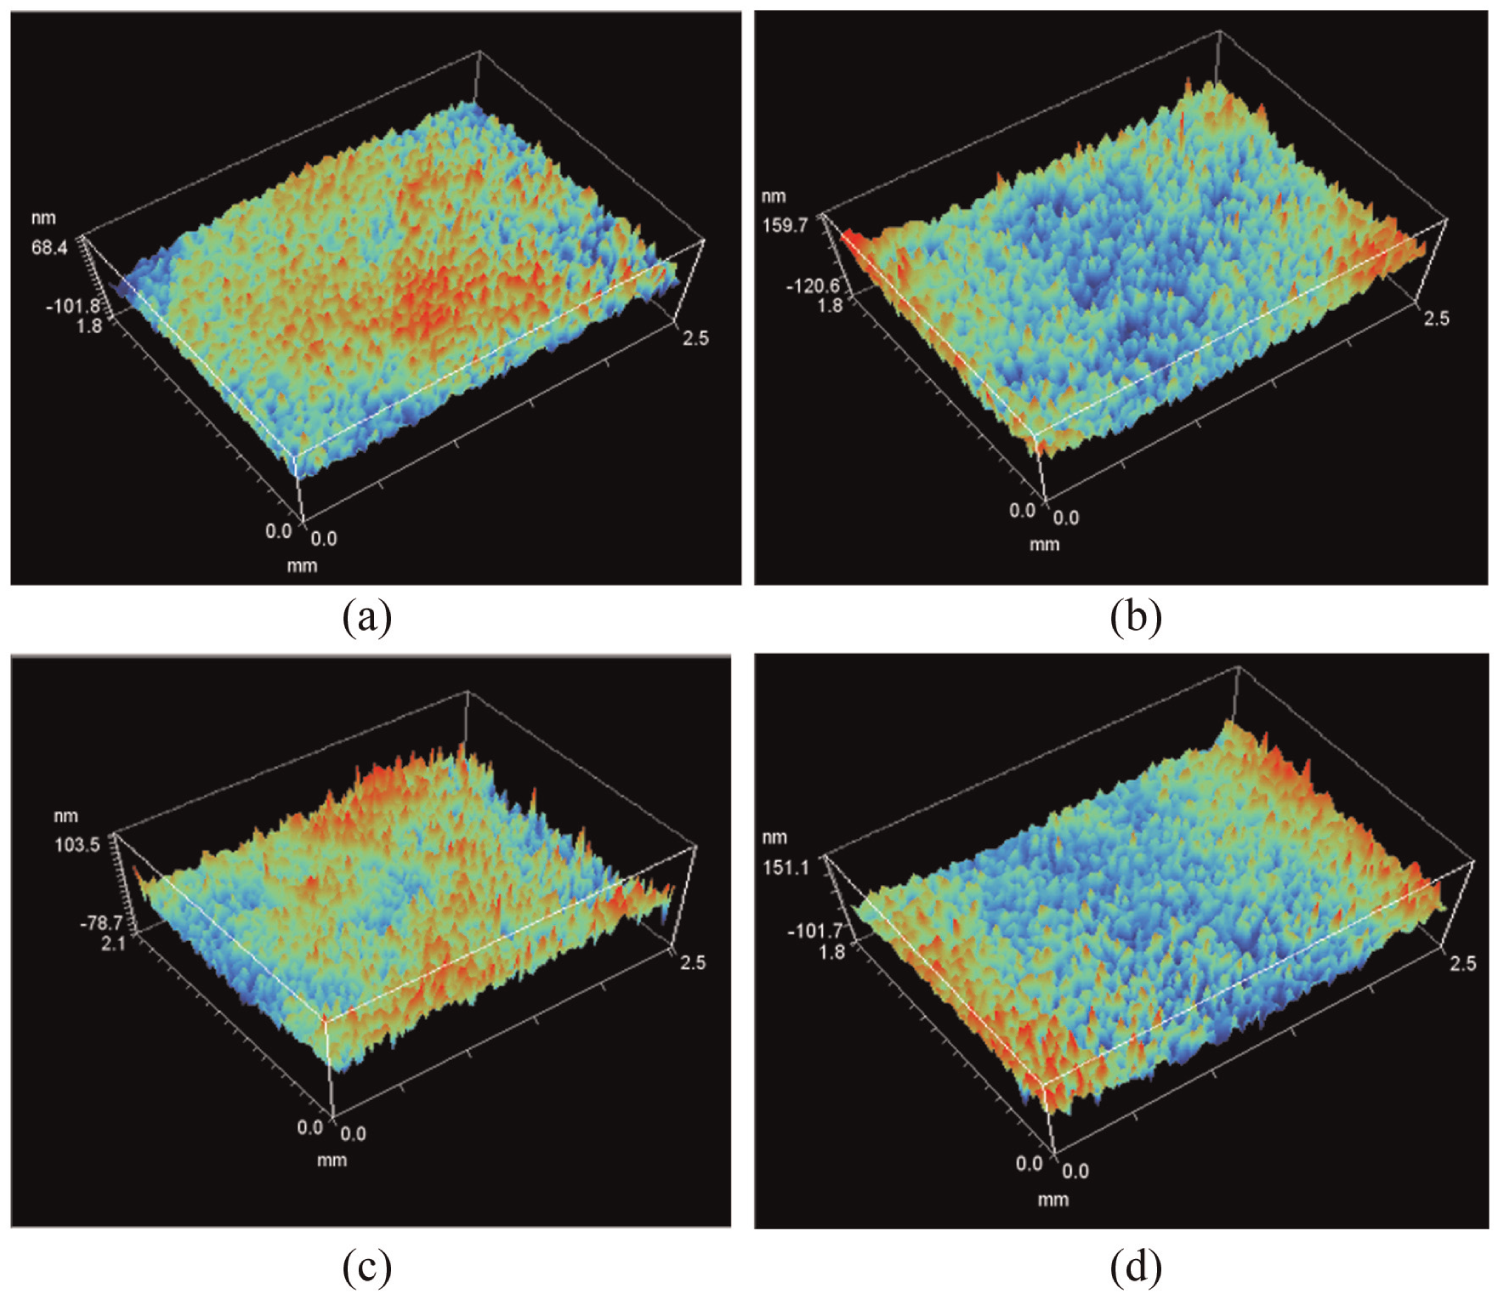
Measured surface topographies polished under Condition B-1: (a) before polishing, (b) cross-polishing (X), (c) horizontal polishing (H) and (d) vertical polishing (V).
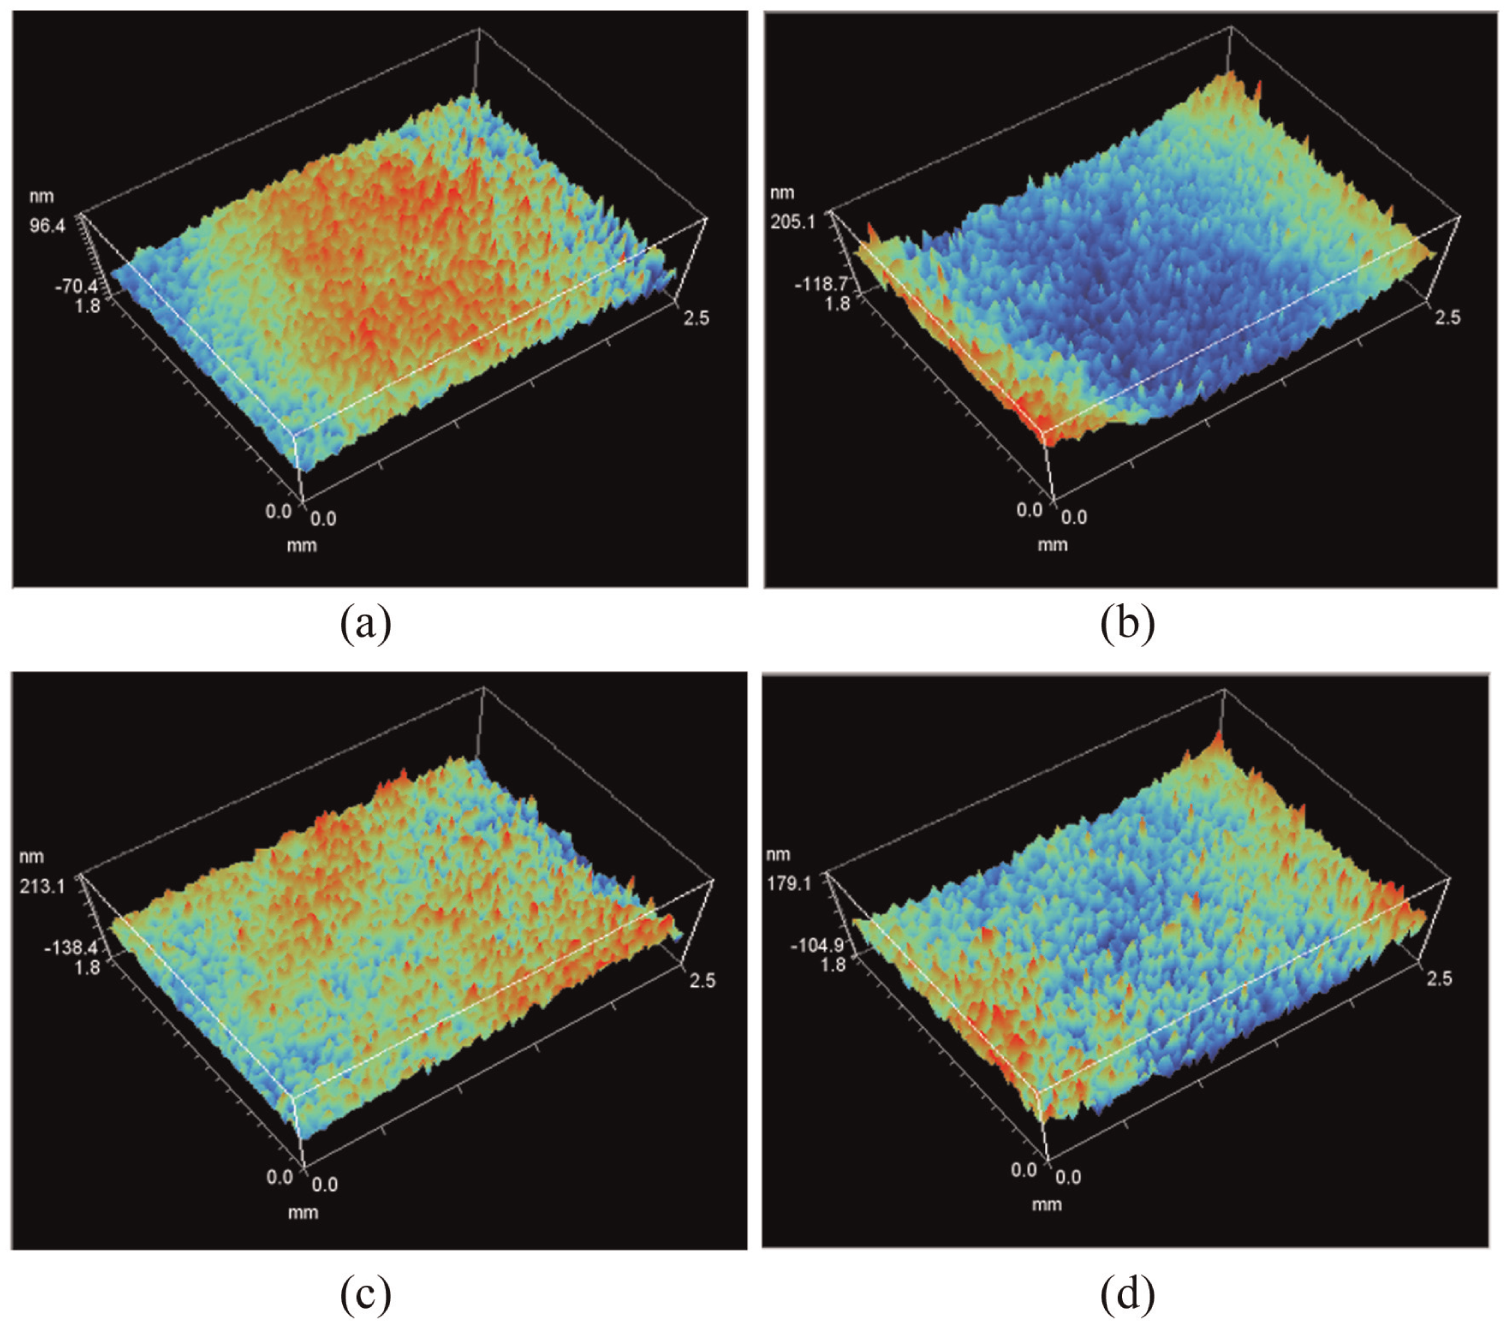
Measured surface topographies polished under Condition B-2: (a) before polishing, (b) cross-polishing (X), (c) horizontal polishing (H) and (d) vertical polishing (V).
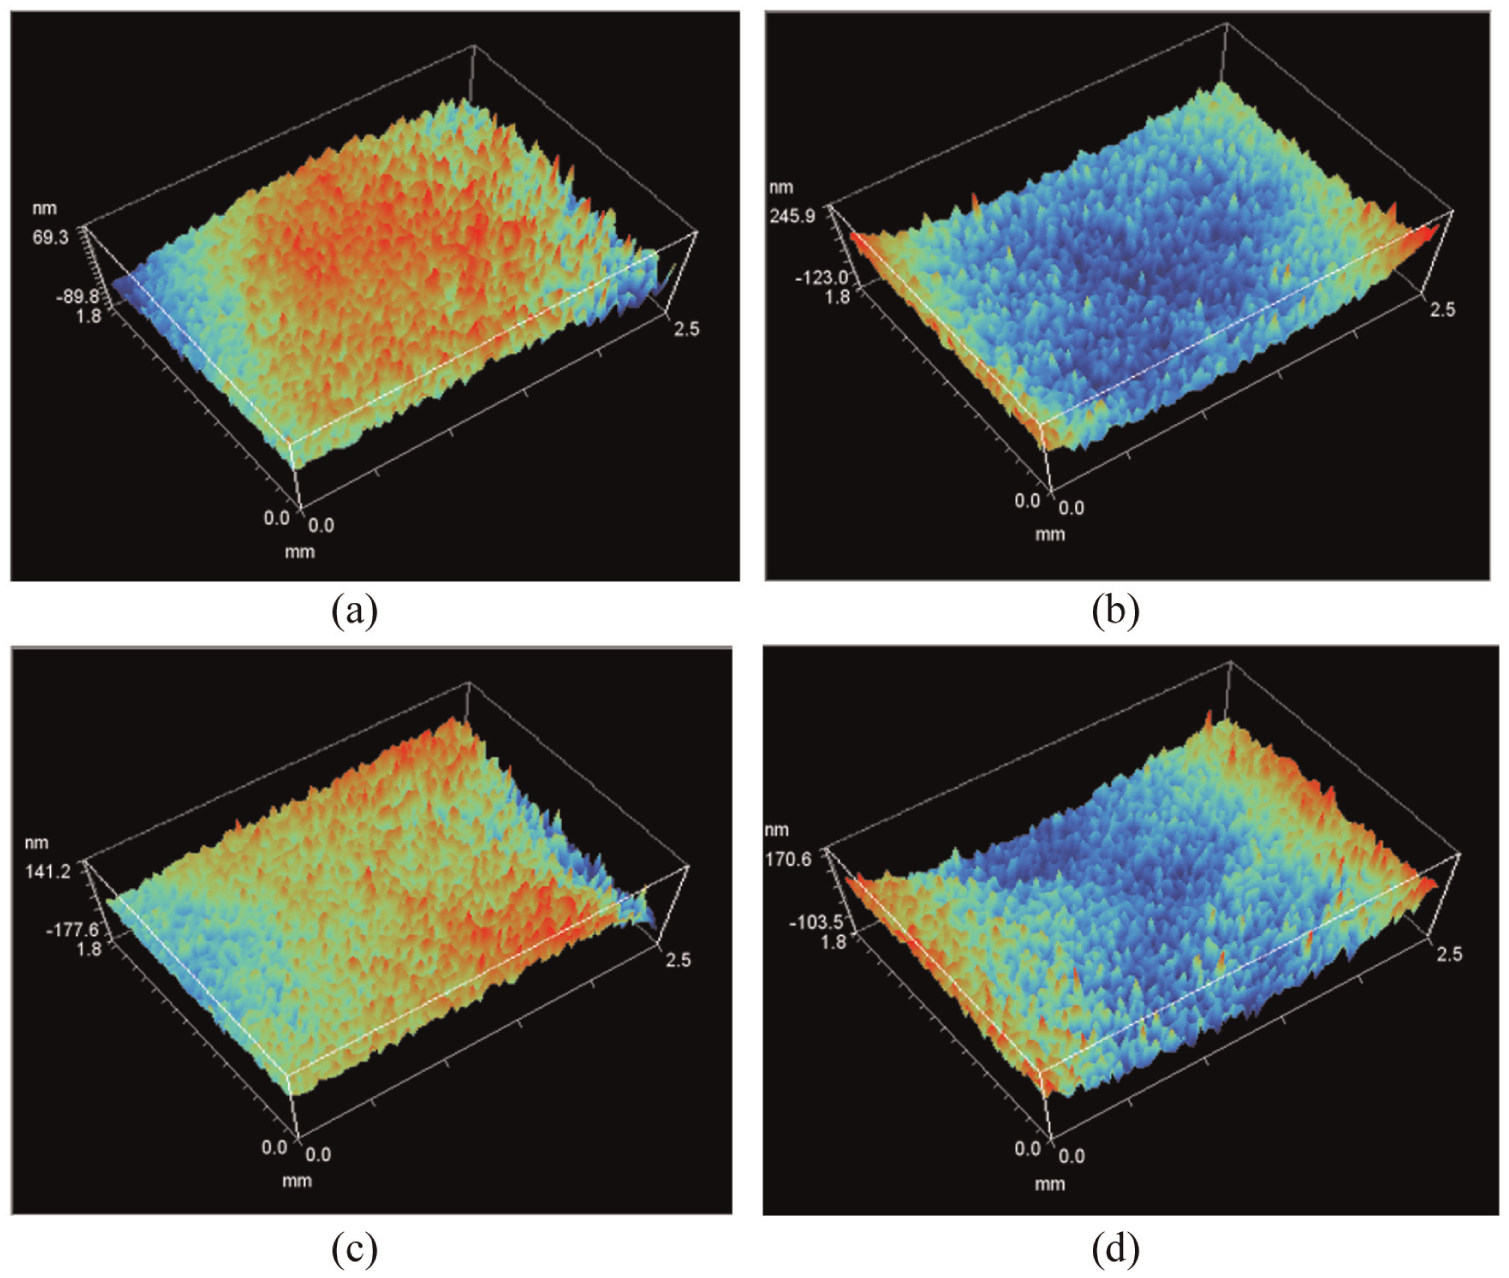
Measured surface topographies polished under Condition B-3: (a) before polishing, (b) cross-polishing (X), (c) horizontal polishing (H) and (d) vertical polishing (V).
Measured surface topographies polished under Condition B-4: (a) before polishing, (b) cross-polishing (X), (c) horizontal polishing (H) and (d) vertical polishing (V).
Measured surface topographies polished under Condition B-5: (a) before polishing, (b) cross-polishing (X), (c) horizontal polishing (H) and (d) vertical polishing (V).
Part C: experimental verification of the surface topography simulation model for 3D-structured surface generation by FJP
Relationship between MRR and dwell time
The amount of material removed from NiCu surface of different spots with various dwell time is tabulated in Table 12. As shown in Figure 21, the sample correlation coefficient is 0.996 with three decimal places which is close to 1. As a result, the relationship between the amount of material removal and the dwell time is considered to be linear. Figure 22 shows the MRR of the spots generated with different dwell time. All MRR has a good agreement with each of the others.
Material removal rate at different spots generated under different dwell time.
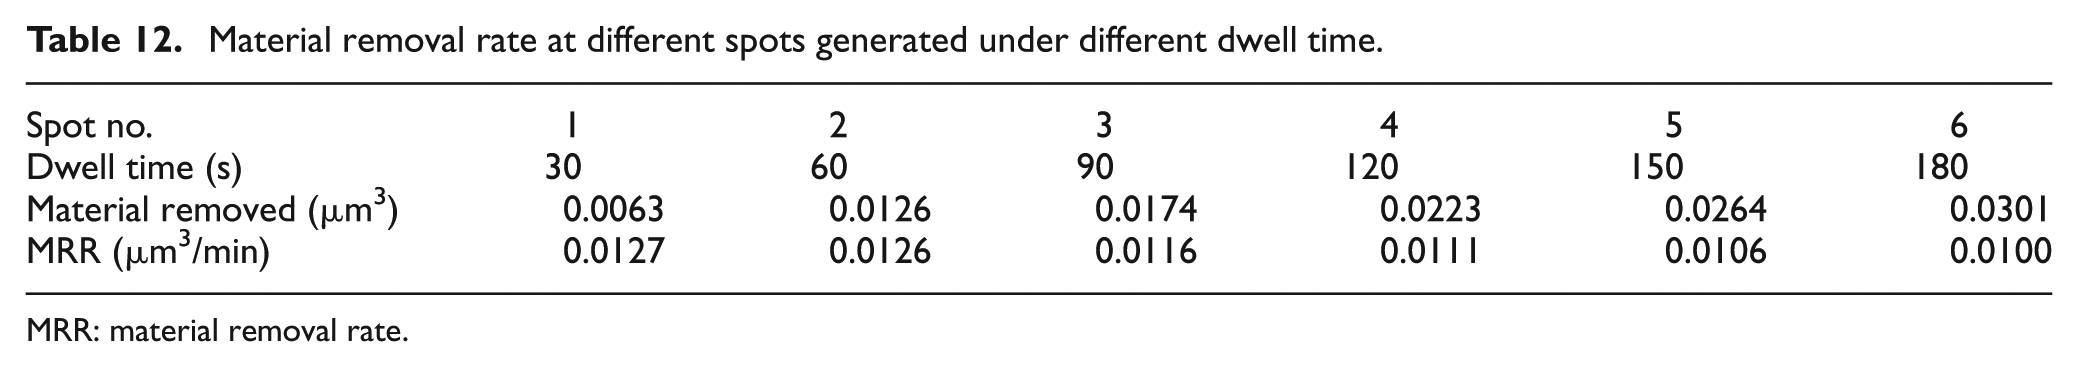
MRR: material removal rate.
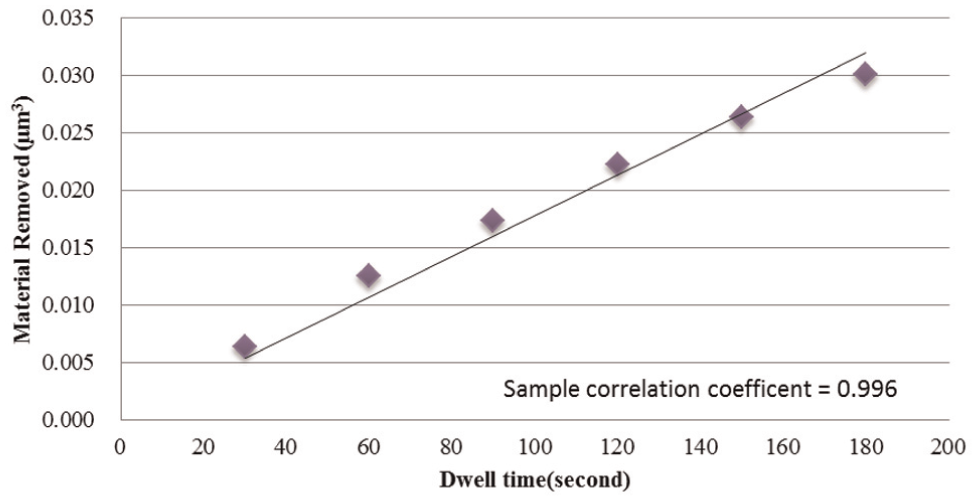
Relationship between the amount of material removal and dwell time of NiCu.
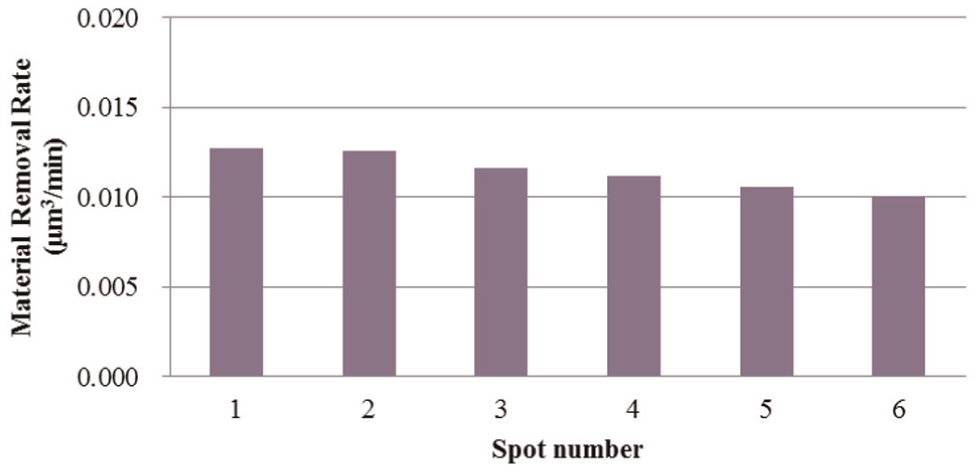
Material removal rate of different spots.
Experimental verification of the surface topography simulation model for 3D-structured generation by FJP
Figures 23 and 24 show the results of the influence function test for the ductile material of Nickel Copper (NiCu). Figure 23(a) shows the 3D topography of the TIF, while Figure 23(b) shows the cross-sectional profile in the Y–Z plane. The influence function indicates an M-shaped topography, which reveals that the major material removal is caused by shear cutting force during the expansion of the fluid jet when flushing on the workpiece surface. As shown in Figure 24(b), the cross-sectional profile of TIF Spot 2 exhibits a Gaussian shape in the Y–Z plane, which is different from that of Spot 1 polished with a perpendicular slurry jet beam. A brief conclusion can be drawn here that the shapes of the TIF of FJP polished at different angles are inconsistent.
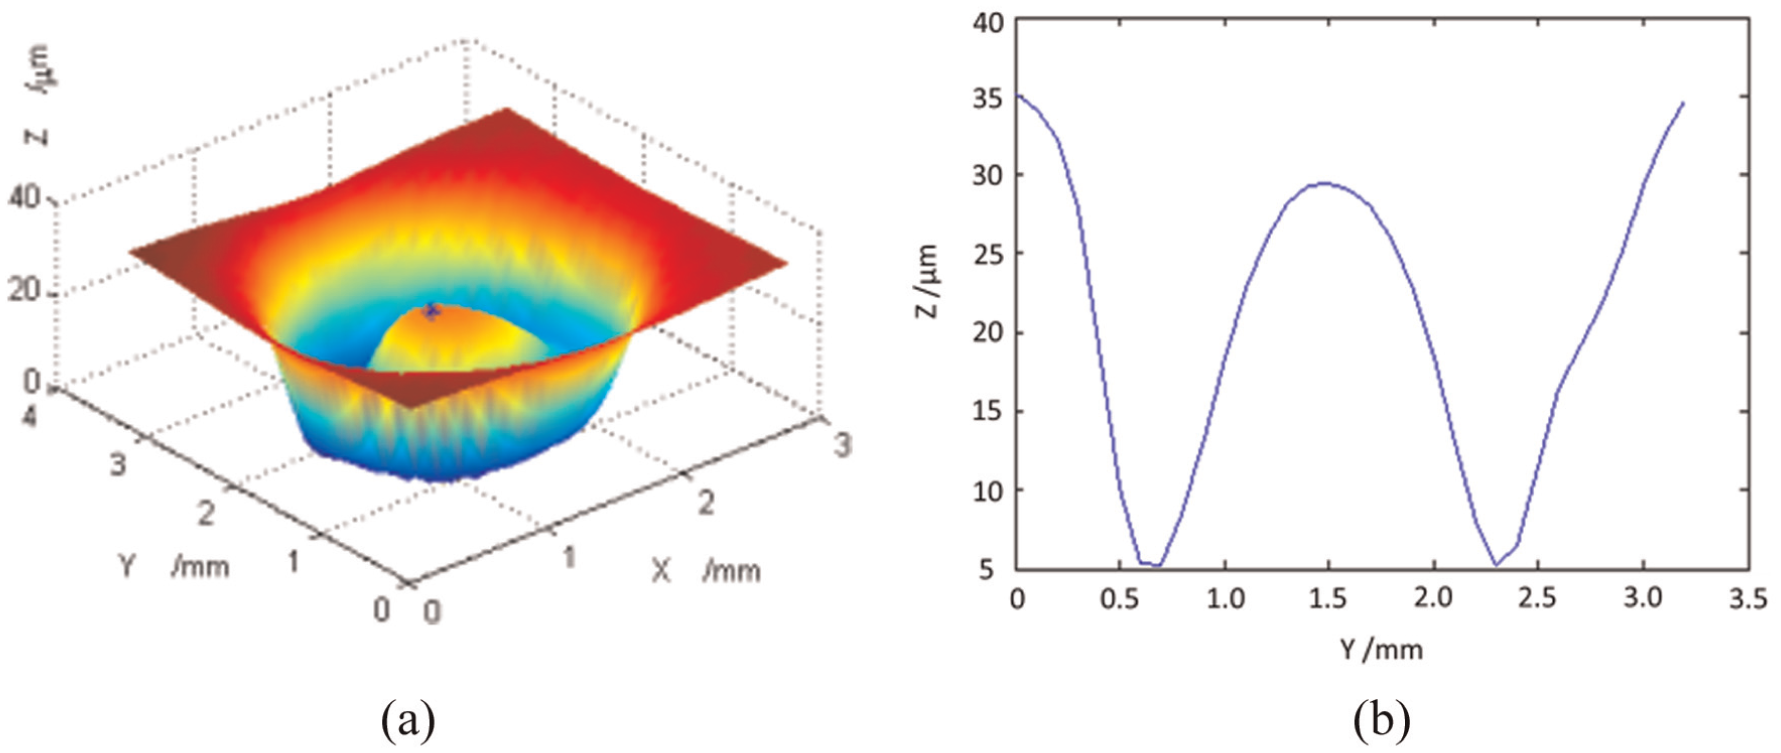
Influence function (IF) test for NiCu of Spot 1: (a) 3D IF and (b) Y–Z profile.
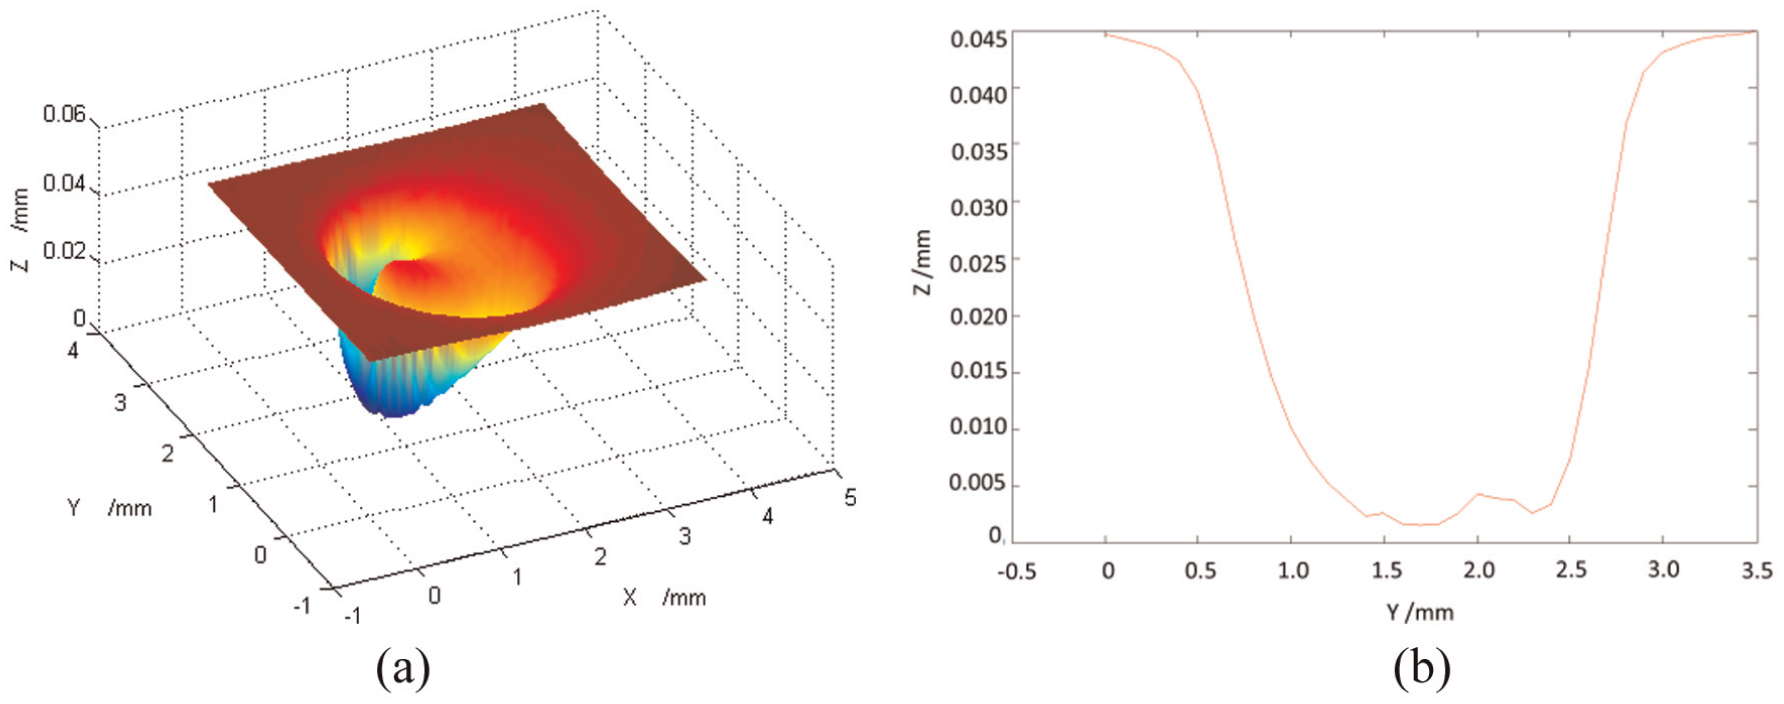
Influence function (IF) test for NiCu of Spot 2: (a) 3D IF and (b) Y–Z profile.
The existing theoretical and mathematical models can only approximately predict the MRR of a particular material, but not the shape of the TIF. Moreover, some of their models also relied on the experimental data due to the material factors. In Part C of the experiments, the focus is on 3D-structured surface simulation based on experimental TIF.
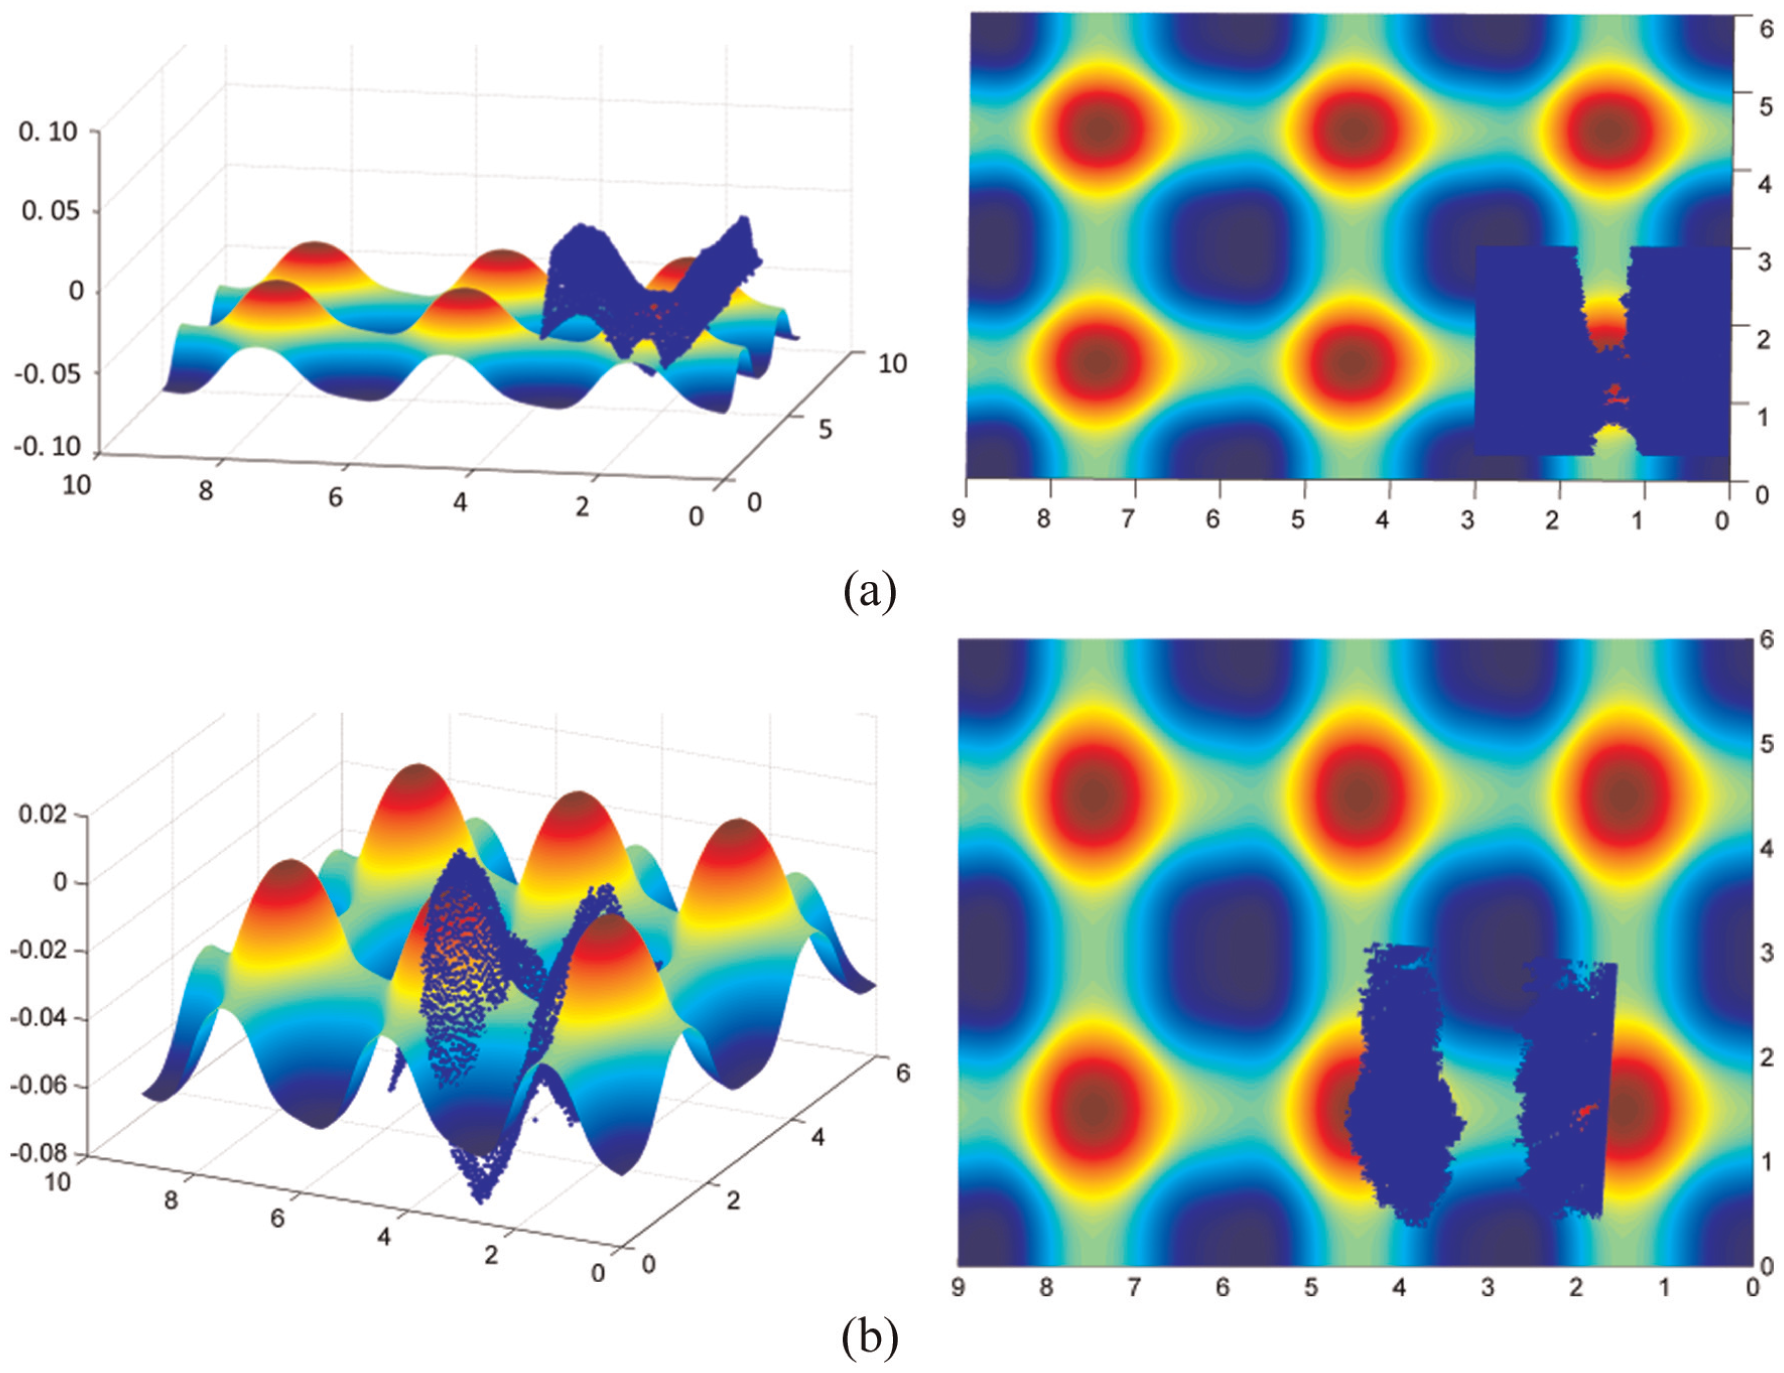
According to previous section, there is a linear relationship between the amount of material removal and the dwell time. Figures 25 and 26 show the measured and the simulated structured surfaces. The simulated surfaces are generated based on the experimental TIF, and hence equation (1)
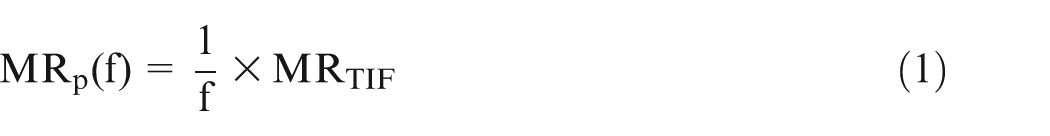
where f is the feed rate,
Comparison between the measured and simulated results of Sample C-1 for the structured surface generation: (a) measurement after first step, (b) measurement after second step, (c) simulation for first step and (d) simulation for second step.
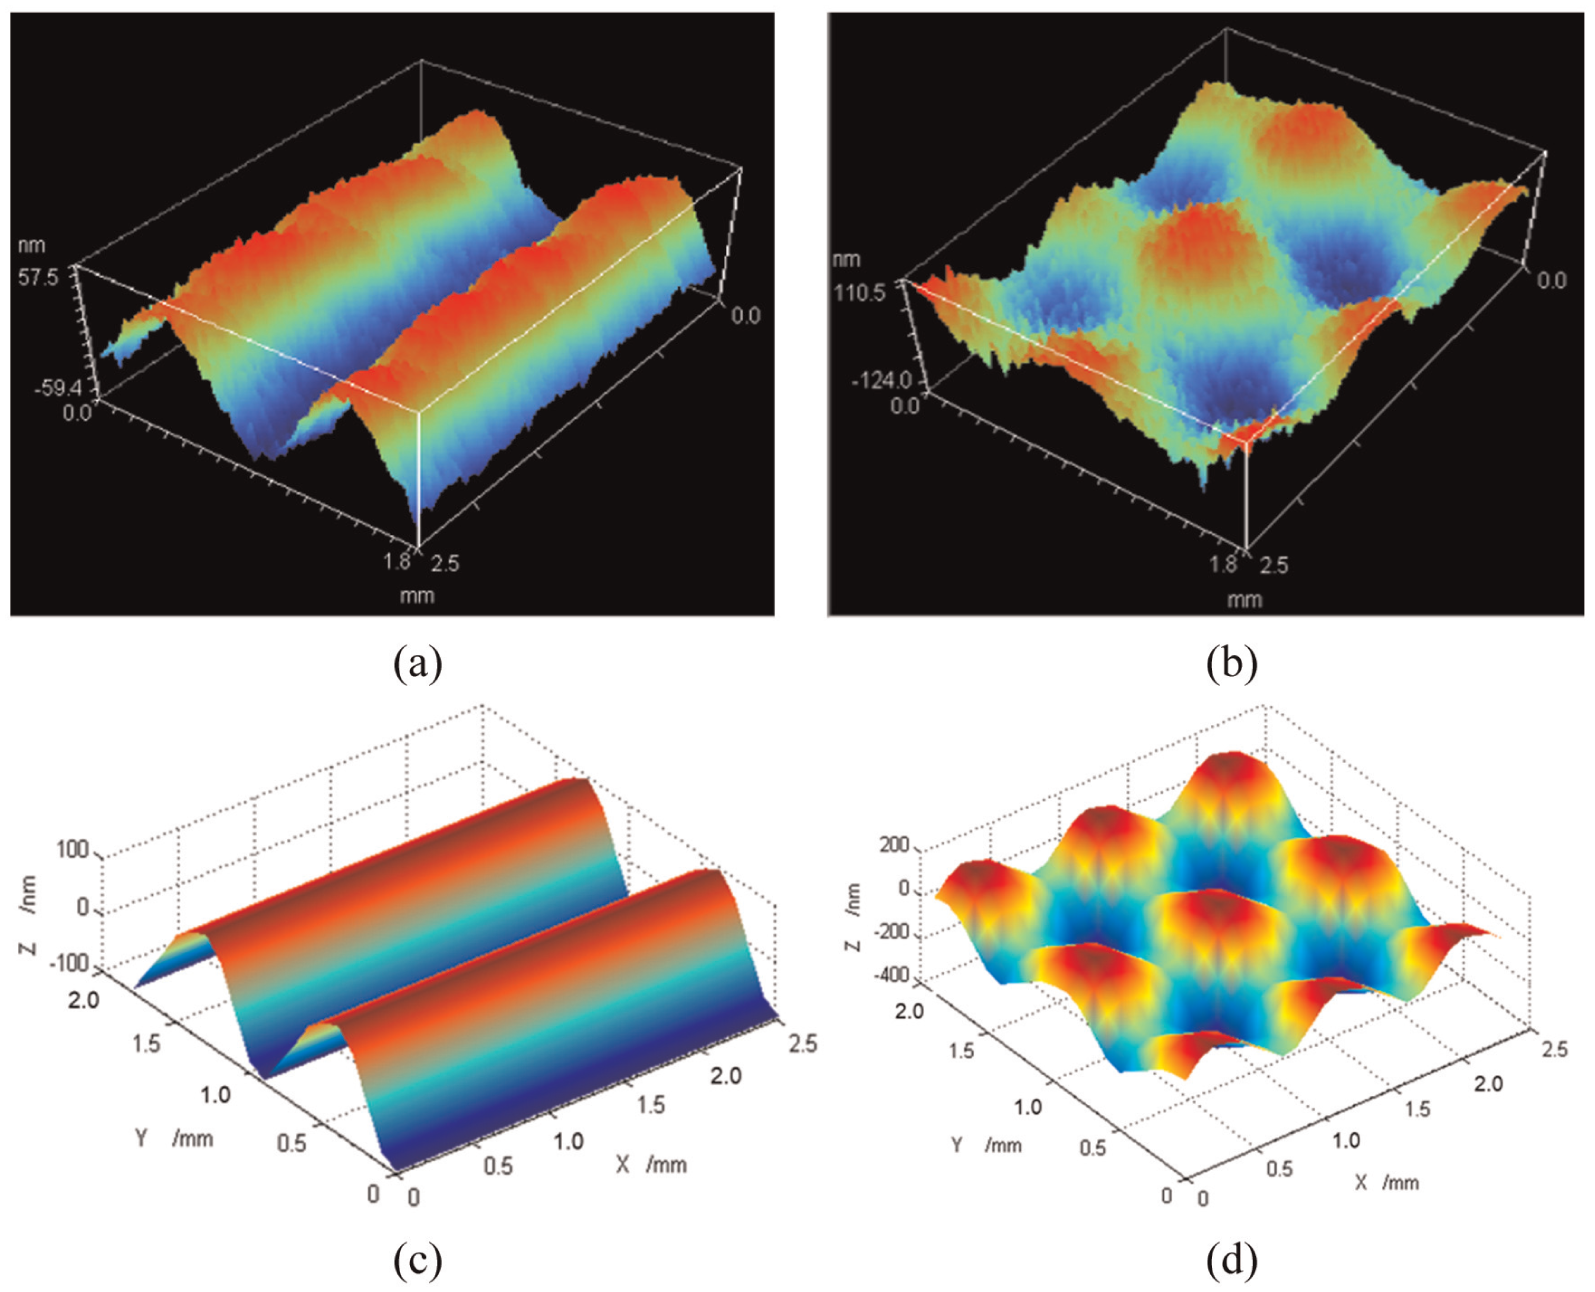
Comparison between the measured and simulated results of Sample C-2 for the structured surface generation: (a) measurement after first step, (b) measurement after second step, (c) simulation for first step and (d) simulation for the second step.
To further verify the accuracy of the surface topography simulation model, two evaluation methods were used. The first method makes use of an intrinsic surface feature (ISF)-based surface characterization system20,21 to give an overall assessment for the predicted surface and the measured surface, while the second method is based on the surface parameters named peak-to-valley height (

where
Evaluation by the ISF-based surface characterization system
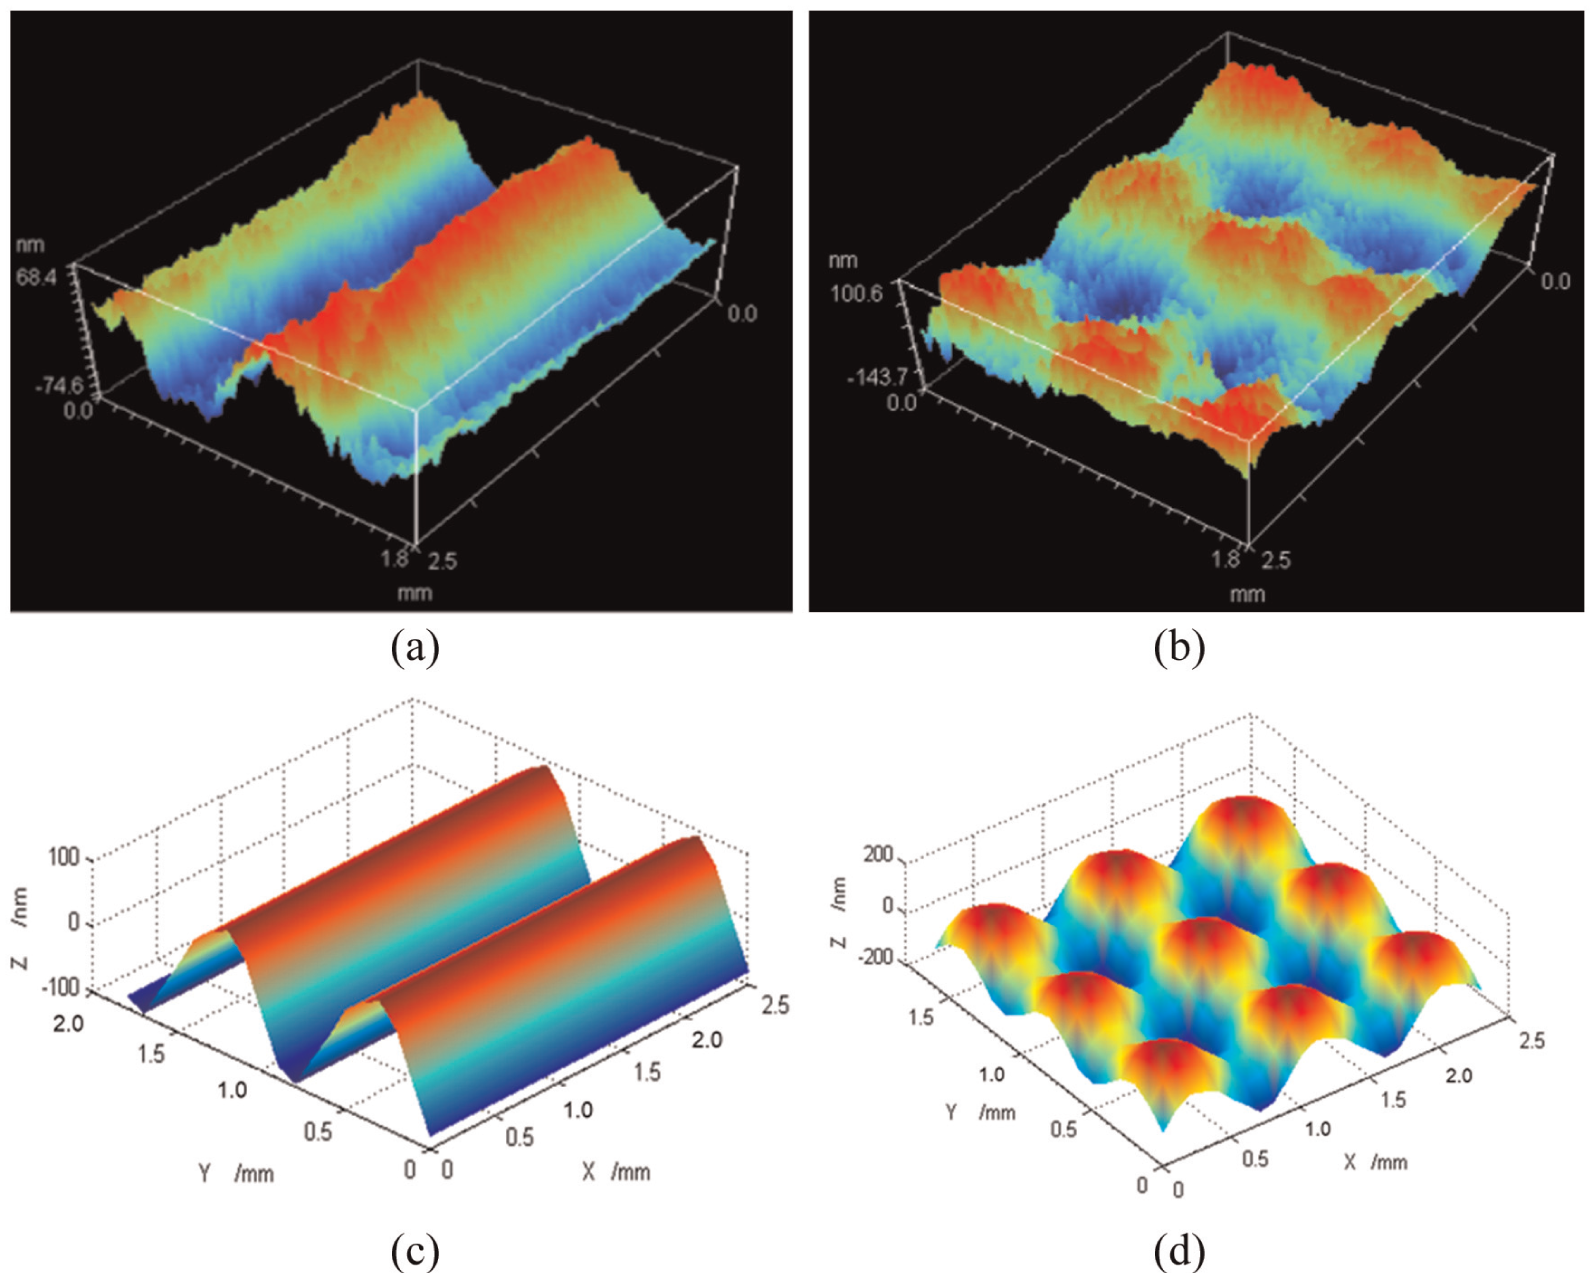
The ISF-based surface characterization system was developed based on the previous work by the research team of Partner State Key Laboratory of Ultra-precision Machining Technology of the Hong Kong Polytechnic University.20,21 The system’s capability in assessing the surface form accuracy by fitting a design or simulated surface and measured surface has been proven. Figure 27 shows the schematic diagram of the developed ISF-based surface characterization system. After the measurement of the samples, the measured data points are extracted, and they are used to calculate the intrinsic features of the measured surface. Surface matching between the measured surface and the predicted surface can be performed by registering the feature pattern of the measured surface on that of the predicted surface, so as to correct the misalignment of the coordinate system as shown in Figure 28. After that the determined coordinate transformation matrix is used to transform the original measured data to the correct position. Each measured point is projected to the predicted surface, and the deviation between the measured surface and the predicted surface can then be determined.
Schematic diagram of ISF-based surface characterization system. 20
Correction of the misalignment of the coordination system: (a) before surface matching and (b) after surface matching.
Surface parameters, peak-to-valley value of the deviation,

where
Root-mean-square
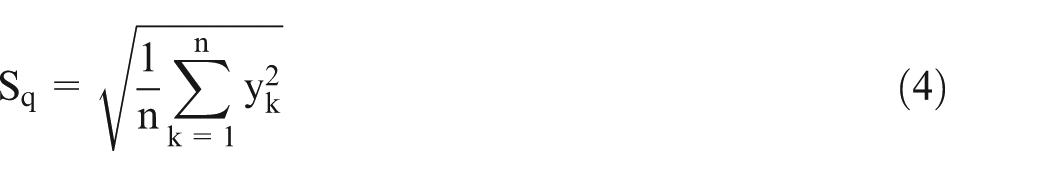
where
Before surface matching, the noise of the measurement results was filtered by Fourier filtering with a low cut-off of 25/mm. Figures 29 and 30 show the alignment of the surfaces and their deviations in the form of an error map. The
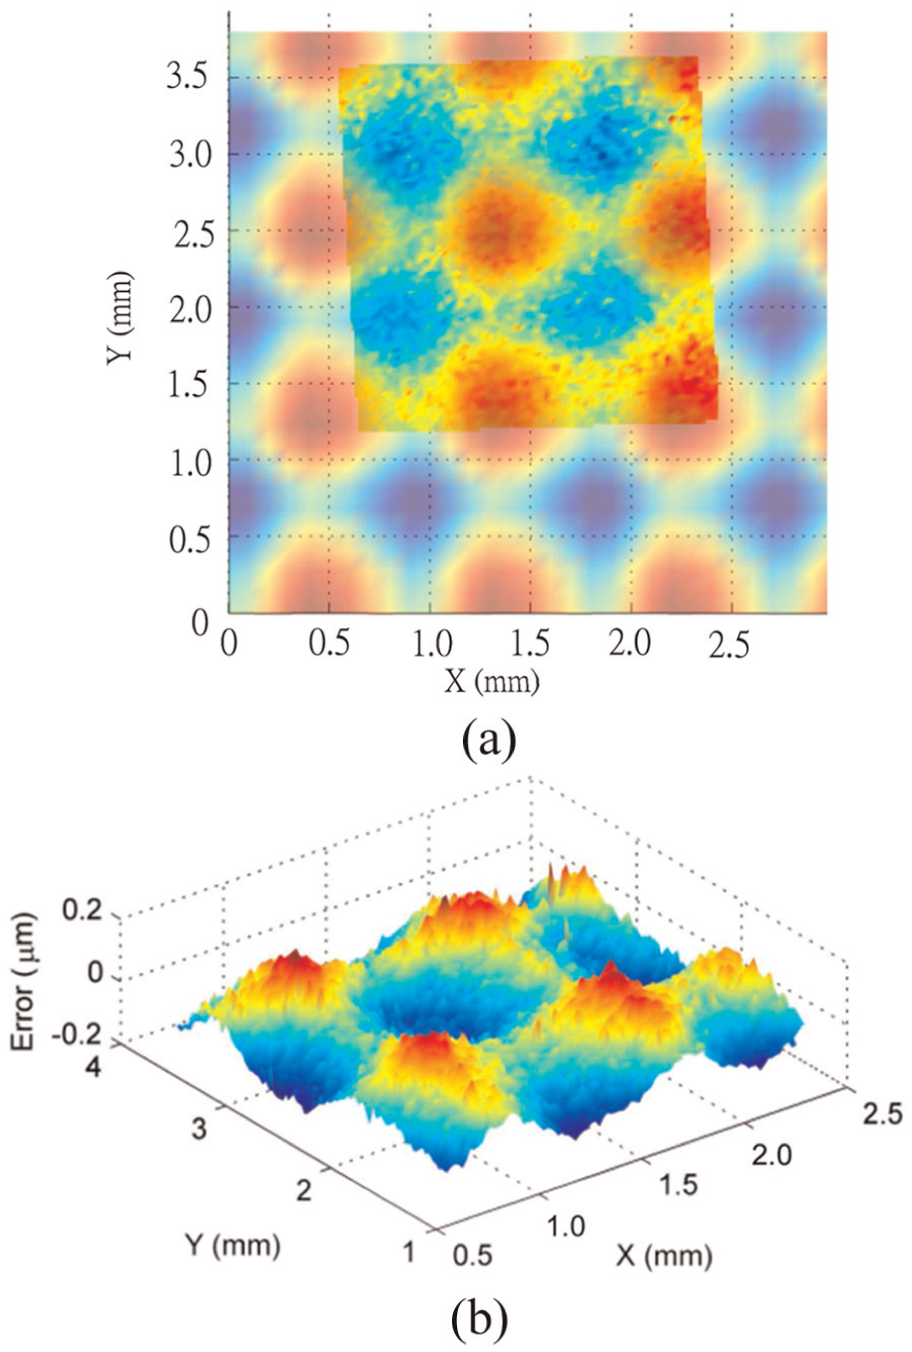
Surface matching of Sample C-1: (a) surface matching and (b) deviation between measured and predicted surfaces.
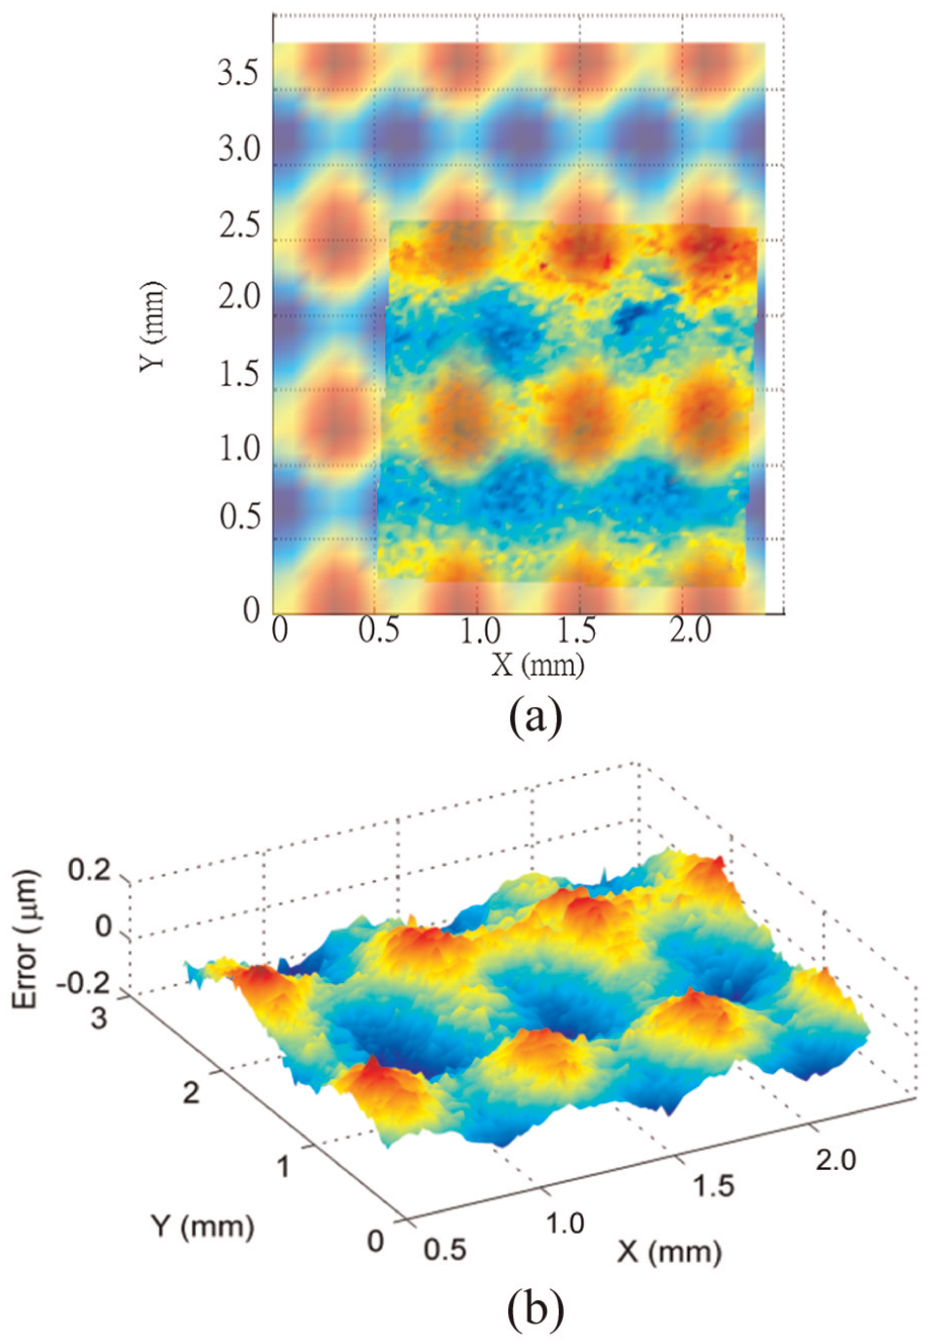
Surface matching of Sample C-2: (a) surface matching and (b) deviation between measured and predicted surfaces.
Evaluation by
value and pitch distance
The pitch, p, the pitch for horizontal polishing,
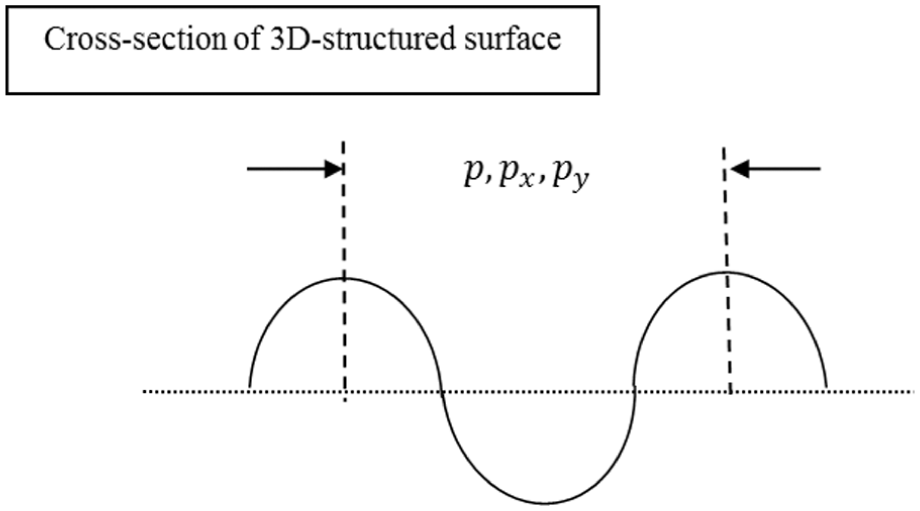
Measurement parameters used for experimental verification of the surface topography simulation model.
Five measurement data were taken from different areas of the sample surfaces for each of the measurement parameters. Their average values were used to compare with the model-predicted values. A parameter named deviation
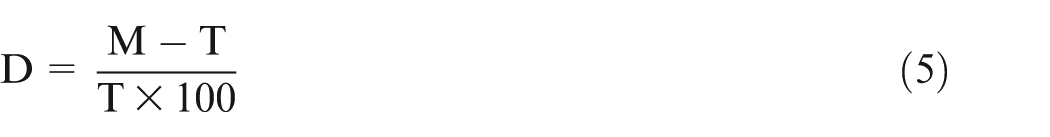
where
Table 13 shows the measured and predicted
Comparisons of measured and predicted values of polished surfaces.
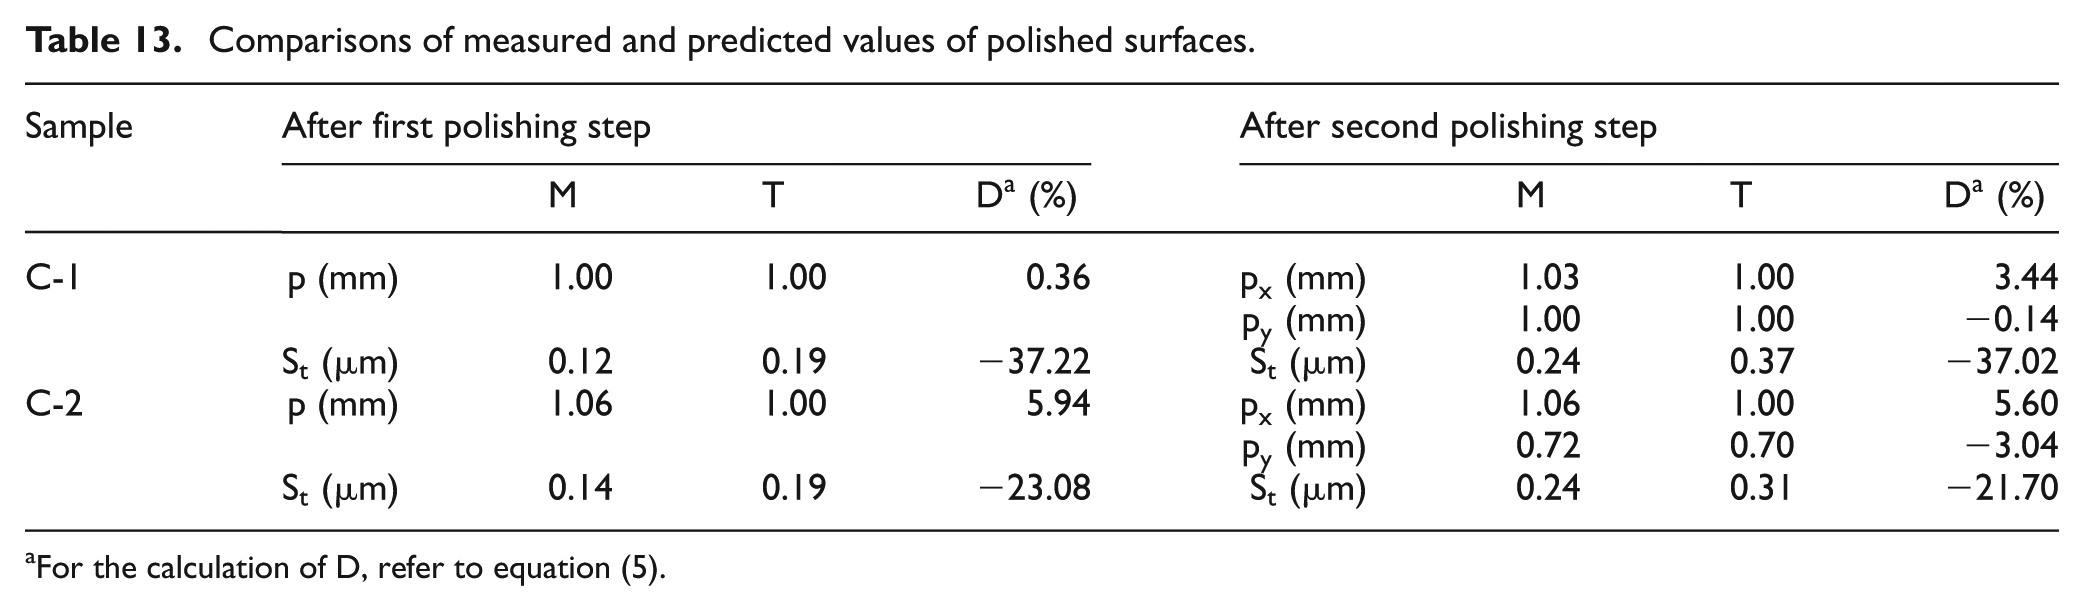
For the calculation of
Conclusion
This article presents a theoretical and experimental investigation for modelling, simulation and testing of 3D-structured surface generation using FJP. The surface generation of CCUP based on FJP has been studied. A surface topography simulation model has been built for the prediction of the 3D-structured surface generation by FJP. A series of experiments have been conducted to study the factors affecting the 3D-structured surface generation and the evaluation of the performance of the surface topography simulation model.
The results show that it is technically feasible to generate 3D-structured surfaces by FJP. The process for the generation of 3D-structured surfaces is significantly affected by the TIF. The experimental results are also found to agree well with that of the simulation results predicted by the surface topography simulation model.
Footnotes
Declaration of conflicting interests
The author(s) declared no potential conflicts of interest with respect to the research, authorship and/or publication of this article.
Funding
The author(s) disclosed receipt of the following financial support for the research, authorship, and/or publication of this article: This work was supported by a PhD studentship (project account code: RGYW) from the Hong Kong Polytechnic University. The work described in this paper was also partly supported by a grant from the Research Grants Council of the Government of the Hong Kong Special Administrative Region, China (Project No.: PolyU 5132/11E).