
Abstract
Reduction in the dimensional error of an assembly mostly focuses on the variation of fixtures and parts inside, in which the variation is mainly controlled by the methods relating to the fixture design and variation analysis. Recently, more researches concentrate on the dimensional analysis of the aluminum assembly where the distortion of rivet joints cannot be neglected, that is, the riveting-induced dimensional error. Hence, both the device design and the variation analysis for the riveting are drawing much attention to reduce the overall distortion. This article presents a dimensional reduction method, a rivet upsetting direction optimization based on a local-to-global dimensional calculation. The method is developed from a recent framework of assembly process optimization according to the discovered sensitivity between global dimensional error and rivet upsetting directions. A potential function that gathers the overall effect of every locating error is included. Simulations for three riveted assemblies are presented for comparison and results show that the method is efficient for the specific assignment of every rivet upsetting directions, and the effects of locating errors and rivet upsetting directions are highly coupled. The coupled effect yields the key questions in the improvement of this method. Detailed suggestions are then summarized.
Introduction
Reduction in the dimensional error of an automotive or aeronautical assembly mostly focuses on the variation of fixtures and parts inside, in which the variation is mainly controlled by the methods relating to the fixture design and variation analysis. Recently, more researches concentrate on the dimensional analysis of the aluminum assembly where the distortion of rivet joints cannot be neglected, that is, the riveting-induced dimensional error. Meanwhile, large antennas are aluminum sheet metals tightened by abundant solid rivets. The overall distortion denoted by the root mean square (RMS) of deformations of the key points on structural contour is required to be less than a value permitted. In the industrial practice of an antenna assembly, the variation of fixtures and parts inside is well dealt with by the RMS measurement using large-scale metrology1,2 and the adjustment of layout and heights of fixtures, but the riveting-induced distortion calls for an effective prediction beforehand. The reason is that the often occurred oversize RMS after the riveting shall induce loops of reassembling and RMS measurements or cause the structure dismissal.
To find a good prediction for the riveting-induced dimensional error, the authors take a series parallel assembly as the object and propose two numerical methods, respectively, for the accumulation of locating errors of fixtures and parts and the participation of every riveting distortion, that is, the three-dimensional (3D) precision calculation 3 and the local-to-global dimensional calculation. 4 Experimental result for the series parallel assembly validates the combined numerical precision of the two methods. 4 Then, the authors adopt the local-to-global dimensional calculation and propose a framework of assembly process optimization for reducing the dimensional error of the antenna assembly with abundant solid rivets. That investigation 5 reveals that the reduction in RMS prefers to solve the rivet upsetting directions (UDs) and the assembly sequence step by step because the RMS of such antenna structure is more sensitive to the change of rivet UDs.
The purpose of this article is to propose a special tool for dimensional reduction and to further reveal the performance of UD optimization under the variation of influence factors, such as the used artificial algorithms, the locating errors of fixtures and parts inside, the number of rivets, and the dimension of the assembly. Hence, this article first formulates the optimization of rivet UDs based on a new integration of the basic elements in the preceding two calculations. Then, the authors apply the rivet UD optimization with two artificial algorithms into three riveted assemblies with different dimensions or different locating errors.
The reminder of this article is organized into the following sections. The “Literature review” section shows the relation of the proposed method to the related work in dimensional engineering. The “Basic elements in preceding dimensional analyses” section summarizes the information for global assembly, the inherent strain data for local solid riveting, and the quantitation from locating error to RMS. The “Rivet UD optimization” section illustrates the unified formulation and the detailed framework. The “Case study” section incorporates two artificial algorithms and different groups of locating errors into the optimizations for three assemblies. The “Discussion” section reports the performance of UD optimization from the point of view of the used time and reduction effect of optimizations, and the distribution of rivet UDs. The “Conclusion” section draws the advantage, limitation, and the possible directions for future research.
Literature review
Over decades, fixture designs and variation analyses play crucial roles in controlling the dimensional error that is accumulated from the variations of part-to-part and part-to-fixture locating errors, and the part self-deformations. Cai6,7 keeps advancing the fixture design methods for compliant assemblies based on the variation analyses. For the fruits of variation analysis of the compliant assembly, finite-element analysis (FEA) and kinematic formulation, respectively, form two directions,8–11 in both of which the added statistical model accounts for geometric errors.12–14 For example, Liao and Wang 13 use the wavelet transform to identify the different scale components in geometric tolerance and combine it to FEA, and Huang and Kong 14 integrate the statistical method with kinematic formulations, which completes an initial step for a rigid-compliant hybrid assembly variation analysis. Using the FEA, the variation analyses yield the useful influence coefficient method and many recent advances in the dimensional control of automotive and aircraft structures.15,16 However, either the kinematic formulation or the influence coefficient method has difficulty in building the 3D precision calculation with rigid and compliant motions or gathering the detailed joint distortions. Hereby, the authors 3 combine a kinematic formulation with FEA, which forms a first version of 3D precision calculation that directly supports the participation of detailed joint distortions.
From the perspective of joint distortion, more researches gradually focus on the self-piercing riveting in automotive shells. Hu et al. 8 first use FEA to perform the variation analysis taking into account the simplest form of weld distortion in automotive constructions. Wang and Ceglarek 17 propose various joining and releasing schemes for the variation analysis in preliminary design of a compliant assembly. Besides the above simplified joints, more works concentrate on the detailed distortion in the joining process via FEA. Fan et al. 18 particularly demonstrate the detailed spot weld distortion by FEA. The growth of use of aluminum alloy in automotive constructions promotes the investigation of force or dimensional feature for the self-piercing riveting.19,20 Masters et al. 21 propose a local/global approach that projects the distortions yielded from the local FEA of self-piercing riveting into the global FEA of the assembly.
Many dimensional analyses are also performed for aircraft structures, for example, the deformation or dimensional variation in the wing box without the joint effect,22,23 the dimensional simulation for local solid riveting in aircraft aluminum parts,24,25 and the identification of variation sources in the horizontal stabilizer of an aircraft.26,27 Globally, these researches are mainly driven by the use of FEA. Combined with FEA, a riveting equivalent unit quantifies the overall structural deformation induced by the riveting sequence in the horizontal stabilizer mentioned, and this method can help identify the optimal riveting sequence of four edges by sampling. 28 To reduce the dimensional growth in aircraft panels, Abdelal et al. 29 investigate the static FEA, nonlinear explicit FEA, and alternative solid riveting devices, which finds that the dimensional growth can be controlled by changing the design of riveting dies, and point out that the study for the effect of hundreds of rivets on aircraft panels requires developing more accurate static FEAs.
The above FEA-driven methods cannot be the accurate static FEAs for the sequence simulation of a large number of rivet joints or the further process planning. In light of the local/global mode, the authors 4 propose a local-to-global method that gathers every solid riveting distortions and the riveting sequence effect into the overall dimensional error by the iterative static FEAs using a local dynamic FEA result and the possible former static FEA result in iteration. Based on this local-to-global method, the authors 5 propose an assembly process optimization method for reducing the dimensional error of the radar assembly with abundant solid rivets.
Basic elements in preceding dimensional analyses
Information for the global assembly
An assembly is constructed based on an initial platform, starting from which fixtures are located and then put the parts one by one. After locating and clamping the parts, solid riveting process is a choice for linking and tightening them.
Because of using a static FEA model for the global assembly, parts and fixtures are all represented by finite elements. Thus, nodal components are created to denote the objects in the assembly, that is, nodal component for each part or fixture (P_CMP) and the nodal component for each rivet hole through the parts (H_CMP). Particularly, key points, the deformations of which yield the RMS, are also recorded in a nodal component.
To demonstrate the locating errors at each mating surface between part and part, or part and fixture, three feature points are selected from the FEA model for each mating surface. The dimensional deviations of the feature points are the locating errors. Process parameters of the assembly include the UDs and local clamp positions (CPs) of every H_CMPs and the inherent assembly sequences of P_CMPs according to the series parallel logic in the assembly.
Besides the above objects and process parameters, the assembly information file also counts the objects and parameters, that is, P_CMP number, H_CMP number, number of the nodes in each P_CMP or H_CMP, number of key points, number of feature points, and the number of the inherent assembly sequences and parallels.
For example, Figure 1 demonstrates the information for a typical series parallel assembly, that is, parallel 1 that formed by sequence 1 (A, C, E) and sequence 2 (B, D, F) and terminates at G as shown in Figure 1(a), P_CMP 1-7 in Figure 1(c), H_CMP 1-16, UD 1-16, and CP 1-16, one group of which is shown in Figure 1(d), and feature points and key points in Figure 1(b) and (c).
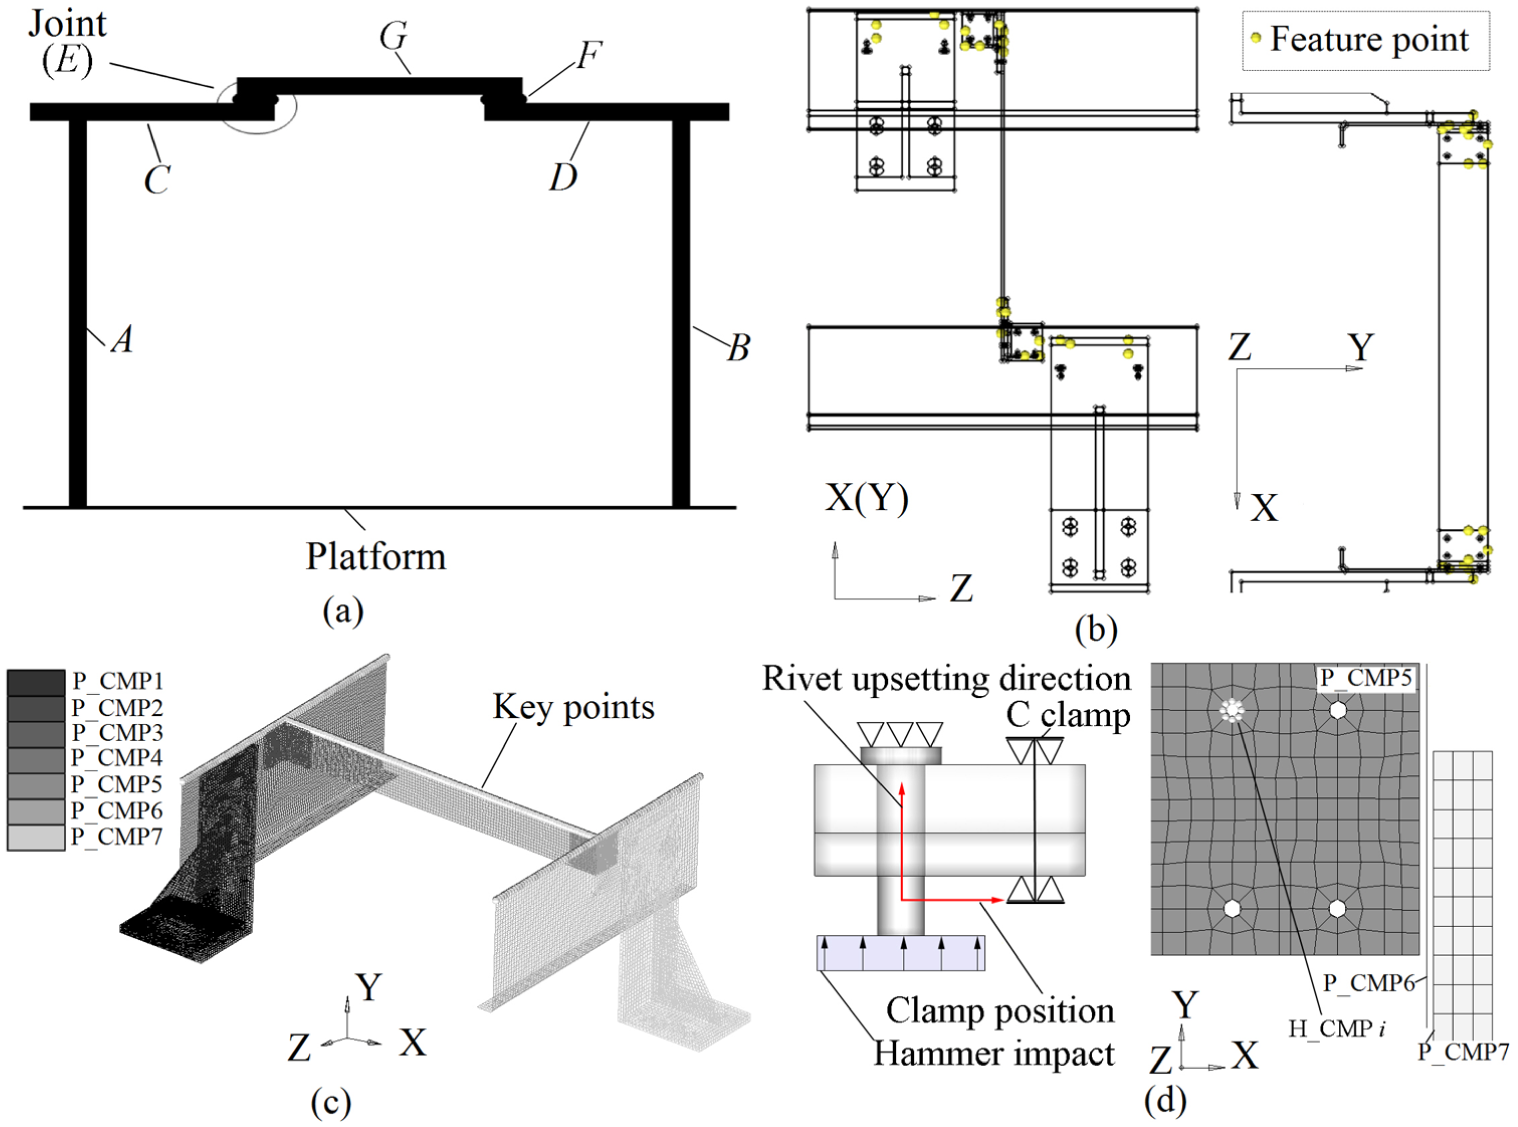
Illustration for the information of riveted assembly: (a) assembly logic of the parts, (b) CAD model with feature points at the mating surface, (c) nodal components in finite elements for parts and fixtures, and (d) rivet upsetting direction and clamp position for a rivet hole through the parts and the related nodal component.
Inherent strain data for the local solid riveting
The parts are linked and tightened by similar rivets using the same device. The local joint mainly shares a common dimension. Thus, the local solid riveting process targets to a dynamic FEA model that determines a fixed inherent strain data around the part holes. Using the inherent strain data shall bring the local riveting distortion to the others.
To get the inherent strain data, the following points are required to establish the dynamic FEA model:
The local connection dimension,
Material property (including elastic modulus, Poisson ratio, density, yield strength, tangent modulus, and the function from strain rate and strain to yield stress),
Rivet UD and local CP,
The hammer time-to-displacement impact.
The dynamic FEA outputs the deformations for the nodes around the part holes. Appending with the nodal coordinates, the deformations form the inherent strain data for the local solid riveting. With the help of rivet UD and CP in the dynamic FEA, the attitude of the data nodes is determined and the nodal deformations can be interpolated to the nodes on the other part holes in the other FEA models.
Quantitation from locating errors into RMS
The locating errors or called gaps at one mating surface can be expressed by the coordinate deviations of the related three feature points. Once the ideal position of a feature point is got, the deviation can be computed by the measured data in an experiment or directly assumed.
Given the vectors for the feature point positions (
Calculate the position and deviation for a reference point that is at the axis of a transient screw motion that causes δ
Spread the deviation of the reference point to the nodes in related P_CMPs that are behind the mating surface according to the series parallel logic, that is, the last assembled parts are behind the first one by the initial assembly platform or mating surface, which yields the series parallel relation of fixtures and parts.
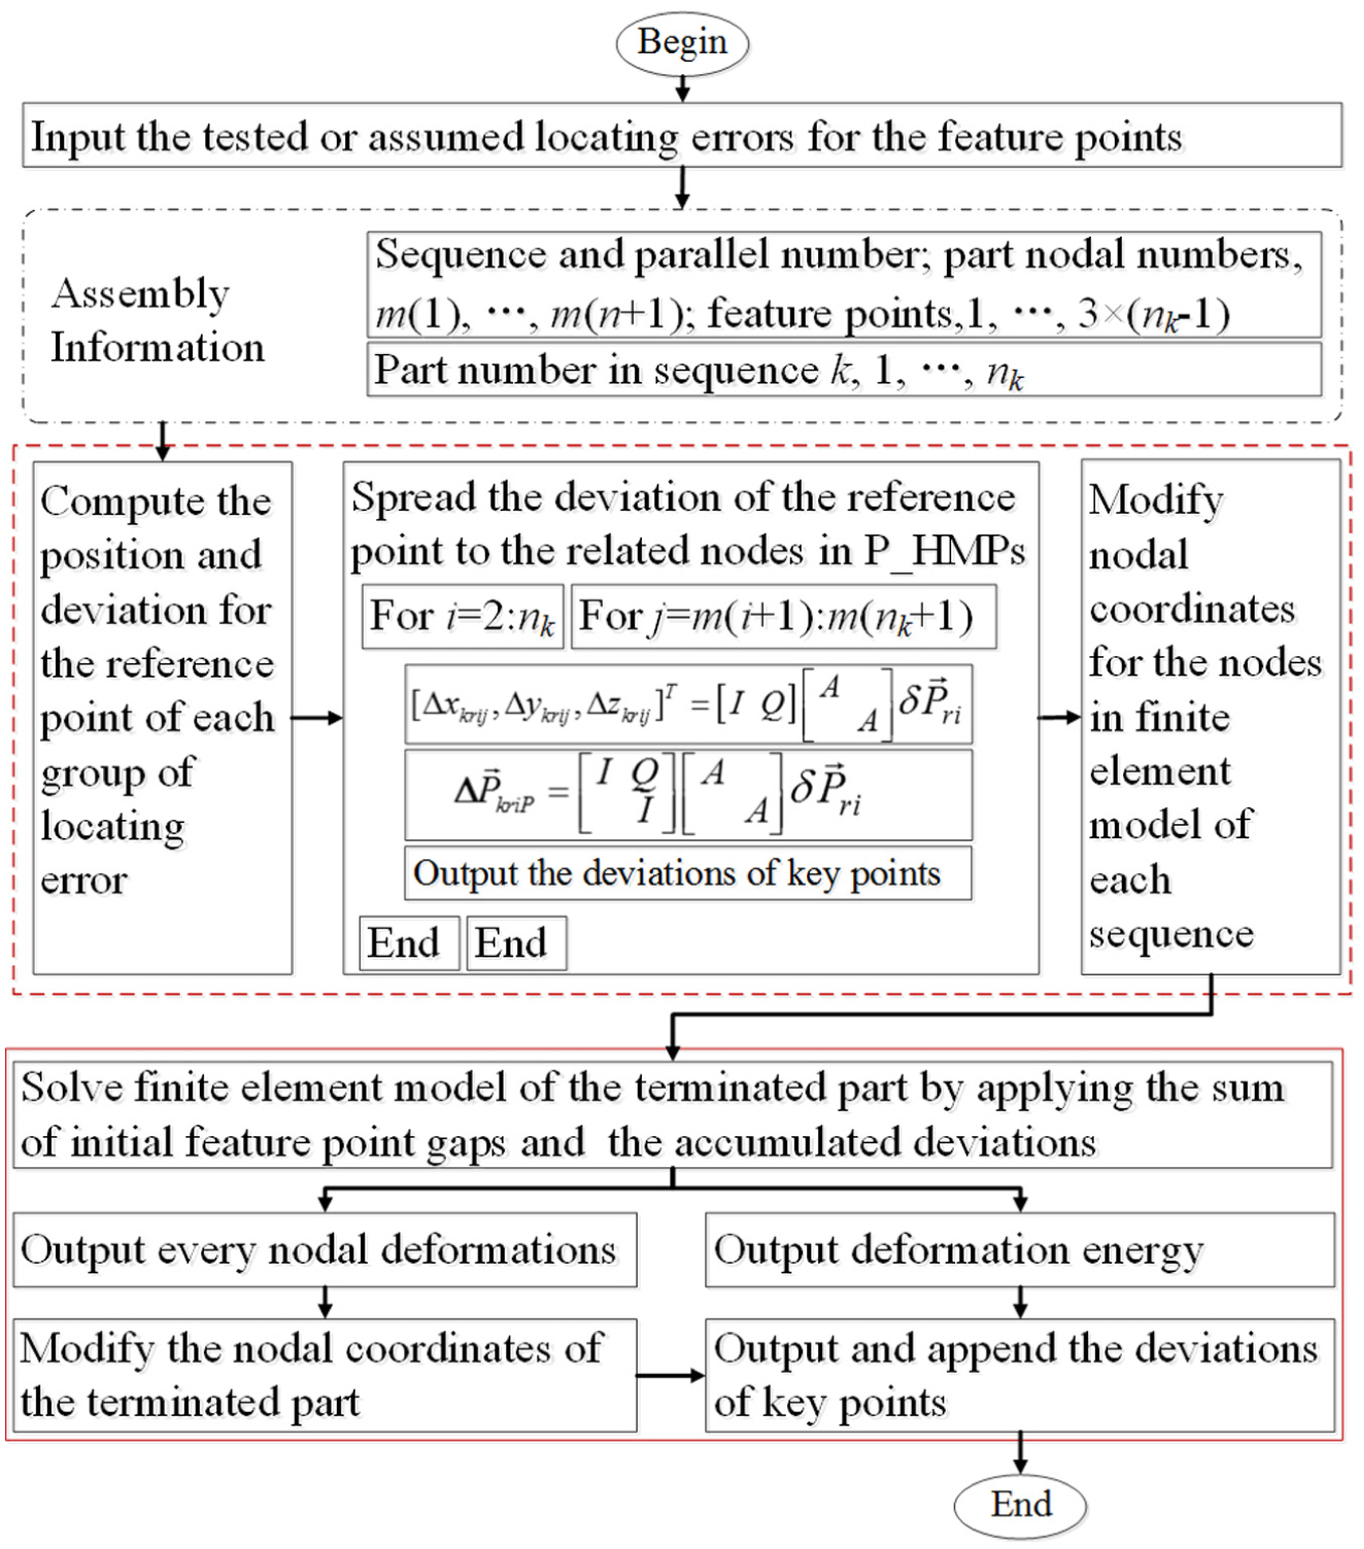
Method for three-dimensional precision calculation.
For the terminated part in parallel mode, two more groups of gaps will induce the part deformation. The solution of the gap-induced deformation also requires two steps that are illustrated by the bottom block of Figure 2 and listed below:
Given the refreshed gaps to feature point nodes of the terminated part, the solution of the static FEA for this part outputs the gap-induced deformations and the related deformation energy denoted by the reacting forces to the feature points.
Use the gap-induced deformations to modify the nodal coordinates of this terminated part and release the deformation energy to the entire series parallel parts and fixtures by a static FEA for the parallel assembly.
According to the series parallel logic of the parts and fixtures, and by defining the gravitational acceleration (9.8 m/s2), the integration of the above four steps can output the key-point deviations that are induced by locating errors and gravity. Note that an assembly with two more parallel structures still requires figuring out more rules for the code integration.
Rivet UD optimization
The combination of 3D precision calculation 3 and local-to-global dimensional calculation 4 can compute the RMS induced by the locating errors, part self-deformations, and solid riveting distortions for the series parallel assembly. Especially, the local-to-global framework supports the detailed process optimization for more complex riveted assemblies. 5
Let the dimensional error be z that denotes the deviations of key points selected from the concerned position of an assembly. Let x
1, x
2, …, xn
be the rivet UDs where n is the total number of rivets. Let
Given a discrete numeric space Ω that represents the possible value of rivet UD, and given a continuous vector space Φ that records the possible 3D deviations for the locating errors, the typical expression of optimization problems can formulate the rivet UD optimization by a specified optimizer, expressed by formulation (1)
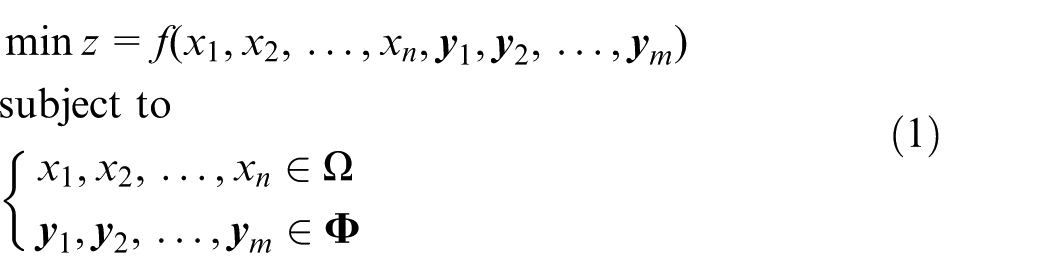
Framework for formulation (1) includes three new features, that is, removing the effect of assembly sequence from the local-to-global dimensional calculation, incorporating different artificial algorithms to the optimizer, and taking into account the accumulated effect of locating errors for the series parallel assembly. Globally, Figure 3 demonstrates the method for rivet UD optimization.
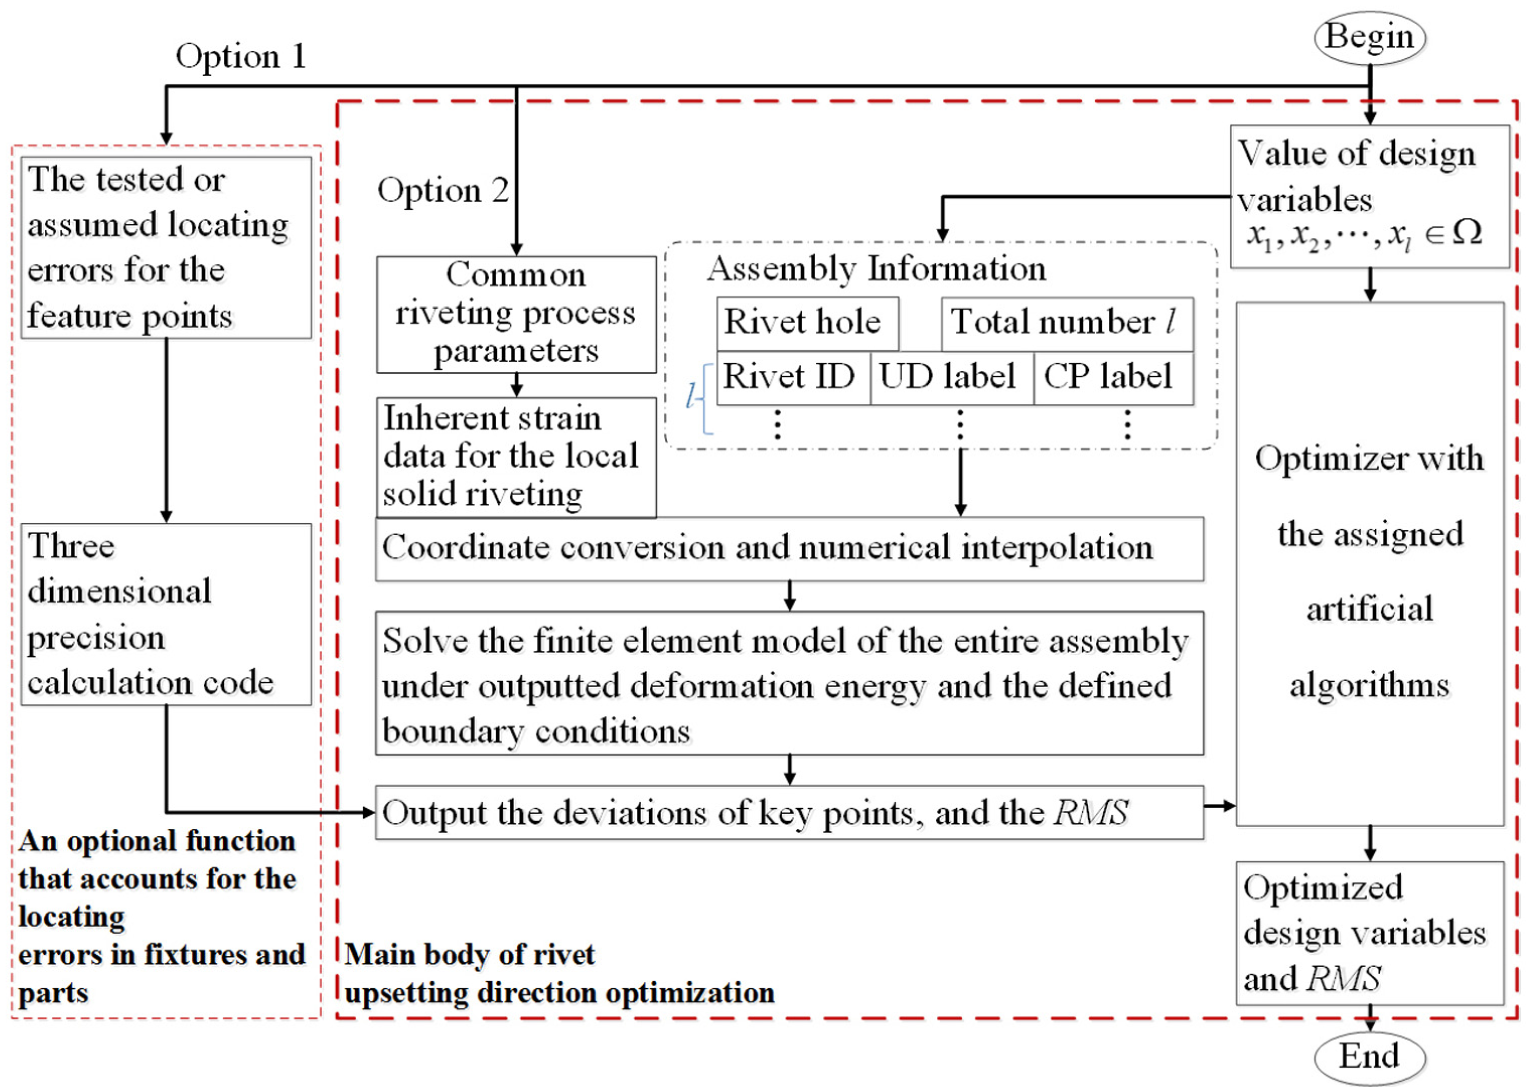
Framework for the rivet upsetting direction optimization.
The bold dashed block in Figure 3 is main optimization process that comprises generating value for rivet UDs, defining the artificial algorithm for optimization, and getting the value for target variable that relates to rivet UDs. The value for rivet UD modifies “the defined boundary condition” by interpolation, that is, interpolating the inherent strain data for the local solid riveting into the nodes of every H_CMPs. Then, the solution of static FEA for the entire assembly outputs the deviations of key points that yield the RMS. And the RMS supports the decision making of optimizer.
Note that there are two optional functions in rivet UD optimization: one is getting the inherent strain data from the dynamic FEA based on the common riveting parameters in the assembly information and the other is involving the locating errors. The purpose of the first one is supporting the interpolation. In this article, the aforementioned inherent strain data 4 can also be used. The involvement of the locating errors is for the investigation under full error sources.
Case study
Optimizations for the series parallel assembly and two complex assemblies are used to reveal the performance of rivet UD optimization under the change of locating errors, the structural dimensions, and artificial algorithms. The optimization time, the RMS reduction reached, and the solved rivet UDs are the main indexes in this investigation.
Information for the riveted assemblies
The series parallel assembly in Figure 4(a) comprises 2 fixtures, 3 parts, 2 joints, and 16 rivets. The dimension is 465 mm × 400 mm × 257 mm. The fixtures use steel alloy. Participation of locating errors involves the feature points and the numbering of nodes of parts and fixtures. The input of locating errors takes two groups of mating gaps which are got from the experiments for the series parallel assembly with C-clamps.3,4 Table 1 lists the coordinates and the two groups of mating gaps for feature points.
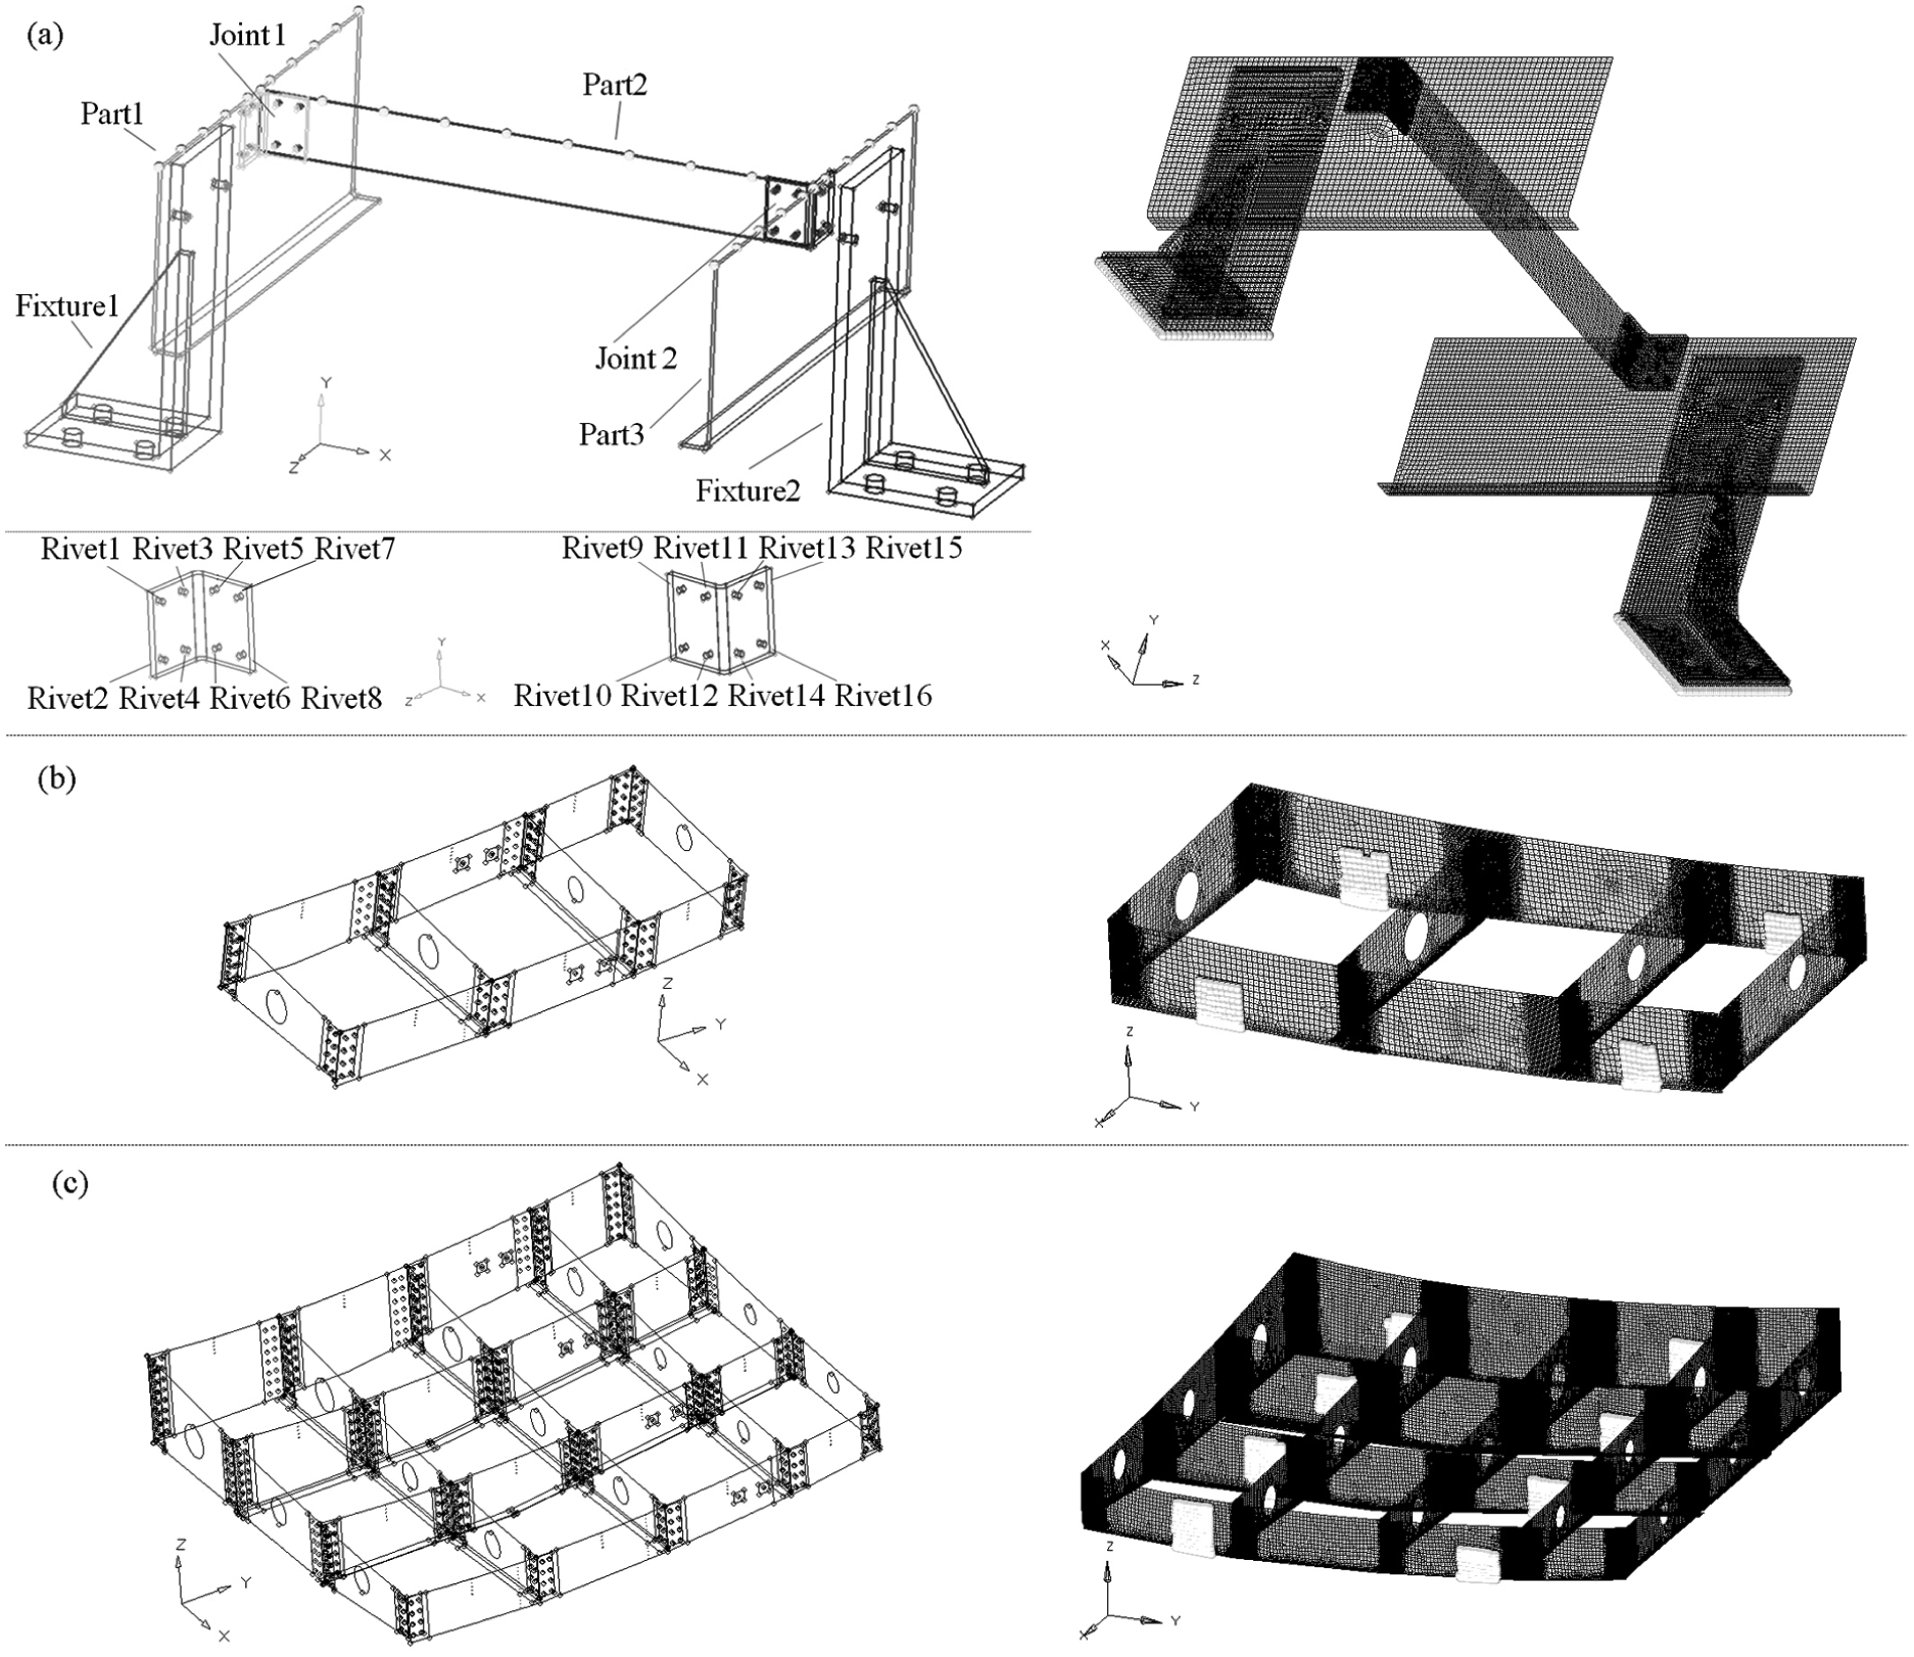
The riveted assemblies and the related FEA models for investigation: (a) a typical series parallel assembly, (b) a riveted assembly with 3 blocks, and (c) a riveted assembly with 12 blocks.
Coordinates of feature points and the first and second groups of mating gaps in experiments (unit: mm).
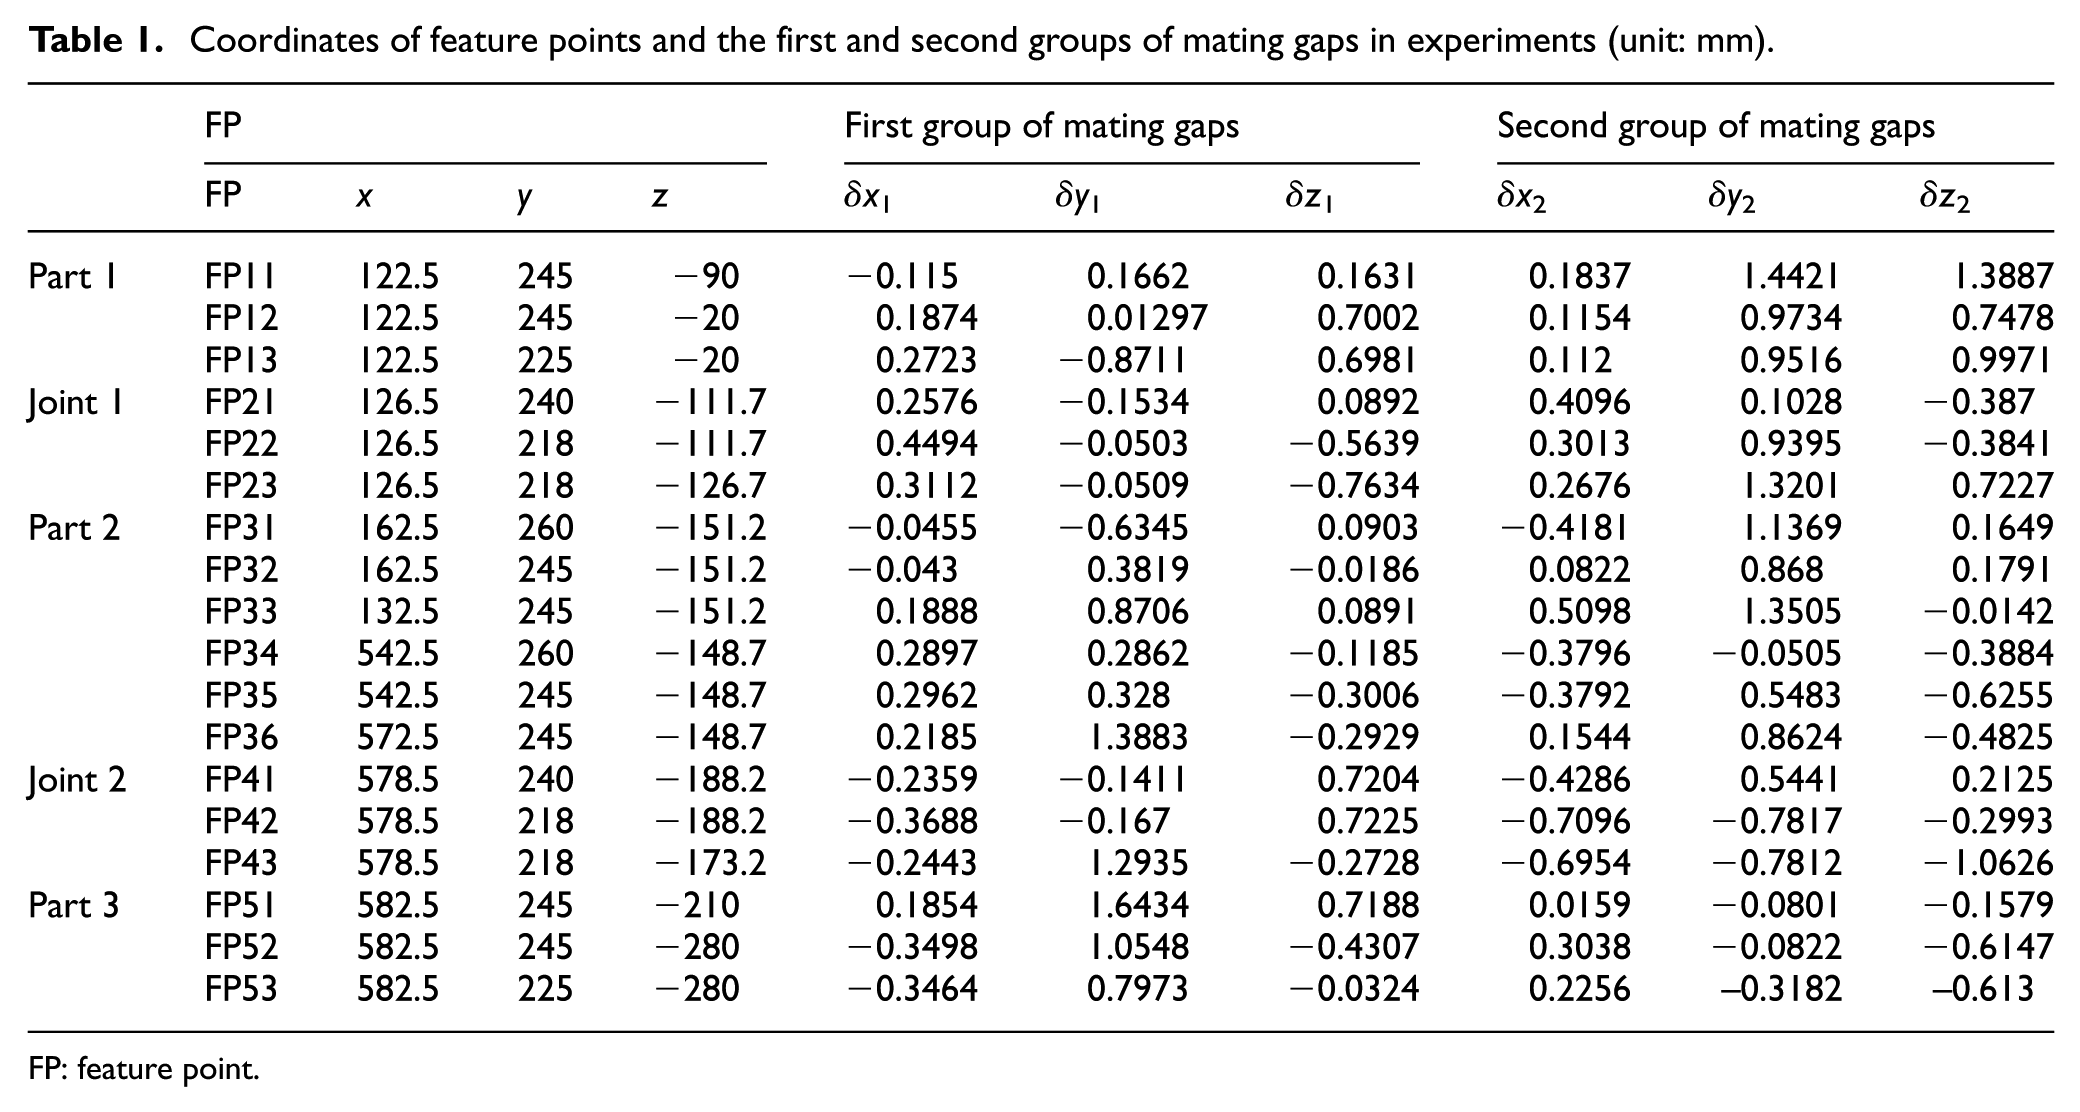
FP: feature point.
In Figure 4(b), the assembly with three blocks comprises 144 rivets. The dimension is 1105 mm × 465 mm × 150 mm. And in Figure 4(c), the assembly with 12 blocks has 567 rivets, the dimension of which is 1499 mm × 1393 mm × 278 mm. Besides the assembly information files recording the locating errors, P_CMPs, and H_CMPs, the FEA models for these assemblies are also created: the right chart of Figure 4(a) shows the FEA model for series parallel assembly which is made up of shell 181 elements and solid 45 elements, and the right chart of Figure 4(b) and (c), respectively, shows the riveted assemblies with 3 and 12 blocks. Their element numbers are, respectively, 66688, 6685179, and 6692752. Meanwhile, the right chart of Figure 4 illustrates the boundary conditions for assemblies by highlighting the related nodes.
Processes of optimizations
The rivet UD optimization method and the specified artificial algorithm can start the RMS reductions for these assemblies. Simulations belong to two types: one is under realistic locating errors and the other is with the assumed locating errors.
The first one uses the series parallel assembly and also has two aspects. That is, the first and second optimizations which, respectively, satisfy the first and second groups of gaps in Table 1. Applying the multi-island genetic algorithm (MIGA) or adaptive simulated annealing algorithm (ASAA) to the first and second optimizations yields four simulations. The setting of parameters for MIGA and ASAA defines about 1000 iterations.
In the second one, the locating errors are gradually out of consideration as the growth of the structural dimension. These optimizations use MIGA. According to the realistic locating errors, the optimization with less locating errors sets that of Part 3 to 0.1000 mm and that of the others to 0.0000 mm. The setting of parameters for MIGA defines 5000 iterations for the largest assembly and 1000 iterations for the others. Globally, Figure 5 summarizes all the iterative processes stopped in convergence.
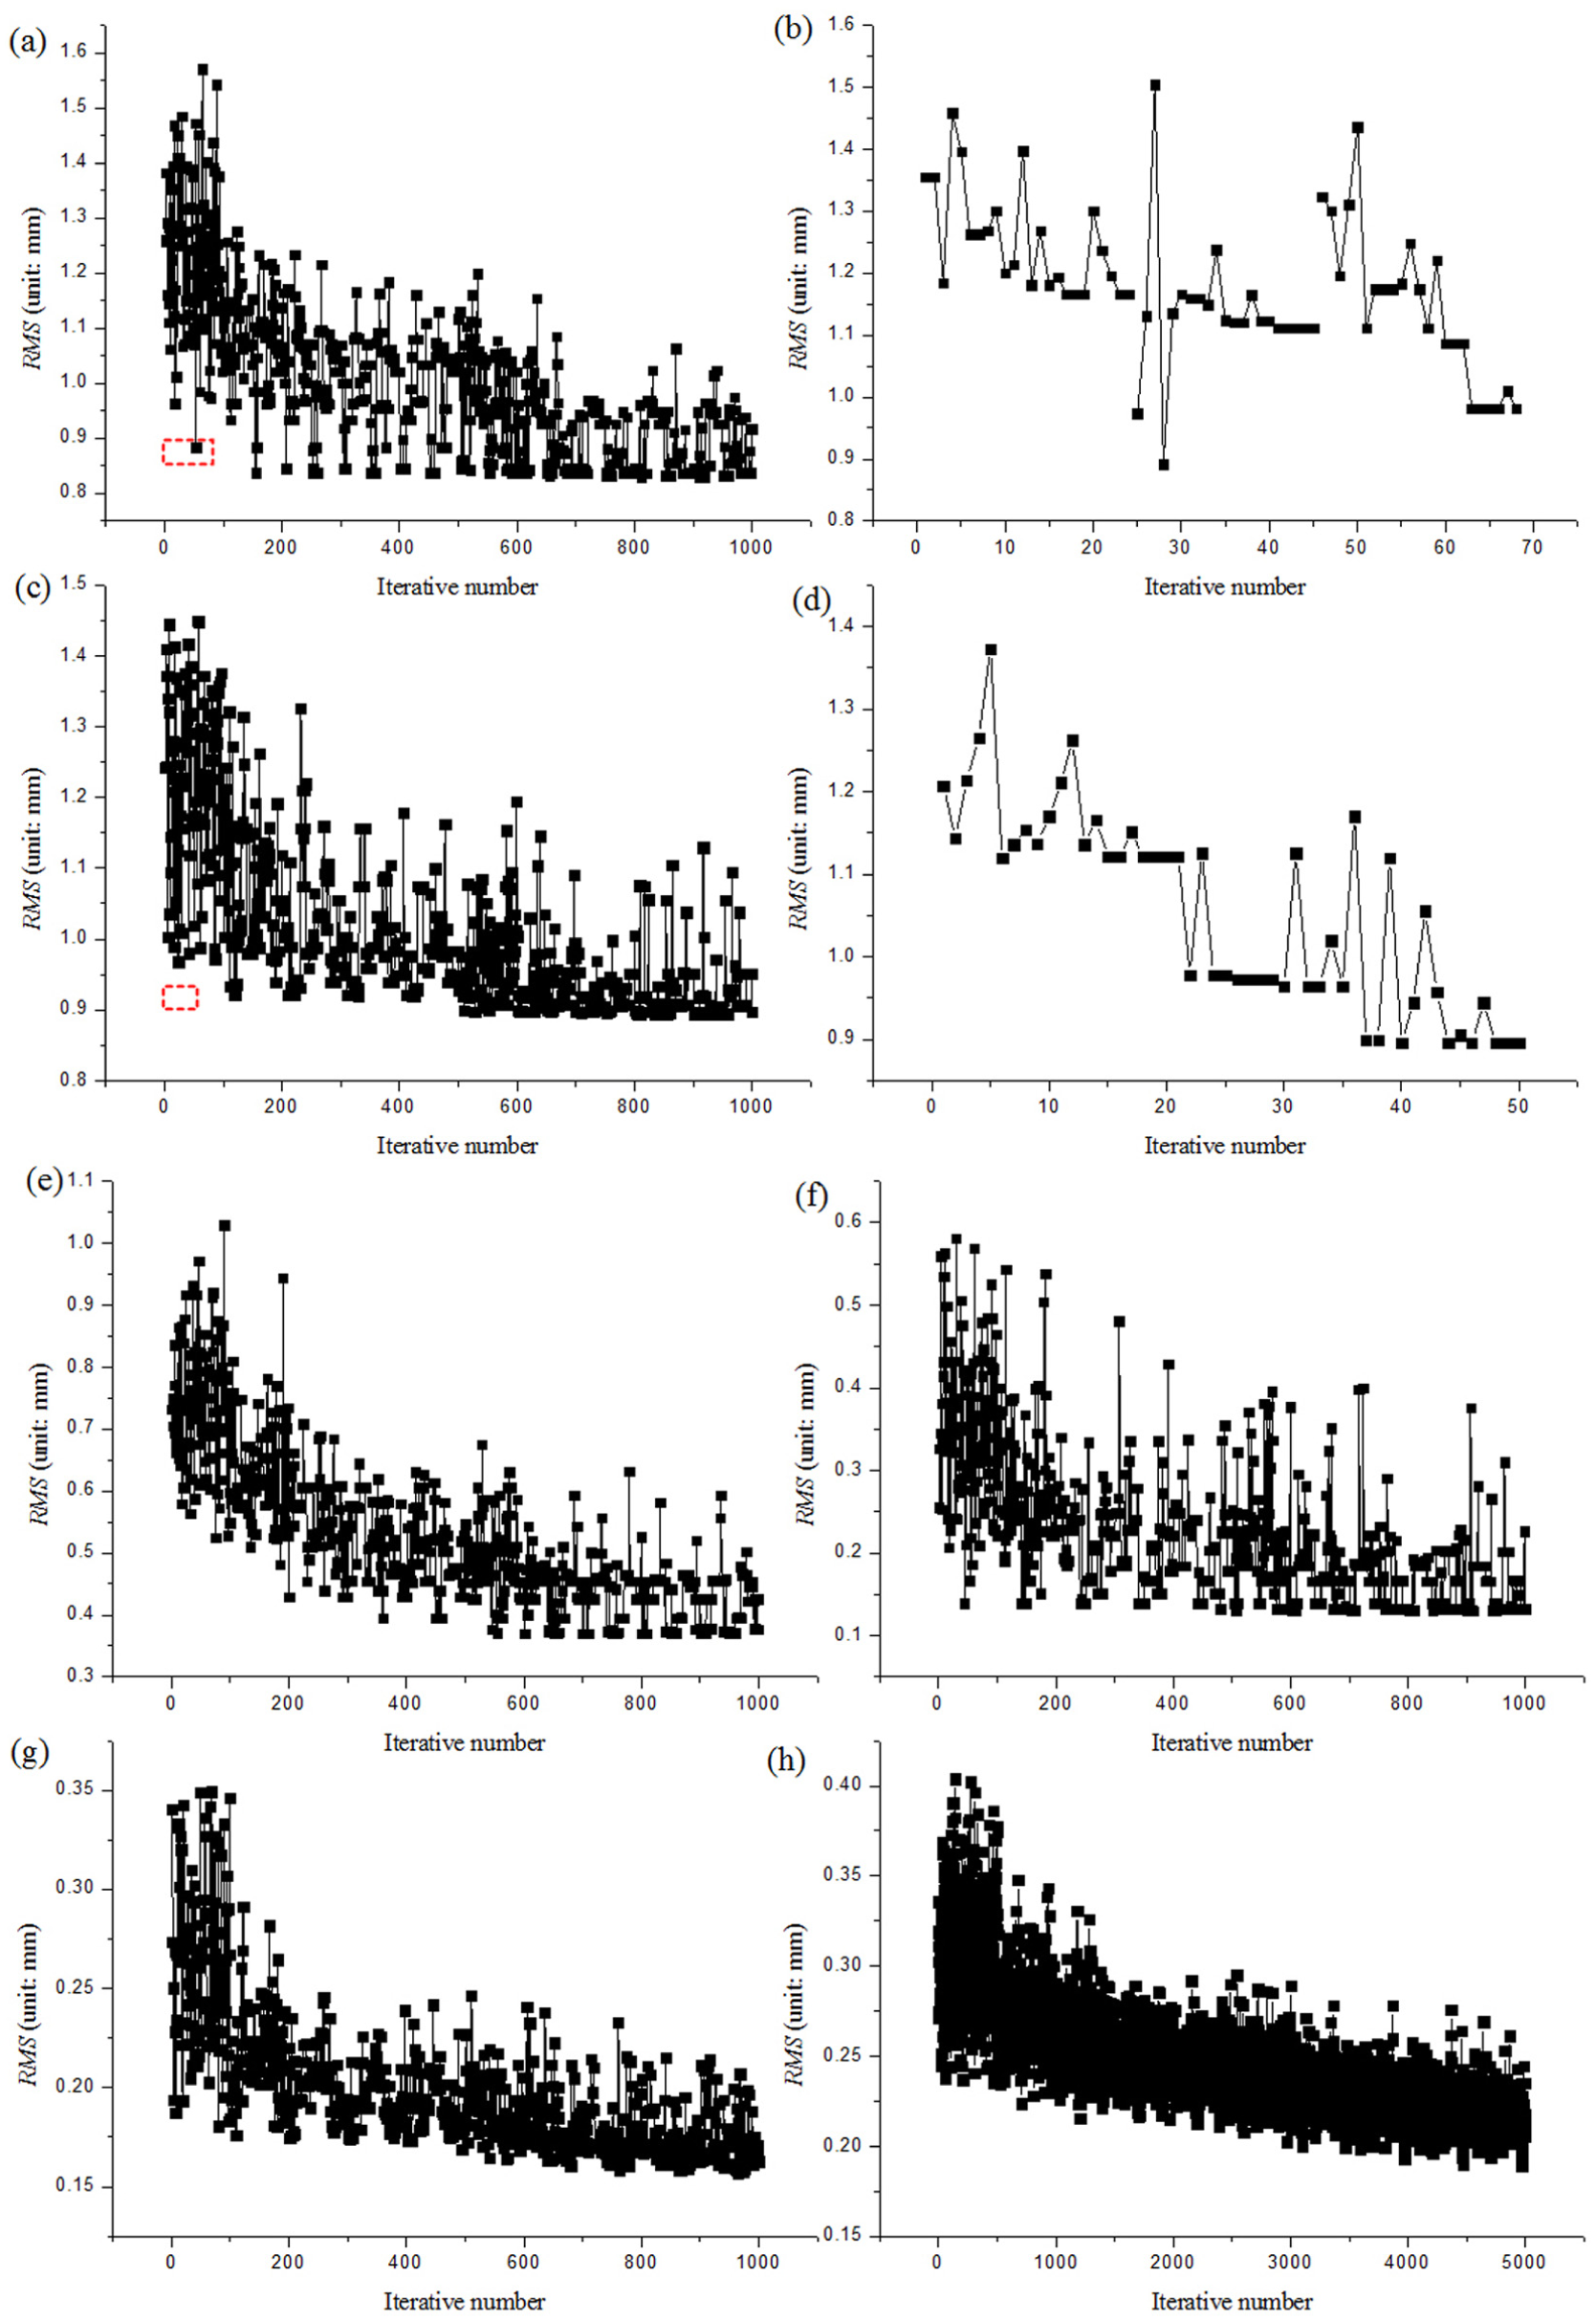
Iterative processes: (a) first optimization by MIGA, (b) first optimization by ASAA, (c) second optimization by MIGA, (d) second optimization by ASAA, (e) MIGA with less locating errors for the series parallel assembly, (f) MIGA without locating errors for the series parallel assembly, (g) MIGA without locating errors for the riveted assembly with 3 blocks, and (h) MIGA without locating errors for the riveted assembly with 12 blocks.
Results of optimizations
Key information on the results of the simulations under realistic locating errors satisfies the following points:
The first optimization by MIGA takes 4 h and 22 min. The minimum RMS is found by iteration number 811 out of the total number 1000, denoted by 811/1000. Compared to the maximum RMS, the reduction effect is about 47.2%.
Those for the first optimization by ASAA are 22 min, 28/68, and 40.7%.
Those for the second optimization by MIGA are 4 h 18 min, 806/1000, and 38.4%.
Those for the second optimization by ASAA are 18 min, 40/50, and 34.8%.
As locating errors reduce to zero, the assembly dimension goes larger. The following points are those information appending with the structural dimension and rivet number:
Those for the series parallel assembly with less locating errors are 4 h 20 min, 602/1000, and 64.1%. Maximum structural length is about 665 mm and the rivet number is 16.
Those for the series parallel assembly without locating errors are 3 h 56 min, 910/1000, 77.6%, 665 mm, and 16.
Those for the assembly with three blocks without locating errors are 6 h 26 min, 965/1000, 55.1%, 1208 mm, and 144.
Those for the assembly with 12 blocks without locating errors are 5 days 19 h 29 min, 4963/5000, 56%, 2065 mm, and 567.
For simplicity, the eight groups of maximum and minimum RMS and locating error–related RMS are all condensed into Figure 6. To show the rivet UDs in simulations, a graph with n × n blocks is introduced, in which each block takes black or white color that implies the positive or negative direction of the axis in coordinate system of the assembly. The graph yields Figures 7 and 8 that record the rivet UDs, respectively, for the series parallel assembly and the other assemblies.
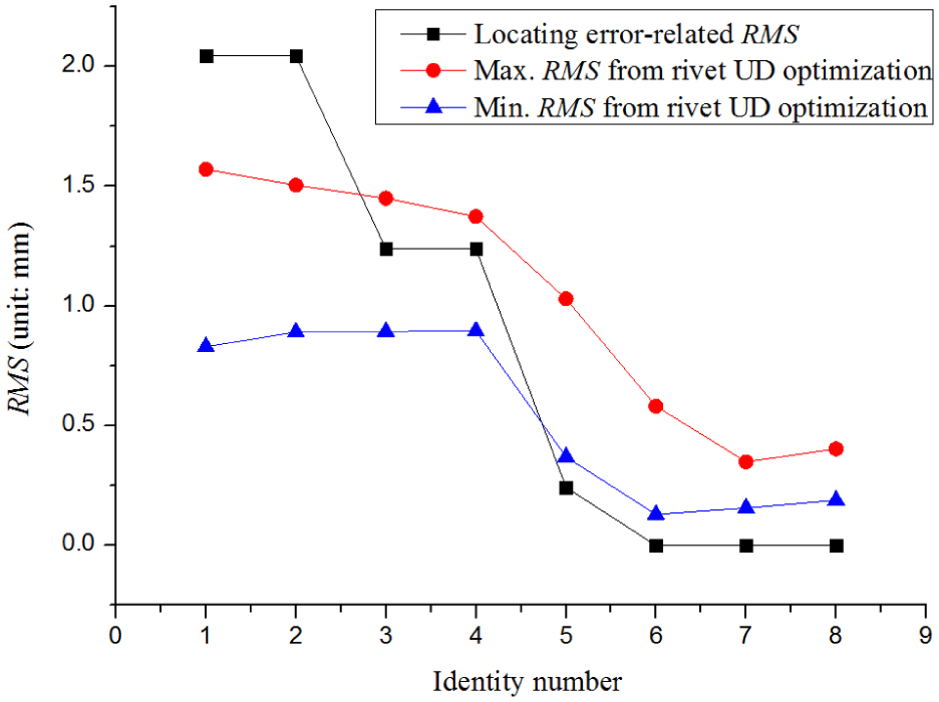
Curves for the maximum RMS, minimum RMS, and locating error–related RMS in simulations.
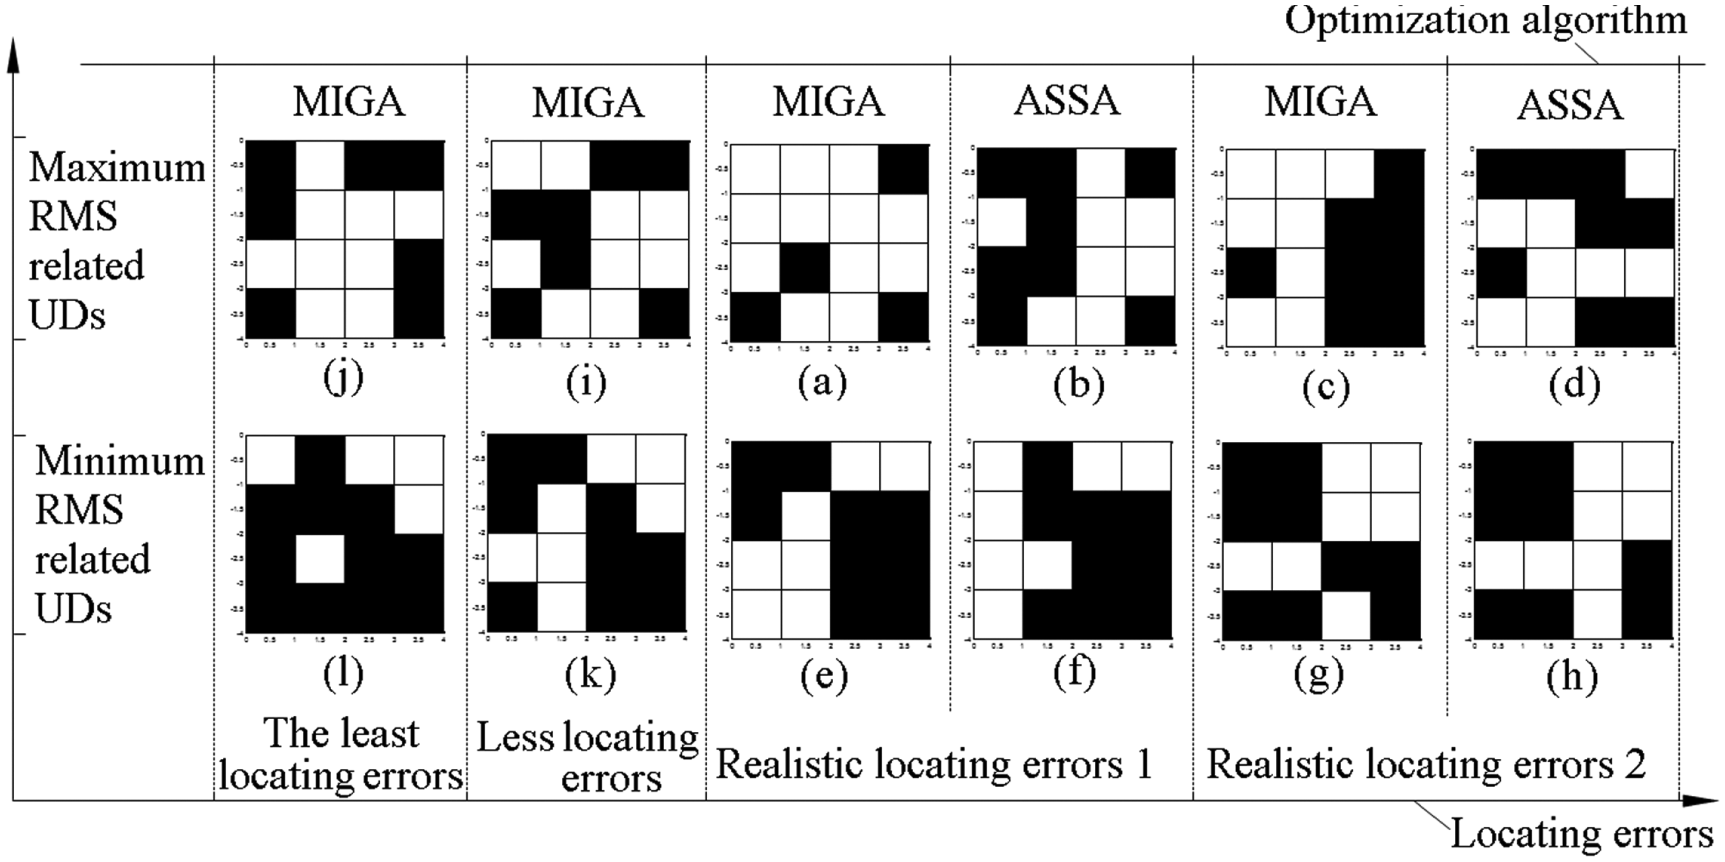
Rivet upsetting directions where black or white color that implies the positive or negative direction: (a) and (e) first optimization by MIGA, (b) and (f) first optimization by ASAA, (c) and (g) second optimization by MIGA, (d) and (h) second optimization by ASAA, (i) and (k) optimization with less locating errors, and (j) and (l) optimization without locating error.
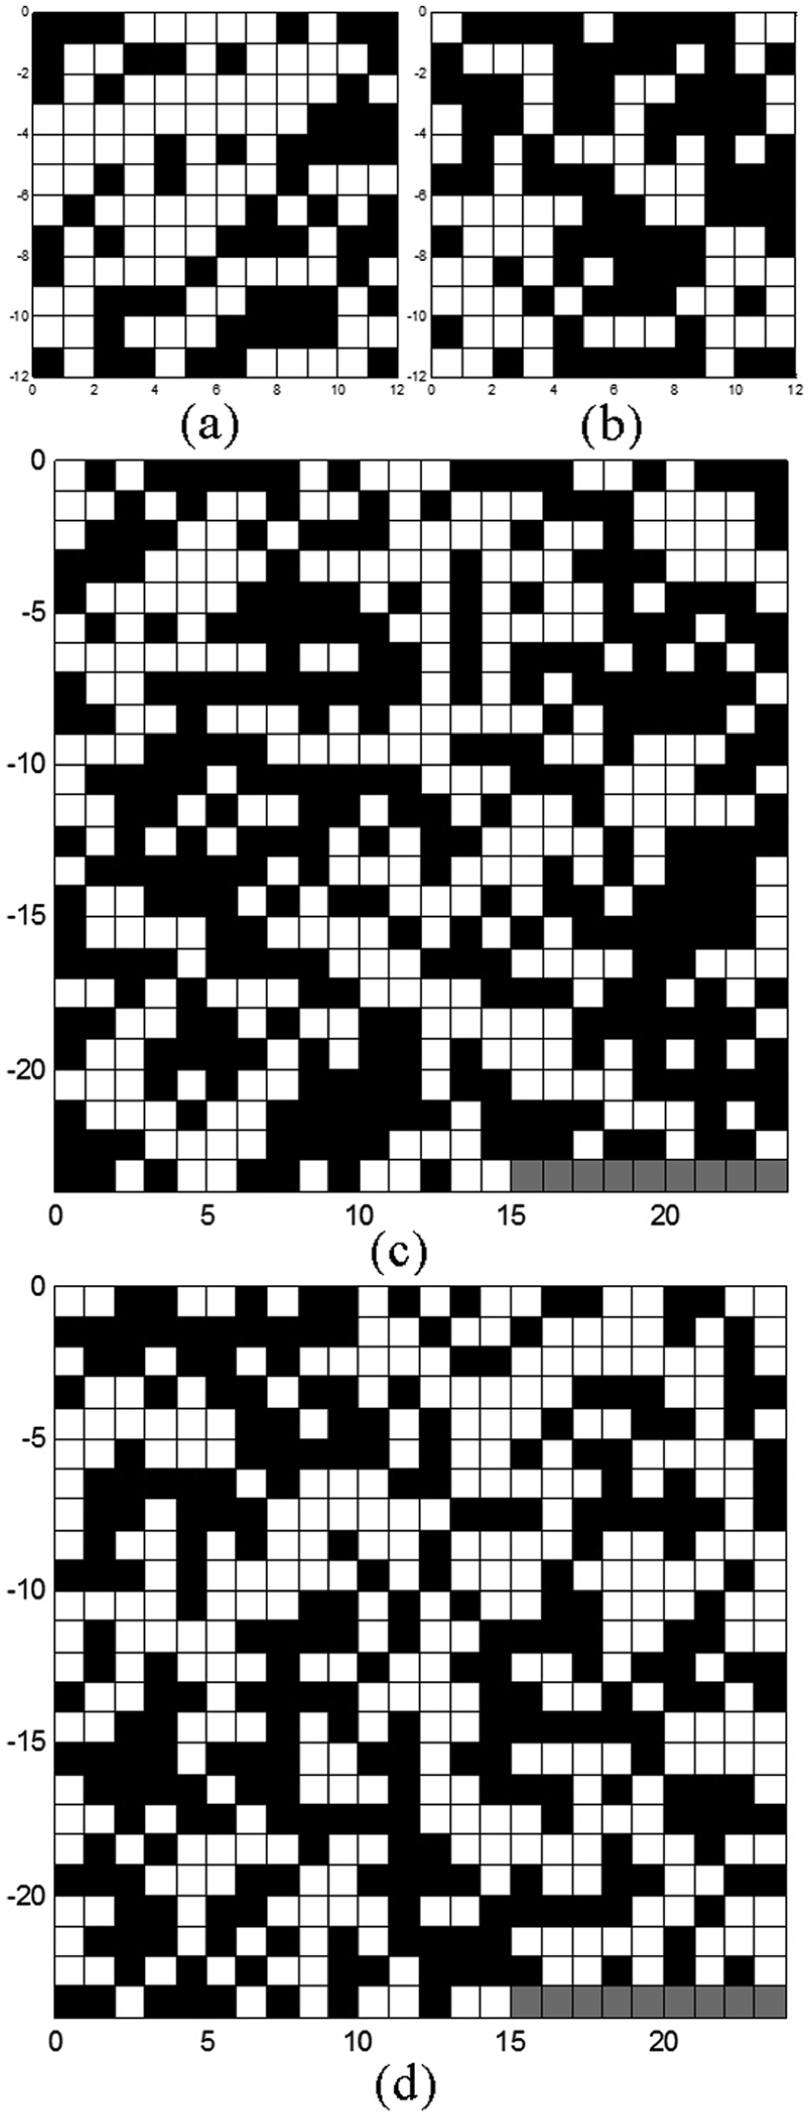
Rivet upsetting directions where black or white color that implies the positive or negative direction and gray color denotes no rivet: (a) maximum RMS-related rivet UDs for riveted assembly with 3 blocks, (b) minimum RMS-related rivet UDs for riveted assembly with 3 blocks, (c) maximum RMS-related rivet UDs for riveted assembly with 12 blocks, and (d) minimum RMS-related rivet UDs for riveted assembly with 12 blocks.
Discussion
To indicate the performance of rivet UD optimization under the change of artificial algorithms, locating errors, and structural dimensions, the following subsections focus on the efficiency of optimization, the effect of RMS reduction, and the distribution of rivet UDs according to the results of simulations and the variables in equation (1).
The used time for optimizations
Comparison of the used time of optimizations between MIGA and ASAA suggests that (1) MIGA is always steady-going and visits a large space that can find a less RMS and (2) ASAA is also effective and uses quite a little time to minimize RMS greatly compared to the RMS by the same iterative number of MIGA in the red dashed block in Figure 5(c), despite that MIGA also has a certain probability in the same performance as shown in the red dashed block in Figure 5(a) and MIGA keeps going. Especially, the second optimization by ASAA finds an RMS quite closely to that by MIGA.
The used time of all the optimizations by MIGA for the series parallel assembly implies the locating errors have less influence on the efficiency. On the contrary, the used time and RMS reduction effect for the assemblies with 3 and 12 blocks indicate that the similar effect of RMS reduction requires more time as the growth of the assembly dimension, that is, the RMS reduction effect is decreasing as the growth of assembly dimension and rivet UDs.
The effect of RMS reductions
The suggestion from the comparison of the used time of optimizations between MIGA and ASAA indicates that the effect of optimization by MIGA is steadier and greater than that by ASAA, and the effect of RMS reduction under realistic locating errors for the series parallel assembly is no less than 34%.
Results of the simulations with assumed locating errors show that the RMS reduction effect is decreasing as the growth of locating errors. By scanning the results under the realistic locating errors again, first optimization has a larger RMS reduction effect than second optimization. This is because the first group of locating errors is greater than the second one. So the effect of RMS reduction is not strictly monotone if the locating errors go larger.
The above influence from the assembly dimension and locating error on the RMS reduction can be apparently expressed by Figure 6 where the locating error–related RMS varies from a value beyond the maximum RMS to a value below the minimum RMS as the decreasing of locating errors. That is the effects of locating errors and riveting distortions on RMS are highly coupled.
The distribution of rivet UDs
Figure 7 re-organizes the UDs of series parallel assembly according to three dimensions, that is, the used artificial algorithm, the involved locating errors, and the maximum or minimum RMS. The combination of Figures 7(j) and (l) and 8 shows the change of UDs according to the growth of assembly dimension.
By checking the distribution of blocks in different colors in Figure 7, the following points hold:
The comparison between Figure 7(a) and (c), or Figure 7(b) and (d) finds that the number of blocks in different colors is 8, which means that the maximum RMS-related UDs in the visited design spaces are different under the change of realistic locating errors.
The comparison between Figure 7(e) and (f), or Figure 7(g) and (h) suggests that ASAA can find the distribution of UDs that is close to that solved by MIGA, where the larger number of blocks in different colors is 4 and the less one is 1. The less one is a case that ASAA finds an RMS very closely to that from MIGA.
The comparison among Figure 7(k), (e) and (g) suggests that the number of blocks in different colors is not larger than 4. It means that the change of the minimum RMS-related UDs is not apparent before the locating error reduces to zero; however, the change of related RMS is apparent.
For the series parallel assembly without locating error, Figure 7(l) also varies by four blocks in different colors from Figure 7(k) which is for the assembly with less locating errors; Part 3 is 0.1 mm.
The above four points find that the optimized UDs are gradually changed as the decreasing of locating errors. By counting the number of blocks in different colors in Figures 7 and 8, the ratio of the number of black blocks out of the total block number is summarized in Figure 9, where the minimum RMS-related UDs for the series parallel assembly without locating error have the most blocks in black color that denotes the negative direction of axis. Then, the peak of ratio disappeared as the increasing or decreasing of assembly dimension.
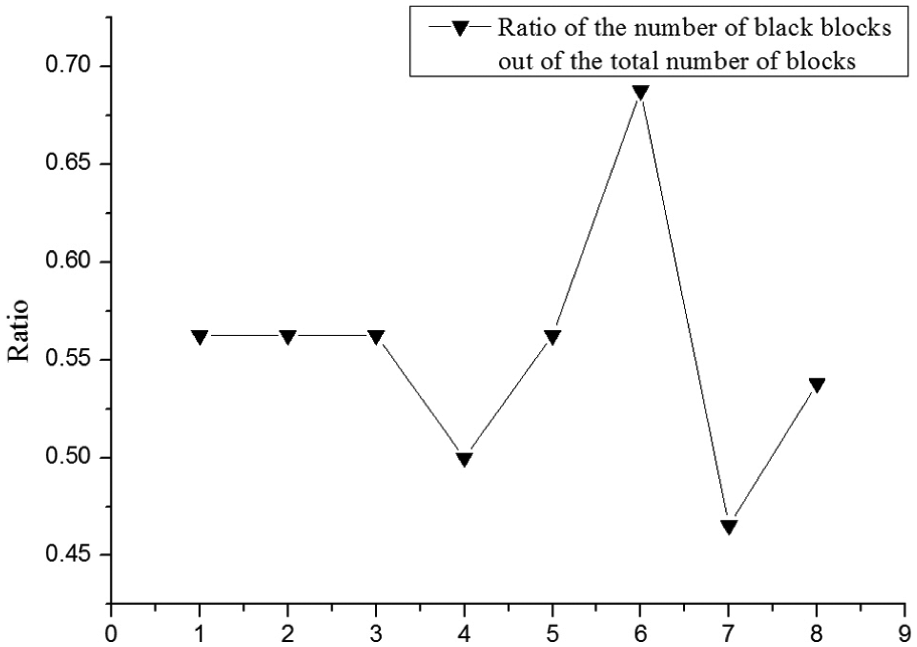
Ratio of the number of black blocks out of the total number of blocks in simulations.
To reveal more about the peak of ratio when the locating error is 0, two parts and 32 rivets are added into the series parallel assembly and the optimization without locating error is performed by MIGA, where the optimized RMS is 0.1463 mm and the related ratio is 25/48 = 0.52. That is no peak there. So the peak of ratio in Figure 9 is a particular case.
Conclusion
Processes and results for the riveted assemblies demonstrate four points of knowledge about the objects in the formulation of rivet UD optimization:
The optimizer. MIGA is steadier than ASAA in the RMS reduction and ASAA is an alternative for rapid solution.
The design variables. The optimized rivet UDs along the positive and negative directions of coordinate system mainly tend to be half and half; however, the maximum RMS-related UDs is in quite a different manner by the change of locating error or assembly dimension.
The coupled variables. It comprises two points: one is the optimized UDs in different colors are gradually changed as the decreasing of locating errors and the other is the coupled relation between rivet UD numbers and locating errors, which yields the next point.
The target. The effect of RMS reduction is decreasing as the growth of rivet UD numbers but is first decreasing and then increasing as the growth of locating errors.
The apparent effects of RMS reductions under the realistic locating errors show the performance of the proposed method. However, in the current version of rivet UD optimization, the UDs cannot take arbitrary directions in the coordinate system, the inherent strain database only focuses on the solid riveting, and the optimized fuzzy UDs may reduce the nice appearance of the product.
Overcoming the above limitations will apply the formulation to more assemblies. Meanwhile, the construction of inherent strain database for different types of solid riveting processes shall improve the efficiency of dimensional reduction. The coupled relation between rivet UD numbers and locating errors requires to let the locating errors be the other design variables in the formulation of rivet UD optimization.
To incorporate the locating errors, new investigations may include the probabilistic modeling of locating errors, the efficient test approach for locating errors, the framework of reliability-based process planning, and the assignment of designed locating errors to realistic assembly operations. Developing the 3D precision calculation for an assembly with multiple parallel parts is also an alternative for incorporating the locating errors, the basis of which is the logic of parts in the assembly.
Footnotes
Declaration of conflicting interests
The author(s) declared no potential conflicts of interest with respect to the research, authorship, and/or publication of this article.
Funding
This article is financially supported by the Funds of Certain Ministry of China (Nos 51318010102, 51318010103, and 51318010404) and Research Project of Jiangsu Province (No. BY2015070-06).