
Abstract
Cloud manufacturing offers the potential to make mass manufacturing resources and capabilities more widely integrated and accessible to users through network. Most related research assumes that there exists only one management center for all manufacturing resources and capabilities in a manufacturing cloud. However, this could cause the efficiency problem (e.g. scheduling time) and harm the quality of service (e.g. response time). Actually, a large-scale manufacturing cloud should have multiple management centers to deal with massive, widely distributed manufacturing resources and capabilities and users; meanwhile, the constraint of finite manufacturing resources and capabilities and the cost of remote collaboration should be taken into consideration. Thus, this article first presents the architecture for the multi-centric management with two-level scheduling strategy combining the advantages of the centralized and decentralized decision-making. Then, after quantifying the availability and the collaborative cost of the manufacturing resources and capabilities, we propose a global optimization model for the manufacturing resources and capability allocation under the multi-centric architecture. Finally, a case study adopting our new method shows that the utilization of the manufacturing resources and capabilities would be more balanced, while the cost of the total collaboration would be reduced, compared with the typical decentralized solution. The research results can support cloud manufacturing to effectively deal with the challenge of management and allocation for increasingly large-scale and distributed manufacturing resources and capabilities.
Keywords
Introduction
Cloud manufacturing (CMfg) as a new service-oriented manufacturing paradigm, adopts and extends the concept of cloud computing,1,2 in which the computing and storage resources are concentrated and managed for sharing. Integrating the existing manufacturing technology with the newly-emerged information technology (such as cloud computing, internet of things, modeling and simulation and big-data), CMfg virtualizes various manufacturing resources and capabilities (MR/Cs) and builds an MR/C pool (cloud) to deliver on-demand manufacturing services for the whole lifecycle activities of manufacturing, through network anytime and anywhere.3–5 The cloud need concentrate massive and widely distributed MR/Cs. For example, a manufacturing cloud of a Chinese aerospace conglomerate integrates and shares lots of MR/Cs from its subsidiaries across China, including (a) high-performance clusters that run 100 teraflop operations per second and 320 TB storage; (b) more than 300 sets of tool software for the design and analysis in mechanical, electronic, control and other system; (c) not less than 10,000 parameterized models and knowledge files; (d) hundreds of high-end digital production lines and cellular manufacturing systems from several plants and (e) thousands of manufacturing capabilities 6 such as basic technology, parts supply, and production process in the whole lifecycle of manufacturing.
However, most research about management and allocation of MR/Cs in CMfg7,8 and other traditional paradigms such as grid manufacturing9,10 assumes that there exists only one management center, and that is what we need to re-examine. For one thing, in a manufacturing cloud with the single-centric architecture, the quality of service (QoS) such as the response time cannot be guaranteed, because collecting the state of massive, widely distributed MR/Cs could be affected by the network speed and instability, especially when the scheduling cycle of some jobs should be limited to only tens of seconds. For another, it is actually not a single-centric but multi-centric architecture. There are many existing MR/Cs such as the digital production lines and the cellular manufacturing systems which cannot be centralized like the data centers in cloud computing due to the high migration cost. A feasible way is that the MR/Cs in original workshops or factories are connected by reusing and reforming their scheduling systems into a nearby management center, and then all of the MR/Cs can be combined as a whole by integrating the management centers scattered in different areas shown in Figure 1. With this multi-centric architecture, we focus on what kind of strategy (e.g. centralized or decentralized decision-making) is better for the efficient management and allocation.
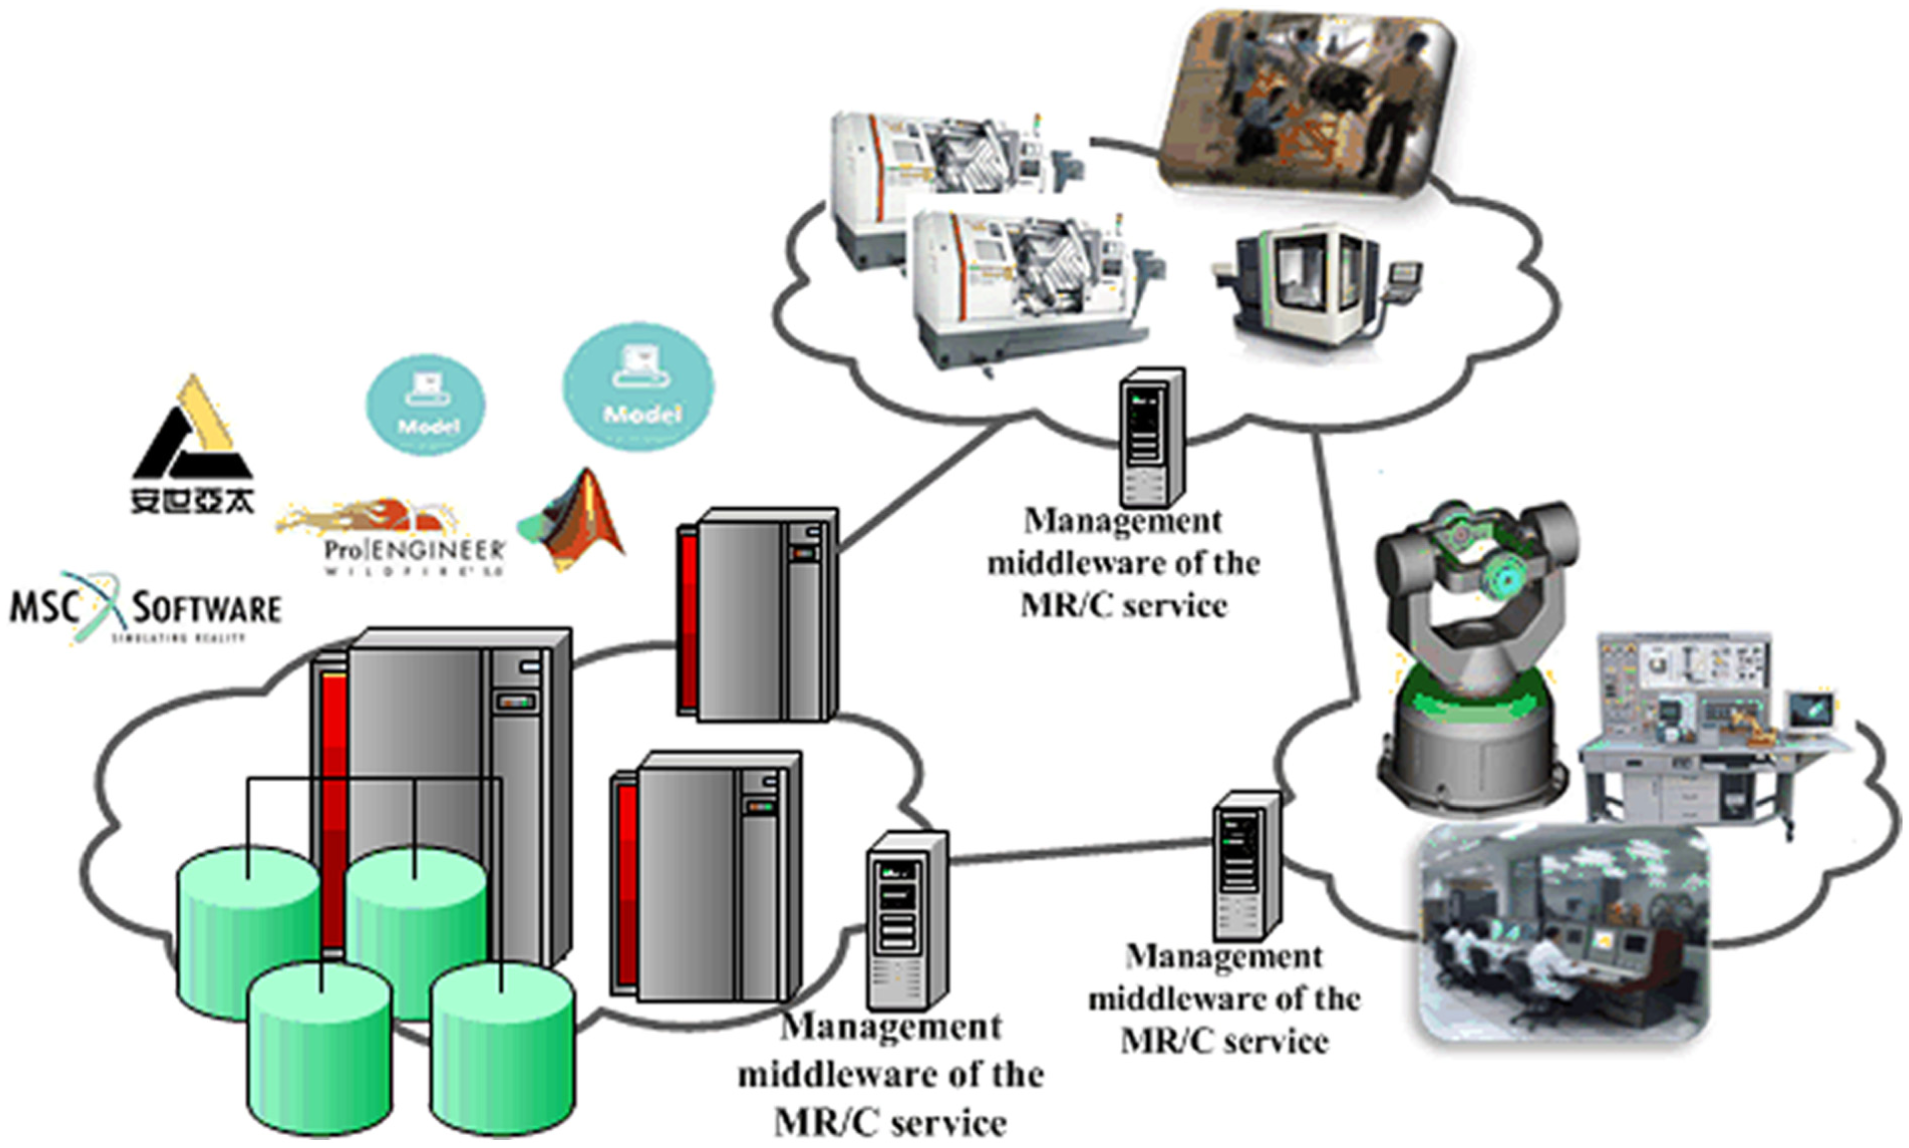
Layout of the MR/Cs in multi-centric architecture.
In fact, multi-centric architecture is very common in cloud computing (for example, federated clouds11,12), and its methods of management and allocation are worth learning, but CMfg and manufacturing tasks have special characteristics. First of all, the MR/Cs are usually expensive and limited and used in the queuing-up way, unlike cloud computing services (such as electronic payment services) which can support massive concurrent access. So, the availability of the MR/Cs needs to be measured. Second, virtualization in CMfg has realized the fine-grained management and allocation of MR/Cs. Virtualization technology can be used to divide physical MR/Cs into a number of logical units and combine logical units into virtual instances elastically according to user demands. So, the measurement of the availability is different compared with the traditional ways. Third, a manufacturing task usually consists of multiple sub-tasks which would be achieved by the collaboration of the MR/Cs such as logistics transportation between different processes, business process synchronization among sub-tasks. If the collaborative MR/Cs scatter in different management centers far away, the cost of remote collaboration must be considered. The availability and the collaborative cost of the MR/Cs are two important indicators of management and allocation in multi-centric architecture. We also pay attention to how to quantify them.
In addition, compared with the traditional network manufacturing, CMfg pays more attention on operation model, 3 so the management and allocation in multi-centric architecture have to satisfy the interests both of the MR/C service providers and consumers. For the MR/C service providers, no matter which management center their services register in, they call for a mechanism to guarantee that the services with the same category and level can be acquired equably to avoid unbalanced load of MR/Cs globally. For the MR/C service consumers, to ideally fulfill their manufacturing tasks within the delivery time at the lowest cost and highest efficiency, they want the cost of remote collaboration between the MR/Cs to be as low as possible. For example, in the process of collaborative production, the lower cost of the remote collaboration means the logistics transportation is cheaper and quicker; in the process of collaborative research and development (R&D), it means the business process synchronization is executed with lower latency and wider bandwidth. This is a multi-objective problem, and we are concerned about whether there is an elegance and simple mathematical model for the multi-centric management and optimized allocation of MR/Cs.
The main contributions of this article are as follows:
The architecture for the multi-centric management is presented. The architecture extends the existing MR/C management framework which does two-level scheduling to solve the heterogeneity problem of MR/Cs and executes two-level scheduling strategy combined with centralized and decentralized decision-making to tackle the distribution issue of MR/Cs.
The methods to quantify the availability and the collaborative cost of the MR/Cs are given and discussed. The methods take the characteristics of manufacturing clouds (such as virtualization) and manufacturing tasks (such as collaboration) into full consideration.
A global optimization model for the MR/C allocation under the multi-centric architecture is proposed. Using the model, compared with the existing solution, the utilization of the MR/Cs would be more balanced, while the cost of the total collaboration would be reduced.
The rest of the article is organized as follows. In section “Related works,” we survey related works. In section ‘Coordinated management architecture of MR/C in CMfg,” a new framework for the multi-centric management is presented. In section “Availability and collaborative cost of MR/Cs,” we discuss the metrics for the availability and the collaborative cost of the MR/Cs. In section “Global optimization model for the MR/C allocation under the multi-centric architecture,” we propose a global optimization model for the MR/C allocation under the multi-centric architecture. In sections “Application example” and “Conclusion and future work,” we present a case study and the summary, respectively.
Related works
There are various kinds of MR/Cs in the manufacturing cloud. Assuming only one management center, most current research on the management of MR/Cs concerns how to integrate, monitor and allocate MR/Cs. We have proposed an MR/C management framework of manufacturing clouds in Lin et al. 13 Based on the respective matured methods of virtualizing and managing computing resource, software (and their license), models, manufacturing facilities and capability,14–16 we utilized different specialized modules to manage the virtual instances of different kinds of MR/Cs, and then on top of the modules, a management middleware of MR/C was presented to organize and allocate the whole MR/Cs, including the unified ID allocation and the lifecycle management of MR/Cs and the scheduling of tasks in a single global task queue. However, this research also assumes only one management center, so it should be further extended to support the multi-centric management.
Virtualization 17 plays a vital role in CMfg. Li et al. 5 thought that virtualization provides the way to encapsulate and abstract the heterogeneous, distributed MR/Cs to facilitate the unified management of MR/Cs in CMfg. After virtualization, the physical MR/C may have different mapping relationships with a virtual instance (The Service Oriented Architecture 18 is employed to deliver services of virtual instances to users), including one-to-one, one-to-many and many-to-many relationships (Figure 2). For example, a machine tool typically has the one-to-one relationship with its virtual instance, because it usually could not process two more workpieces at the same time. A manufacturing capability can be divided into different number of virtual instances if measured in man-month or man-hour (one-to-many relationship), while a number of computers in a computing cluster can be virtualized into multiple virtual clusters in cloud computing (many-to-many relationship). However, manufacturing grid only supports the one-to-one mode, 19 as it cannot efficiently manage the fine-grained MR/C like multi-cores on a computer without the latest virtualization technology.
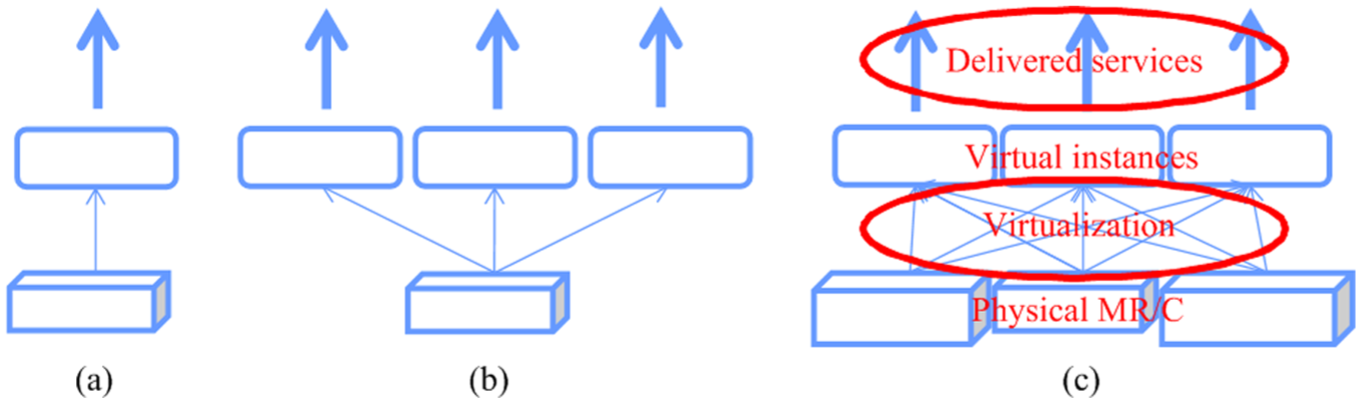
Relationships between the physical MR/Cs and virtual instances: (a) one to one, (b) one to many and (c) many to many.
Under the multi-centric architecture, cloud computing usually deploys application services in several data centers, so that users’ requests can be routed to the most suitable center.20,21 There are two practical ways to schedule tasks in a cloud: the centralized scheduling method based on the primary and standby architecture and the distributed, decentralized one. 22 The former method sets one main center to schedule all tasks. All users request services from this center. When the main center or its network breaks down, the standby center will automatically perceive such situations (e.g. through monitoring heartbeats) and deliver services to users instead. As for the second method, all sub-centers operate in the peer-to-peer way: each sub-center is responsible for the scheduling of tasks from the nearby users and will process the tasks to the best of its ability or else will send the request for the MR/C to other sub-centers. Basically, the first method bases on the single center architecture, probably leading to low QoS (e.g. responding time) when the MR/Cs are large-scale and distributed. The second method does not consider the cost of remote cooperation and the global optimizing of MR/C allocation, so that the interest of users and providers of MR/Cs cannot be well-balanced.
Actually, this is the distributed scheduling problem and the above methods are only a subset of the solutions. Toptal and Sabuncuoglu 23 proposed a systematic classification framework of the distributed job scheduling problems from the aspects, such as information flow structure, communication mechanism, local agent types, assignment method, schedule generation, objection and machine environment. The distributed job scheduling can be done in the centralized way (with or without an independent, global scheduling center) or the decentralized way (with or without the coordinators), according to the information flow structure. Besides, the distributed job scheduling can be done hierarchically. The introduction of multi-agent technology 24 greatly promotes the development of distributed scheduling. The multi-agent system can make optimal decisions through complex interactions between distributed, autonomous agents. Kamsu-Foguem and colleagues25,26 proposed methods to fuse the knowledge from different sources to support collaborative decision-making in industrial maintenance, including knowledge formalization of domain vocabulary to improve the communication and knowledge sharing with conceptual graphs formalism, multi-expert knowledge management with the transferable belief model to support collaborative decision-making and a variant of the case-based reasoning mechanism with a process of solving new problems based on the solutions of similar past problems. However, these methods cannot be used directly to solve the domain problems in CMfg and new solutions should be developed to satisfy the application requirements.
Coordinated management architecture of MR/C in CMfg
To manage MR/Cs in CMfg, we propose a two-layer coordinated management framework (Figure 3) by extending our previous management architecture. 13
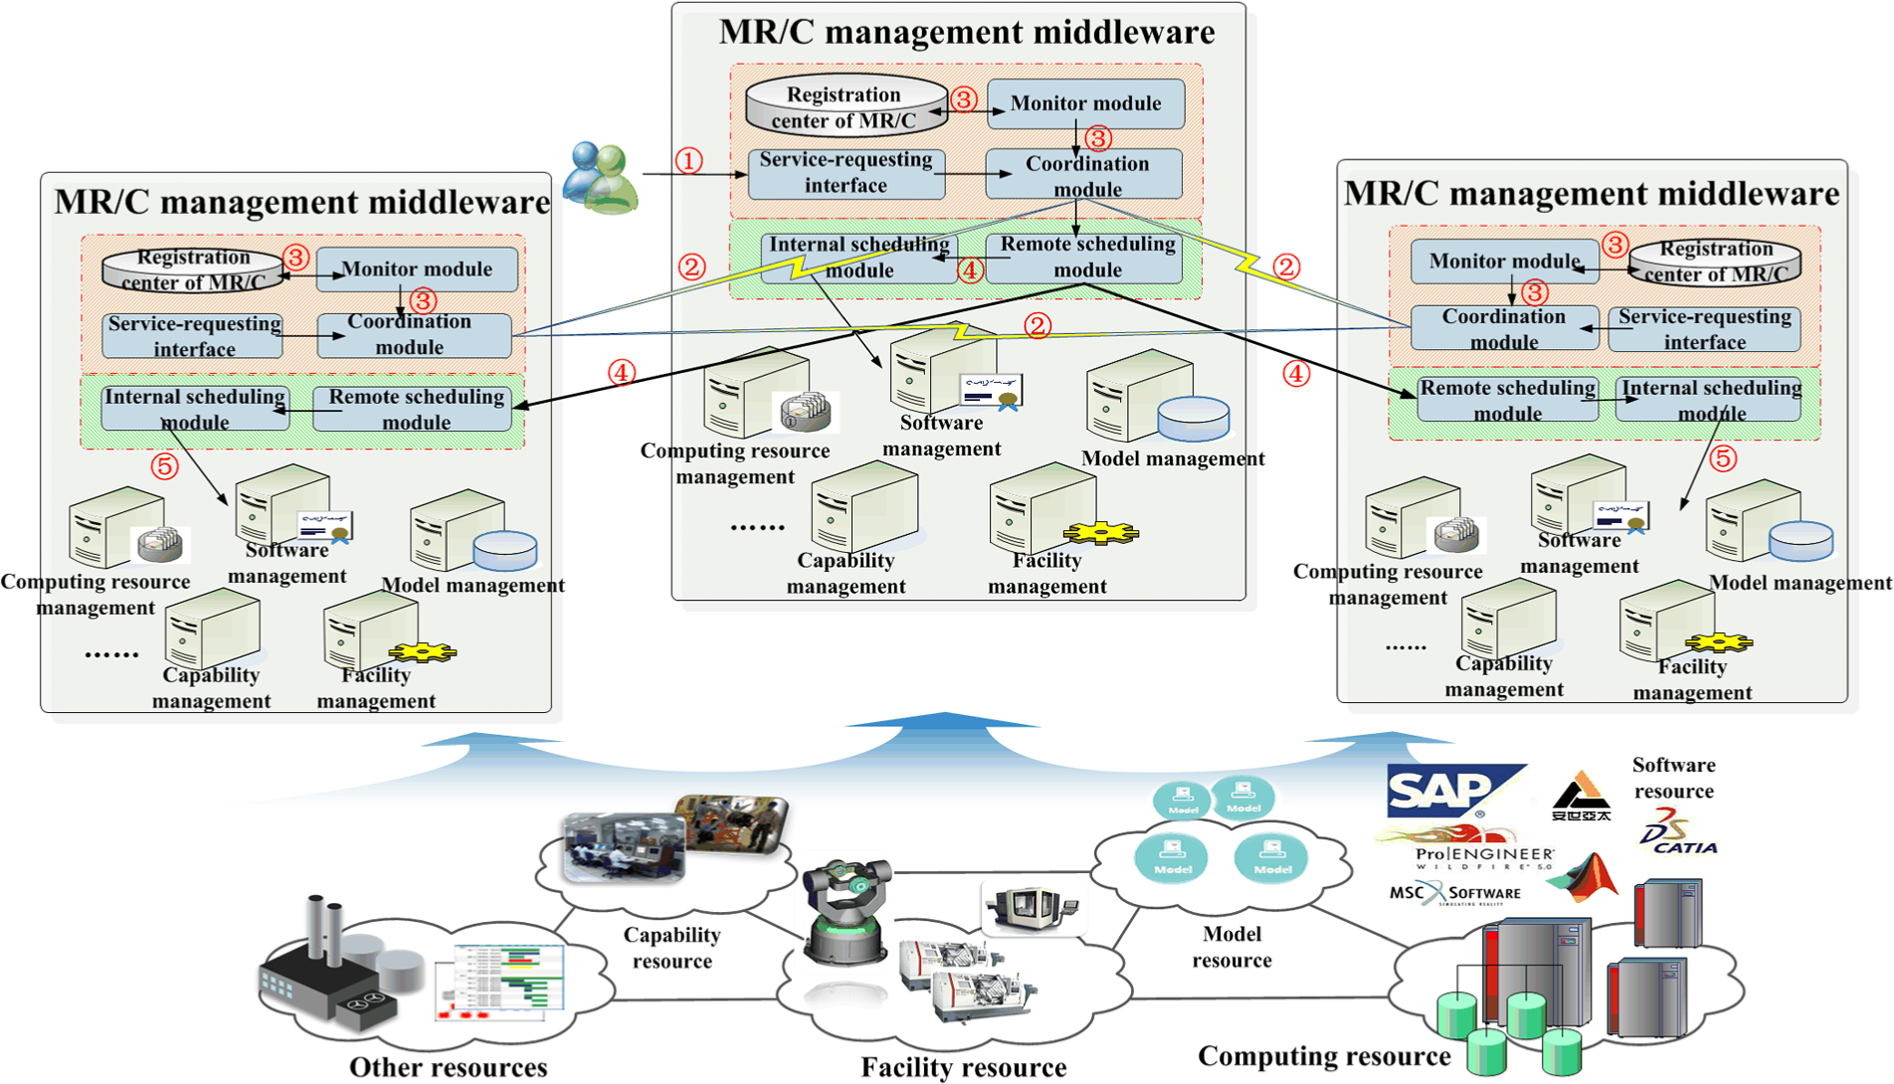
Coordinated management architecture of MR/C in CMfg.
First, the basic layer of the architecture is based on our previous framework, which primarily aims to shield the heterogeneity of MR/Cs and manages MR/Cs in a single center. 13 The old framework has two levels. The bottom level employs different management systems to manage different kinds of MR/Cs (e.g. computing resource, software, models, facilities and capabilities). Each kind of MR/Cs is usually heterogeneous, and the heterogeneous physical MR/Cs are virtualized as virtual instances and managed by a management system which can be the model management system, the software management system, the capability management system and so on (as shown in Figure 3). At the upper level, the internal scheduling module is responsible for selecting and organizing different kinds of virtual instances to deliver composite services according to the state information of virtual instances and the composition relationship between different kinds of MR/Cs. For example, the virtual desktop service which can provide users virtual product–design environments is built by composing virtual software and virtual machines. There are multiple management centers in a manufacturing cloud, but each center can manage MR/Cs in such similar way.
Based on the basic layer, the high layer mainly addresses the distribution problem of MR/Cs also in two levels. According to the design, every management center in the CMfg system only accepts the service requests nearby. As collecting the state information from all virtual instances globally can easily cause the efficiency problem, and every management center only maintains the MR/C categories of other management centers and asks for the availability information of related MR/Cs from corresponding management centers according to the accepted tasks. Then, at the top level, the requested management center will make the optimal decision according to the whole availability information and the cooperation cost of related MR/Cs and route the sub-tasks to the optimal centers; at the bottom level, the chosen centers will accept the allocated sub-tasks and optimally select the suitable virtual instances from their inside MR/Cs to implement the sub-tasks independently. Thus, we can see that the framework combines the advantages of the centralized and decentralized decision-making: a management center performs the centralized decision-making by acquiring essential information from all management centers and scheduling its tasks globally and optimally to suitable management centers when it accepts tasks from users; each management center in CMfg can behave like this, so from this aspect, this is the decentralized decision-making which makes the cloud more robust and reliable.
The overall coordination process of the framework is as follows:
Step 1. An MR/C management middleware accepts a task from the upper application by the service-requesting interface. The task may consist of many sub-tasks, each requesting certain amount of certain kinds of MR/Cs.
Step 2. Through the coordination module, the MR/C management middleware asks for the availability information of related MR/Cs from corresponding management centers’ MR/C management middleware and negotiate the cooperation cost between MR/Cs with them on demand. 27 The “related MR/Cs” refer to the MR/Cs that may potentially be used by the accepted task.
Step 3. Every MR/C management middleware updates the state information of its MR/Cs periodically via the monitor module 14 and calculates the availability of MR/Cs on demand.
The cooperation cost of MR/Cs between two centers is determined by two middleware through negotiations.
The MR/C management middleware makes the optimal decision using the mathematic model shown in section “Global optimization model for the MR/C allocation under the multi-centric architecture and intelligent algorithms.”
Step 4. The MR/C management middleware then allocates the sub-tasks to the optimal centers according to the decision. The management middleware in the chosen centers will reserve and lock the virtual instances for the sub-tasks.
Step 5. The MR/C management middleware in the chosen centers schedules and executes the sub-tasks using the internal scheduling module, and then returns the execution progresses or results.
Availability and collaborative cost of MR/Cs
Availability of MR/Cs
We use the availability of MR/Cs, because there are only limited available MR/Cs in CMfg. 28 To measure the availability of MR/Cs is the first step toward optimized allocation of MR/Cs; otherwise, the cloud could not know whether and when there exist idle MR/Cs for new tasks. The availability can be measured according to two main factors:
(a) Virtualization
The availability of MR/Cs mainly depends on how much the physical MR/Cs remain, how much the requested virtual MR/C instances are expected to occupy and how many virtual MR/C instances could be virtualized from the left physical MR/Cs. There exist one-to-one, one-to-many and many-to-many relationships between the physical MR/Cs and the virtual MR/C instances. In the case of one-to-one relationship such as for the machine tool, the remaining physical MR/Cs could be measured by the proportion of the idle ones; in the case of one-to-many relationship such as for the manufacturing capability, the left physical MR/Cs could be measured by the proportion of the idle working hours; in the case of many-to-many relationship such as for the high-performance cluster, the remaining physical MR/Cs could be measured by the proportion of the idle CPU and memory (weighted sum). Meanwhile, the requested virtual MR/C instances could be measured by a few key parameters (e.g. working hour and station number) in the similar way, and we define
(b) Task characteristic
The availability of MR/Cs also depends on task characteristics: manufacturing tasks can be finished in unpredictable time (e.g. we could not predict how much time a user would spend on a product design using the virtual desktop), can be finished in predictable time but without time limit (e.g. we could predict the execution time of batch jobs according to the job files), and need to be finished in predictable time and within designated windows (e.g. for the production order, the delivery time is given in the order, and we can determine the starting time by estimation). In this article, we assume that any kind of MR/Cs could only service manufacturing tasks in one mode.
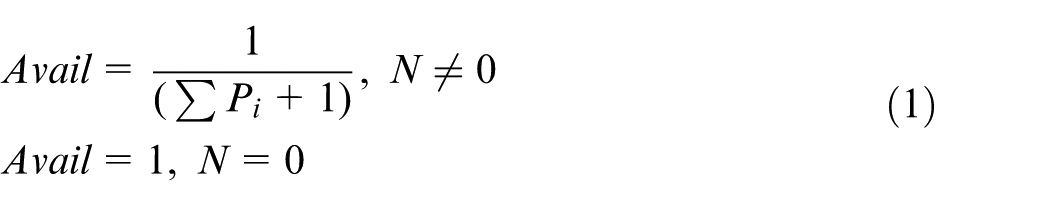
Manufacturing tasks with unpredictable finishing time
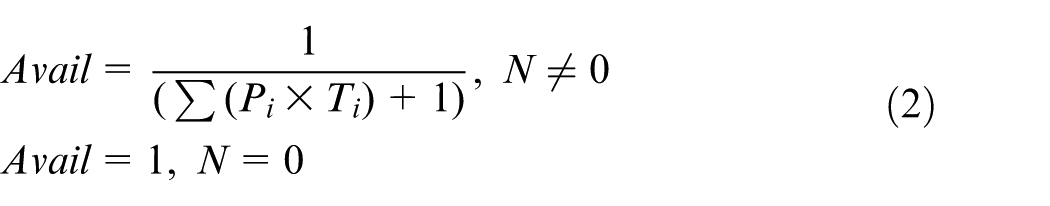
If there are no enough physical MR/Cs left, the incoming manufacturing tasks have to wait in queue. It is easy for the management middleware to know the queue length N and the expected amount P of the requested virtual MR/C instances. Then, the availability of MR/Cs can be calculated as
Manufacturing tasks with predictable finishing time but no time limit
If there are no enough physical MR/Cs left and the finishing time of the current manufacturing tasks is predictable, we can know how long the incoming manufacturing tasks have to wait in queue. It is easy for the management middleware to know the queue length N and the expected quantity P of the requested virtual MR/C instances and the execute time (predicted to be T) of each manufacturing task in the queue. Then, the availability of MR/Cs can be calculated as
Manufacturing task with predictable time and designated windows
No matter whether there are enough physical MR/Cs left currently, we have to look for and reserve MR/Cs for these kinds of manufacturing tasks within designated windows; otherwise, it will affect the execution of their succedent processes and the subsequent tasks reserved in calendar.
It is easy for the management middleware to know the length
Collaborative cost of MR/Cs
The collaborative cost of MR/Cs possibly includes the cost of the logistics transportation in collaborative production and the cost of the business synchronization in collaborative R&D (measured by the weighted sum of network bandwidth and network latency c = α × Bandwidth + β × Delay). The greater the indicator, the higher the collaborative cost, and vice versa. Usually, in order to simplify the problem, we assume that the collaborative cost equals to zero if the collaborative MR/Cs are in the same management center; in order to avoid the influence of the dimension, we use the ratio of real collaborative cost to max collaborative cost between the same collaboration of MR/Cs instead of the absolute value.
Global optimization model for the MR/C allocation under the multi-centric architecture
Global optimization model
Usually, the MR/Cs for sub-tasks could be accessed from several centers. Then, the mathematical model could help us to find out the global optimized allocation of the MR/Cs by scheduling the sub-tasks to optimal centers.
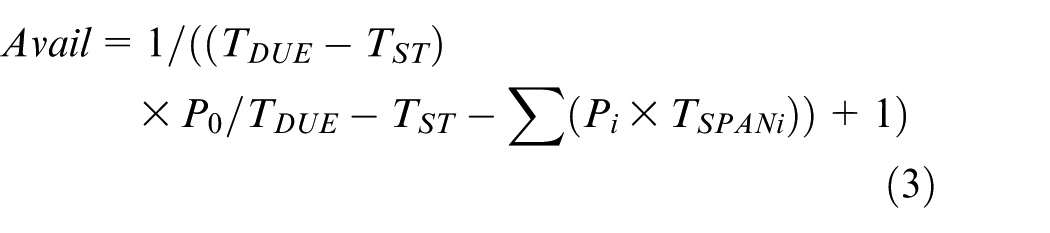
We assume that there are M sub-tasks and N centers, and each sub-task could only be scheduled to a center. We define the vector for the center selection in equation (4) as XT. XT equals to
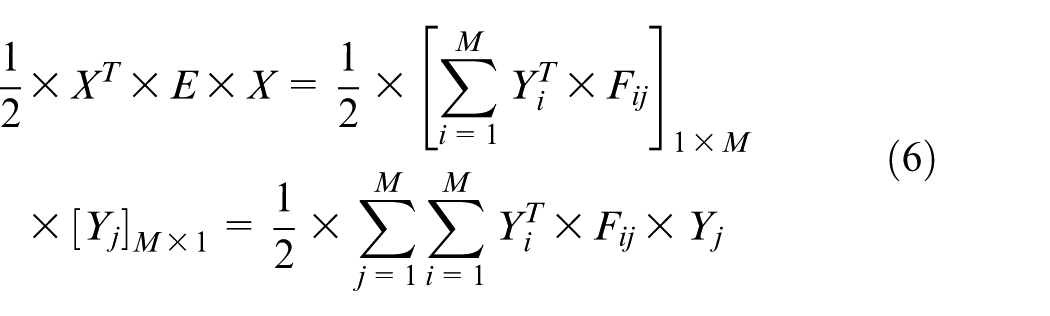
The objective function is designed to be the weighted sum of the cost for acquiring the MR/Cs (the availability of MR/Cs) and the cost of the collaboration between the chosen MR/Cs for the sub-tasks in different manufacturing clouds.
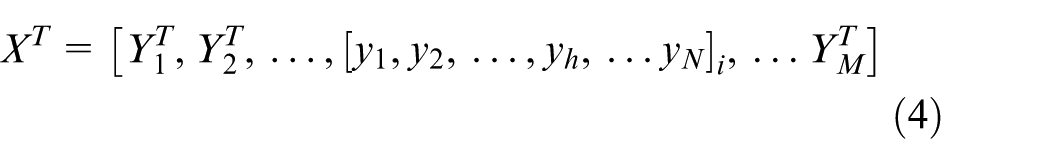
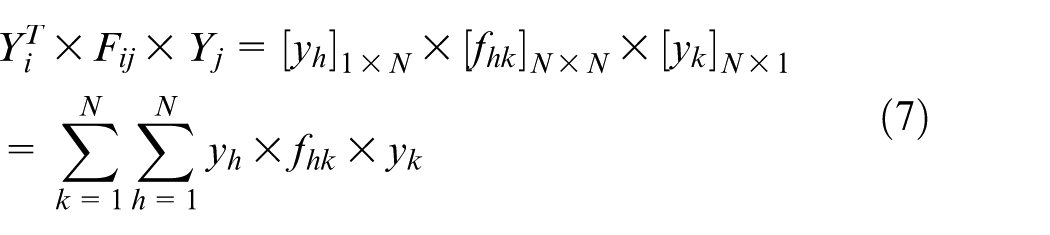
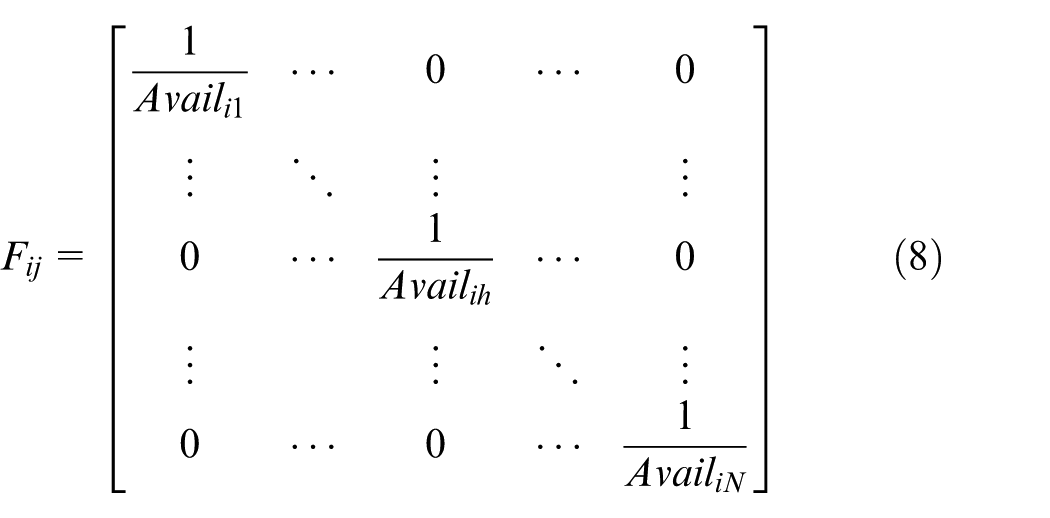
We define the matrix for evaluating the costs in equation (5) as E. E equals to [Fij] M × M , in which Fij equals to [fhk] N × N , then the objective function is expressed as (XT × E × X)/2 in equations (6) and (7). The value of Fij and fhk is shown as follows
1. If i equals to j,
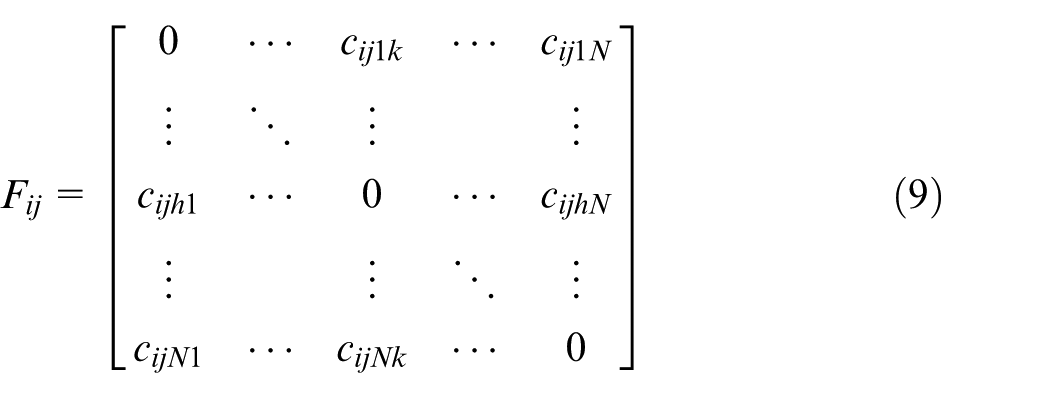
2. If i does not equal to j,
Obviously, if the weight is not considered for the moment, the objective function is composed of
We refine the model from three aspects:
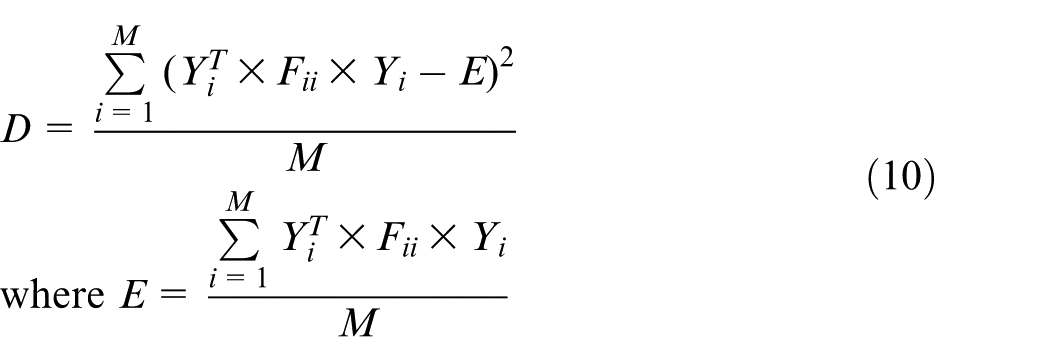
1. Use the variance to present the dispersion degree of the cost for acquiring MR/Cs shown in equation (10). The variance is added into the objective function, so that the smaller the variance, the smaller the objective function will be. This means the availabilities of MR/Cs assigned to sub-tasks are roughly the same to avoid the severe waiting of collaborative sub-tasks for each other
2. Set the maximum acceptable cost of the remote collaboration as cmax, which represents the maximal acceptable cost of logistics transportation or business process synchronization and is a constraint of the global optimization model.
3. Set the factor ω1 and (1 − ω1) to reflect different weight of the availability and the remote collaboration cost for global optimized allocation of MR/Cs.
The mathematical model for the multi-centric global optimized allocation can finally be expressed as follows
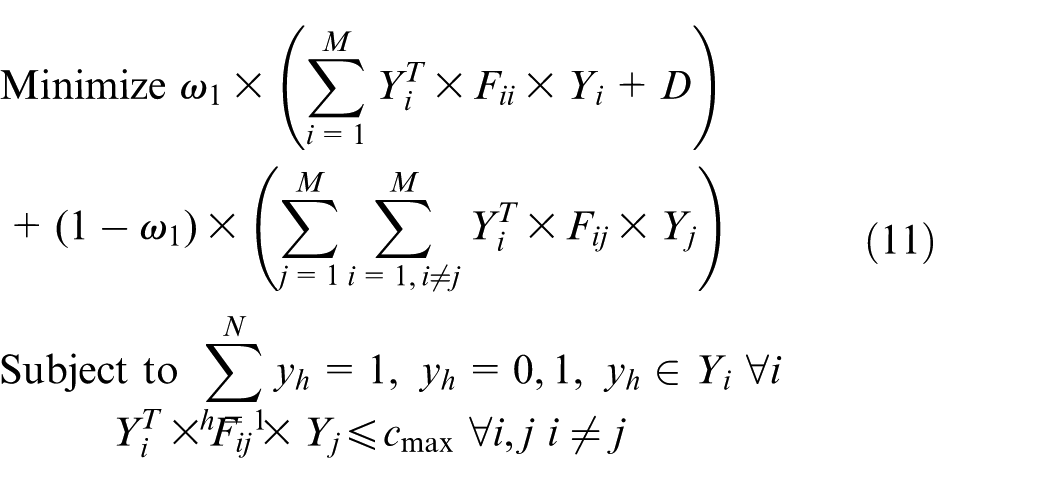
In the objective function, we use
Complexity analysis and solving algorithm
We first analyze the complexity of the model. The mathematical model for multi-centric global optimized allocation is designed to allocate the M sub-tasks to N centers; the size of the solution space (not the feasible space) is NM. For the given M sub-tasks, the problem complexity is O(nM), which means the problem has the polynomial complexity. For the given N centers, the problem complexity is O(Nn), which means the problem has the index complexity. The later problem is a NP-hard problem, because we cannot find a feasible solution of the (most common) model and validate whether the solution is optimal in polynomial time.
Certainly, a NP-hard problem is not an insoluble problem, because the numbers of sub-tasks and centers are usually limited. Take five sub-tasks and three centers as an example: the size of the solution space is only 243. But when we have 10 sub-tasks and 5 centers, the size of the solution space will sharply increase to 9,765,625. In this case, the intelligent optimization algorithm should be adopted. 29 Otherwise, solving the model will only cost a lot of time, let alone the time taken by the negotiation and collaboration among centers. In this article, we will only discuss the algorithm construction based on the particle swarm optimization (PSO) algorithm. The concrete solving process will be omitted.
(a) Particle construction
If we directly use the vector for the center selection, the formula (4) as the particle encoding, as each element of the vector is either 1 or 0 and the sum of those N elements must be 1 (a sub-task could be assigned to only one center), there will be too many constraints on particle flight. So, we redesign a vector (the particle location) with only M elements shown in equation (12)
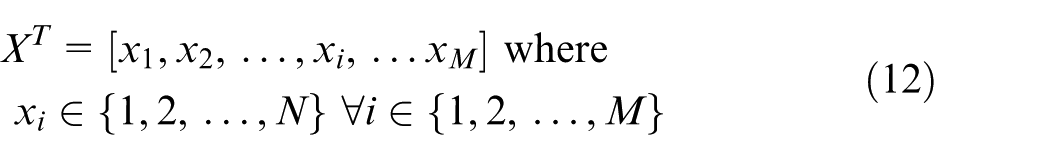
When calculating the particle fitness, we only need to execute the following decoding: xi corresponds to
In addition, we define another vector with M elements to present the particle velocity shown in equation (13). vmax is the limit of ith element of the velocity. If vmax is too large, the search accuracy of particles is not enough so that the optimal solution will be easily missed. If vmax is too small, particles will easily fall into local search

(b) Particle flight
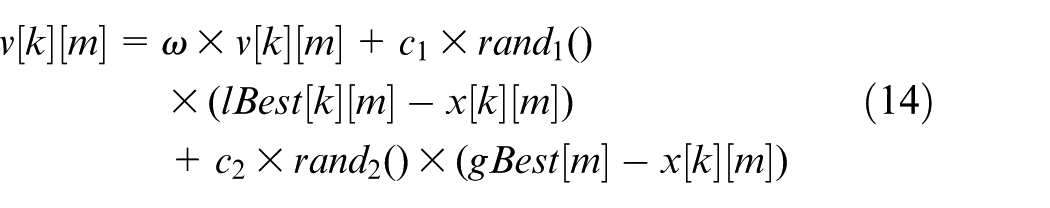
We assume that there are K individuals in the particle swarm, and several arrays were defined as follows. (1) x[K][M] represents the mth location component of the kth individual. (2) v[K][M] represents the mth velocity component of the kth individual. (3) lBest[K][M] represents the mth component of the best historical location of the kth individual; gBest[M] represents the mth component of the global best historical location.
The flight velocity update method of kth particle’s mth velocity component is shown in equation (14), 30 where ω is the inertia weight, c1 and c2 are the acceleration constants
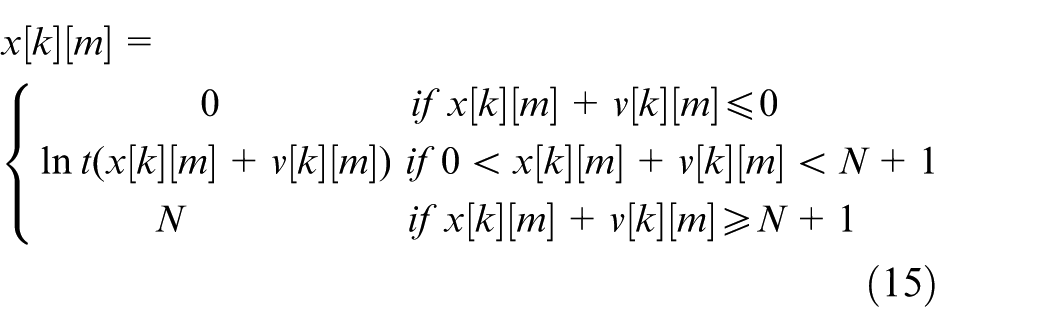
The value of location component must be an integer from 1 to N, so the location update method of kth particle’s mth location component is defined in formula (15), lnt() is the rounding function
Application example
Application background
The proposed methodology has been applied to the collaborative production for aerospace complex products shown in Figure 4. The data come from one big manufacturing factory for complex products.
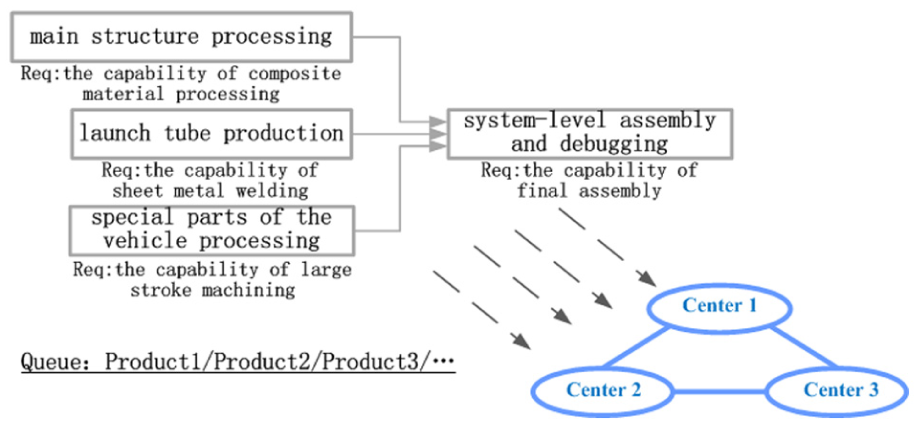
Collaborative production for aerospace complex products.
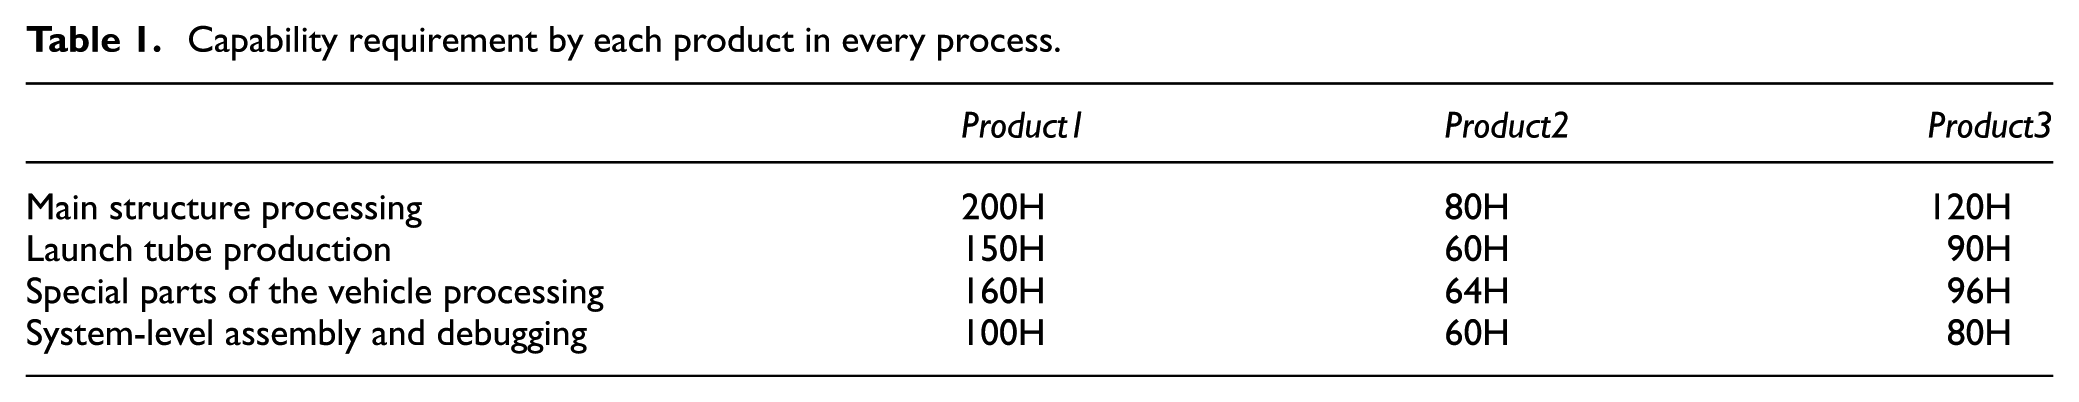
After proper simplification, the case involves three kinds of aerospace complex products. The manufacturing of each product has four similar processes, including main structure processing, launch tube production, processing of special parts for vehicles, system-level assembly and debugging. The main structure processing requires the capability of composite material processing; the launch tube production requires the capability of sheet metal welding; the processing of special parts for vehicles requires the capability of large stroke machining; the system-level assembly and debugging require the capability of final assembly. The capability requirements of each product in every process are shown in Table 1. Each element in the table represents the (TDUE − TST) × P0 in formula (3).
Capability requirement by each product in every process.
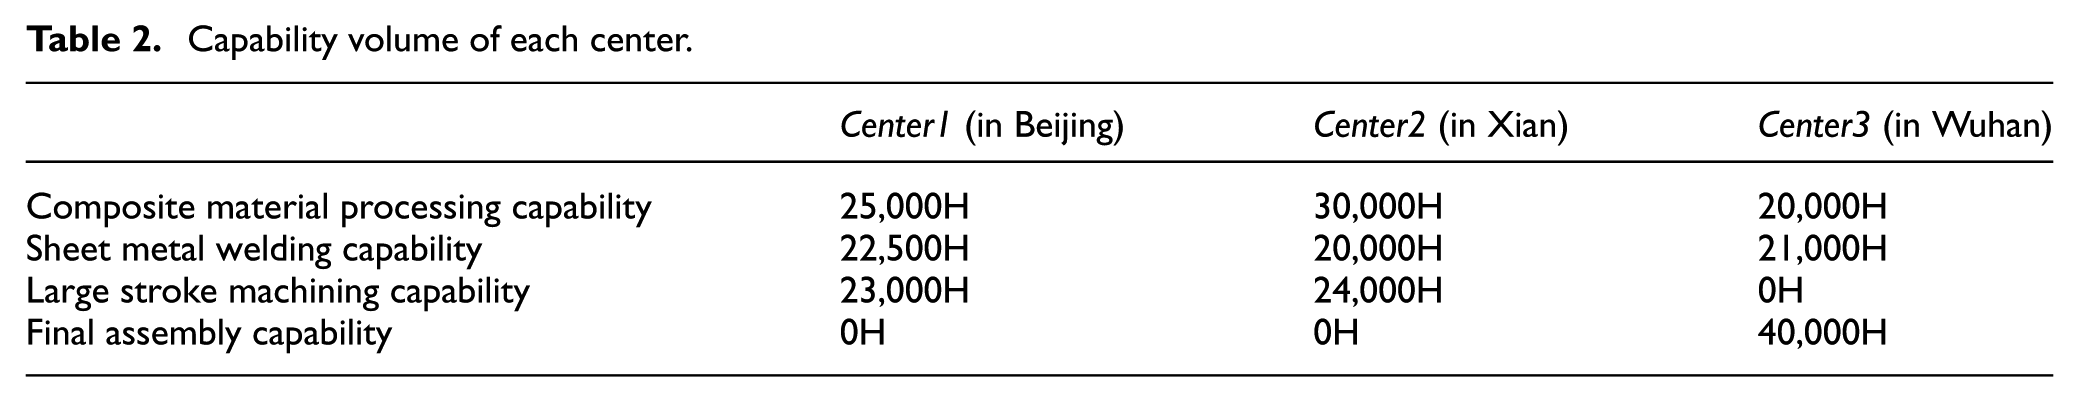
In addition, the case involves three management centers which are located in Beijing, Xian and Wuhan, respectively. The capability of each center is shown in Table 2. Each element in the table represents the TDUE − TST in formula (3). In this case, formula (3) would be used to calculate the availability of MR/Cs.
Capability volume of each center.
Moreover, the collaborative costs between the main structure processing and the system-level assembly and debugging are shown in Table 3; the collaborative costs between the launch tube production and the system-level assembly and debugging are shown in Table 4; the collaborative costs between the processing of special parts for vehicles and the system-level assembly and debugging are shown in Table 5. The meaning of each table is defined by formula (9), and the dimensionless values of these costs in the tables denote the ratios of real values to maximum values that belong to the same kind of cost. The collaborative cost needs to be multiplied by the corresponding scale coefficient (SC) for different products
Collaborative cost between main structure processing and system-level assembly and debugging.
Collaborative cost between launch tube production and system-level assembly and debugging.
Collaborative cost between special parts of the vehicle processing and system-level assembly and debugging.
The case is simplified in order to ignore the minor factors. We assume that the time window of the corresponding process overlaps completely (to ignore the calendar traversal). We also assume that any process of a product should only be done by the capability of one management center; all of the tasks are submitted to the management center in Wuhan, and the system-level assembly and debugging and delivery would be in Wuhan, so the capability of the system-level assembly and debugging in other centers are all set as 0; the large stroke machining capability in the Wuhan center is set as 0, so that at least one process should be done in other centers.
Considering the stochastic factors, the number of tasks of each product was randomized independently (uniform distribution). The range of randomization is between 20 and 100 in which 20 is the minimum production lot and 100 is the maximum production lot.
Result comparison
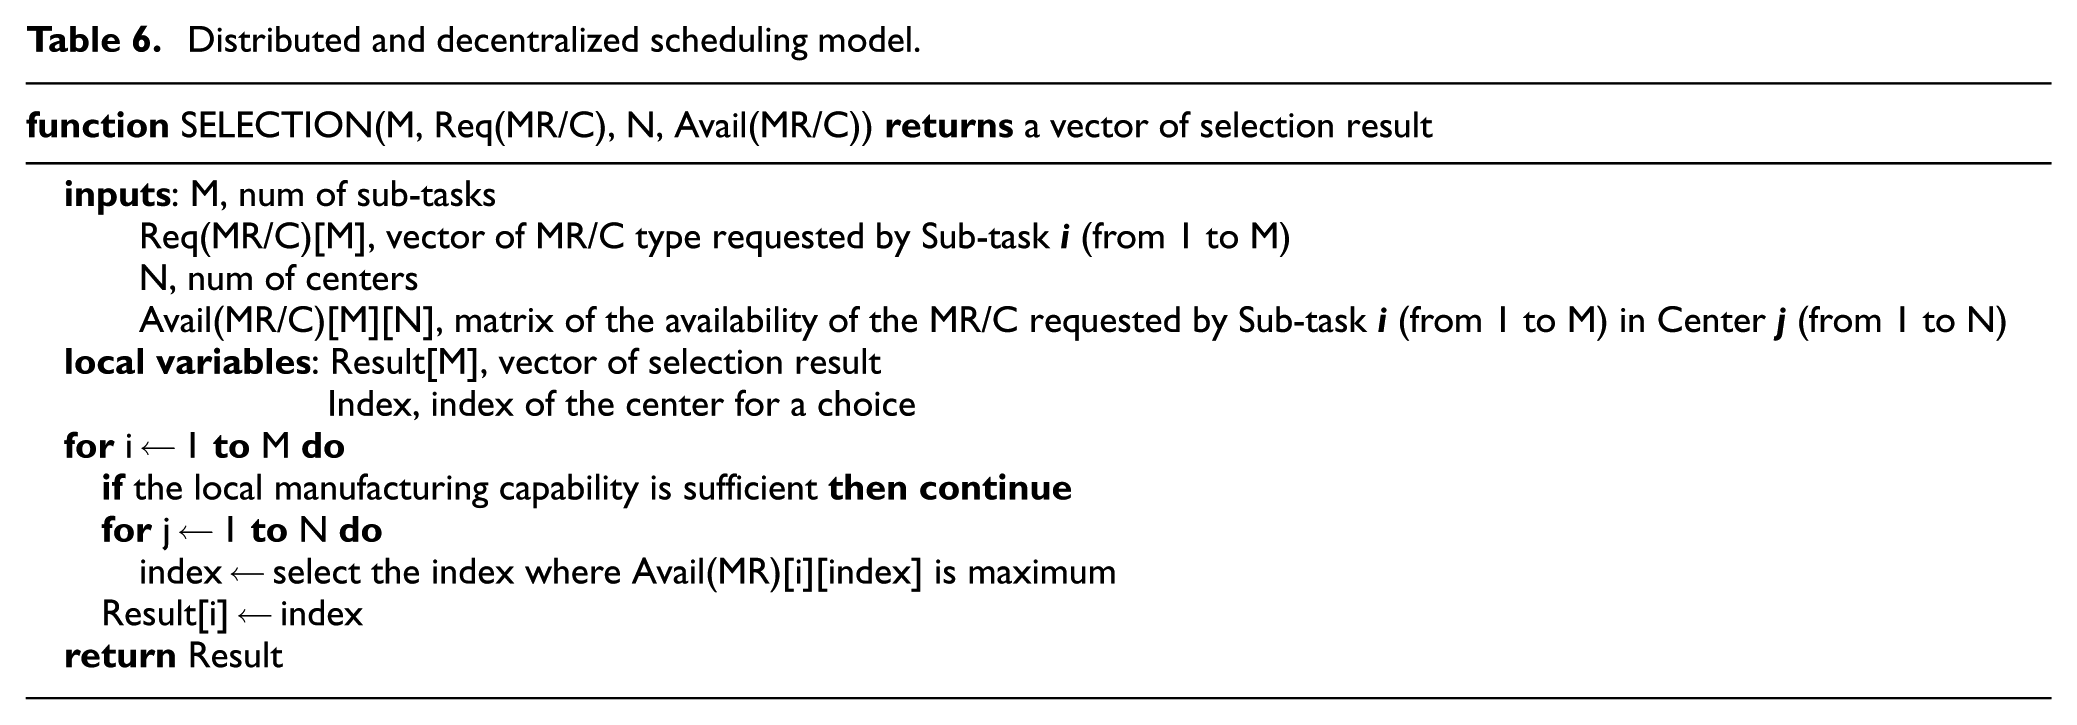
In the following part, we will compare the results of the proposed model and the distributed and decentralized scheduling model (the primary-standby centralized scheduling model basically has the single-centric architecture, so it is not considered in this part). The latter model (shown in Table 6) prefers to choose the local manufacturing capability and another center which has the most remaining manufacturing capability will be considered only when the local manufacturing capability is insufficient. In addition, the latter method does not take the collaboration cost into consideration.
Distributed and decentralized scheduling model.
The experiment results will be compared in two aspects: the utilization balance of manufacturing capability and the total cost of collaboration. The details are presented in the last paragraph of section “Global optimization model.”
The results are compared by subtraction, as in equations (17) and (18)
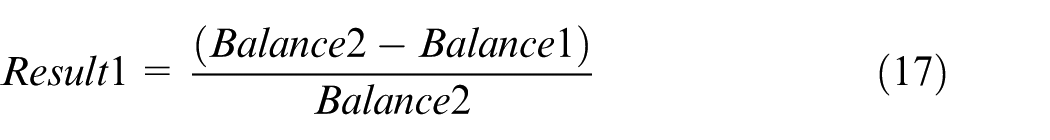
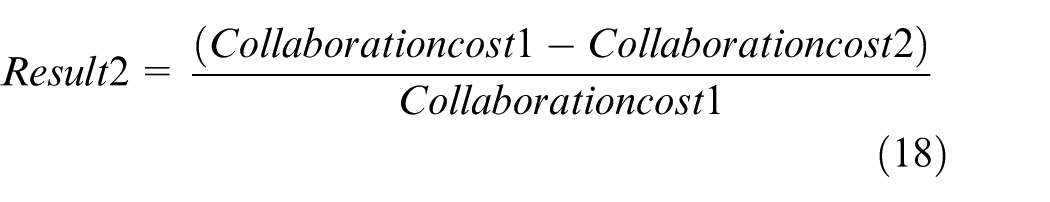
Where Balance1 and Collaborationcost1 are the utilization balance and total collaborative cost of the comparison model, respectively; Balance2 and Collaborationcost2 are the utilization balance and total collaborative cost of this article’s model, respectively.
Experiments are conducted when ω1 (shown in (11)) ranges from 0 to 1 (increment is 0.01), and each experiment is conducted 100 times randomly. Note that the optimized allocation results of the distributed and decentralized management model are independent of ω1.
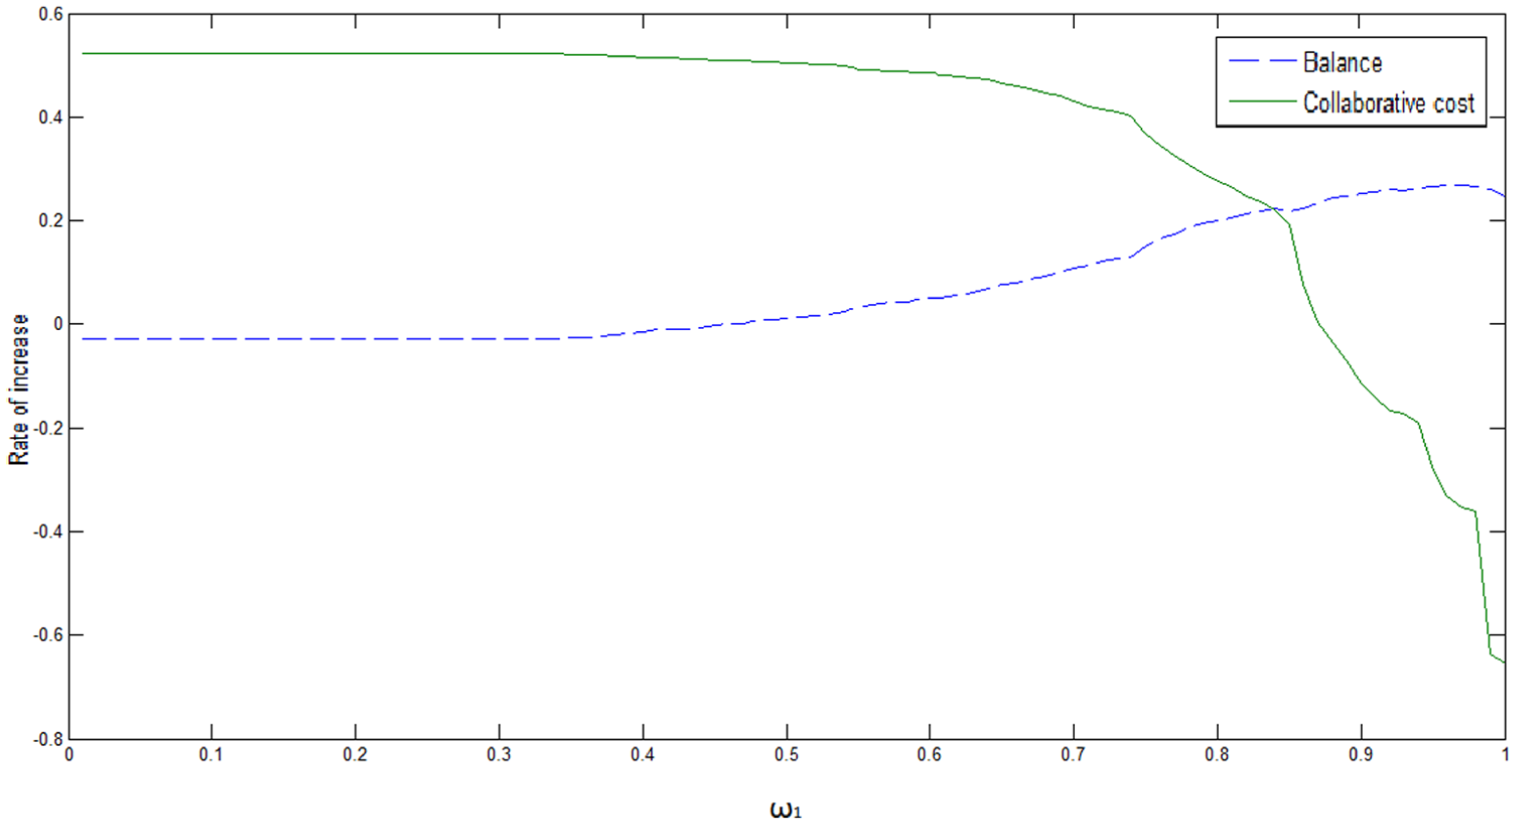
Experiments are designed with two different inputs: the first input is the task of product 1 and product 2 and the result is shown in Figure 5; the second input is the task of product 1, product 2 and product 3 and the result is shown in Figure 6. In Figures 5 and 6, the horizontal ordinate presents ω1 (shown in (11)), and the vertical ordinate presents the comparative result of Balance and Collaborationcost.
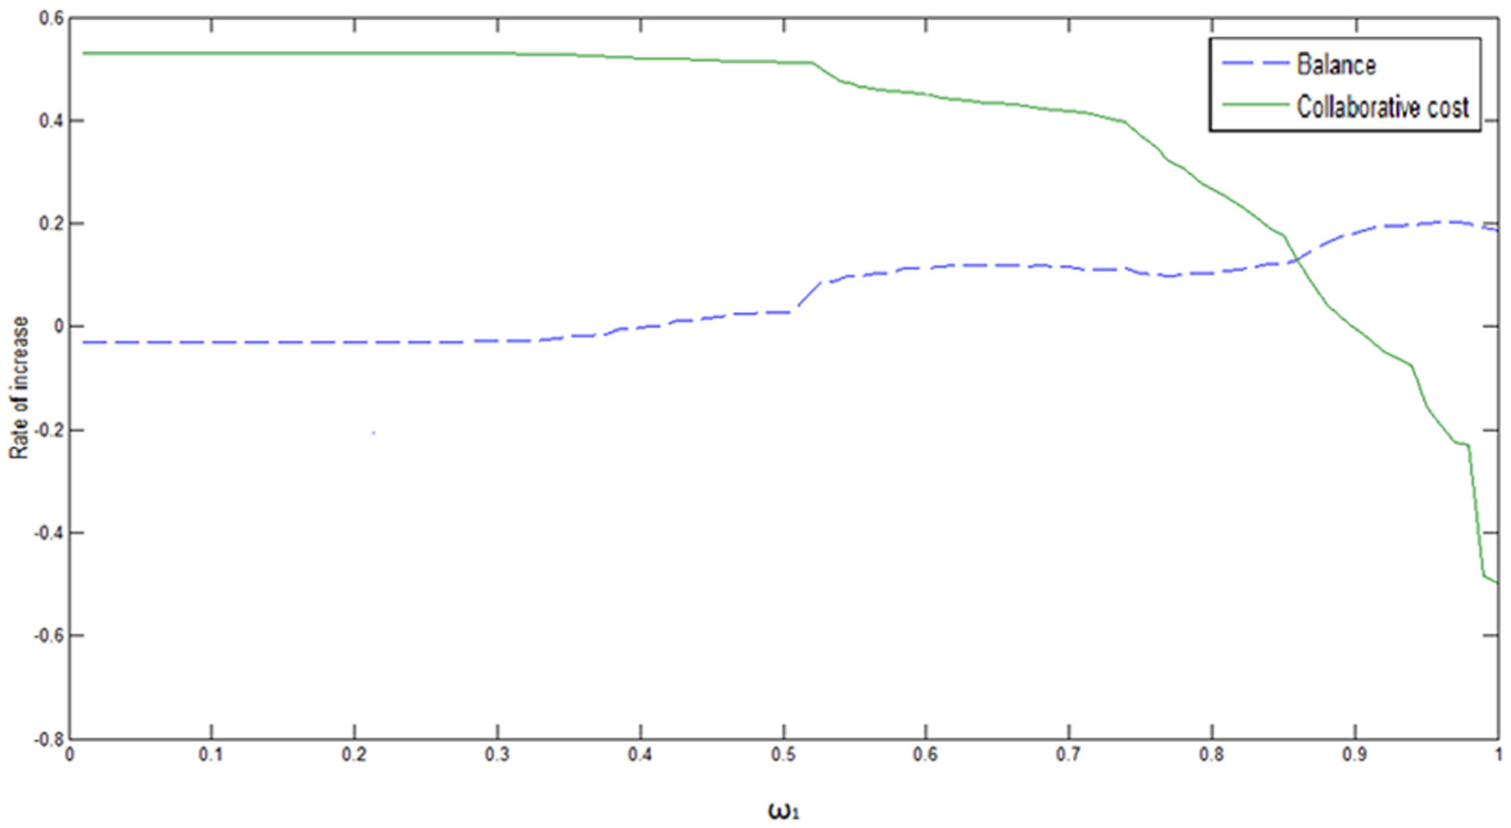
Results comparison 1 (input: task for two kinds of products).
Results comparison 2 (input: task for three kinds of products).
From each figure, we can conclude that when ω1 approaches 0, this article’s model mainly focuses on minimizing the collaboration cost and compared with the existing distributed and decentralized model, the cost decreases by 50% with almost the same utilization balance. In the case that local MR/Cs are insufficient, the compared model’s balance is a little higher than that of this article’s model because its policy to choose another center is favorable to balance.
When ω1 approaches 1, this article’s model mainly focuses on maximizing the utilization balance, which increases by 20% than the existing model, but the collaboration cost augments so fast that it could be 30% higher than the existing model (for the latter model, the local MR/Cs are assigned with high priority and the collaborative cost inside one center is neglected, so it is advantageous in the collaboration cost).
No matter the input tasks are two or three kinds of products, in the interval ω1∈(0.45, 0.85), both the balance and collaboration cost of this article’s model are better than the existing model. In fact, these two indicators are mutually exclusive, so we compromise ω1 to make them optimal.
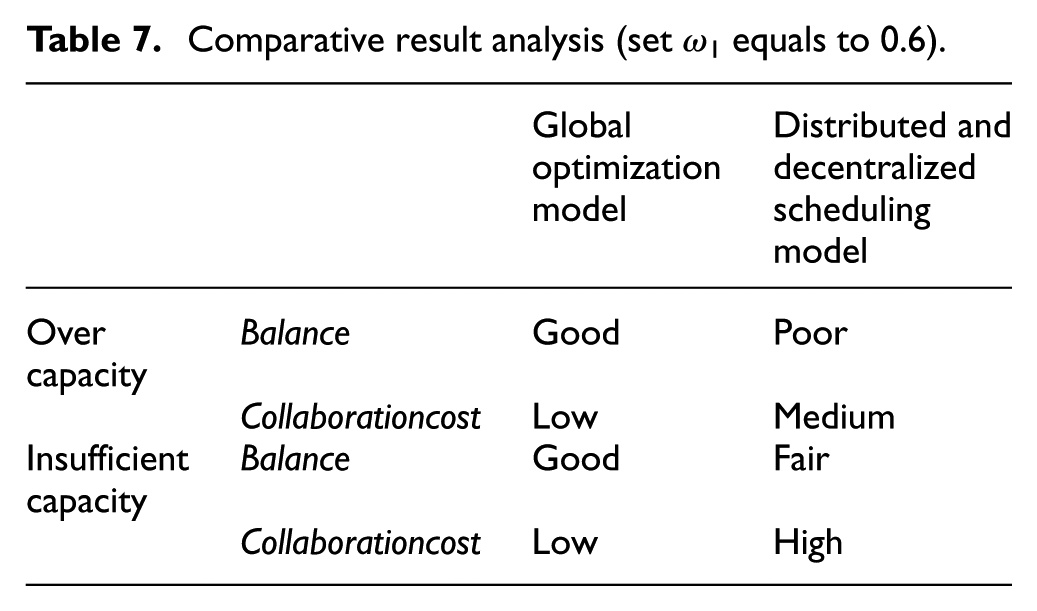
From the two figures, we can see that when the amount of requested products in the input manufacturing task increases, the local MR/Cs would be insufficient so that the existing distributed and decentralized model has to get the left requested MR/Cs from other centers, improving the balance of the MR/C utilization. Hence, when ω1 tends to 1, the balance of this article’s model does not augment as fast as the existing model. As the existing method neglects remote collaboration cost, from the perspective of the total collaborative cost, this article’s model has very good performance. We made a comparison on the performance (Balance and Collaborationcost) of the two models, as shown in Table 7. The option of performance Balance includes good, fair and poor; and the option of performance Collaborationcost includes high, medium and low.
Comparative result analysis (set ω1 equals to 0.6).
Other discussions
In fact when applying the methodology proposed in this article to practice, more complex factors need to be taken into account. First, the available amount of MR/Cs is variable due to the different working modes and status, Figure 7 is an example of variable amount of MR/Cs. Second, the execution of task hardly overlaps, and the assignments of every task should be recorded in the R/C calendars, because when a new task arrives, its assignment will depend on those calendars. Moreover, the operational failures and errors will lead to perturbation of spread, 31 and as a result, the associated tasks in the execution or pending queue will be reassigned and more calculation will be needed. In addition, some other factors like vendor inventory management (VIM), back order, will enrich the diversity of management and will affect the assignment based on calendars.
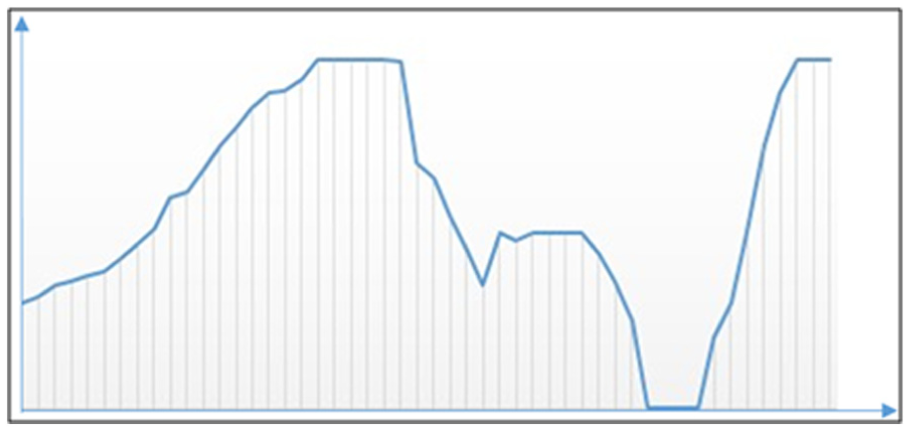
Availability curve of MC services.
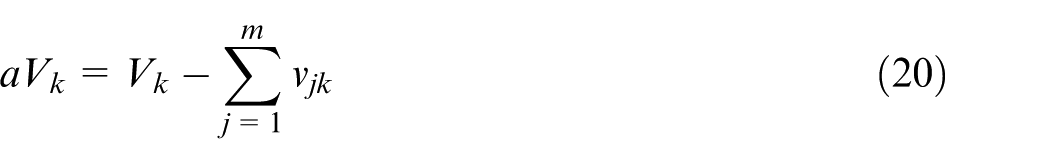
We define a matrix shown in equation (19) to present the MR/Cs’ utilization in the period of
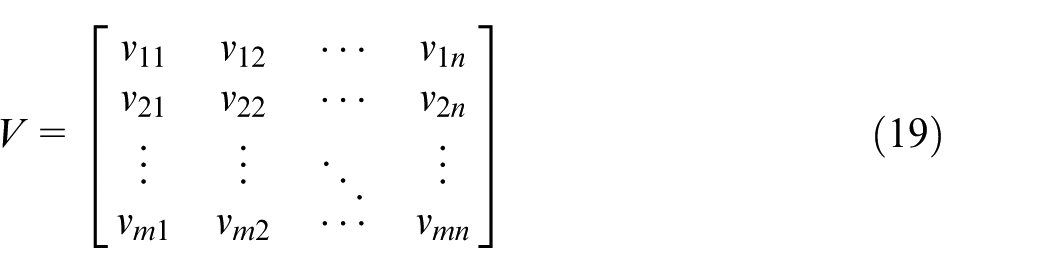
The vector
We assume that we have N requests to an MR/C with their expecting amount
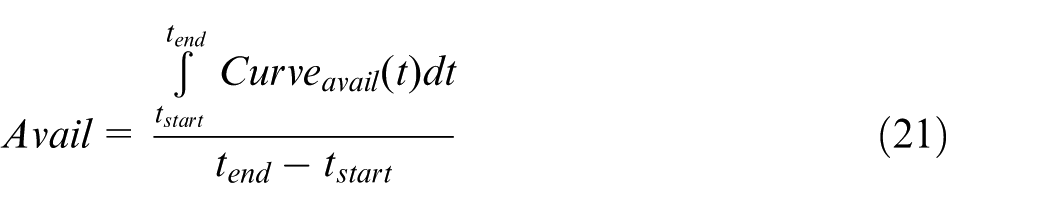
As we discussed, the factors like VIM, back order, will enrich the diversity of management. Regarding to the VIM, the ideal state of MR/C service consumers is zero stock and MR/C service providers also need to realize lead production as much as possible; regarding to the latter, if the back order is permitted, the production arrangement can ignore the time limit at some level. These factors can influence the calculation of Avail.
Conclusion and future work
CMfg integrates massive, widely distributed MR/Cs for sharing and operation, and it should optimally have multiple centers. Most related research assumes that there exists only one management center for all MR/Cs in a manufacturing cloud, but this could not satisfy the demands for high efficiency and QoS, especially in a large-scale manufacturing cloud. Although the multi-centric architecture in cloud computing is not rare (e.g. federated clouds) and its management methods are worth learning, there are lack of considerations for the constraint of limited MR/Cs and the cost of remote collaboration.
To address this issue, we first propose the architecture for the multi-centric management. The solution adopts a two-level scheduling strategy that combined the advantages of the centralized and the decentralized decision-making. Considering the special characteristics of manufacturing cloud and manufacturing tasks, we also put forward the methods to quantify the availability and the collaborative cost of MR/Cs systematically. Then, we propose a global optimization model for the MR/C allocation under the multi-centric architecture. The application example shows that the proposed methodology could achieve more balanced utilization of the MR/Cs and lower cost of the total collaboration, compared with the typical decentralized solution.
Our future works will be as follows:
Analyze the bound of the global optimization model, and do more research on the scalability of the problem;
Improve the flexibility of the optimized allocation which will select the most appropriate MR/Cs instead of the best performance ones to serve mass users;
Start with the reliability design for the disturbance processing and fault tolerance in the multi-centric management.
Footnotes
Declaration of conflicting interests
The author(s) declared no potential conflicts of interest with respect to the research, authorship and/or publication of this article.
Funding
The author(s) disclosed receipt of the following financial support for the research, authorship, and/or publication of this article: This work is financially supported by National Key Lab in Intelligent Manufacturing System Technology of Complex Product, Beijing Engineering Technology Research Center in Advanced Manufacturing System of Complex Product, the National 863 Plan (2015AA042101), the National Natural Science Foundation of China (grants 51522501 and 51475032), Beijing Natural Science Foundation (grant 4152032), Beijing Youth Talent Plan (grant 29201411) and the Fundamental Research Funds for the Central Universities in China.