
Abstract
Turn milling is one of the machining processes used to mill circular work pieces while the work piece rotates about its own axis. Orthogonal milling is one of the turn milling processes where the bottom part of cutter removes material from the rotating work piece with high metal removal rate. In this article, tool condition was studied by analyzing surface roughness and vibration of cutter with the use of response surface methodology. According to design of experiments, 16 experiments were conducted on ASTM B139 phosphor bronze with high-speed steel end mill cutter on four-axis milling machine. The response surface methodology was used to find out significant parameters that are affecting surface roughness and amplitude of cutter vibration. A multi-response optimization technique was used to identify optimum cutting parameters for less surface roughness and amplitude of cutter vibration.
Keywords
Introduction
Milling is one of the widely used processes for high metal removal rate and production of complex shapes. Turn milling was defined by Sandvik Coromant as “the milling of a curved surface, where the work piece is rotated around its center point using a fourth machining axis.” 1 The turn milling process is a new technology in manufacturing process, where the rotary tool is moved against the rotating work piece. 2 There are two types of turn milling processes: orthogonal turn milling and tangential turn milling. As shown in Figure 1, work piece is fixed in the chuck of the machine, a mill cutter is fixed to the spindle of four-axis milling machine and the rotating cutter is applied against the rotating work piece to remove material from the surface work piece. Turn milling process is a new technology that combines two conventional machining processes like turning and milling. 3 This new technology is an alternative process that gives improved productivity especially in machining of hard and large diameter work pieces.
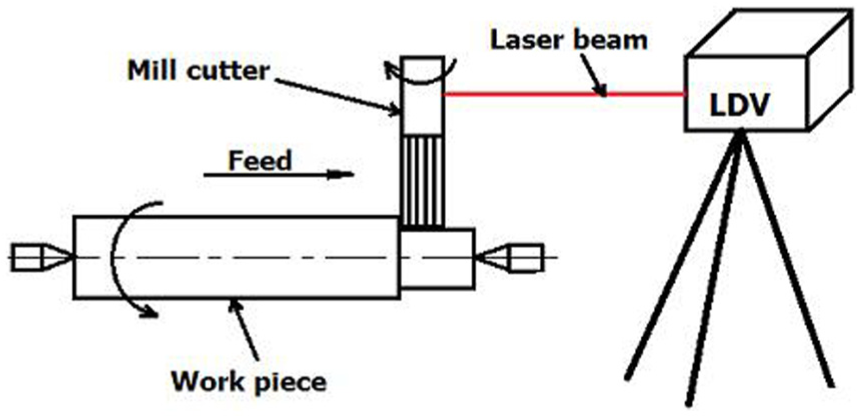
Orthogonal milling on turn mill center (four-axis milling machine).
Functional performance and life of a machined component are greatly affected by surface quality. Surface roughness is one of the important parameters that is to be controlled during machining by controlling cutting parameters. It is the responsibility of manufacturer to produce components with good surface quality because the surface quality is the prime requirement of consumer. Surface roughness is having small wave length of surface irregularities. These surface irregularities or roughness is produced by different factors like geometry of cutting tool, tool feed rate, tool vibration and tool wear. To obtain good surface quality, these factors must be controlled for prediction of surface quality.
Many authors reported that there is a correlation between surface roughness and vibrations of cutter in any machining process. Lin and Chang 4 and Kirby et al. 5 found a strong correlation between vibrations and surface roughness in turning process. In metal cutting, there is a relative motion between work piece and cutting tool. The cutting tool is getting dynamic excitation due to deformation of metal that results in vibration of tool. The relative motion and vibration of tool affect the surface quality of the product. These vibrations are to be maintained minimum to reduce surface roughness and tool wear. Vibration is defined as the repetitive motion of an object or objects relative to a stationary frame referred to as the equilibrium of the vibration. Vibrations are measured in terms of displacement, velocity or acceleration.
There are two types of sensors used to measure vibration of cutter and work pieces: contact and non-contact sensors. The use of contact sensors is the most commonly used technique today to measure vibration of cutting tool or work piece in machining process. The contact sensors are placed on stationary heads of cutters and work pieces to measure their vibration. But it is difficult to measure vibration of rotating cutter like mill cutter and work piece in turning process. Tatar and Gren 6 stated that the measurement of spindle and tool vibration is more important for tool condition monitoring in high-speed milling process. Since the vibration of mill cutter is a result of relative motion between work piece and tool, it is required to measure vibration of cutter as close as to machining. They have used laser Doppler vibrometers (LDVs) to measure vibration of mill cutter. In recent applications, LDVs are used as non-contact methods to measure vibration of cutting tool or work piece accurately. The LDV is capable of giving reliable information of tool vibration. 7
LDV was developed by Yeh and Cummins 8 as the measuring process involves measuring the Doppler shift of the laser radiation that is scattered by the moving particles. Later, this technique was developed as LDV. Sriram et al. 9 discussed the use of LDVs in the field of light weight structures. Frequency domain of LDV output signal is scanned to obtain deflection shape of the vibrating structure. Rantatalo et al. 10 have used the LDV in milling process to measure vibrations of rotating arbor in horizontal milling machine. Venkatarao et al. 7 have used LDV to measure vibration of rotating work piece in boring of steels on horizontal computer numerical control (CNC) lathe machine. Prasad et al. 11 have used LDVs to measure vibration of mill cutter in milling process. Fast Fourier transformation (FFT) was used for generating features from an online acousto-optic emission (AOE) signals to develop a database for appropriate decisions. The FFT transforms the AOE signals into time domain with different time frequency zones. In this work, the LDV was adopted for online data acquisition of mill cutter vibration, and a high-speed FFT analyzer was used to process the AOE signals obtained from LDV.
Optimization of cutting parameters is very important in metal cutting in order to produce products in right time with right quality at reduced production cost. Good surface quality and improved tool life can be achieved by the optimization of cutting parameters in any machining process. In tool condition monitoring, different types of techniques and analytical models have been developed for optimization of cutting parameters of cutting speed, feed rate, depth of cut, tool material, tool geometry, type of machining and cutting fluids and so on. Savas and Ozay 2 have used genetic algorithms for optimization of cutting parameters to get good surface quality in tangential milling. They have investigated the effect of cutting parameters such as depth of cut, tool speed, work piece speed and feed rate on surface roughness. They have used the genetic algorithm for each cutting parameter and found optimum cutting parameters for minimum surface roughness.
Different optimization strategies were developed by different researchers using algorithms to optimize cutting parameters. Alberti et al. 12 developed an algorithm-based system to select optimal cutting parameters in conventional as well as high-speed milling process. They have used the algorithm-based system to select optimum parameters for reduction in production time in both conventional milling and high-speed milling operations while ensuring optimal finishing conditions. Optimization of cutting parameters helps to improve production rate by reducing production time with improved tool life and less power consumption. This gives less production time and maximum profit in manufacturing. Baskar et al. 13 have developed optimization strategy with hill climbing algorithm and genetic algorithm for the optimization of parameters in face milling, corner milling, pocket milling and slot milling. They have obtained maximum profit with the help of developed strategy through optimization of cutting parameters. Production cost of a unit is affected by direct and indirect costs. 14 Senthil Kumar et al. 14 have used genetic algorithms to select optimum cutting parameters in order to reduce production cost by improving tool life. They found that the zirconia toughened alumina ceramic cutting tool has more life and it is able to machine at lower production cost.
Sahin 15 has prepared design of experiments with cutting parameters and experiments were conducted according to design of experiments. Signal-to-noise ratios of experimental results were calculated by Taguchi method and analysis of variance (ANOVA) was used to analyze the ratios to identify significant cutting parameter which is having more influence on the tool life. The Taguchi and ANOVA both can give optimum cutting parameters for higher tool life. Response surface methodology (RSM), artificial neural networks and support vector regression were used by Amit Kumar 16 to develop the empirical models for prediction of surface roughness, tool wear and power consumption in turning process.
Turn milling with end mill cutter is a complex task, and there is little work carried out on behavior of cutter vibration in turn milling. Different levels in the cutting parameters affect surface roughness and vibration amplitude. Changes in amplitude of cutter vibration were not studied much. In this work, experiments (turn milling) were conducted on four-axis milling machine on phosphorous bronze work piece with high-speed steed (HSS) mill cutter. A LDV was used for online data acquisition of mill cutter. RSM was used to optimize cutting parameters for minimum surface roughness and amplitude of cutter vibration.
Materials and methodology
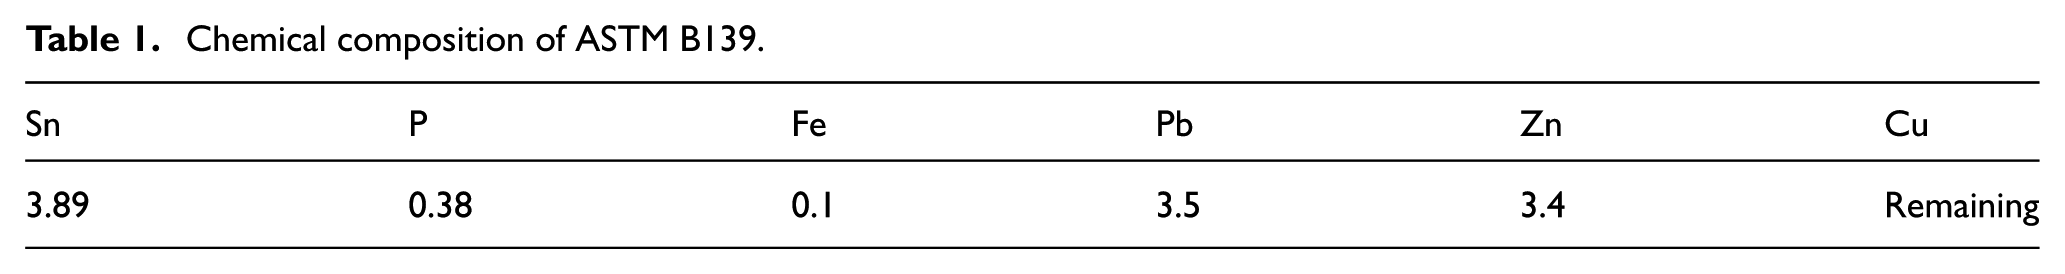
In this work, experiments were conducted on ASTM B139 phosphor bronze metal. It is a Morgan standard alloy and it is used in electrical and industrial applications and so on. Bushings, gears, pinions, screw machine products, thrust washers, valve parts and shafts are made due to its excellent cutting ability. Chemical composition of this material is shown in Table 1, and it has machinability rating of 80 on 100-point scale.
Chemical composition of ASTM B139.
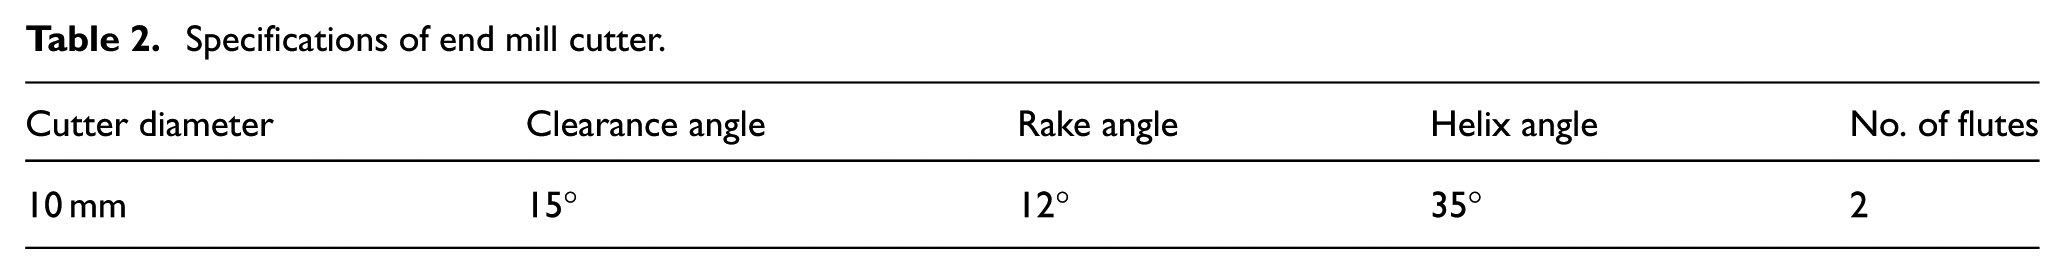
HSS mill cutter was used in this work to perform turn milling on the phosphor bronze work piece. The end mill cutters are having cutting teeth at one end as well as on the sides. Specifications of the end mill cutter used in this work are given in Table 2.
Specifications of end mill cutter.
RSM was used in this article to find out relationship between one or more output variables (dependent or response variables) and a set of input variables (independent variable or experimental factors). RSM model is used to optimize cutting parameters, to identify significant cutting parameter that affects the machining characteristics like surface roughness and mill cutter vibration.
A prediction model was developed by Choudhuri and El-Baradie 17 using RSM for prediction of surface roughness in machining of EN 24T steel. They have conducted dry machining with uncoated carbide inserts and studied the effect of cutting speed, feed and depth of cut on surface roughness. RSM shows effect of individual factors and two factors interaction on the responses and it also identifies significant factors. The RSM combined with factorial design of experiments is a better alternative to the traditional one-variable-at-a-time approach for studying the effects of cutting variables on responses such as surface roughness and tool life.17–20 Sahin and Motorcu 18 studied the effect of cutting parameters such as cutting speed, feed rate and depth of cut on turning of hard material with cubic boron nitride tool. They used RSM to predict surface roughness and a good correlation was found between them.
Bhardwaj et al. 19 have used RSM with center composite rotatable design in turning of AISI 1019 steel to find out influence parameter on surface roughness. Prediction models were also developed for accurate prediction of surface roughness. Feed rate was found as significant parameter on surface roughness, while the depth of cut has no significant effect. In RSM, the quantitative relationship between input and output variables is presented as follows 20
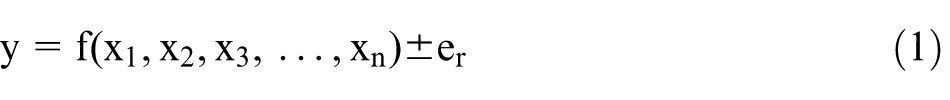
where “y” is the desired response; “f” is the response function, dependent variable; x1, x2, x3, …, xn are independent variables; and “er” is the fitting error.
In this article, according to the central composite design (CCD), 16 experiments have been performed on phosphorus bronze metal.
Experimental work
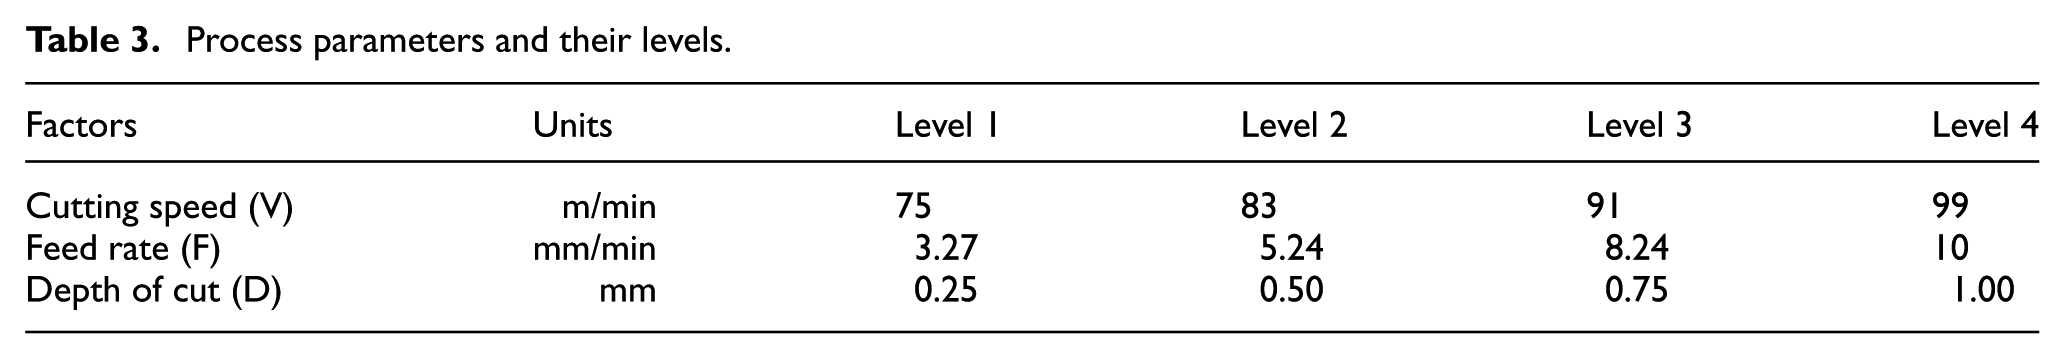
In this work, 16 experiments were performed on four-axis milling machine by varying three cutting parameters such as cutting speed, feed rate and depth of cut. Each parameter was taken with four levels as shown in Table 3. The cutting parameters were assigned to each column and 16 combinations of parameters were given as shown in Table 3.
Process parameters and their levels.
The following sequential procedure was used to carry out the experiment under dry condition. Specifications of the work piece are taken as length of 90 mm, diameter of 50 mm:
Each trial was started with a new cutter with one test condition (trial) and machining was stopped at the end of each pass.
An LDV was placed in front of the machine and the LDV produces a laser beam to the rotating mill cutter to measure vibration signals and the set-up of experiment is shown in Figure 2.
After each pass, the work piece was removed and its surface roughness and hardness were measured.
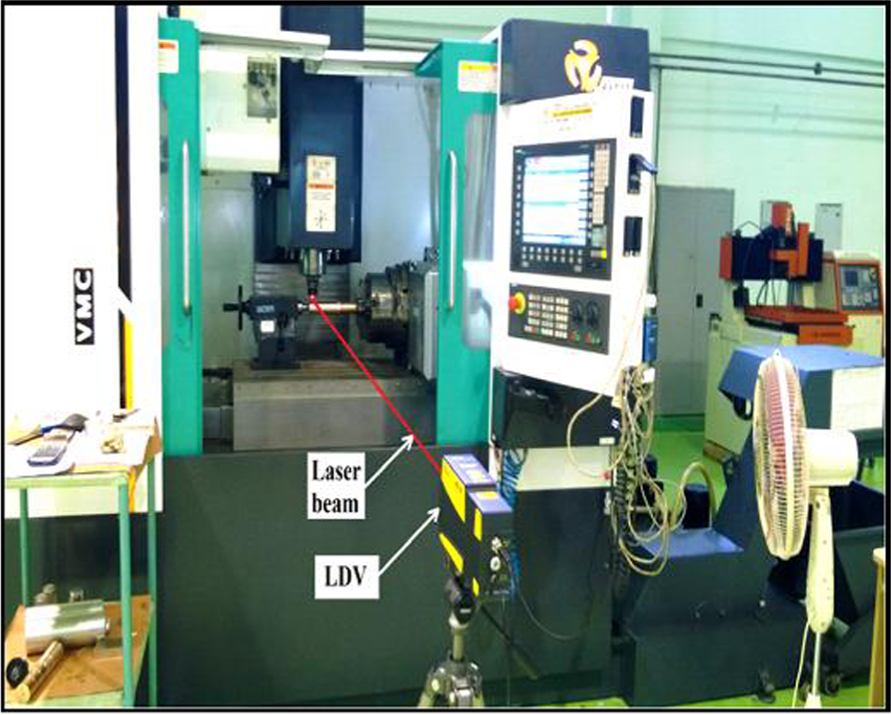
Experimental set-up for orthogonal milling.
The above steps were repeated and remained the same in the experiment with a new cutter.
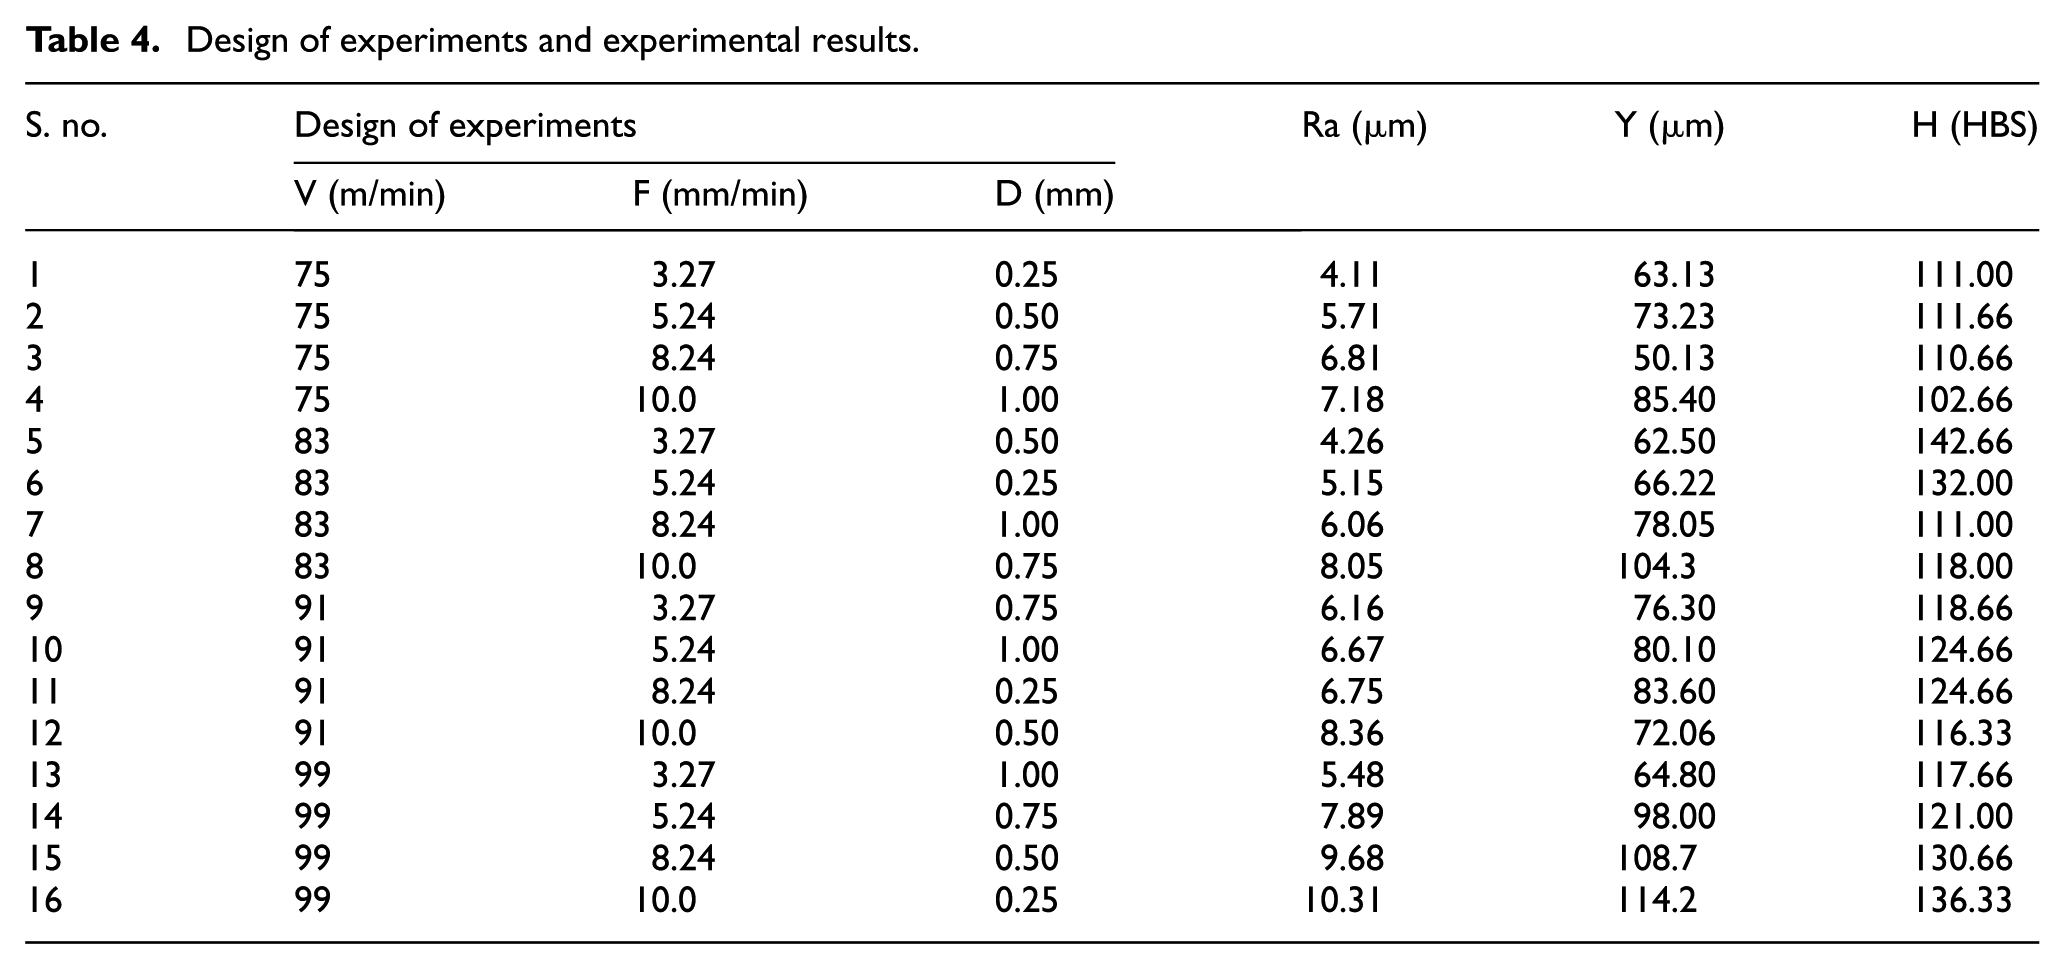
Experimental data of 16 experiments, surface roughness (Ra), amplitude of cutter vibration (Y) and hardness (H) are shown in Table 4.
Design of experiments and experimental results.
Results and discussion
Experimental results of surface roughness, amplitude of cutter vibration and hardness are shown in Table 4. In each experiment, cutter vibration and surface roughness on machined surface were measured in microns.
In this work, LDV was used for online acquisition of cutter vibration data in the form of AOE signals as shown in Figure 3. FFT analyzer was used for generating features from online AOE signals to develop a database for appropriate decisions. The FFT transforms the AOE signals into time domain with different time frequency zones and it helps to find out amplitude of cutter vibration (Figure 4).
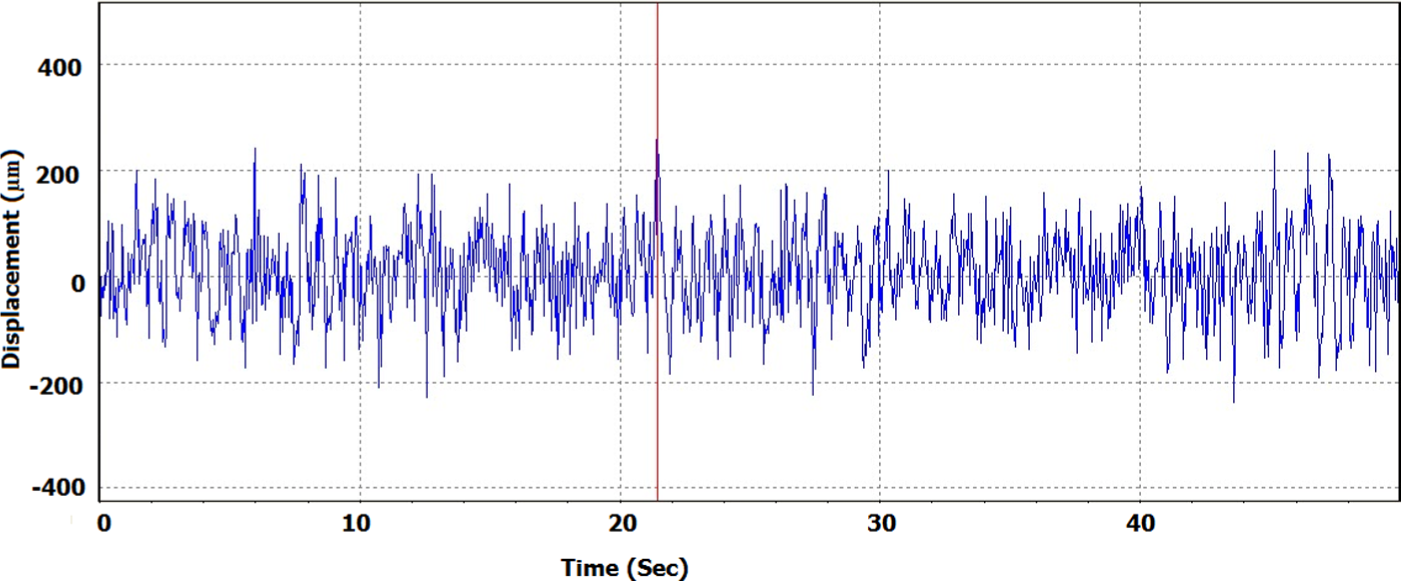
Time domain spectrograph for the first experiment.
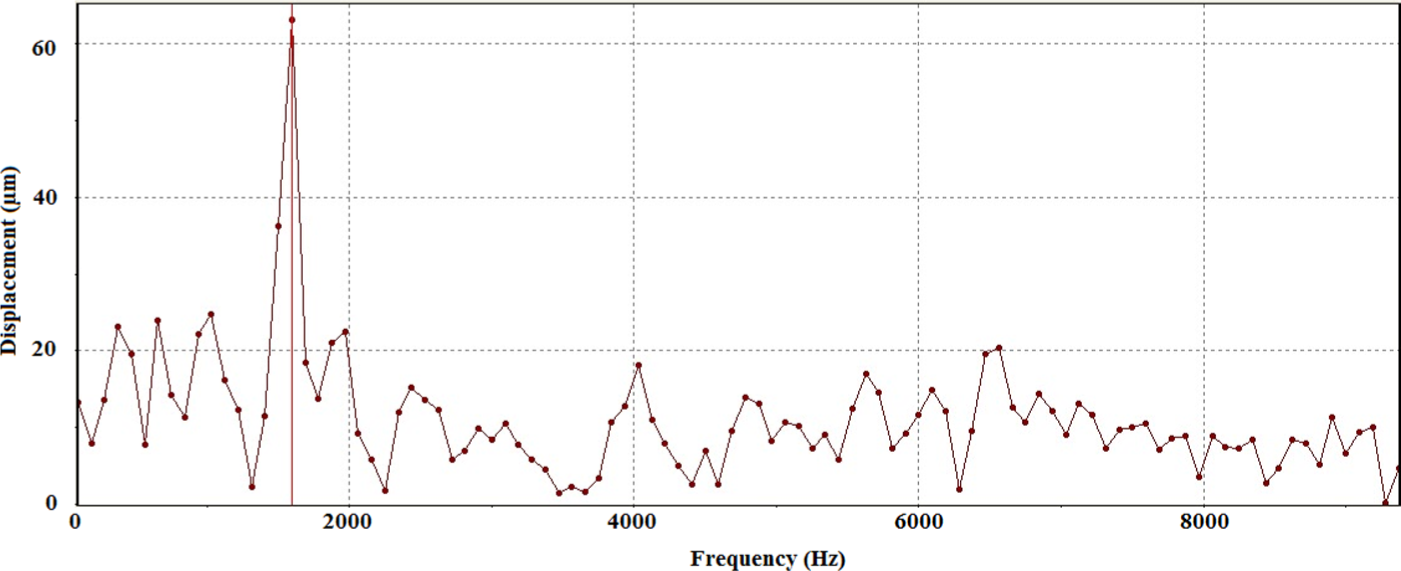
Frequency domain spectrograph for the first experiment.
Effect of cutting parameters, feed rate, cutting speed and depth of cut on the surface roughness and amplitude of cutter vibration are shown in Figures 5 and 6, respectively. The trends of effect of these machining parameters help to identify which parameter and interaction of parameters are significant on the surface roughness and mill cutter vibration.
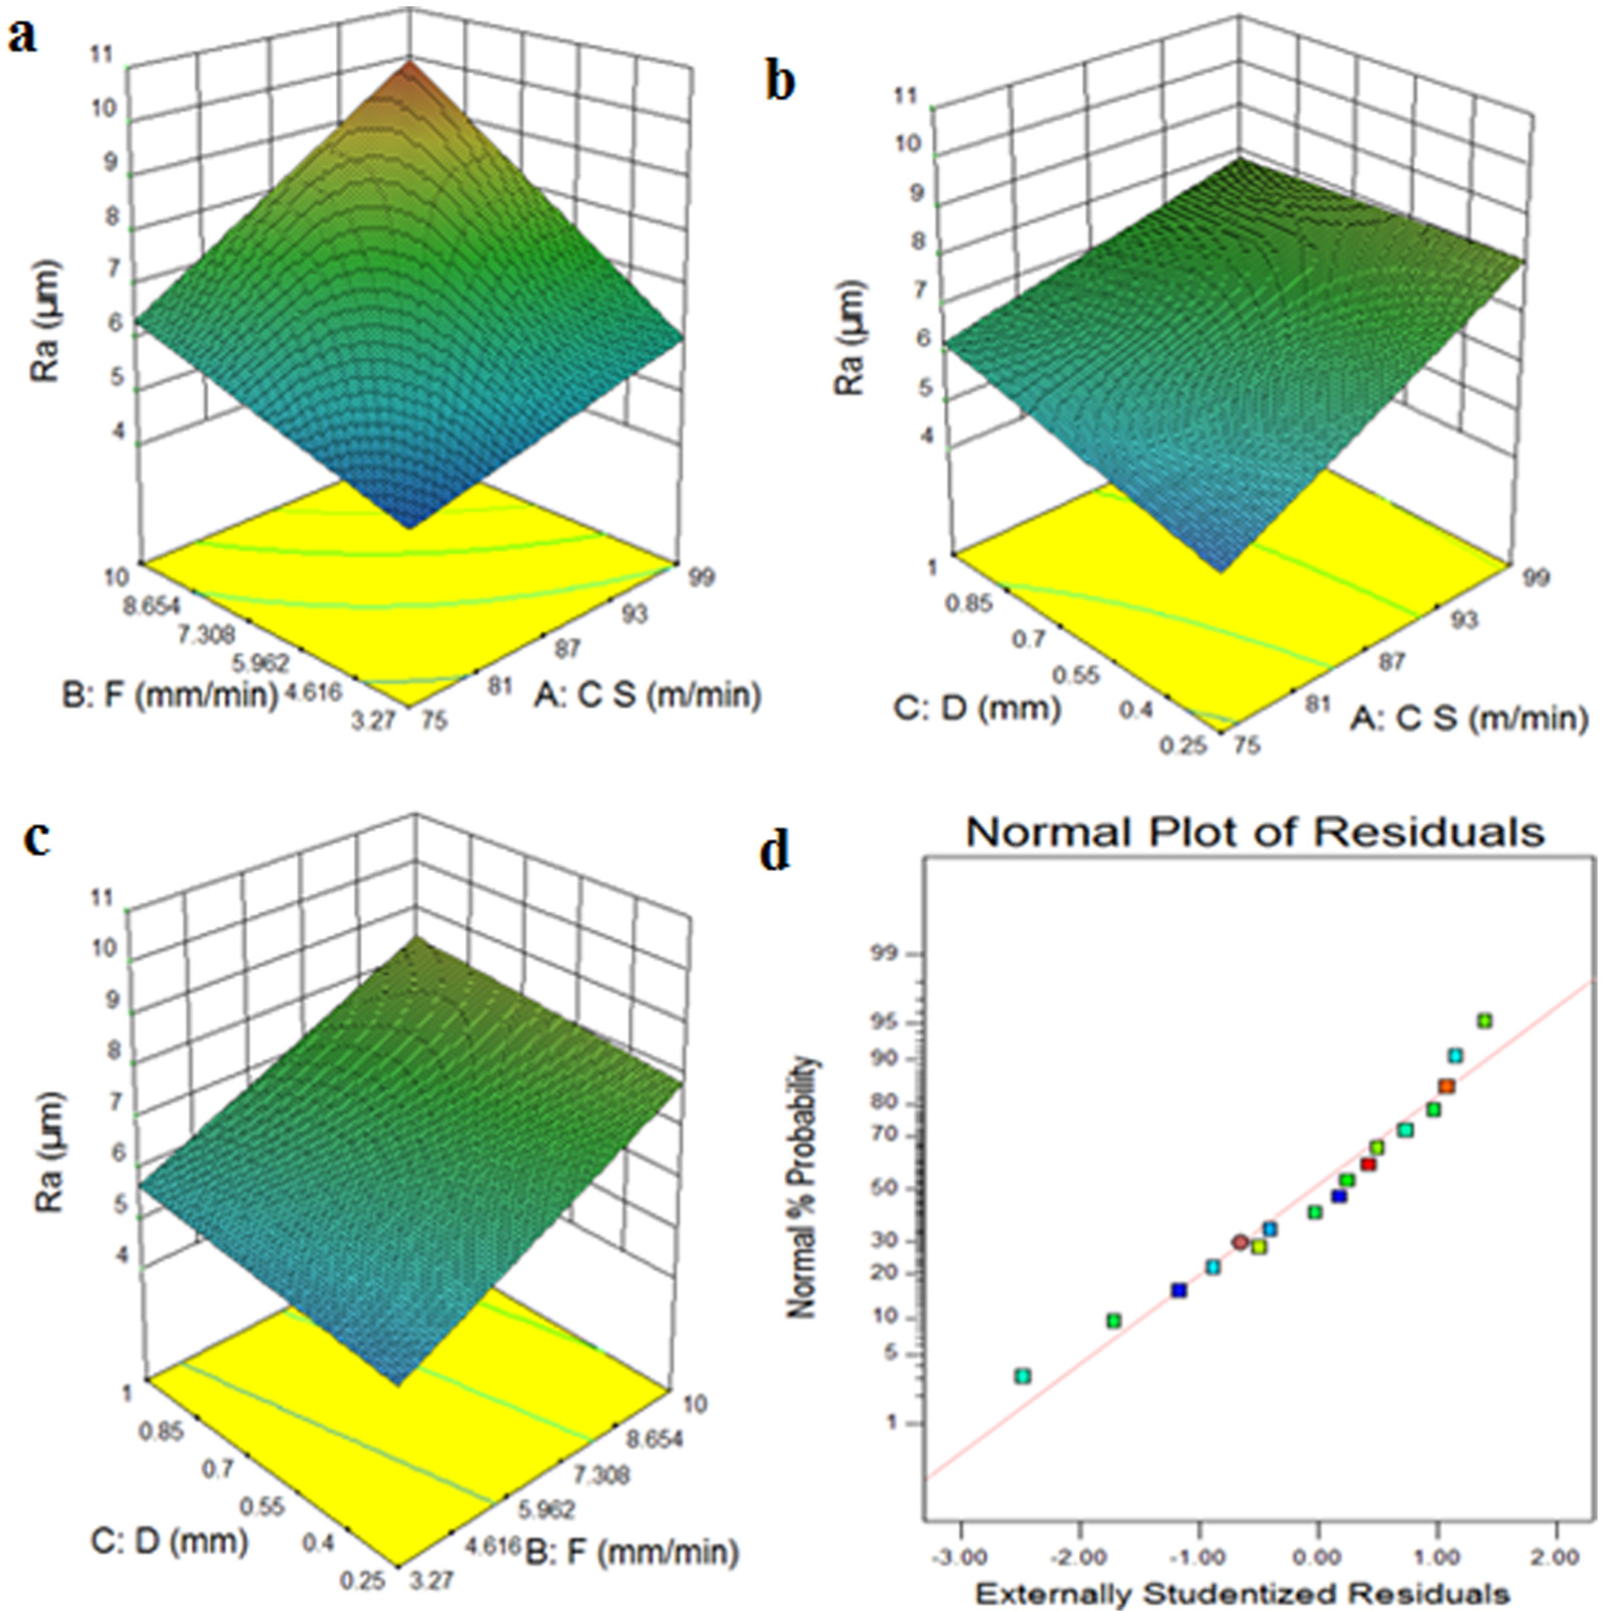
(a) Effect of feed and cutting speed on Ra, (b) effect of depth of cut and cutting speed on Ra, (c) effect of depth of cut and feed rate on Ra and (d) normal probabilities of residuals for Ra.
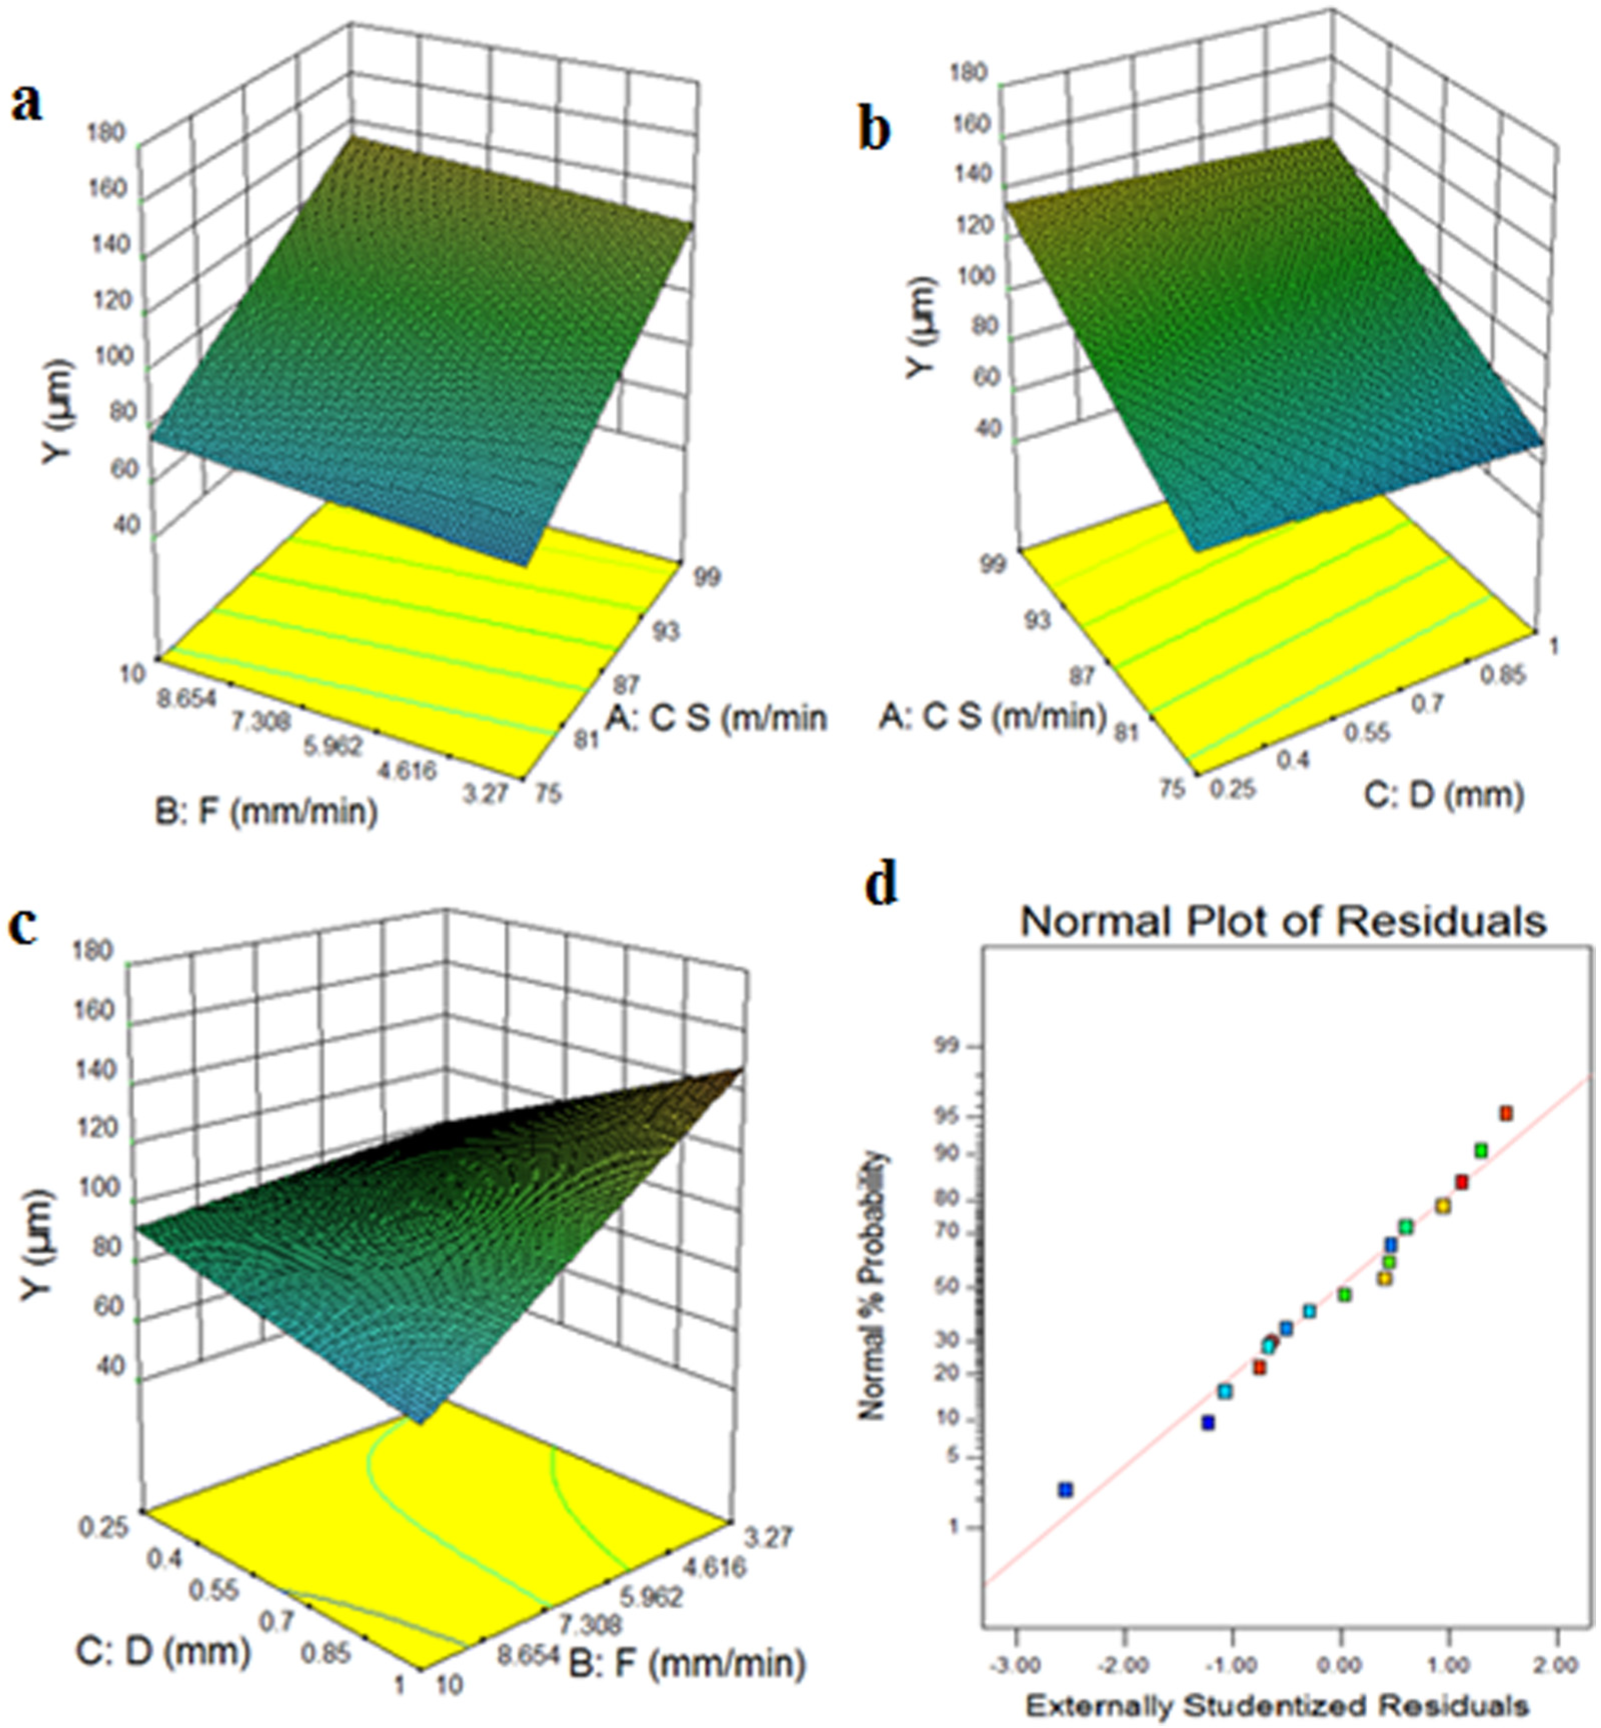
(a) Effect of feed and cutting speed on Y, (b) effect of depth of cut and cutting speed on Y, (c) effect of depth of cut and feed rate on Y and (d) normal probabilities of residuals for amplitude of tool vibration.
Based on the experimental results and experimental parameters shown in Table 4, two-factor interaction response function for surface roughness and amplitude of cutter vibration can be expressed as function of process parameters. Quadratic models for the surface roughness and amplitude of vibration velocity are given by the following equations
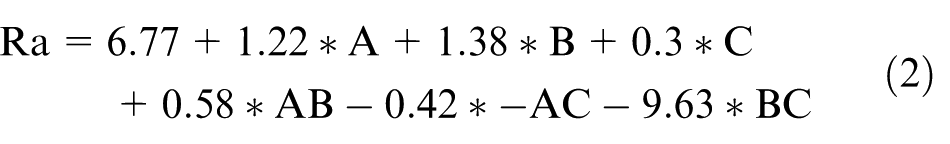
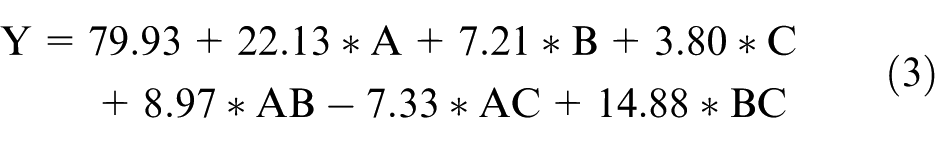
Effect of parameters on surface roughness
Effect of cutting speed, feed rate and depth of cut on the surface roughness are shown in Figure 5. Figure 5(d) is the normal probability plot of the residuals for the response of surface roughness. The plot indicates the fall of residuals along the straight line and it represents the normal distribution of errors. Figure 5(a)–(c) shows the effect of interaction of cutting parameters on the surface roughness. Figure 5(a) shows the effect of interaction of cutting speed and feed rate on the surface roughness. The surface roughness is more at cutting speed of 90 m/min and 10 mm/min and it is less at cutting speed of 75 m/min and feed rate of 3.27 mm/min. Figure 5(b) shows the effect of interaction of cutting speed and depth of cut on the surface roughness. The surface roughness is found less at cutting speed of 75 m/min and depth of cut of 0.25 mm. Figure 5(c) shows the effect of interaction of depth of cut and feed rate on the surface roughness. The surface roughness is found less at interaction of depth of cut of 0.25 mm and feed rate of 3.27 mm/min. Increased feed rate in any machining process will lead to generation of heat and therefore contributes high surface roughness. 21 Increased cutting speed and feed rate will remove high amount of material, but it leads to wear on cutting edges due to abrasion between cutting edges and work piece. The end mill cutter has two cutting edges and they remove material one after another cutting edge. That is why damage takes place on cutter due to repeated impact loads applied.
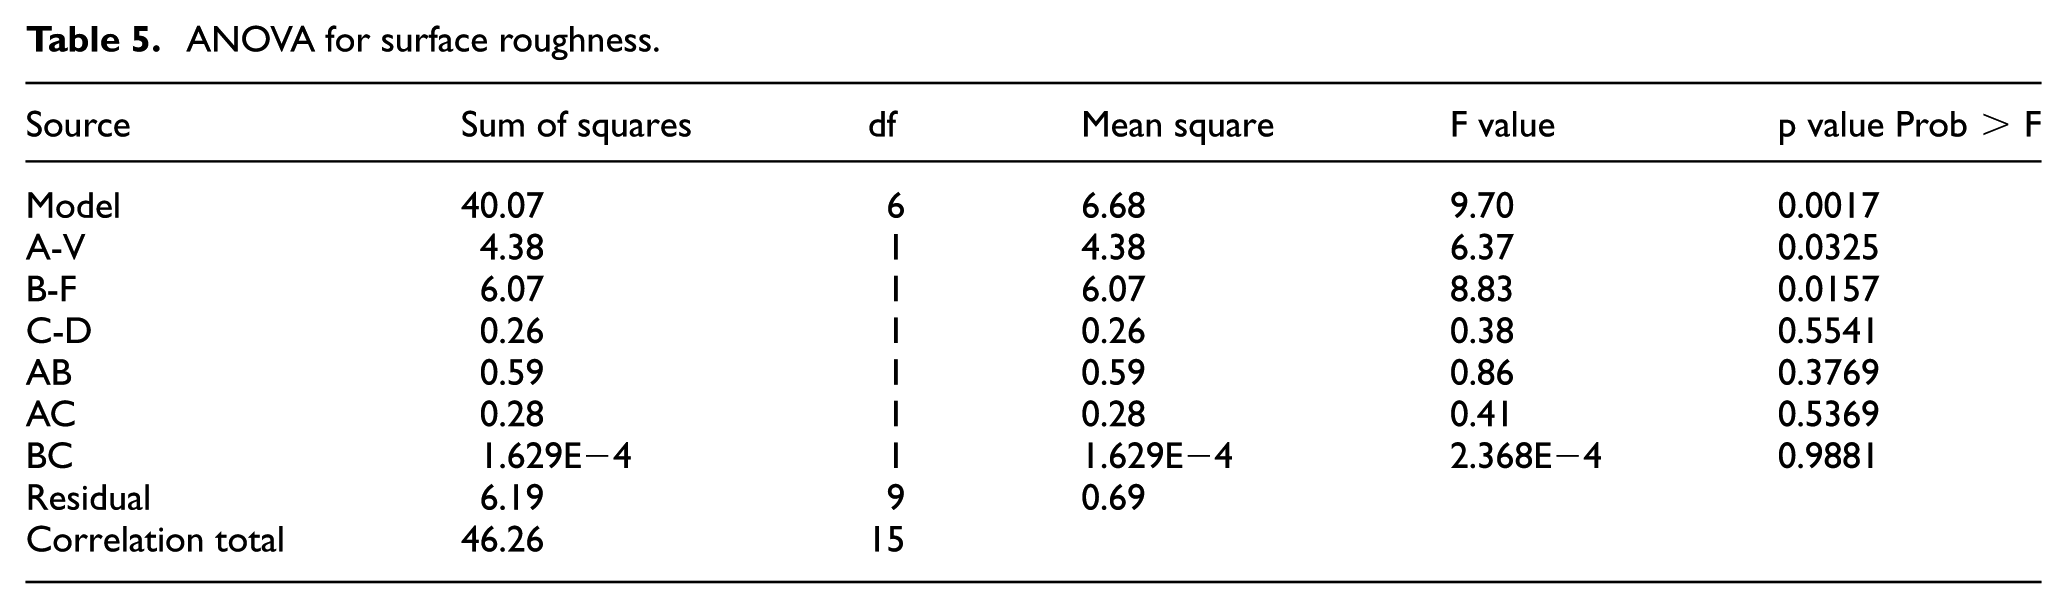
In this article, ANOVA has been used to find out significant cutting parameters and significant interaction of cutting parameter on the surface roughness. In the ANOVA, at confidence level of 95%, the experimental values were evaluated. The individual cutting parameters and interaction of cutting parameters which are having p value less than 0.05 are significant. Values of “Prob > F” that is, p value, less than 0.0500 indicate model terms are significant.19,22 According to Table 5, cutting speed and feed rate are significantly effective on the surface roughness because the p values of cutting speed and speed are 0.0325 and 0.0157, respectively. There is no significant effect of depth of cut on surface roughness. Previous researchers have also claimed the similar results that cutting speed and feed rate have more effect on the surface roughness.23–25
ANOVA for surface roughness.
Effect of parameters on amplitude of cutter vibration
Effect of cutting speed, feed rate and depth of cut on the amplitude of cutter vibration are shown in Figure 6. Figure 6(d) is the normal probability plot of the residuals for the response of cutter vibration. The plot indicates the fall of residuals along the straight line and it represents the normal distribution of errors. Figure 6(a)–(c) shows the effect of interaction of cutting parameters on the cutter vibration. Figure 6(a) shows the effect of interaction of cutting speed and feed rate on the amplitude of cutter vibration. The vibration amplitude is found to be less at interaction of cutting speed of 75 m/min and feed rate of 3.27 mm/min. Figure 6(b) shows the effect of interaction of cutting speed and depth of cut on the vibration amplitude. The vibration amplitude is found to be less at interaction of cutting speed of 75 m/min and depth of cut of 1 mm. Figure 6(c) shows the effect of interaction of depth of cut and feed rate on the vibration. The amplitude was found to be less at interaction of depth of cut of 1 mm and feed rate of 10 mm/min. High-speed machine is used in machining for high productivity by reducing production time. The machine tools are having high dynamic movements because of high cutting speeds. High dynamic movements in machine tools reduce its rigidity and it leads to generation of vibrations while machining.
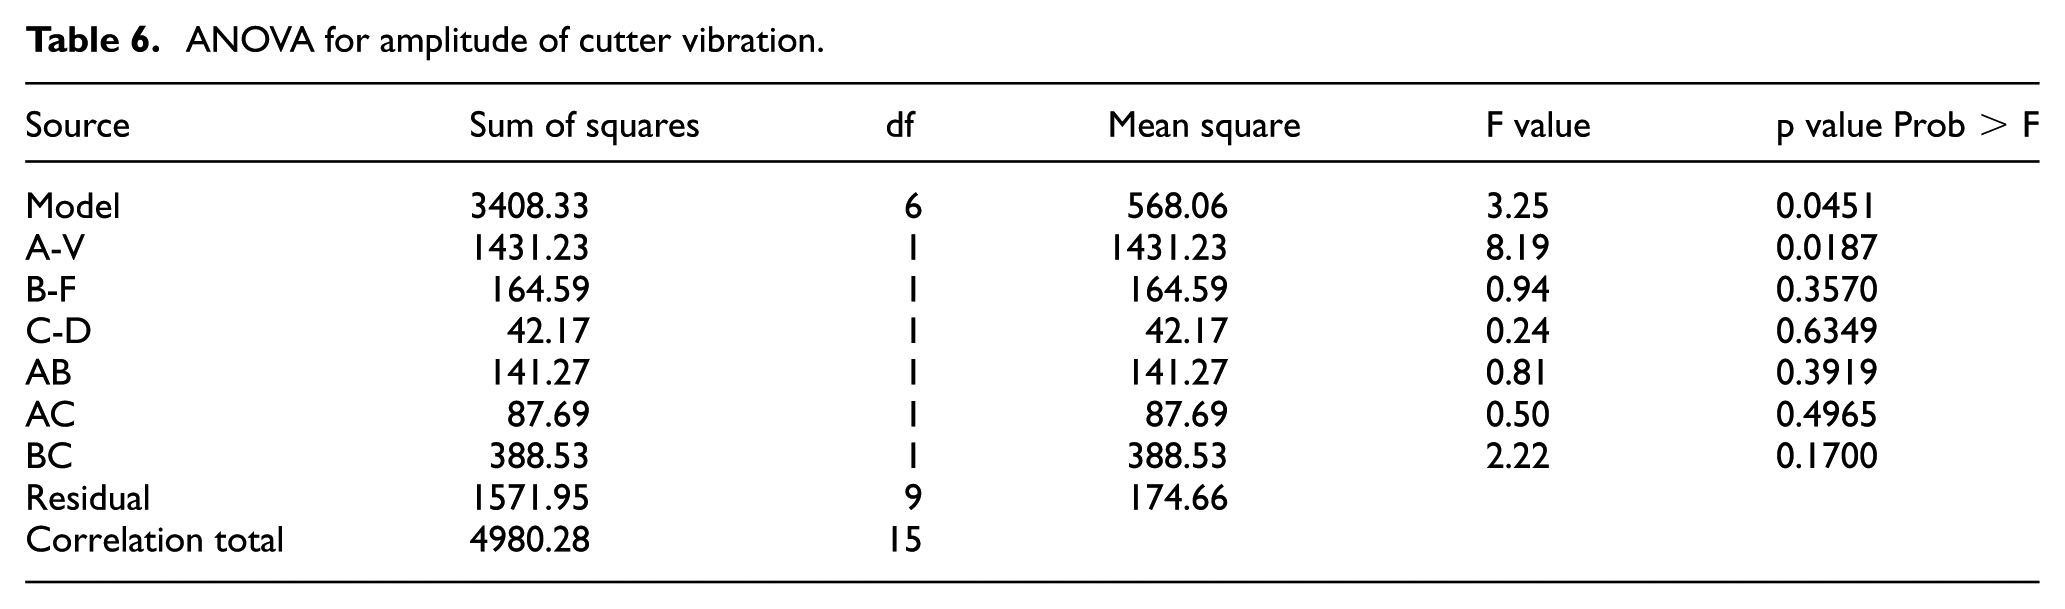
Similar to the surface roughness, the ANOVA has been used to find out significant cutting parameters and interaction of cutting parameter on the amplitude of cutter vibration. According to Table 6, cutting speed is significantly effective on the amplitude of vibration. The ANOVA was performed at the confidence level of 95%, and the cutting parameters which are having p value less than 0.05 are significant. 22 As shown in Table 6, the cutting speed has p value of 0.0187 and it is to be said as significant parameter on the cutter vibration. Pettersson et al. 26 have also proved that the cutting speed has significant effect on the cutter vibration.
ANOVA for amplitude of cutter vibration.
Optimum values of multi-objective function
The objective of this work is to find out optimum cutting parameters to achieve less surface roughness and amplitude of cutter vibration in order to reduce power consumption and production time and to improve tool life. Newman et al. 27 stated that 6%–40% of energy savings can be achieved in metal cutting with optimum cutting parameters. Optimum values for multi-objective of surface roughness and amplitude of cutter vibration were done using Minitab 16 and the results are shown in Figure 7. Desirability function was introduced in 1980 to optimize cutting parameters. The desirability function uses a gradient algorithm and it finds desirability with maximum value between 0 and 1. If the desirability value closes to 0, then the response is completely unaccepted and if the desirability value is 1 or close to 1, then the response is accepted. 28
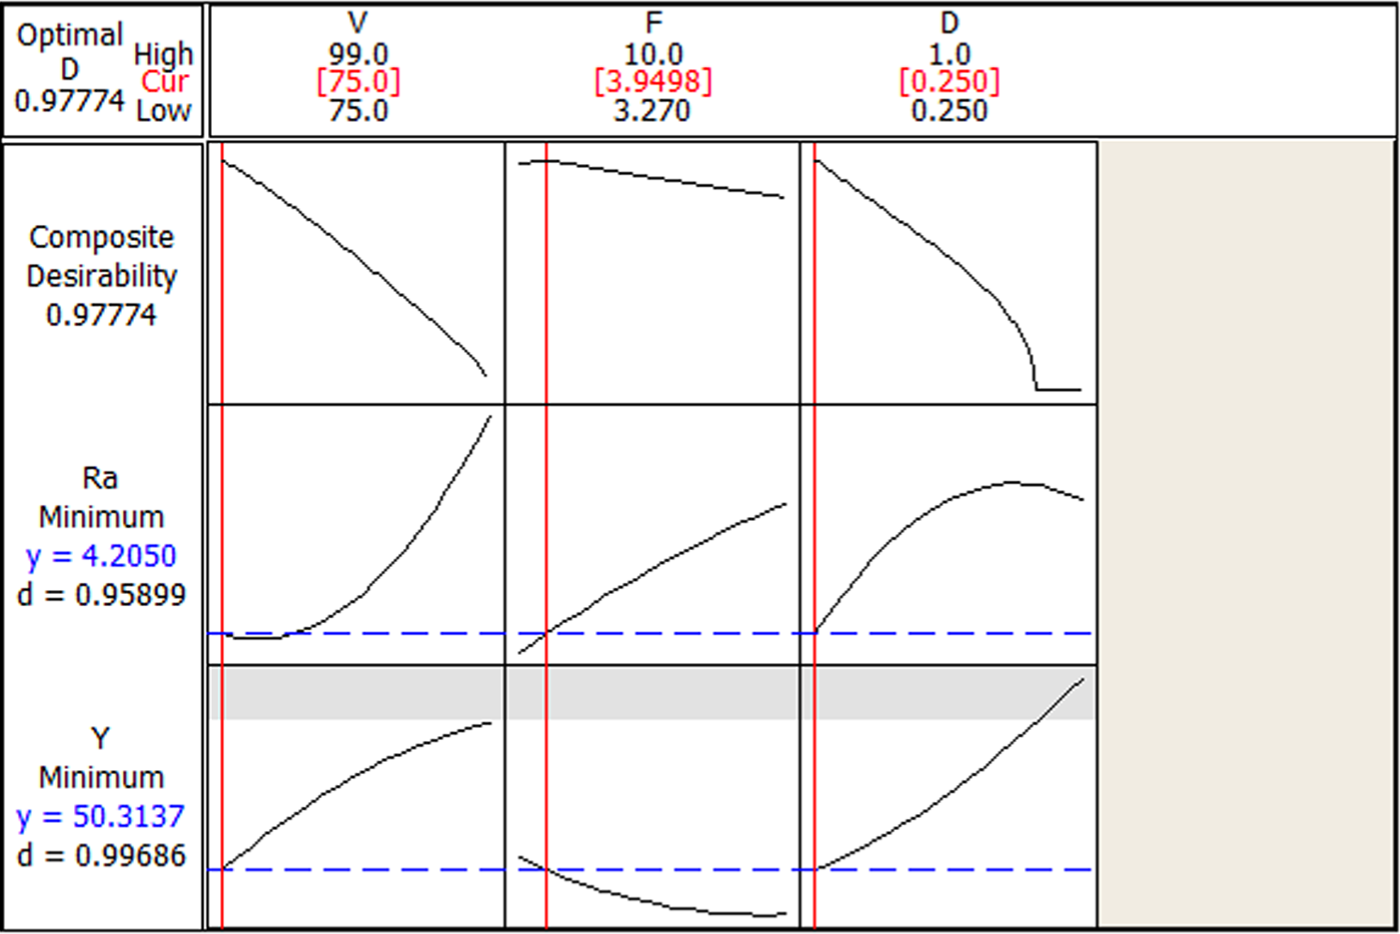
Multi-objective functions for surface roughness and amplitude of cutter vibration.
There are three types of individual desirability functions: larger the better, smaller the better and nominal the better. In this study, smaller the better function was used for surface roughness and amplitude of cutter vibration, because these two responses should be less for any product to obtain good product quality and tool life. According to Figure 7, optimum cutting parameters were found as 75 m/min of cutting speed, 3.9498 mm/min of feed rate and 0.250 mm of depth of cut. Desirability values were found to be 0.95899 and 0.99689 for surface roughness and amplitude of cutter vibration, respectively, and composite desirability was also as 0.9774. All the desirability values were to be found very close to 1, and then the responses can be accepted. 28
Conclusion
Optimization of cutting parameters to improve surface quality and production rate at low power consumption was found using multi-objective optimization technique. Turn milling experiments were conducted on ASTM B139 phosphor bronze with HSS mill cutter on four-axis milling machine. RSM approach was used to identify significant cutting parameters which are affecting surface roughness and amplitude of cutter vibration. The following conclusions can be drawn from this study:
Effect of cutting parameters on amplitude of mill cutter vibration was measured with LDV by focusing optic signal on rotating cutter. Changes in the amplitude of cutter vibration due to tool wear can be used for online tool condition monitoring.
The AOE signals are very sensitive and they identify changes in cutting zone due to vibrations.
Surface roughness and amplitude of cutter vibration were analyzed using RSM. Cutting speed and feed rate were found to be significant cutting parameters on surface roughness and the cutting speed was found to be significant on amplitude of cutter vibration.
The proposed multi-objective technique shows the cutting speed of 75 m/min, feed rate of 3.9498 mm/min and depth of cut of 0.25 mm are the optimal combination of milling parameters for minimum surface roughness and amplitude of cutter vibration.
Footnotes
Declaration of conflicting interests
The author(s) declared no potential conflicts of interest with respect to the research, authorship and/or publication of this article.
Funding
The author(s) received no financial support for the research, authorship and/or publication of this article.