
Abstract
NiTi is a shape memory alloy, mostly employed in cardiovascular stents, orthopedic implants, orthodontic wires, micro-electromechanical systems and so on. The effective and net shape machining of NiTi is very critical for excellent response of this material in medical and other applications. The present experimental work on wire electrical discharge machining process identifies the influence of process parameters that affect the cutting rate, dimensional shift and surface roughness while machining of porous nickel–titanium (Ni40Ti60) alloy. Porous Ni40Ti60 alloy was produced in-house using powder metallurgy technique. Response surface methodology–based central composite rotatable design has been used for the planning of experiments on wire electrical discharge machining. Empirical relations have been developed between the process parameters (pulse on-time, pulse off-time, servo voltage and peak current) and response variables. Desirability approach has been used for optimizing the three response variables simultaneously. Confirmation experiments were also performed at the optimized settings and reflect a close agreement between the predicted and experimental values (percentage error varies from −6.13% to +6.85%). Using wire electrical discharge machining, NiTi alloy can be machined easily and successfully in single-cutting operation, but after the first cut in wire electrical discharge machining, a surface projection appears on work surface which is the unmachined material on work surface.
Keywords
Introduction
NiTi alloy is a smart material because of its specific characteristics such as shape memory effect (SME), super elasticity and biocompatibility. 1 Therefore, this material is mostly employed in orthopedic implants, cardiovascular stent technology, orthodontics, micro-electromechanical systems (MEMS) in aerospace and electrical switching applications and so on. The unique characteristics of NiTi can be modified and improved by controlling the chemical composition and microstructure. Upon a specific temperature change, the equiatomic NiTi can undergo a reversible solid-state transformation from ordered cubic crystal structure (B2) called austenite to distorted monoclinic (B19′) called martensite.
Additive manufacturing methods2,3 are advanced techniques used to fabricate net shape geometries of NiTi alloy with controlled microstructures. But these methods are highly expensive and still not commercialized. NiTi alloy can be produced in cylindrical shapes and rectangular sheets with controlled composition using vacuum induction melting 4 and powder metallurgy process with sintering under vacuum or inert gas atmosphere. 5 After fabrication, NiTi alloy is machined in final geometry for end use. Machining of NiTi with conventional machining methods (such as turning, milling and drilling) is very difficult because of strain hardening of surface, poor surface finish, high tool wear rate and burr formation at machined surface.6–8 The most appropriate and widely accepted nontraditional machining method is numeric controlled wire electrical discharge machining (WEDM), which is spark-erosion, thermo-electric machining method to cut hard and conductive metal and alloys. 9 The electrode or wire tools used in this process are of brass, copper and molybdenum wire with 0.05–0.30 mm diameters which continuously travel through the work-piece during machining.
The metal removal in WEDM occurs due to the generation of discrete sparks between the small gap of tool and work-piece which is controlled by the electrical pulses generated by power supply. The spark plasma generates very high temperature at work surface which vaporizes the localized area of work material. Deionized water as dielectric flows between the spark gap to flush all the debris. High surface finish, machining of complex shapes, higher dimensional accuracy and automated un-interrupted continuous operation are the main features of WEDM process.10,11
Past research work on machining of NiTi alloys
Weinert and Petzoldt 8 machined the NiTi (nearly stoichiometric composition) with the help of CNC lathe using coated cemented carbide and an emulsion consisting of 5% “Avantin 335” as coolant and 95% water was used as a lubricant. Tool wear, process force and hardening of machined surface were the response variables, while cutting rate (CR) and feed rate were the input process parameters. Poor chip breaking and burr formations were observed during machining. Lin et al. 7 experimentally analyzed the machinability of equiatomic NiTi in drilling process using three types of drills made of WC, high-speed steel (HSS) and TiN-coated HSS. Same work material was also processed with emery blade and diamond blade. TiN-coated HSS drill shows better drill characteristics than other two. Emery blade represents better machining ability due to new cutting edges of SiC and Al2O3 powders. Kaynak et al.12,13 used liquid nitrogen (LN2) as a lubricant while machining NiTi on CNC lathe using cutting tool insert of grade KC 5410 with TiB2 coating. Wear rate of tool reduces to 50% in a cryogenic environment. Surface roughness (SR) on machined NiTi surface increases with tool wear. Cryogenic machining resulted in better surface but for a short machining time (upto 5min.)., After this short machining time of 4-5 min., dry, cryogenic and minimum quantity lubrication (MQL) machining has equivalent SR.
To overcome the problems such as burr formation and tool wear in machining of NiTi alloys with conventional machining processes, nontraditional machining have been attempted. In an attempt made by Abedi et al 14 on electrical discharge machining (EDM) process, material removal rate (MRR) of TiNi was found to be increased with the increase in the value of pulse current and pulse duration. The micro-hardness at machined surface reached up to 750 Hv due to the presence of white layer. 6 The SR during the machining first decreases and then increases with the increase in pulse off-time (Toff) and current. The most significant parameter for MRR was pulse current and that for SR was pulse on-time (Ton). 14 Alidoosti et al. 15 processed NiTi with EDM using different electrode materials. Results show that MRR in copper electrode and tungsten–copper (W-Cu) electrode are the same. Work stability in the case of W-Cu electrode is higher, while the impurity level on the machined surface processed by Cu electrode is lower.
Precipitates of TiC were found on the melted zone during the EDM of NiTi using W-Cu electrode. These precipitates diminished the SME of material. To retain SME, these surfaces were further processed either by slow energy process or by removal of melted zone by electrochemical action. 16 Alloys of NiTi consisting Cr and Zr were also processed with EDM, and it has been found that with the increase in pulse duration and discharge current, MRR and SR increase due to the strike of discharge more intensely onto the surface, and hence, erosion effect is more. 17
The presence of recast layer decreases the shape recovery effect, but machined TiNiZr exhibits a good shape recovery.18,19 TiNiCr and TiNiZr were machined with the help of WEDM, and it was found that higher pulse duration diminishes the surface finish. The hardness up to 875 Hv was reached due to the presence of oxide of TiO2, TiNiO3, ZrO2 and Cr2O3. 20 Narendranath et al. 21 investigated that the SR was more sensitive toward the Ton at low peak current (IP) compared to high IP during the WEDM of NiTiCu. MRR was also found to increase with increase in Ton. LotfiNeyestanak and Daneshmand 22 investigated the machining of Nitinol-60 on WEDM. A recast layer of 10–20 μm has been found on Nitinol-60 surface, which contains CuZn, Ti2Ni, NiO and Cu2O metal oxide. These metal oxides enhance the micro-hardness several times on the surface up to the depth of 20 μm when compared to micro-hardness before WEDM.
The specific properties of NiTi alloys creates difficulty in conventional machining due to strain hardening effect, cyclic hardening, intermetallic compound and rapid tool wear rate. WEDM can be proved to be a better alternative to machine the complex geometry in NiTi alloys. But the literature available on machining of NiTi on WEDM is very limited. Therefore, in the present work, an attempt has been made for an experimental study of NiTi on WEDM process.
Experimentation
Work material
Although NiTi alloy is biocompatible material best suited for orthopedics and orthodontics, the minor possibility of release of Ni+ ions into human bodies cannot be ignored. Therefore, a protective and noncorrosive layer on NiTi alloy is required for medical applications. But in NiTi alloy, a protective coating of TiO2 is generated by the reaction of atmospheric oxygen which stops the release of Ni+ ions into human bodies. Therefore, in the present work, weight % of Ti is considered more when compared to Ni, and Ni40Ti60 is produced using powder metallurgy process.
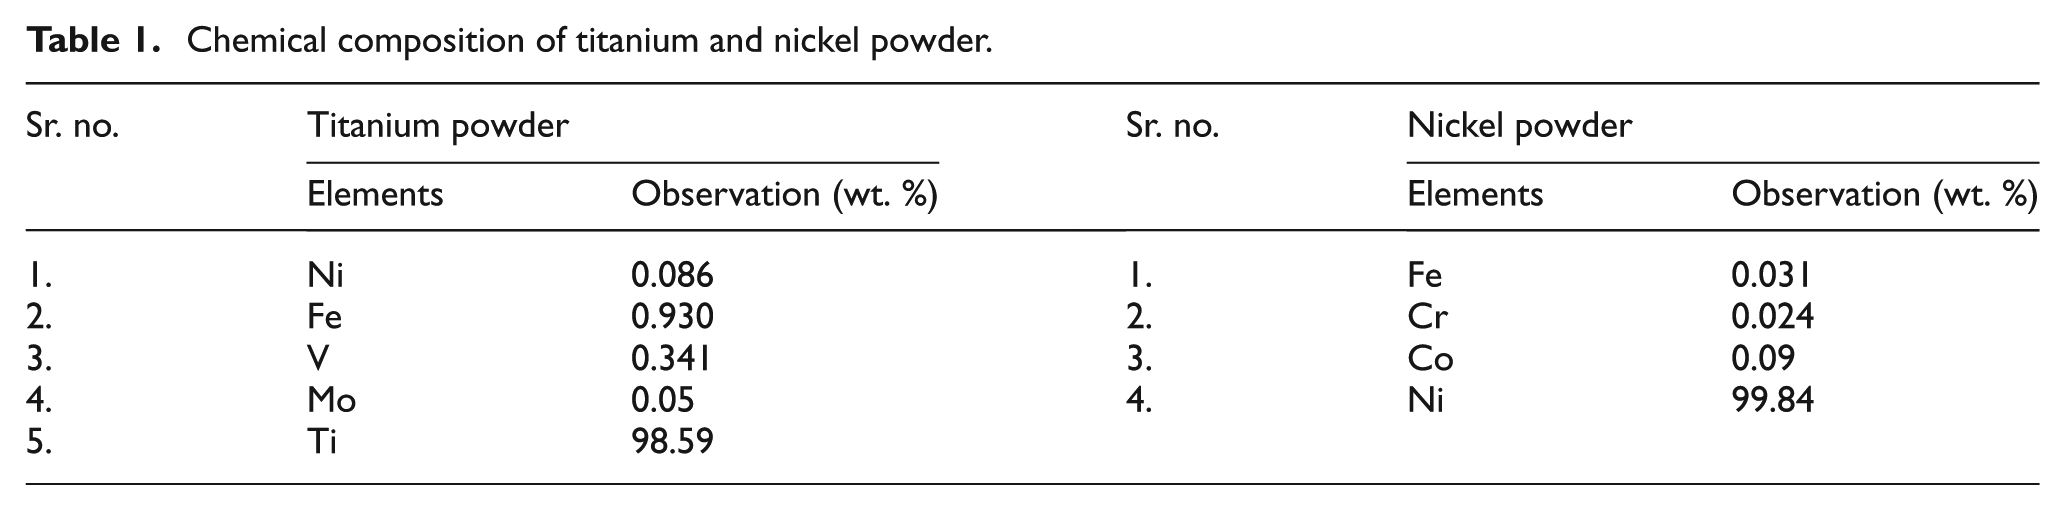
Porous NiTi alloys are gaining more importance in medical applications due to their low elastic moduli that closely match with human bone and high bone tissue ingrowth in pores of metallic implants. Thus, porous NiTi alloys are promising biomaterials for hard tissue replacement. 23 Therefore, in the present work, porous NiTi is fabricated using low-temperature additives and low-compaction pressure in powder compaction stage. Figure 1 shows the scanning electron microscopic (SEM) image of porous structure of the present work sample. This figure shows that the pores are of irregular sizes distributed over larger areas, and many pores are interconnected. The chemical composition of titanium and nickel powder is given in Table 1.
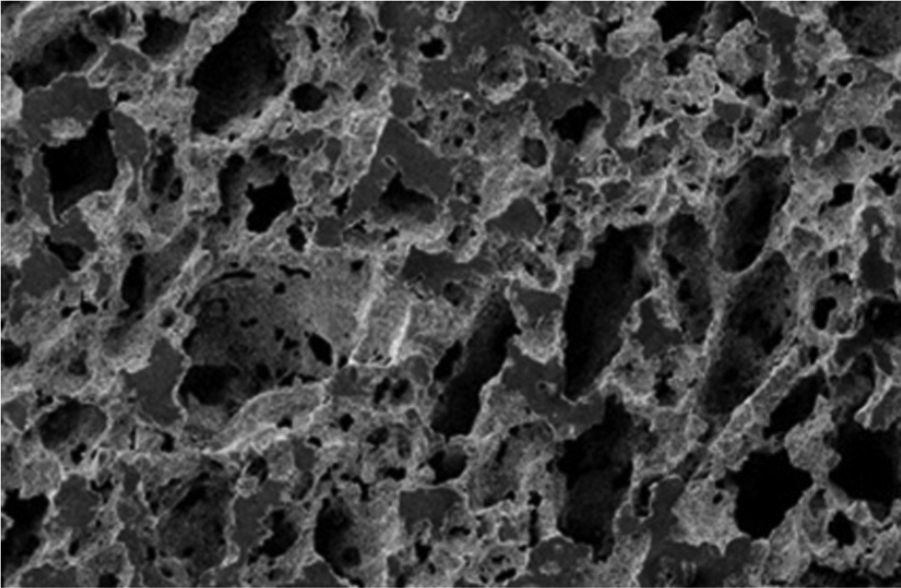
SEM micrograph of porous NiTi.
Chemical composition of titanium and nickel powder.
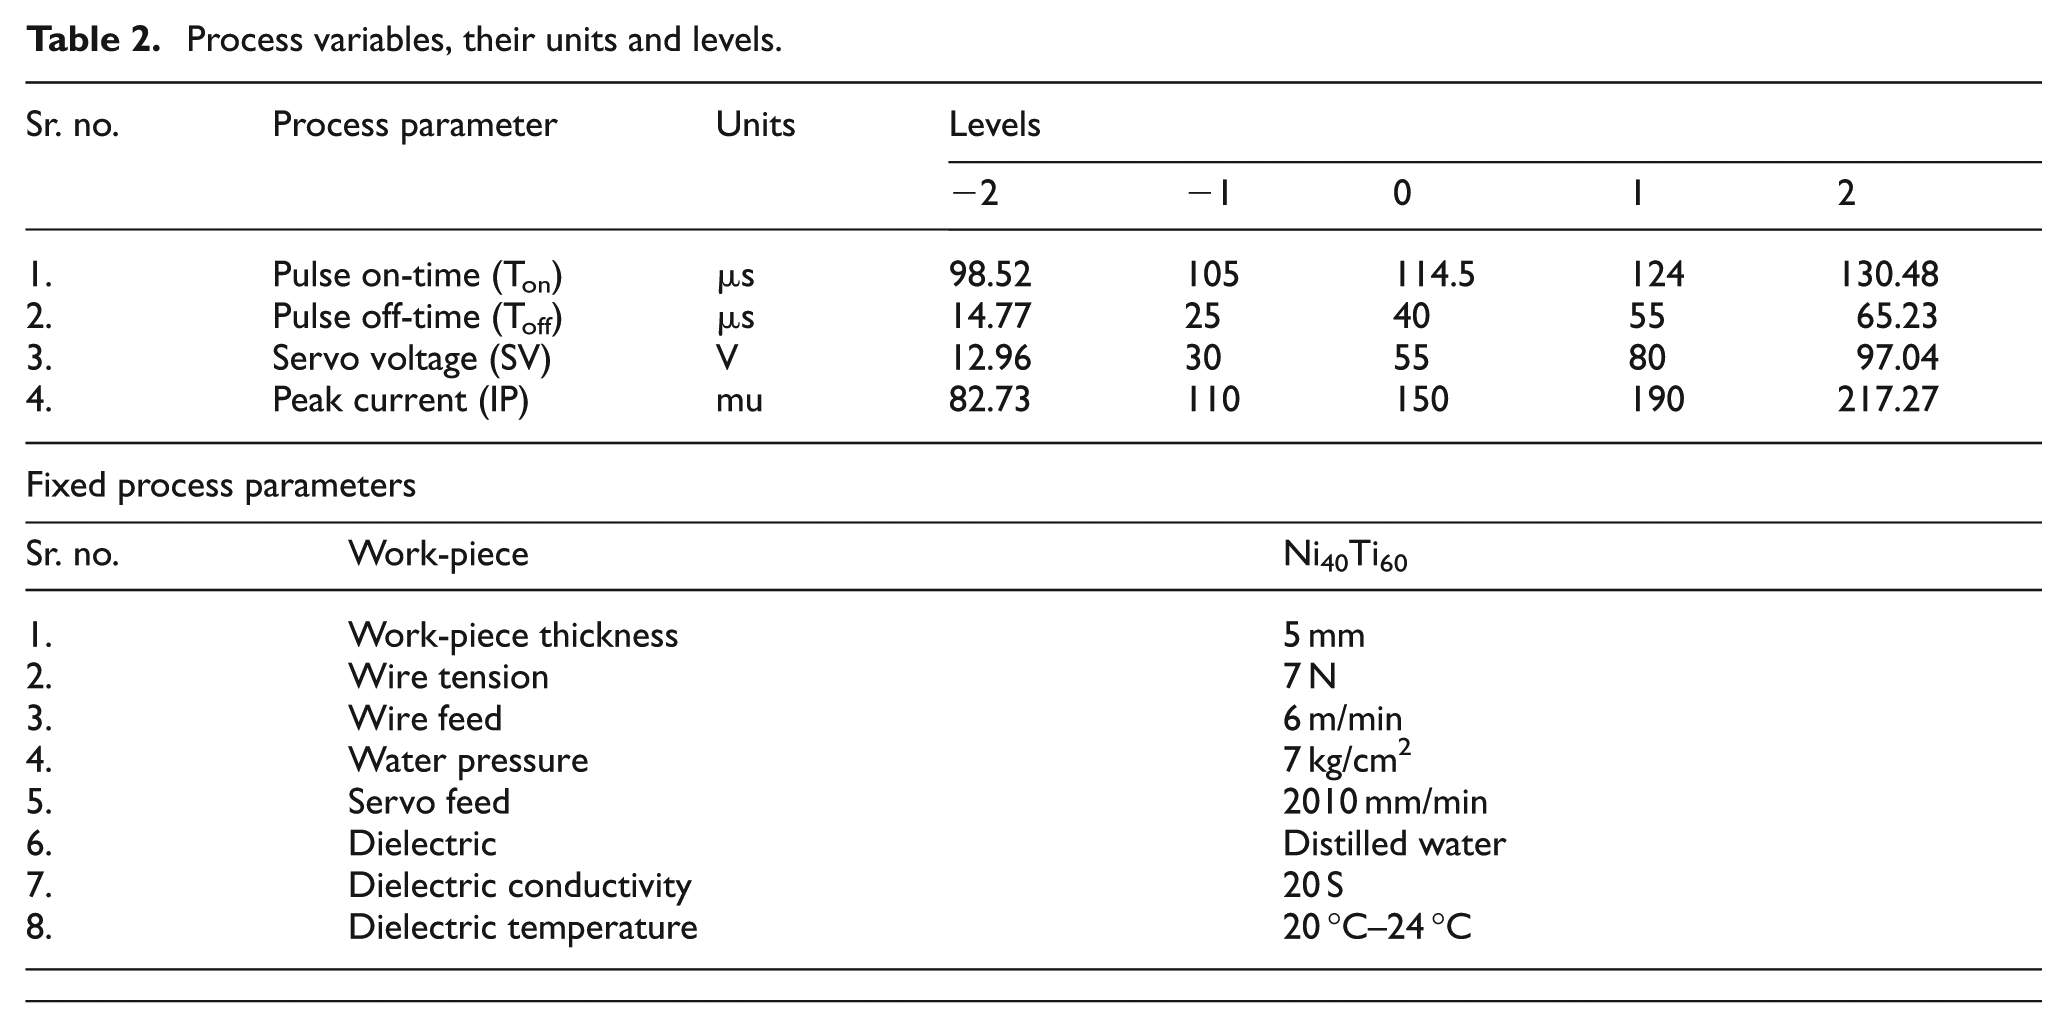
Process variables
In the present work, experiments were performed on five-axis Sprintcut ELPULS 40 manufactured by Electronica Machine Tool Ltd, India. Based on previously published work on WEDM of high-strength and high-temperature resisting materials,24,25 four input variables, namely, Ton, Toff, servo voltage (SV) and IP, have been selected for investigation. Response variables which are to be measured at various settings of process parameters are CR, dimensional shift (
Process variables, their units and levels.
The work-piece profile to be cut is shown in Figure 2(a). The wire entered through the work-piece at point A (10, 5). It will travel a clockwise path along AB, BC, CD, DE and EA and will exit the work-piece from point A (10, 5).
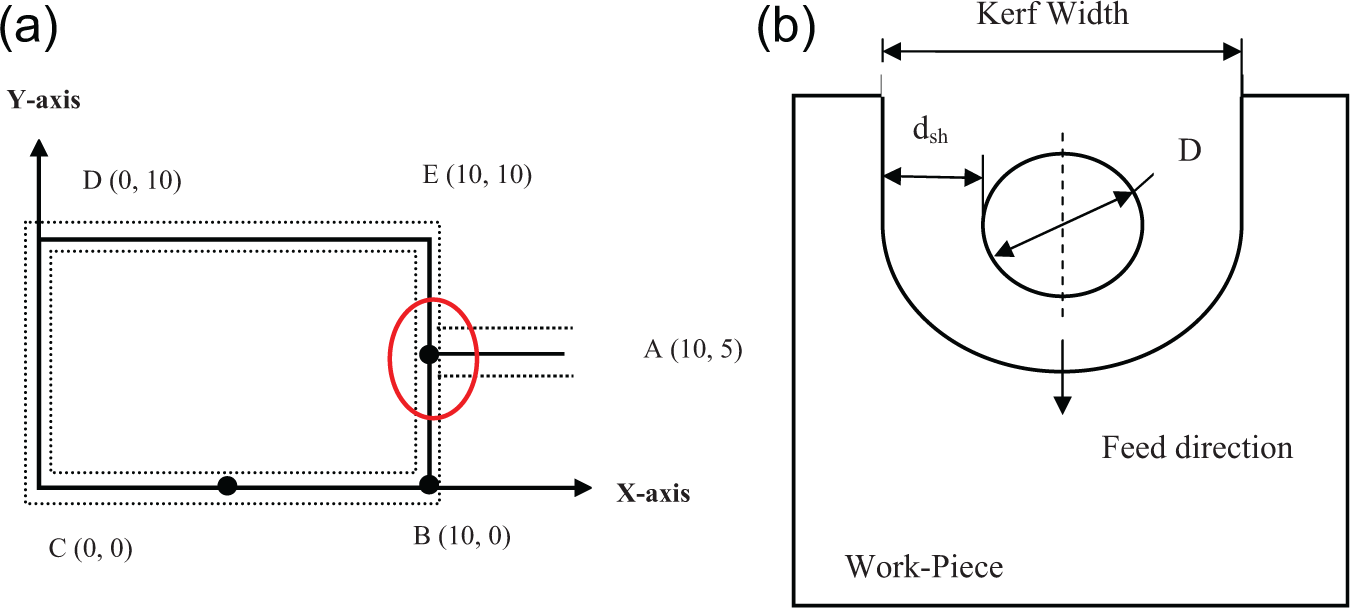
(a) Work-piece profile and (b)
In the present work, three response variables have been observed in WEDM process. CR is measured as linear movement of table per minute (in mm/min) which is displayed on machine tool monitor screen.
Experimental planning
Experiments were performed on a random basis (run order) using response surface methodology (RSM). RSM is a collection of statistical and mathematical techniques that requires sufficient number of experimental data used for the modeling and analysis of a problem in which responses are affected by several input parameters, and the main objective is to optimize these responses individually and collectively. 26 The process of RSM is as follows:
Selection of the important input parameters and their working range;
Selection of experimental design to reduce the total number of experiments to be conducted for the evaluation of influence of input variables on response variables;
Regression analysis to generate the statistical model between input parameters and response variables;
ANOVA and lack of fit test to investigate the significant parameters, adequacy of the regression model;
Selection of optimal settings of input parameters for highest possible values of response variables;
Correspond to optimal settings, confirmation of the predicted values of response variables and calculation of experimental errors;
If regression model is not acceptable, then screening of input parameters is carried out, and the process is repeated.
In the present work, according to the first step in RSM, four important input variables have been selected. In WEDM, process parameters can be categorized into three major categories, namely, discharge parameters (IP, Ton, Toff and SV), wire electrodes (wire material, wire diameter, wire feed rate, wire tension and wire electrode coating) and dielectric conditions (type of dielectric, dielectric flow rate and conductivity). Based on trial experiments and previous literature on WEDM of hard to machine materials, only discharge parameters, namely, IP, Ton, SV and Toff, have been selected as input variable parameters, while parameters under the category of wire electrode and dielectric conditions have been assigned a constant value as listed in Table 2.
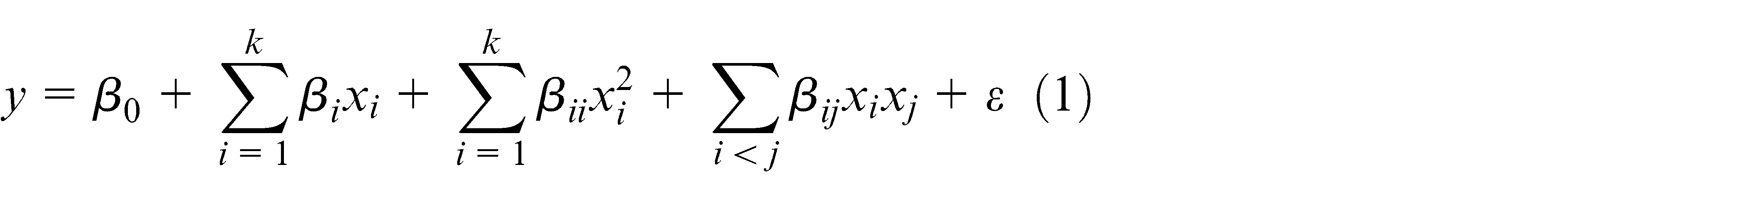
According to the second step of RSM, face-centered composite rotatable design (CCRD) has been selected. A well-designed experimental layout can reduce the total number of experiments. Using Design-Expert 7.0 (DX-7), a statistical tool, an experimental matrix has been generated for CCRD for four input variables as shown in Table 3. Second-order central composite design is the most efficient tool in RSM to create the mathematical relation of the response surface using the smallest possible number of experiments without losing its accuracy. 27 The response variable (y) can be modeled as in equation (1)
Design of experiment (run-order basis) and experimental results.
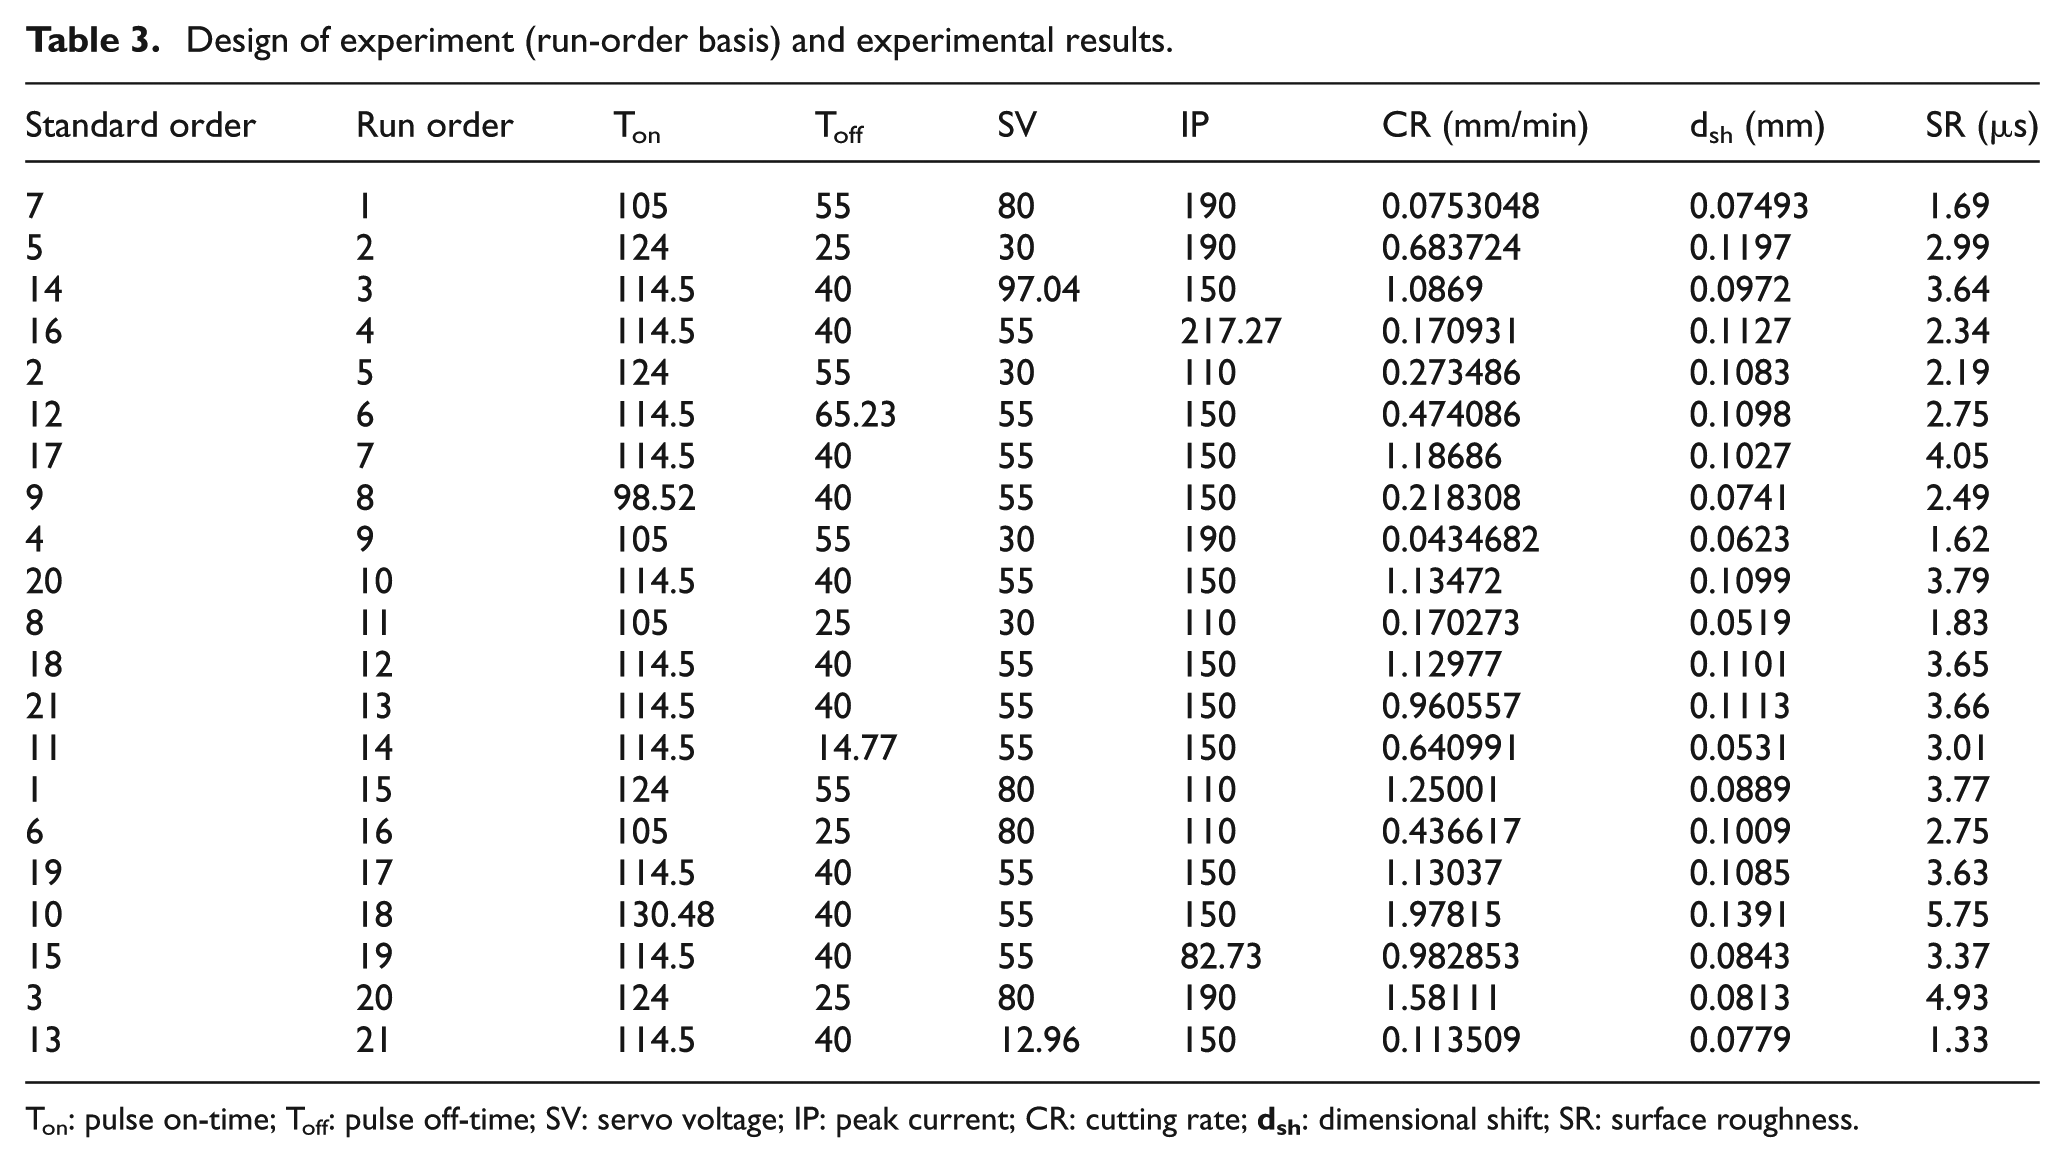
Ton: pulse on-time; Toff: pulse off-time; SV: servo voltage; IP: peak current; CR: cutting rate;
where xi, xj and xk are the input or independent process parameters; β0, βii and βij are the unknown parameters or regression coefficients; and ε is the random error.
According to CCRD with four process parameters at smaller set of experiments, a total of 21 experiments are required to be performed as given in Table 3. The next step of RSM, that is, regression analysis and ANOVA, has been performed for response variables in section “Results and discussion.” The selection of optimal parameter setting and confirmation results is discussed in section “Multi-response optimization: desirability approach.”
Results and discussion
A total of 21 experiments were planned and performed according to the experimental layout.
28
The average values of CR (in mm/min),
Analysis of CR
Fit summary of analysis suggests that the quadratic model for CR is significant with F-value = 103.53 and p-value < 0.0001,. The results are depicted in the ANOVA Table 4. A larger F-value corresponds to a smaller p-value and more percentage contribution. Backward elimination with 95% confidence level is used to remove the nonsignificant terms. During this, the model of CR is not hierarchical, so Toff (B in coded form) is hierarchically added. A model is said to be hierarchical if the presence of higher-order terms (such as interaction and second-order terms) requires the inclusion of all lower-order terms contained within those of higher order.
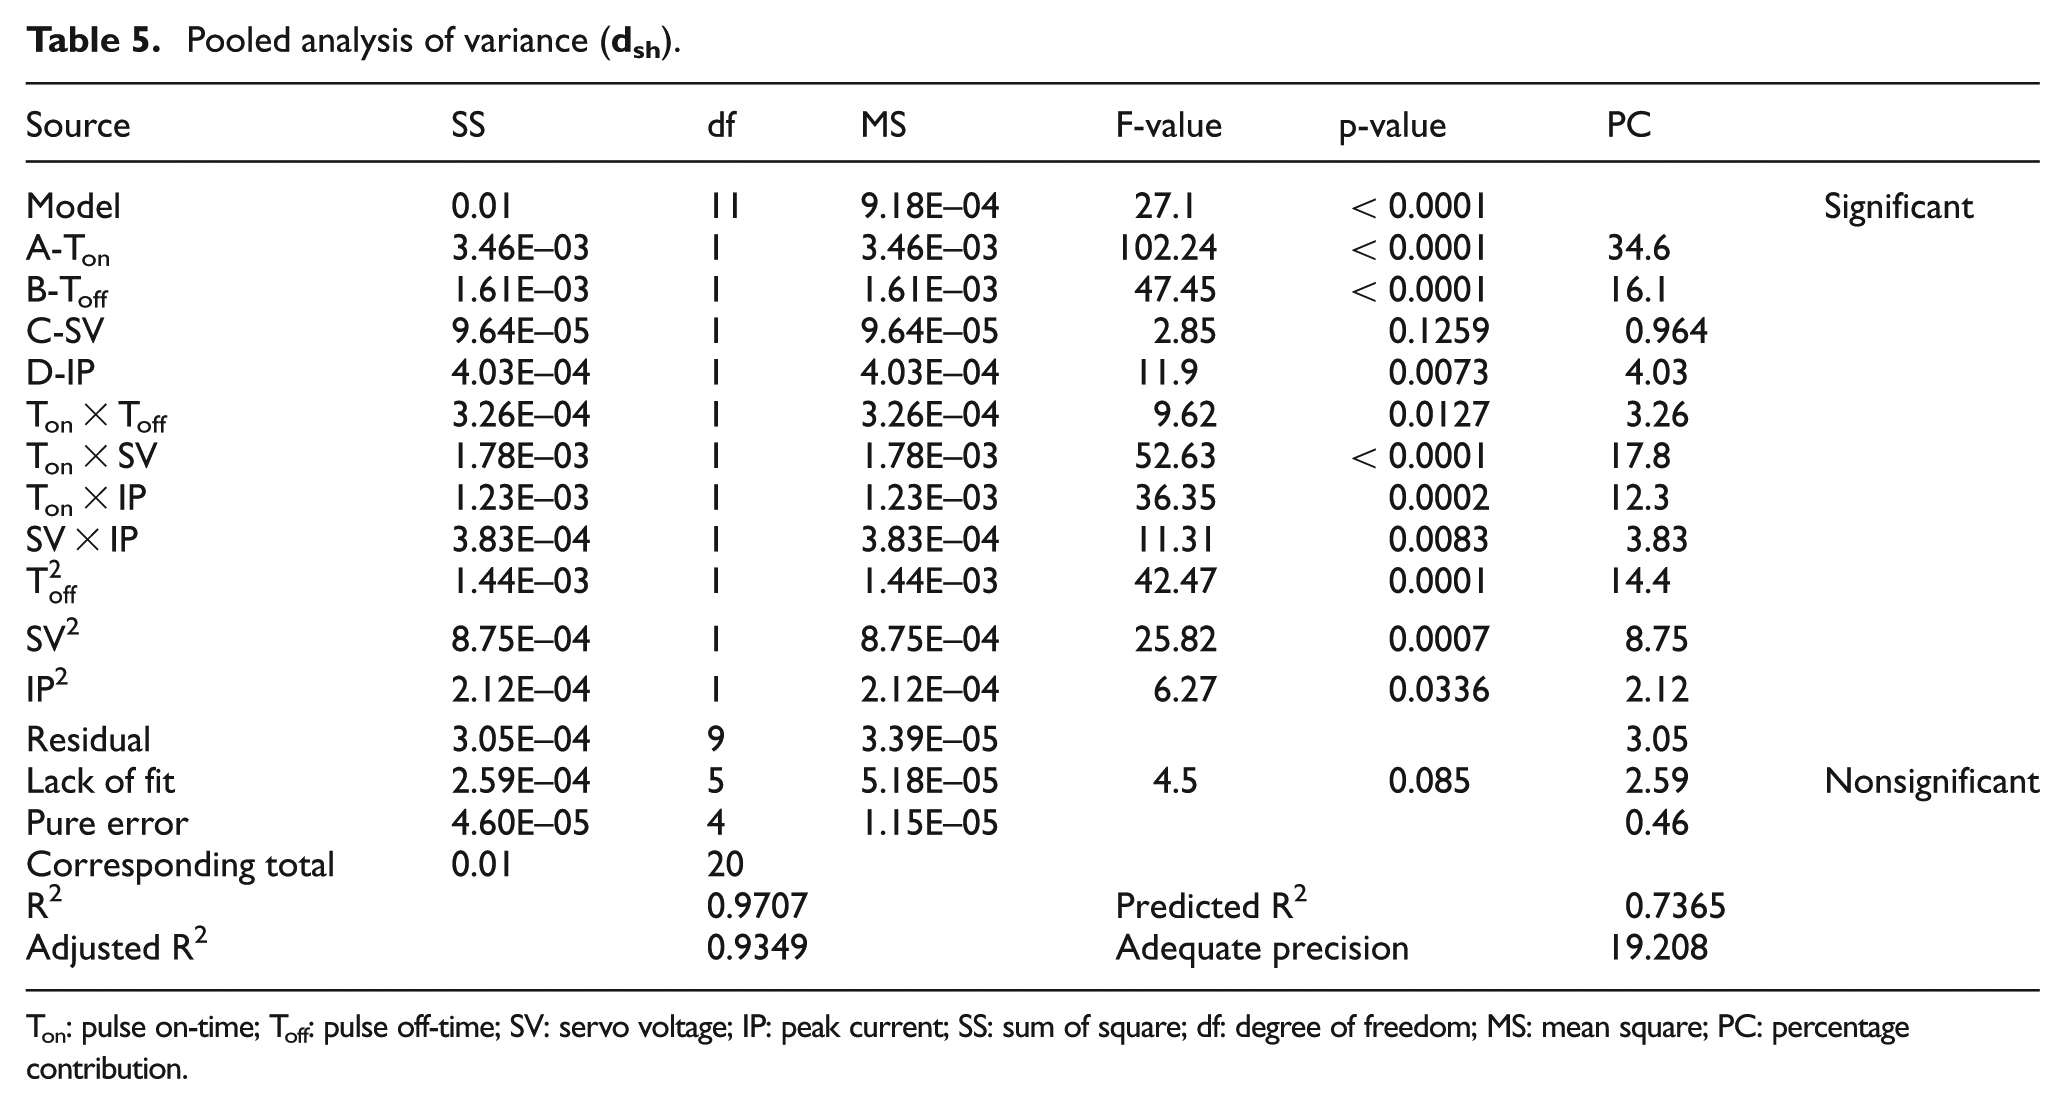
Pooled analysis of variance (CR).
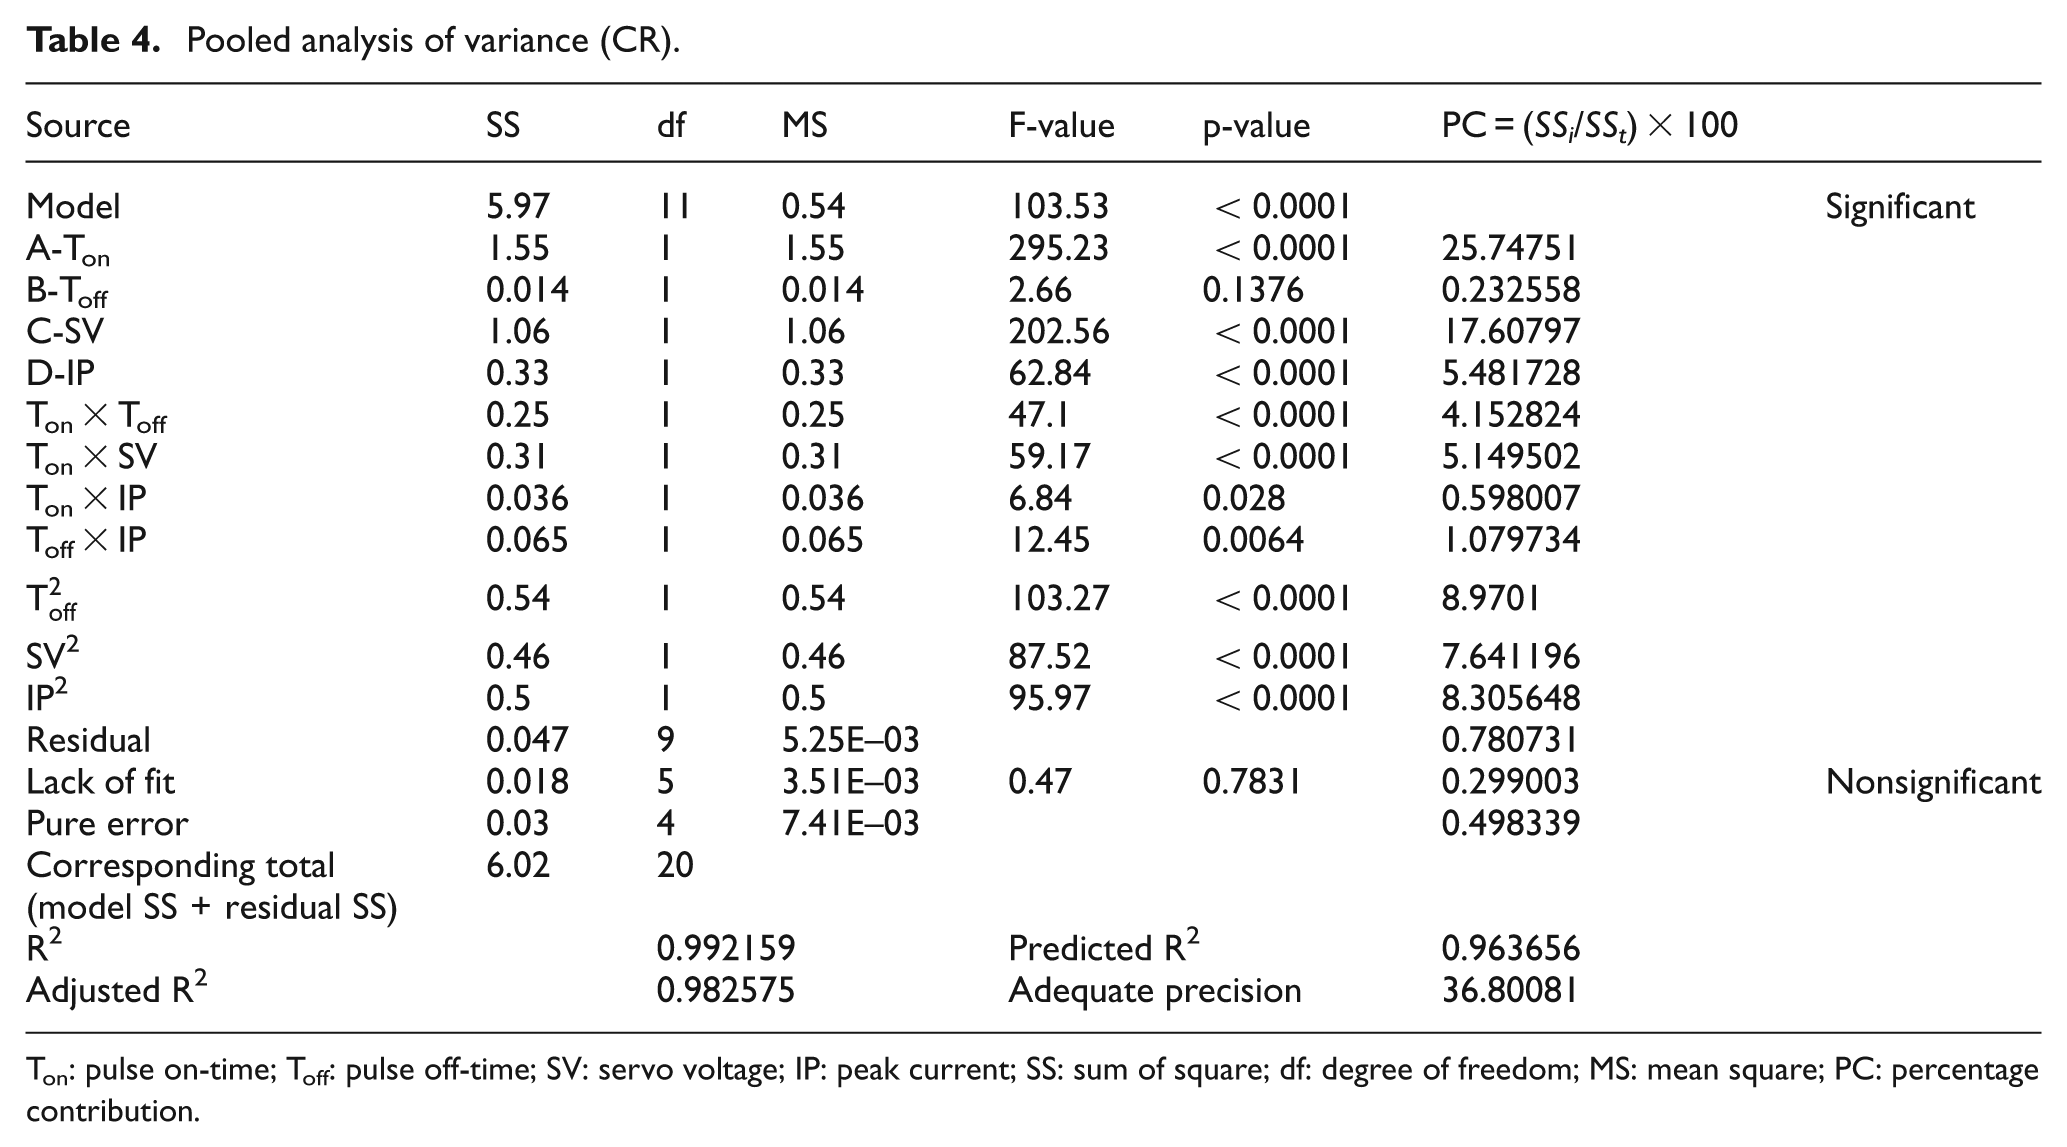
Ton: pulse on-time; Toff: pulse off-time; SV: servo voltage; IP: peak current; SS: sum of square; df: degree of freedom; MS: mean square; PC: percentage contribution.
The lack of fit determines the measure of failure of model to represent data in the experimental domain at which points are not included in the regression variation that cannot be accounted for random error. A nonsignificant lack of fit is desired, while in significant lack of fit indicated by a larger F-value, response predictor is discarded. 27
In the pooled ANOVA of CR (Table 4), the lack of fit is nonsignificant, and p-value is 0.7831. The value of R2 is 0.9921, which shows that 99.21% variations can be explained by this model and only 0.79% variation cannot be explained, indicating a good accuracy. The difference between adjusted R2 and predicted R2 is less that 0.2, which is also a sign of good model. Adequate precision measures the ratio of significant factors to nonsignificant factors, that is, signal to noise. This value (i.e. adequate precision) must be larger than 4 for an adequate model. Here, the value is 36.80, indicating a significant signal-to-noise ratio. Using DX-7, a statistical tool, multiple regression analysis on the experimental data has been performed, and the empirical relation in terms of actual factors is obtained as follows
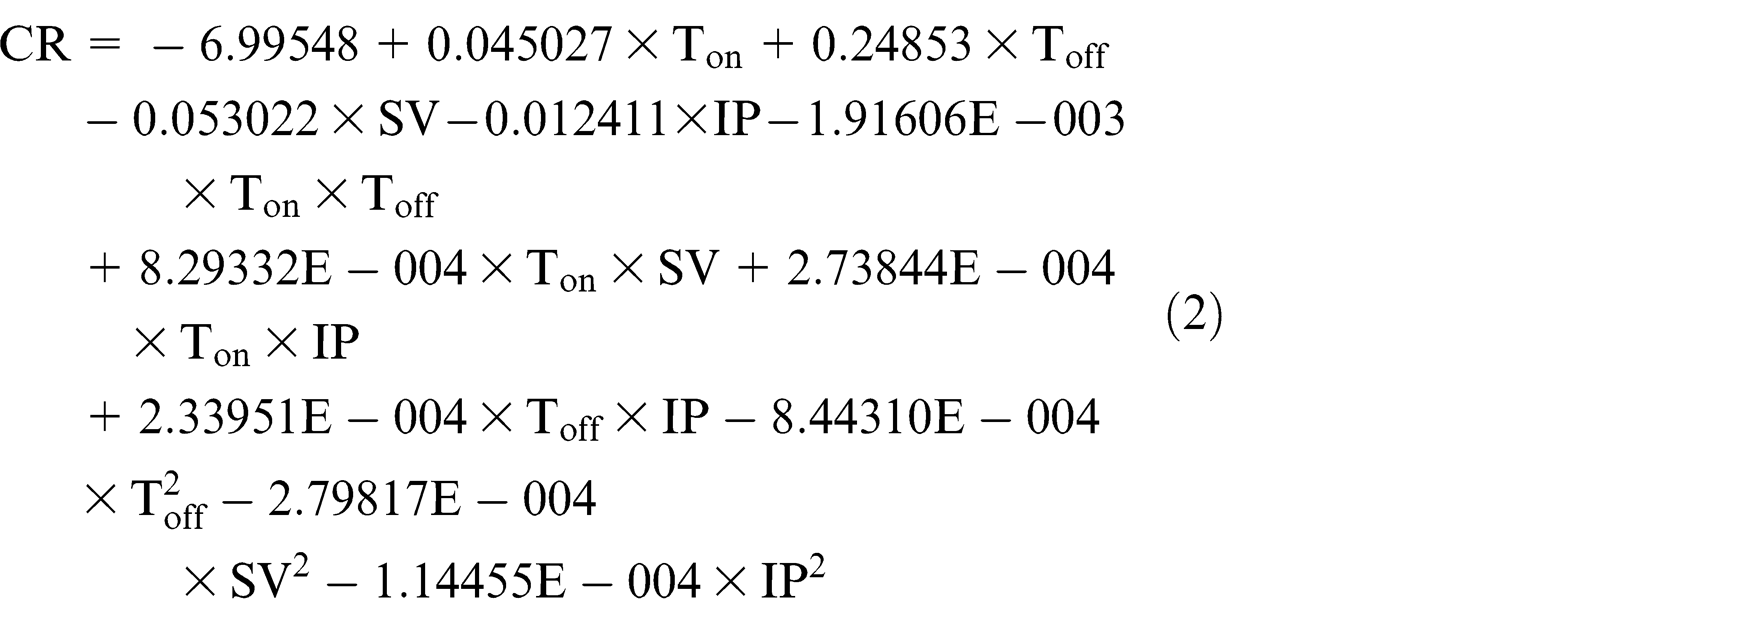
Figure 3(a) and (b) shows the normal probability plot (i.e. normality test) of residuals and predicted versus actual plot for CR. Most of the residuals fall on a straight line, which means that errors are normally distributed. Figure 3(c) reflects the variation of process parameters on CR. Increase in Ton and IP increases, the CR. Increasing pulse current (IP) for a longer duration (Ton) increases the discharge energy, which causes the high erosion of work material. Toff has an opposite effect on CR as compared to Ton. The main mechanism lies behind this is that if Toff increases, then the intensity of discharge energy decrease, due to reduction of erosion rate. 30 Lower SV value favors the CR as observed from Figure 3(c) during the machining of NiTi alloy. The probable reason for this is that at lower value of SV, lower will be the discharge waiting time, which favors productivity. Figure 3(d) shows the percentage contribution of various process parameters on CR. The percentage contribution of each factor is investigated as

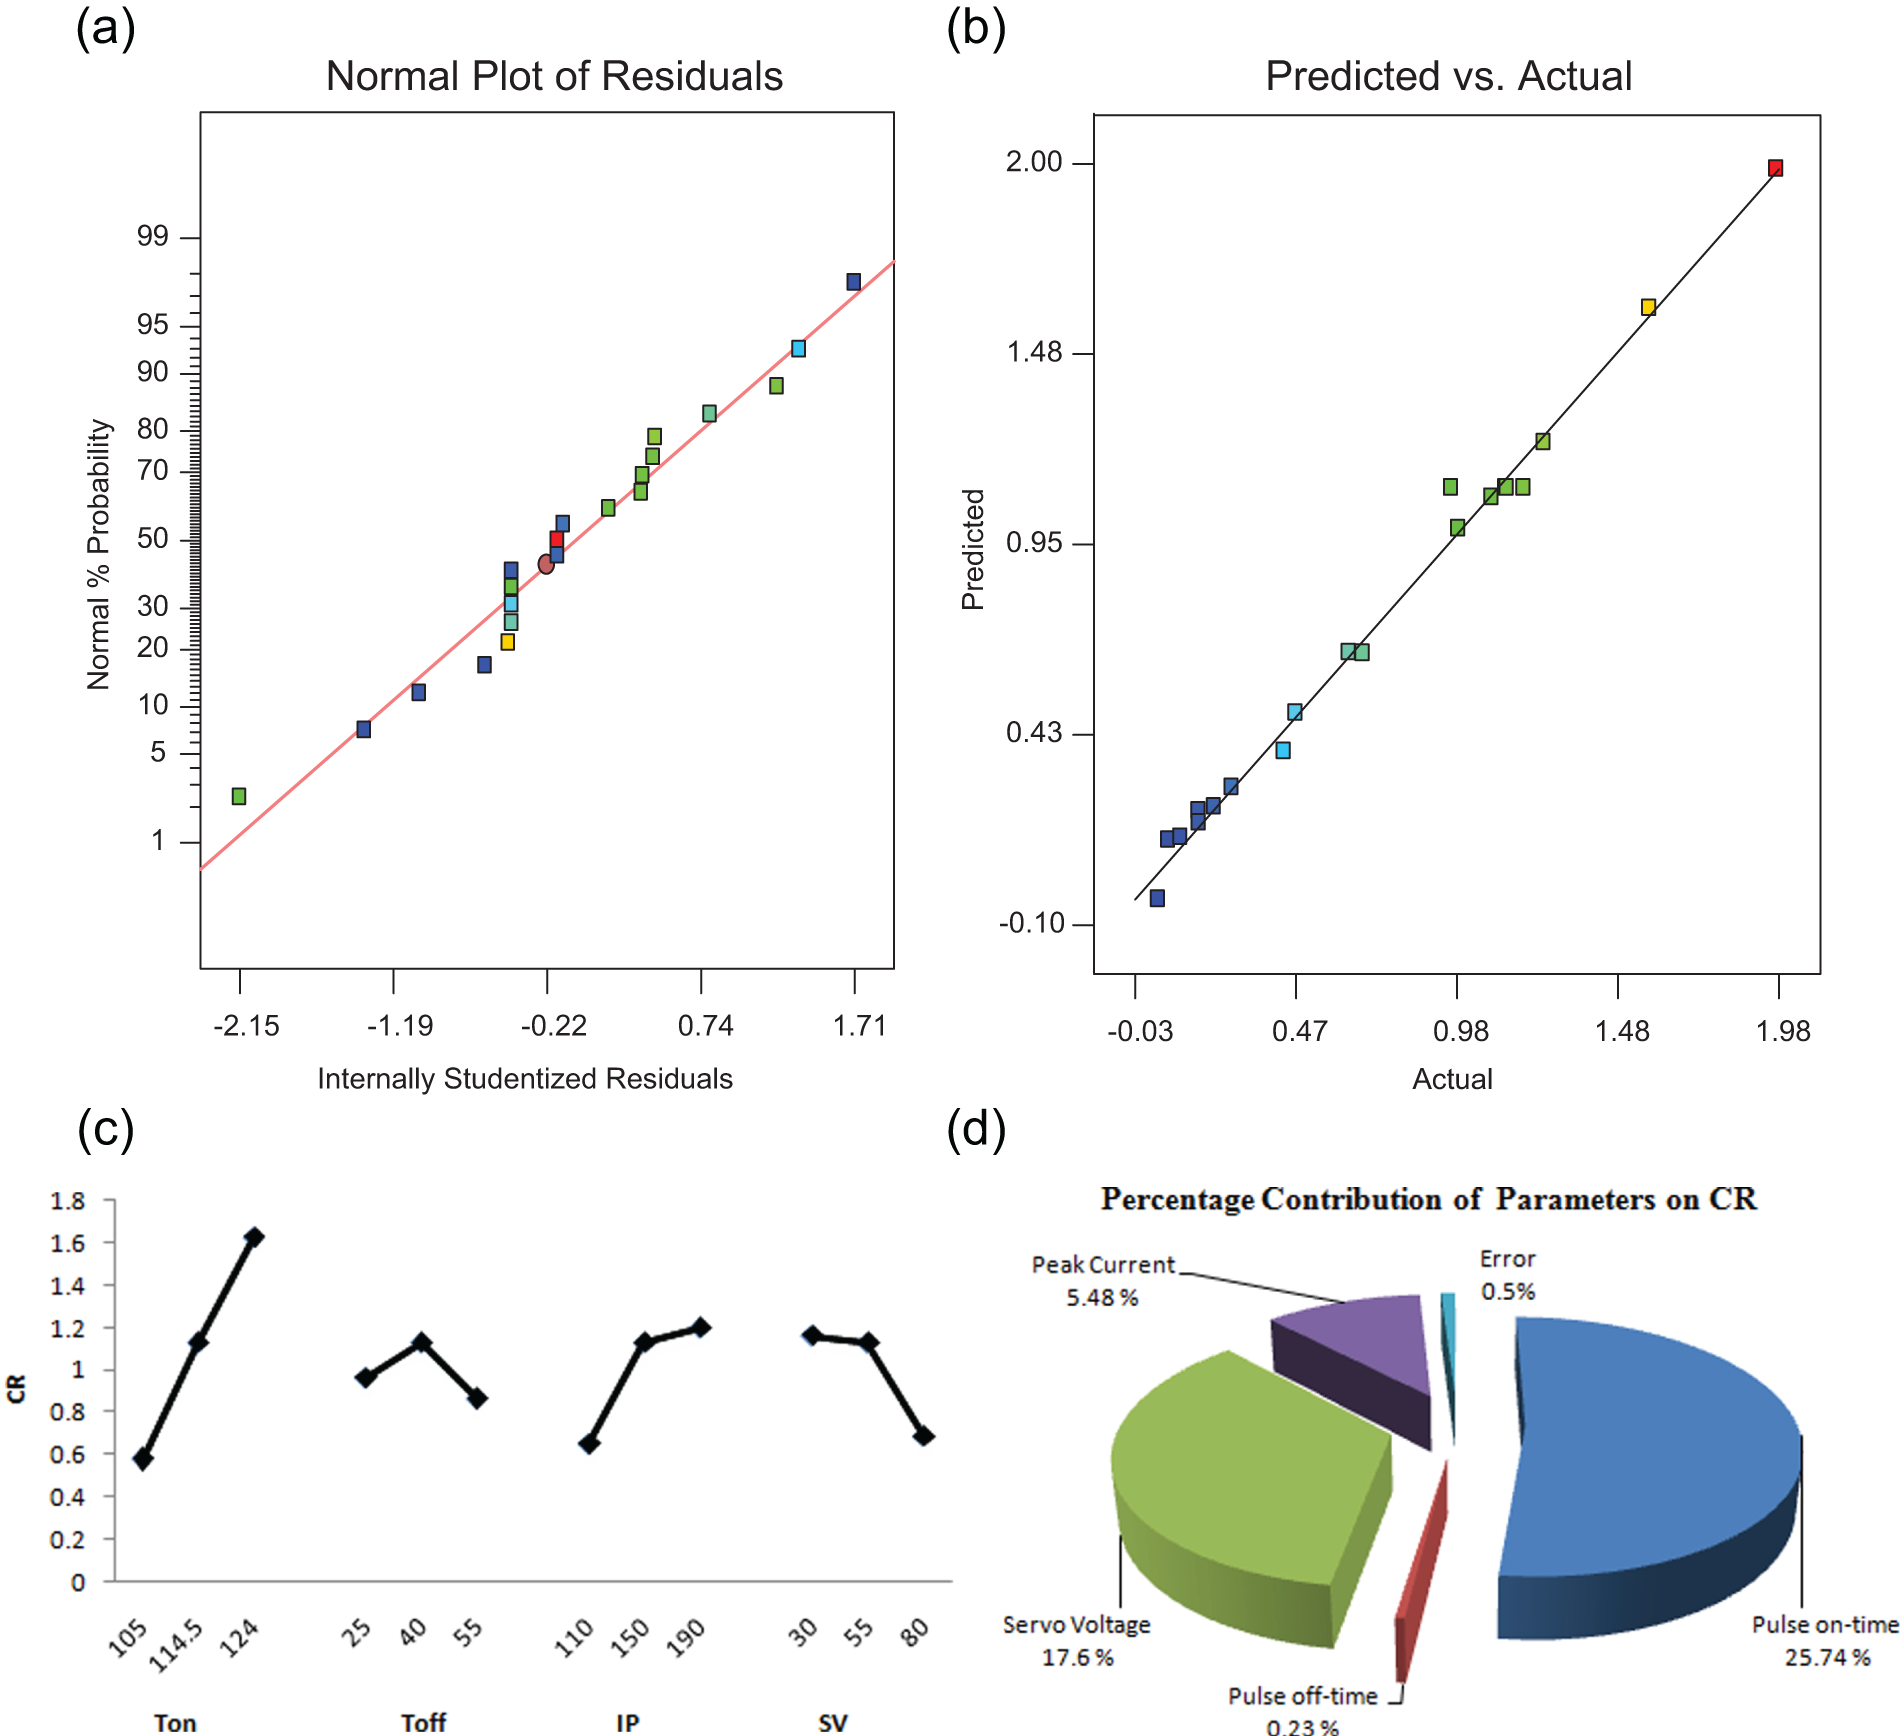
(a) Normal plot of residual for CR, (b) predicted versus actual plot for CR, (c) process parameter effect on CR and (d) percentage contribution of parameters for CR.
where SSi is the sum of square of respective factor and SSt is the total sum of square.
Here, Ton as the major contributor with contribution 25.75%, followed by SV (17.6%) and IP (5.5%), the percentage contribution of all other factors, that is, quadratic terms and interactions, is given in ANOVA table of CR (Table 4).
Analysis of dsh
Fit summary suggests a significant quadratic model for
Pooled analysis of variance (
Ton: pulse on-time; Toff: pulse off-time; SV: servo voltage; IP: peak current; SS: sum of square; df: degree of freedom; MS: mean square; PC: percentage contribution.
The value of R2 is 0.9707, which shows that 97.07% variations can be defined by this model and 2.93% variations cannot be explained, which reflects a good accuracy of model. Lack of fit; nonsignificant, difference between adjusted and predicted R2 is less than 0.2 and adequate precision is greater than 4 (i.e. 19.208), confirms the adequacy of the proposed model. After regression analysis on the experimental data, the empirical relation in terms of actual factors is obtained as follows
Figure 4(a) shows the normality test of residuals for
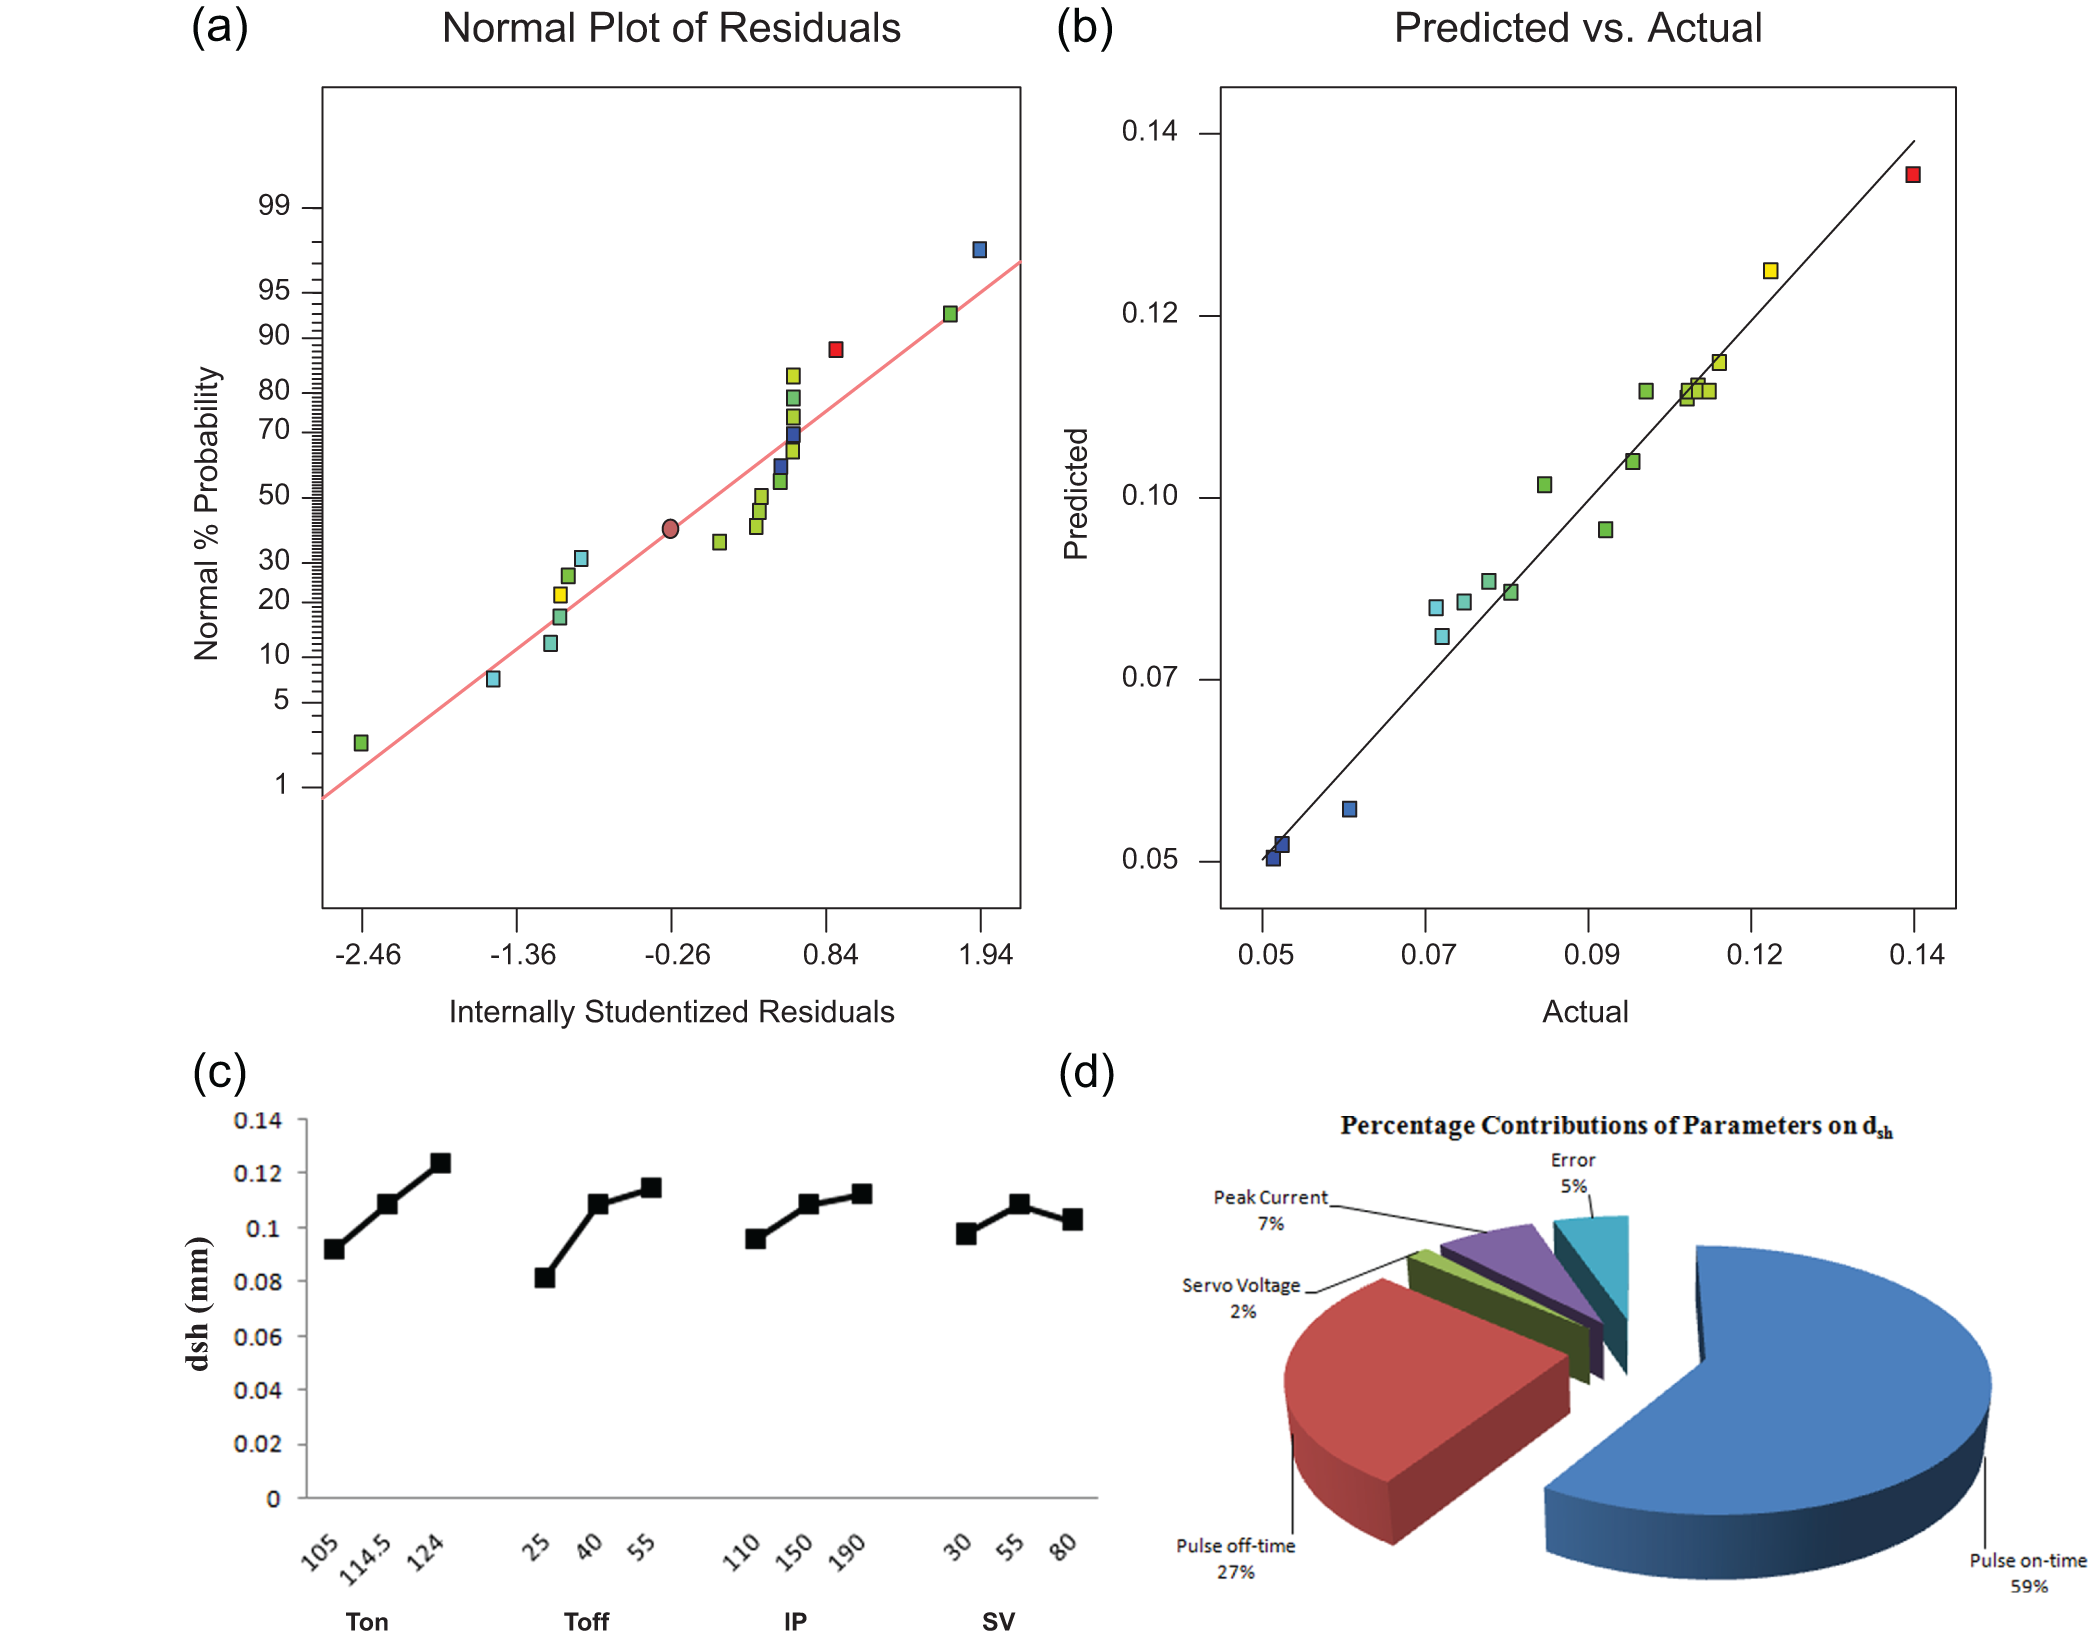
(a) Normal plot of residual for
Analysis of SR
Pooled version of ANOVA is shown in Table 6, which suggests that quadratic model is statistically significant for SR.
Pooled version of analysis of variance (SR).
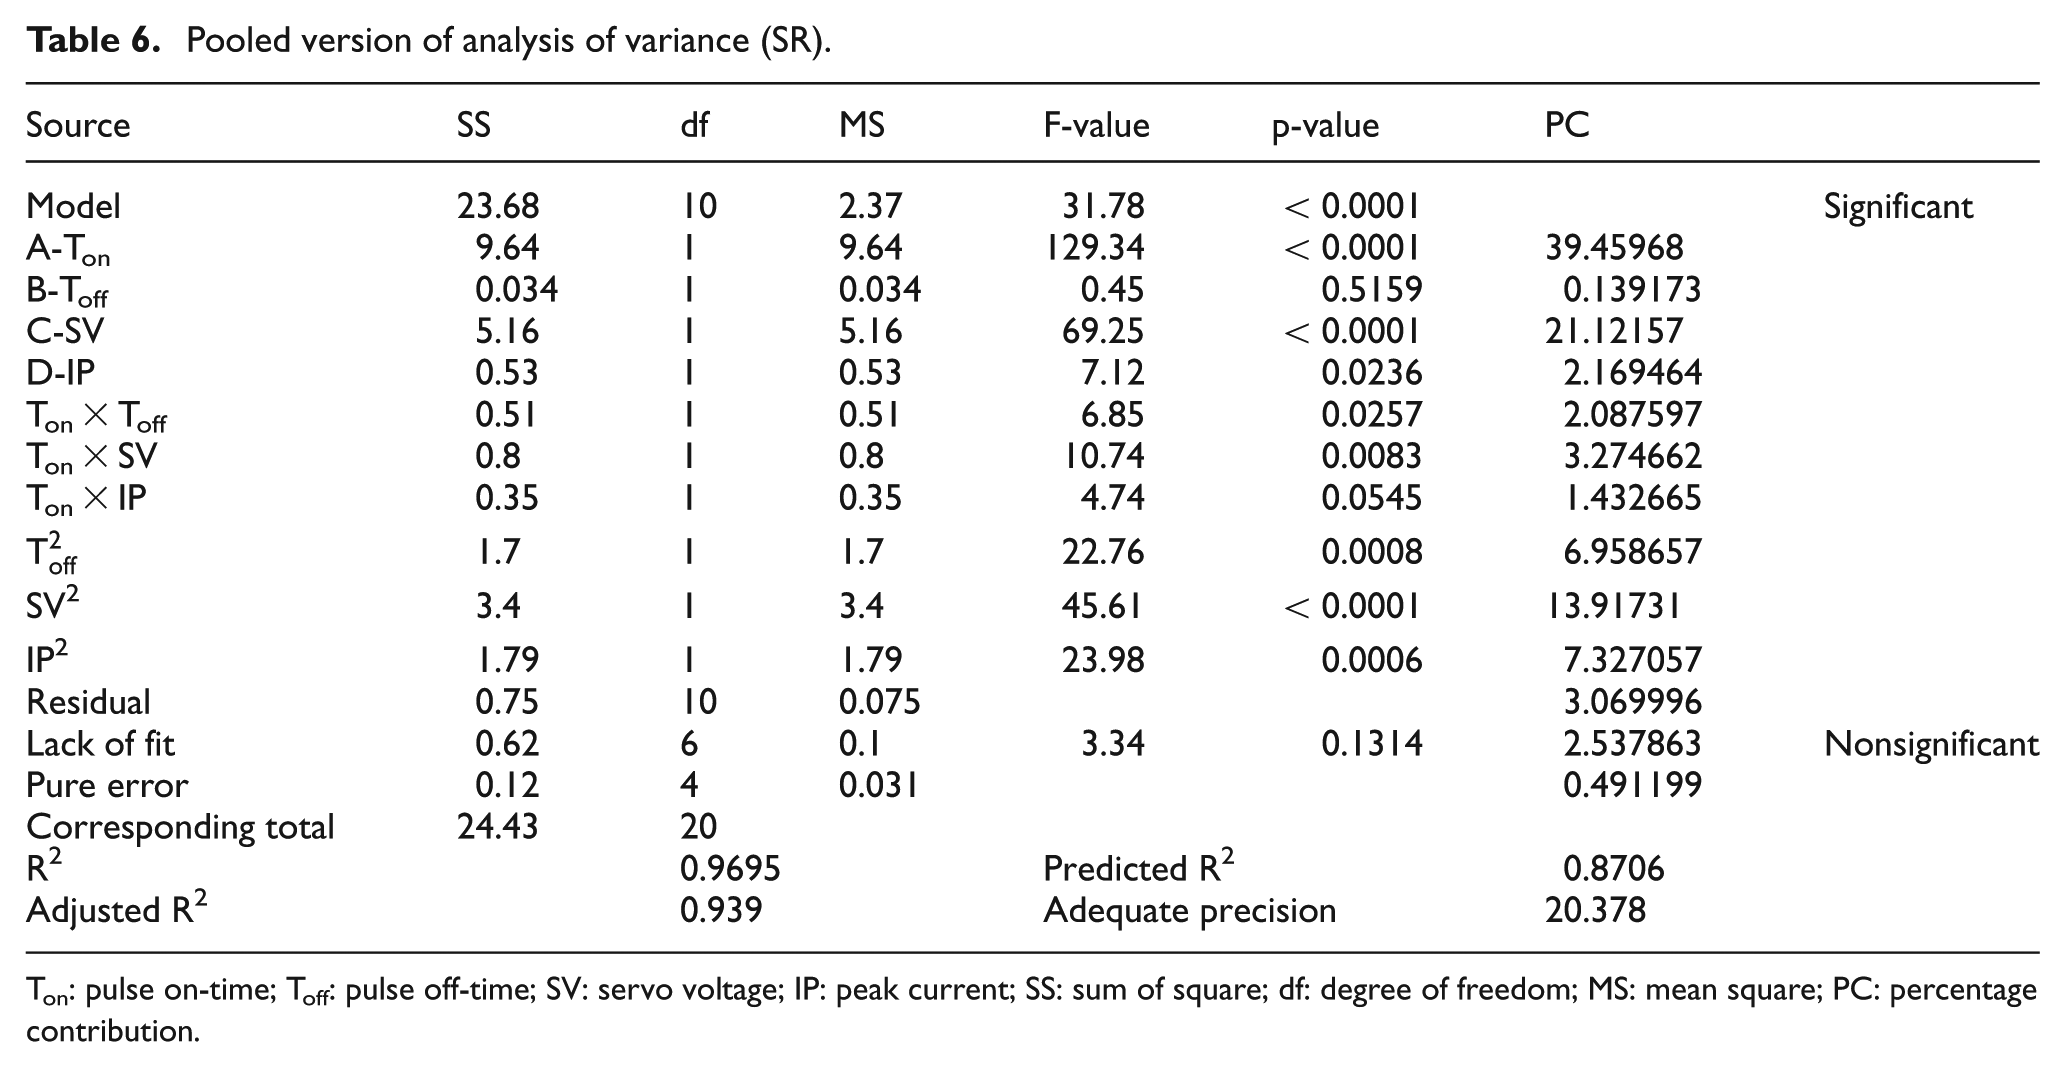
Ton: pulse on-time; Toff: pulse off-time; SV: servo voltage; IP: peak current; SS: sum of square; df: degree of freedom; MS: mean square; PC: percentage contribution.
The F-value of model is 31.78 (significant) with lack of fit value 0.1314 (nonsignificant). Ton, IP, SV, Ton × Toff, Ton × SV,
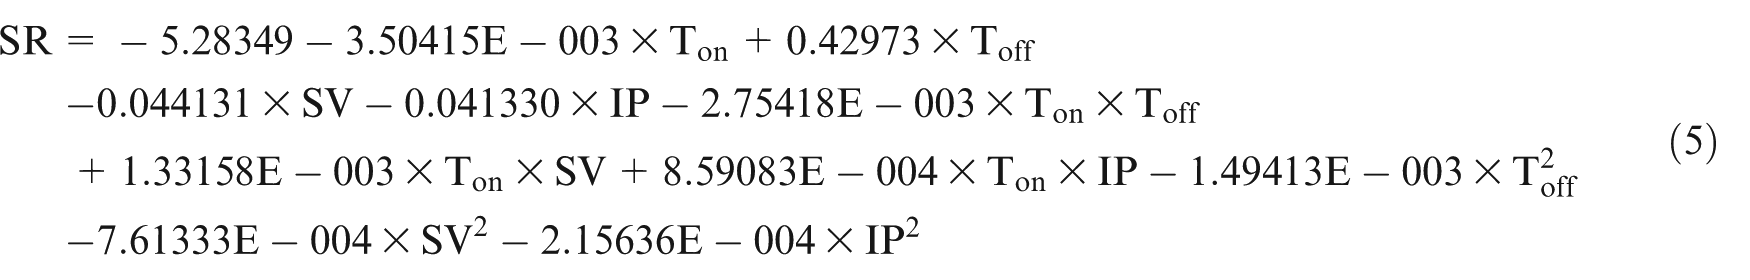
Figure 5(a) and (b) represents the normal plot of residuals and predicted versus actual value plot. The residuals in this figure are observed on a straight line. This verifies the normality test and signifies that the residuals are normally distributed. Mean value of the five Rzi (Rzi is the sum from the height of the highest profile peak and the depth of the lowest profile valley within a sampling length) values from the five sampling length (lri) over the total measured length (ln) is termed as overall SR (Rz). The variation of SR with process parameters is shown in Figure 5(c). The SR increases with the increase in Ton. This is due to the fact that with the increase in Ton, discharge energy increases which increases the melting of material and increases the crater size and hence increases SR. The SR decreases with the increase in Toff due to decrease in discharge energy. 32 In the present work, the influence of SV and IP on SR is contradicting in comparison to previous studies on WEDM. With the increase in IP from 110 to 150, SR remains constant, but it decreases further with the increase in IP up to 190 A. The probable reason for this fact may be the porosity of the material. At high value of IP, the melted work material may fill the voids or pores of the surface due to high pressure energy in the spark zone which decreases the SR.
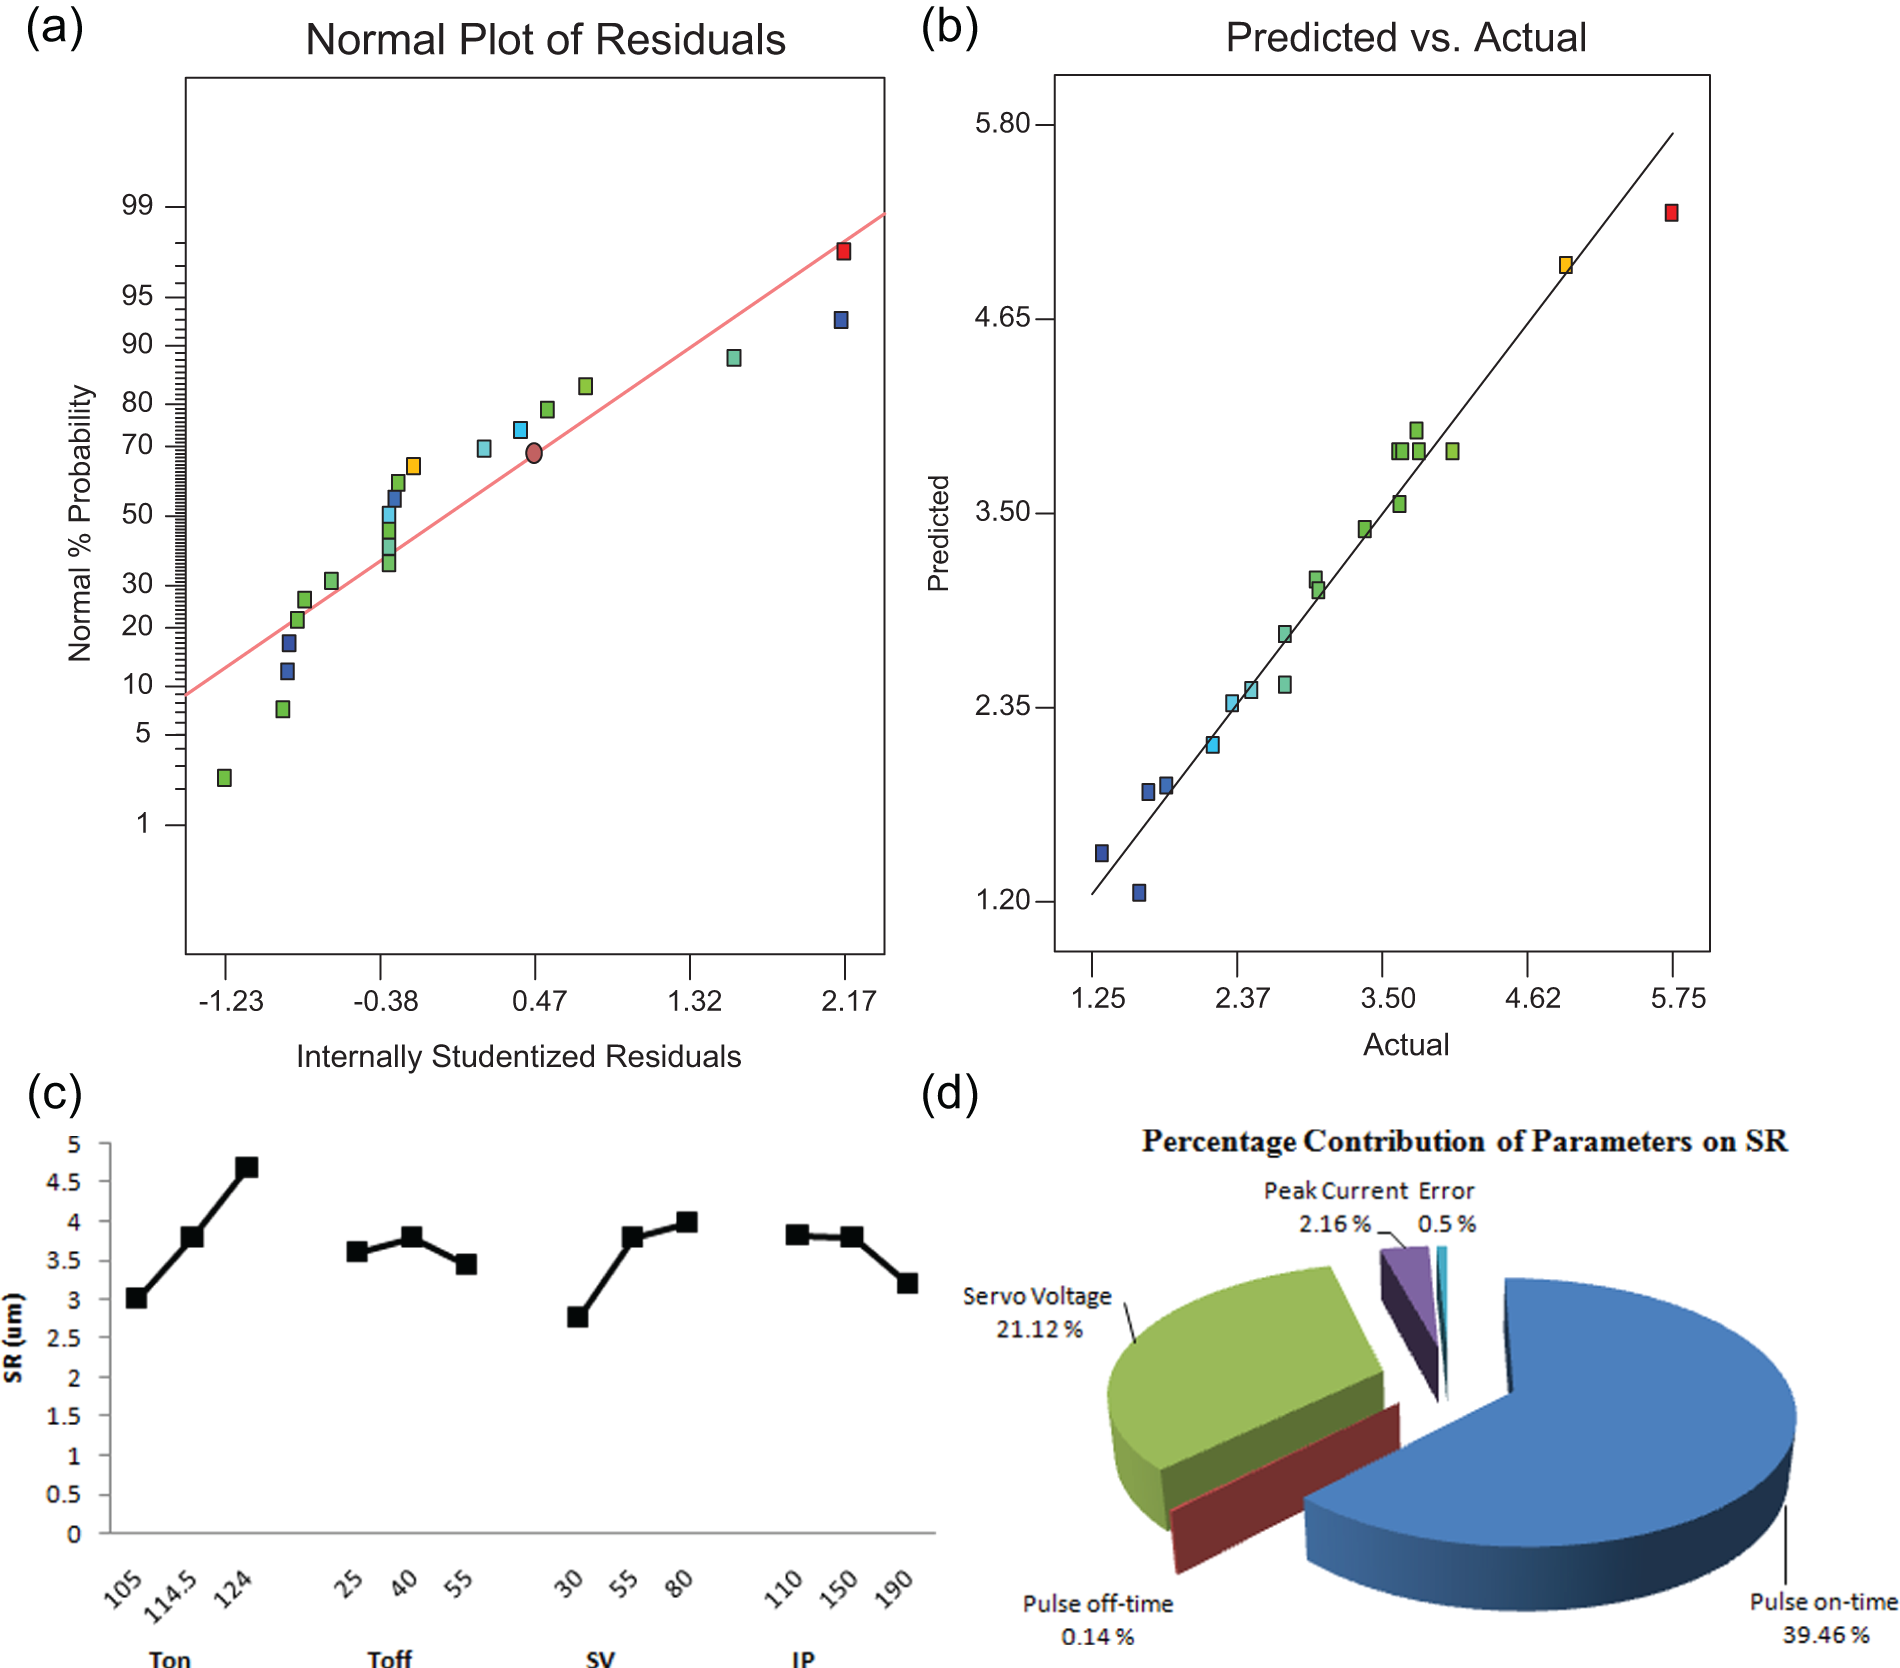
(a) Normal plot of residual (SR), (b) predicted versus actual plot (SR), (c) process parameter effect on SR and (d) percentage contribution of parameters (SR).
The percentage contribution of process parameters on SR is shown in Figure 5(d). Ton has maximum effect (i.e. 39.46%) on SR, followed by SV (21.12%) and IP (2.16%). Toff is nonsignificant with percentage effect 0.14% on SR. The percentage contribution of all interactions and quadratic terms is given in Table 6.
Multi-response optimization: desirability approach
Every machining process carries multiple response variables that may be conflicting in nature. The optimal setting for each response variable may vary depending on its importance for a particular application. In the present work, CR is the “larger the better” type of response while SR and dsh is “lower the better“ type of response. These types of problems can be easily solved by desirability approach. Here, three responses, namely, CR,
The value of importance is selected depending upon the required preference of the response. If any response gives a priority, then its importance is selected as 5. By default, the value of importance for a response is 3. The weighted geometric mean of individual desirability for the responses is compound desirability. Parameter setting having the maximum value of compound desirability gives optimal results of response variables. In the present investigation, the response variables CR,
Investigating the individual desirability (di) for each response;
Coalescing the individual desirability for getting the compound desirability (D);
Maximizing the compound desirability and finding the optimal settings of the process parameters.
The simultaneous objective function is a geometric mean of all transformed responses
where n is the number of responses in the measure. If any of the response falls outside the desirability range, the overall function becomes zero. Equation (6) can be modified as equation (7) by incorporating the concept of assigning different importance to responses and can be extended to

to reflect the possible difference in the preference of different responses, where the importance satisfies 0 < Ii < 1 and
As defined in the previous text, it is clearly mentioned that the objective function (i.e. desirability) varies from zero (outside the limit) to one (at the goal). Importance is selected according to the preference of a response. If there are numerous responses, then all goals coalesced into one desirability function. The “Goal” field for responses contain five choices: “none,”“maximum,”“minimum,”“target” or “in range.” Out of these, one is selected for simultaneous optimization. Process parameters are always in design range by default. The meanings of goals are as follows:
Range
di = 0 if low value > response > high value
di = 1 if response changes from low to high
Target
di = 0 if response < low value
0 ≤ di ≤ 1 because response changes from low to target
1 ≥ di ≥ 0 because response changes from target to high
di = 0 if response > high value
Minimum
di = 1 if response < low value
1 ≥ di ≥ 0 because response changes from low to high
di = 0 if response > high value
Maximum
di = 0 if response < low value
0 ≤ di ≤ 1 because response changes from low to high
di = 1 if response > high value
The di for “in range” are included in the product of desirability function D but not counted in determining n
Three-dimensional (3D) interaction plot (Ton and Toff) of desirability is shown in Figure 6(a). It is clear that with the increase in Ton, the desirability increases and attains a value of 0.710. This is a maximum value of desirability at which Ton is at 124 and Toff is at 25. A decrement in the desirability is observed when Toff increases. Higher value of Ton and smaller value of Toff favor desirability. Figure 6(b) shows the histogram of desirability, in which red bars are the desirability of the input process parameters (which is always equal to 1), while blue bars represent the individual desirability of response variables. The lowest blue bar is the combined or compound desirability of response variables. The individual desirability of CR,
Predicted values of response variables.
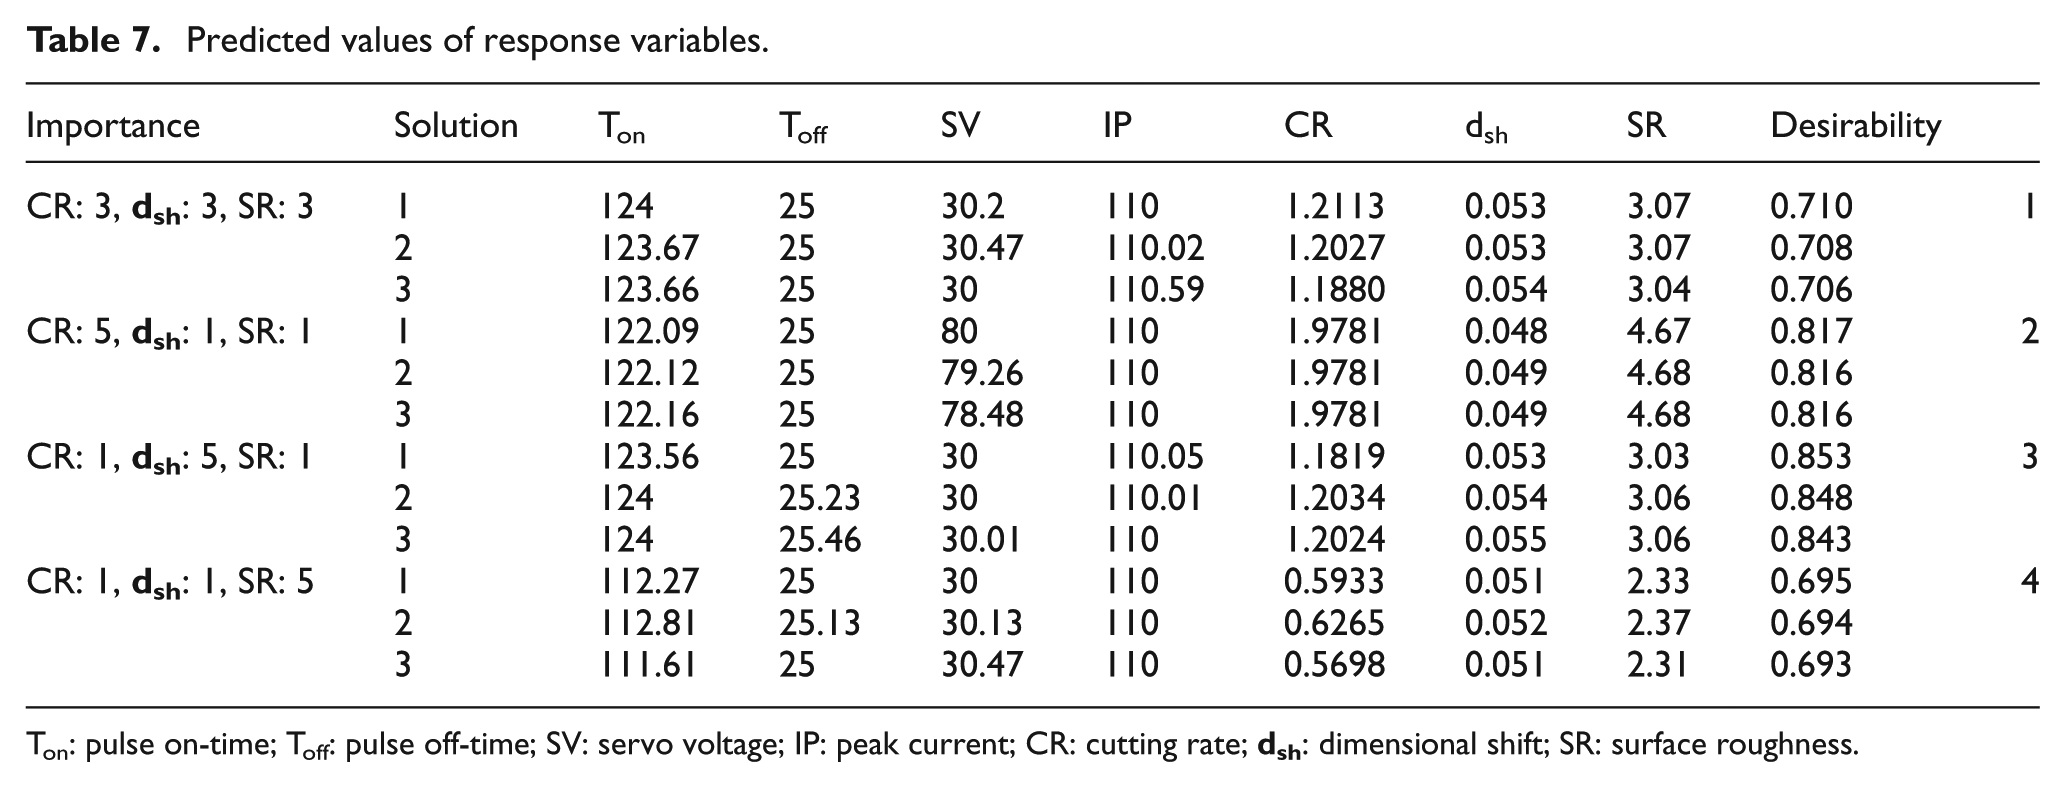
Ton: pulse on-time; Toff: pulse off-time; SV: servo voltage; IP: peak current; CR: cutting rate;
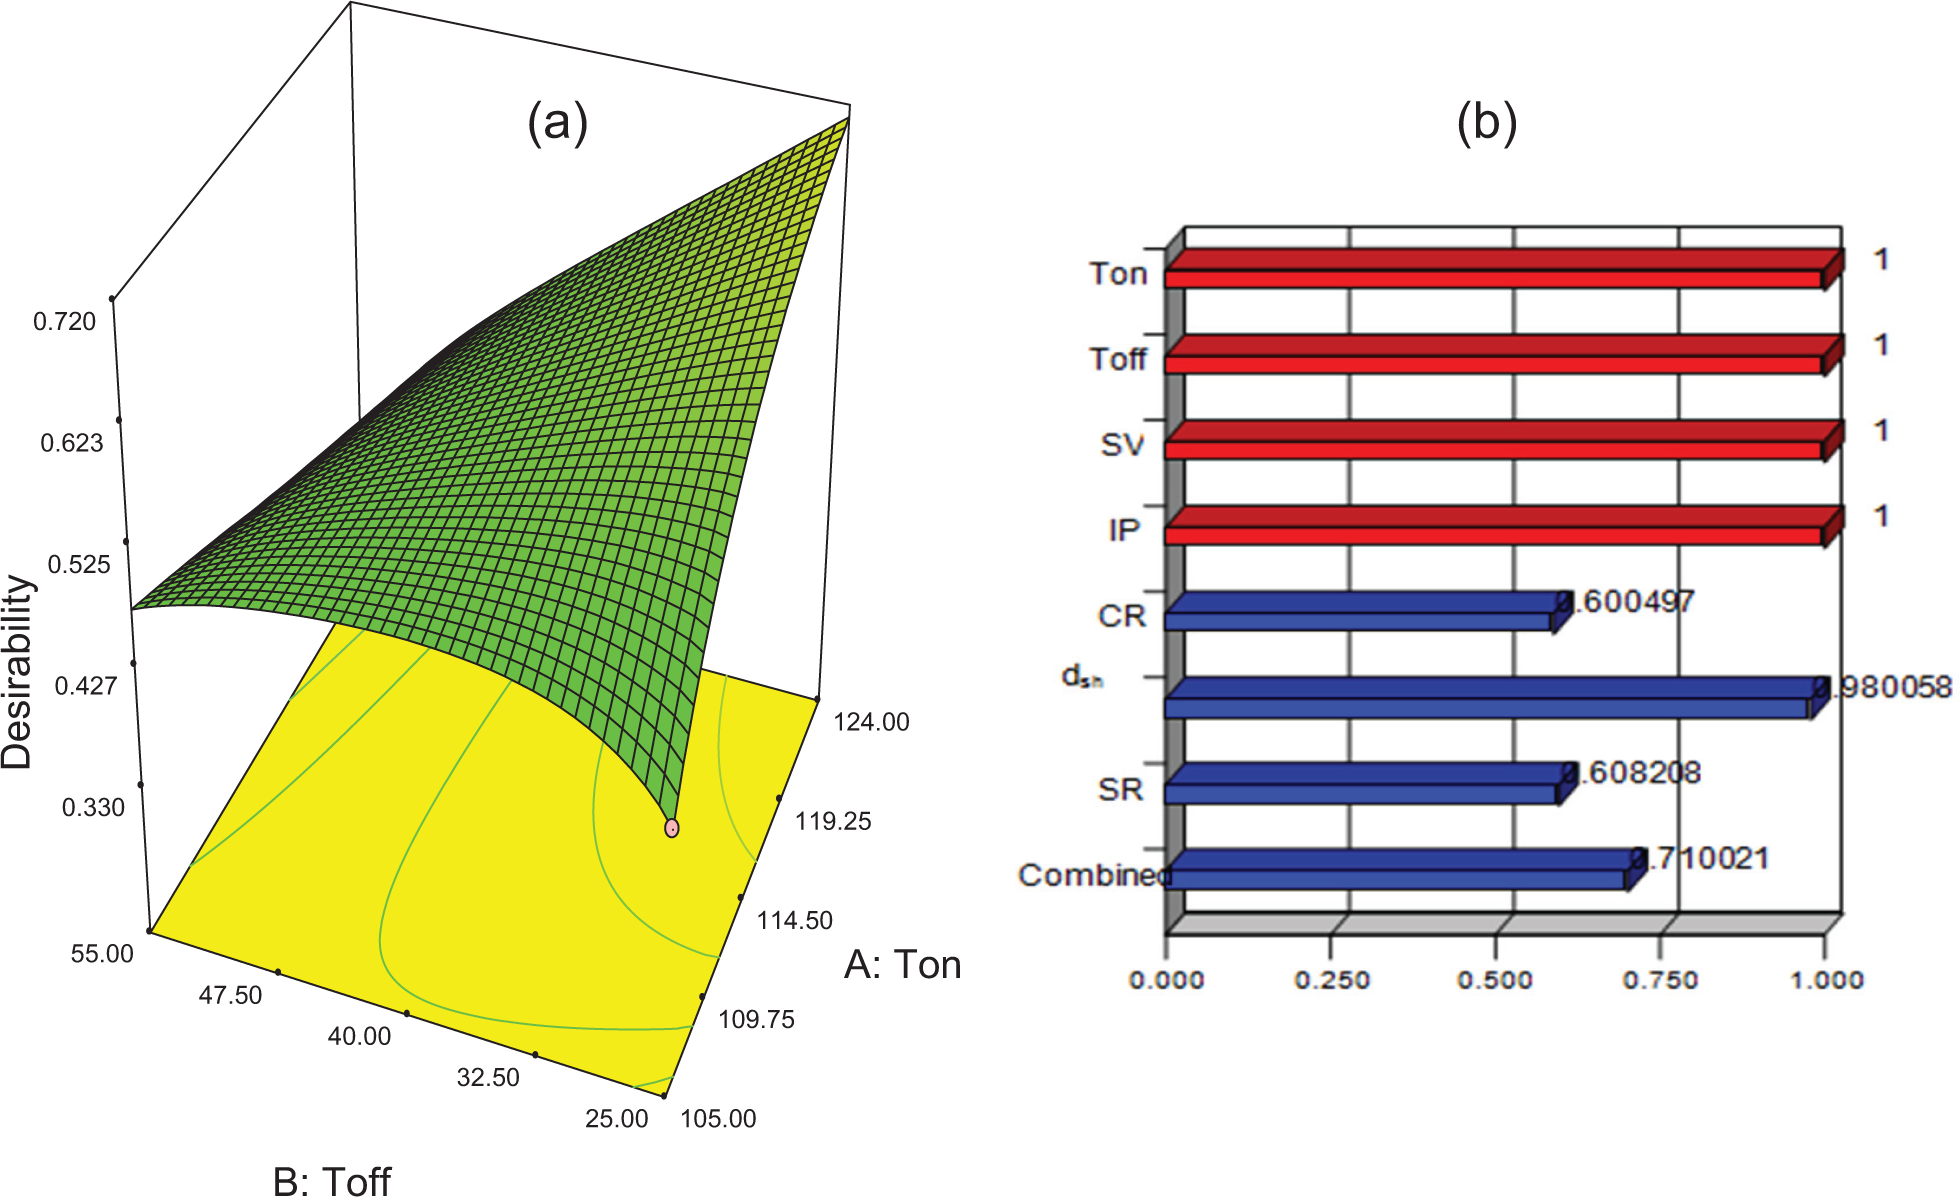
(a) 3D interaction plot of Ton and Toff and (b) desirability histogram.
In the second set of experiments, importance 5 is given to CR, while all others are kept at importance 1. Predicted response is again compared with the experimental values at the optimal setting of maximum desirability. Similarly, in the third and fourth sets of experiments, importance level 5 is given to
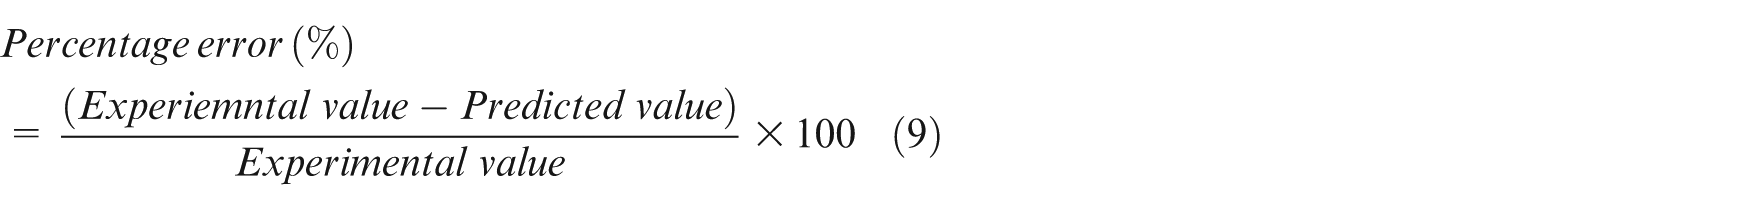
Experimental results at the optimal settings.
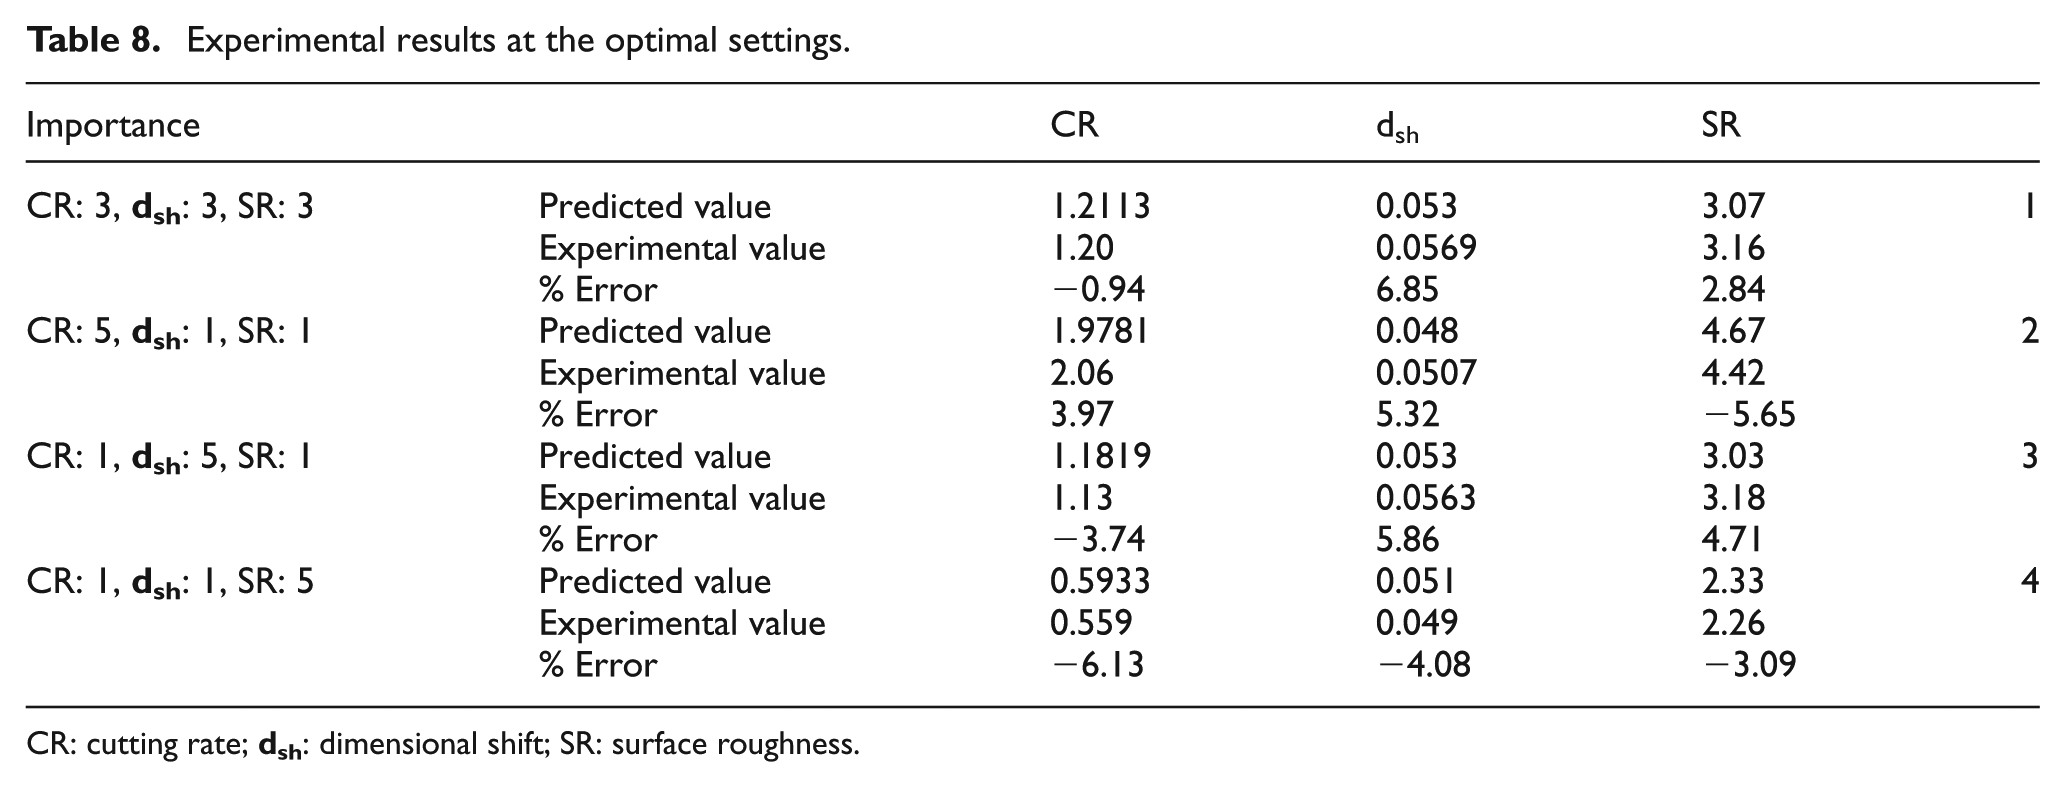
CR: cutting rate;
SEM analysis after WEDM
Although WEDM is a best alternative to generate intricate and complex profiles in hard metal alloys and metal matrix composites, with high degree of accuracy, but damaged surface layer with poor surface integrity is a major disadvantage of WEDM. After WEDM, machined surface of NiTi alloy, generally, consists of a white layer which constitutes precipitates of TiC and metal oxides. The micro-hardness of this white layer reaches up to 875 Hv which is several times greater than bulk hardness of NiTi alloy. This white or brittle layer diminishes the SME and degrades the biocompatibility of NiTi alloy.16,20,22
In the present work, a white layer or recast layer of thickness 10–15 μm was found on work samples. Figure 7 shows the SEM image of recast layer on machine surface of Ni40Ti60. Higher the thickness of white layer, higher the probability of diminishing of specific characteristics of Ni40Ti60.
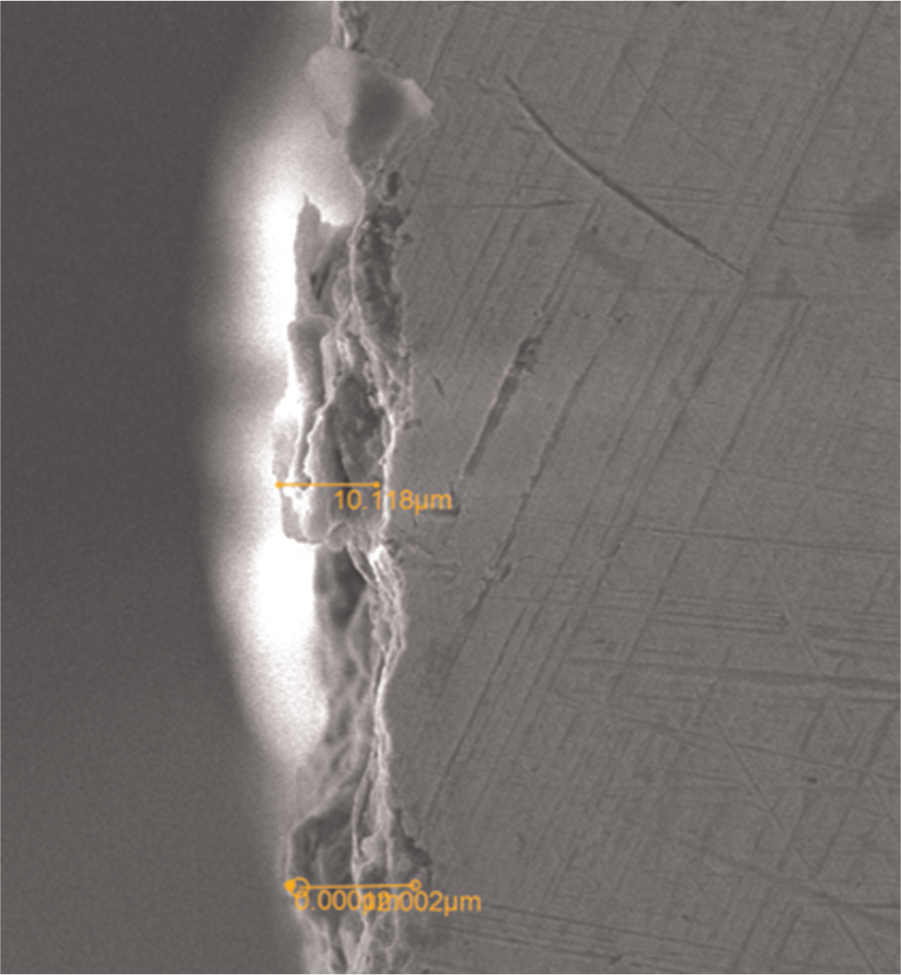
White layer on Ni40Ti60 after WEDM.
Also, in WEDM, after the first cut, a small edge line is found on work surface which represents the unmachined material left on work surface. Jangra 35 has investigated this unmachined area left on work surface as represented in Figure 8. In Figure 8, the dotted line (OIF) shows the wire path starting form point O. D is the effective spark diameter which is the sum of wire electrode diameters (d) and spark gap (SG). According to the tool path profile, wire electrode should reach the point I to complete the machining job. But in actual practice, cutting takes place earlier at point F, and no spark occurs further. As a result, some unmachined area or projection left on work surface.
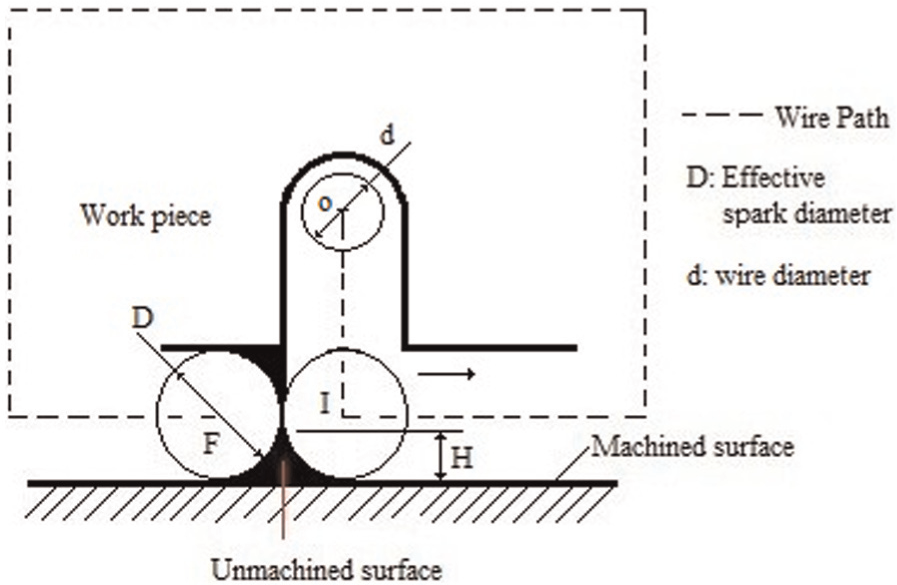
Unmachined area on work surface after rough cut in WEDM. 33
In the present work, similar to Figure 8, an unmachined area in triangular shape appears on machined surface of Ni40Ti60 when the wire tool completes clockwise path A-B-C-D-E-A as mentioned in Figure 2. The height or shape of the unmachined area on work surface depends on the effective spark diameter (D) which is highly affected by the discharge energy. Therefore, at low discharge energy (Ton: 105 μs, Toff: 55 μs, SV: 80 V and IP: 150 mu), a sharp triangular shape is obtained at work surface, while deteriorated surface projections are obtained at higher discharge energy as shown in Figure 9(a)–(c) respectively.
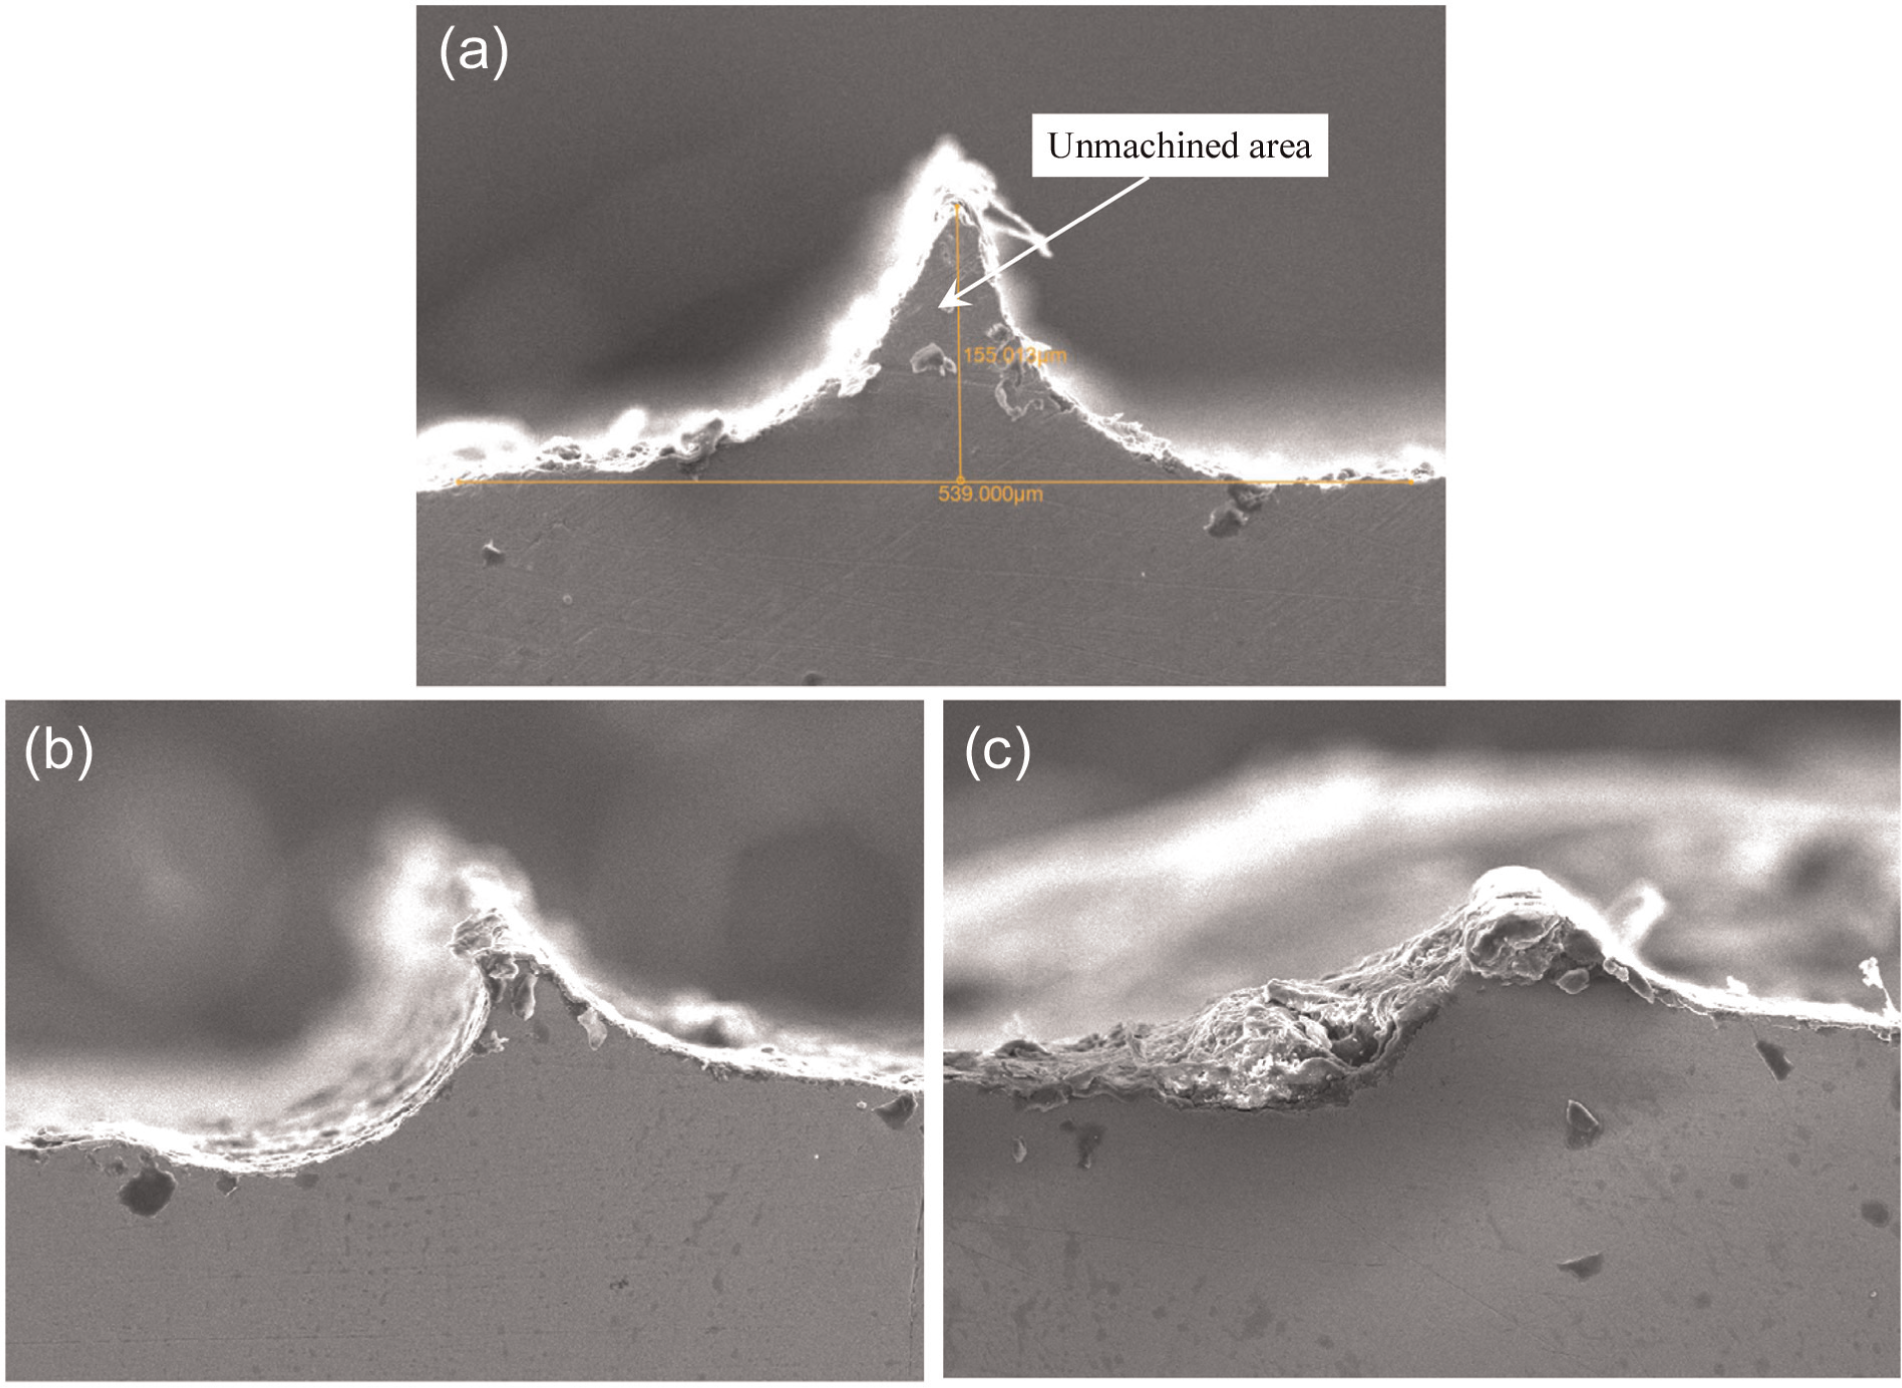
Unmachined surface area corresponding to (a) low discharge energy (Ton: 105 μs, Toff: 55 μs, SV: 80 V and IP: 150 mu; (b) medium discharge energy (Ton: 114 μs, Toff: 40 μs, SV: 55 V and IP: 150 mu); and (c) high discharge energy (Ton: 124 μs, Toff: 40 μs, SV: 80 V and IP: 190 mu).
Concluding remarks
In the present work, porous Ni40Ti60 alloy has been processed using WEDM process. The influence of four input discharge parameters, namely, Ton, Toff, IP and SV, has been investigated on response variables on porous Ni40Ti60 alloy. Using RSM, CCRD has been used for planning of experiments. The quadratic models have been developed to correlate the input parameters with response variables, namely, CR,
The present work concludes the following points:
Processing of porous NiTi alloy on WEDM yields better machining performance in terms of MRR, surface finish and dimensional accuracy if compared with conventional machining processes;
The CR of porous NiTi alloy on WEDM has been obtained in the range of 0.11–1.97 mm/min. The parameter setting that provides maximum CR is Ton = 130 μs, Toff = 40 μs, SV = 55 V and IP = 150 mu. The significant parameters that affect CR up to 95% confidence level are Ton, SV and IP;
The SR (in terms of Rz) is obtained in the range of 1.33–5.75 μm. The optimal parameter setting for minimum SR is Ton = 114 μs, Toff = 40 μs, SV = 13 V and IP = 150 mu. The significant parameters that affect SR up to 95% confidence level are Ton, SV and IP;
ANOVA for response variables (i.e. CR,
To obtain a single setting of parameters for three response variables, multi-response optimization has been carried out using desirability approach. The optimal parameter setting for multi-response variables is obtained as Ton = 124 μs, Toff = 25 μs, SV = 30 V and IP = 110 mu, with desirability value of 0.708. Confirmation experiments were performed corresponding to the optimal parameter settings. The experimental values were compared with the predicted values, and the percentage error ranges between −6.13% and +6.85%;
After the first cut in WEDM, white layer and unmachined surface area are major surface defects that diminish the SME, pseudo-elasticity and biocompatibility of porous NiTi alloy and hence possess a serious challenge for its applications in medical and other fields. Therefore, elimination of white layer and unmachined area on NiTi surface is a future challenge during machining on WEDM. These surface defects can be partially eliminated by controlling the WEDM parameters in the first cut and then using trim cutting operation at optimized parameter setting.
Footnotes
Declaration of conflicting interests
The author(s) declared no potential conflicts of interest with respect to the research, authorship, and/or publication of this article.
Funding
The author(s) received no financial support for the research, authorship, and/or publication of this article.