
Abstract
This article proposes the distribution similarity measure–based Gaussian mixtures model for the contact-state (CS) modelling in force-guided robotic assembly processes of flexible rubber parts. The wrench (Cartesian force and torque) signals of the manipulated object are captured for different states of the given assembly process. The distribution similarity measure–based Gaussian mixtures model CS modelling scheme is employed in modelling the captured wrench signals for different CSs. The proposed distribution similarity measure–based Gaussian mixtures model CS modelling scheme uses the Gaussian mixtures model in modelling the captured signals. The parameters of the Gaussian mixtures models are computed using expectation maximisation. The optimal number of Gaussian mixtures model components for each CS model is determined by considering the classification success rate as an index for the similarity measure between the distribution of the captured signals and the developed models. The optimal number of Gaussian mixtures model components corresponds to the highest classification success rate; hence, object elasticity variation would be accommodated by properly choosing the optimal number of Gaussian mixtures model components. The performance of the proposed distribution similarity measure–based Gaussian mixtures model CS modelling strategy is evaluated by a test stand composed of a KUKA lightweight robot doing peg-in-hole assembly processes for flexible rubber objects. Two rubber objects with different elasticity are considered for two experiments; in the first experiment, an elastic peg of 30 Shore A hardness is considered and that of the second experiment has hardness of 6 Shore A which is even softer than the one used in experiment 1. Employing the proposed distribution similarity measure–based Gaussian mixtures model CS modelling strategy excellent classification success rate was obtained for both experiments. However, more Gaussian mixtures model components are required for the softer one that gives a strong impression of the non-stationarity behaviour increment for softer materials. Comparison is performed with the available CS modelling schemes and the distribution similarity measure–based Gaussian mixtures model is shown to provide the best classification success rate performance with a reduced computational time.
Keywords
Introduction
Robotic assembly attracted the interest of both academia and industry, due to its vital role in automating the production for many processes. Excellent robotic assembly strategies were reported in the literature that use different kinds of vision and laser sensors in order to have a precise location of the mated parts (see Biao et al., 1 Muelaner et al., 2 Jayaram and Joshi, 3 and the references therein). However, force-controlled robots appear to be one of the efficient systems in assembly, since it handles processes when the vision systems become less accurate. Parts occlusion, unclean environment in the industry, and variable illuminations constitute the main reasons of vision systems performance degradation, which is motivating the use of the force-controlled robots. In order to accommodate position uncertainties, passive compliance wrists were built for peg-in-hole assembly processes that would facilitate the mating process with position uncertainties.4,5 In many assembly processes, using passive compliance wrist alone might not stand a chance that necessitate adding a kind of perception to the force-guided robotic assembly. An abstract knowledge or perception of the environment can be added to the robot using the sensed wrench (Cartesian force and torque), pose (Cartesian position and orientation), and/or twist (linear and angular velocity) signals of the manipulated object. The addition of such abstract knowledge is realised by contact-state (CS) modelling of the robot with respect to its surrounding environment. However, CS modelling in force-controlled robots is rooted back to the 1980s.
Desai and Volz 6 proposed a significant milestone in transferring skills to the compliant motion robots by introducing the notion of the contact formation (CF). For instance, if one has a polyhedral manipulated object interacting with a certain environment, then one can describe the contact of the object vertex to the face of the environment and call it as a vertex–face (v–f) contact. Likewise to the edge–face (e–f), face–face (f–f), edge face–2faces (ef–2f), 2faces–2faces (2f–2f), 3faces–3faces (3f–3f), and other possible contacts. Each one of these contact phases is called as CF, and a force-controlled robotic assembly task can be composed by these set of CFs. Hirai and Iwata 7 proposed a CS modelling scheme for such robotic systems using the geometric model of the manipulated object along with the sensed force signals. Petri net was successfully employed in modelling and planning force-controlled robotic assembly tasks, and promising results were obtained.8,9 Uncertainties were accommodated for such modelling tasks through developing a CS modelling system that relies on incorporating the sensed forces, the sensed error signals, and the contact compliance. 10 The concept of discrete event systems was adroitly used in producing efficient CS models.11,12
Hovland and McCarragher, 13 Skubic and Volz, 14 Skubic et al., 15 and Iwata and Sugano 16 used neural networks in building CS modelling systems of compliant motion robots. Relying on the task sequence, local depart space (LDS) was successfully utilised in recognising the CSs with accommodating possible uncertainties. 17 Skubic and Volz, 14 Skubic et al., 15 Xiao and Liu, 18 Everett et al., 19 Skubic and Volz, 20 and Son 21 employed fuzzy classifiers in recognising different CSs for different objects without needing the geometrical features of the manipulated object. Modelling of different contacts in robotic peg-in-hole assembly process was successfully performed in the framework of finding analytical solutions of the contact forces for different situations between the manipulated object and the environment.22,23 Cortesão et al. 24 used a neural network and Kalman filter in building a signal diffusion system that captures human skills in compliant motion robots. Hidden Markov models (HMM) were successfully employed in developing models for compliant motion robots, and hence, opening the door to the probabilistic modelling approaches.25–27 HMM CS modelling scheme proved to be efficient and only the previous state (CS) is required to be known when recognising a certain CS.
Gadeyne et al. 28 and Lefebvre et al. 29 were successful in linking the CS modelling to the geometrical parameters estimation, and efficient models were obtained for each CS. The approaches by Gadeyne et al. 28 and Lefebvre et al. 29 were further improved using the particle filters in identifying the CS for compliant motion robots. 30 Despite of their good performance, the approaches proposed by Gadeyne et al., 28 Lefebvre et al., 29 and Meeussen et al. 30 require the precise knowledge of the task sequence that would constitute a drawback when using those schemes for variable task sequence which could be the case in many applications. Thomas et al. 31 developed force/torque mapping for each model using computer-aided design (CAD) data with particle filters, and enhanced CS modelling was obtained. Katsura et al. 32 proposed a disturbance observer–based approach in monitoring the contacts of the robot without the need for using force sensors. Autoregressive exogenous (ARX) modelling was successfully employed in adding the recognition skills to the robotic peg-in-hole assembly tasks and promising results were obtained. 33
Cabras et al. 34 were capable of using the stochastic gradient boosting (SGB) classifier in modelling different CSs without the need for knowing the task sequence or task graph. Hertkorn et al. 35 used only the force and torque signals in recognising different CSs for compliant motion robot systems by computing the wrench space based on the CS graph that describes the sequence of different CSs in a certain task. Then, a similarity index is augmented showing the amount of overlap between wrenches that belong to different CSs. Finally, a particle filter is employed in computing the likeness that a certain wrench vector belongs to a CS. The results shown in Hertkorn et al. 35 are excellent for the computation time wise; however, the sequence of the CSs is still needed to be known. Support vector machine (SVM) was successfully employed in generating the fuzzy inference mechanism (FIM) for classifying the contacts in a force-controlled robotic peg-in-hole assembly process. 36
A common feature to all of the approaches above is the lack of considering objects flexibility that would result in a more challenging modelling situation. Both vision and force sensors were employed in the CS transition detection for deformable manipulated parts (see Abegg et al. 37 and the references therein). Even though good results were reported by Abegg et al. 37 for a hose assembly process, the strategy does not depend purely on the force signals and using the vision system might not stand a chance for unclean industrial environments, occluded parts assembly, and assembly processes with a time-varying illumination as mentioned above. Variation in the assembly sequence would also lead to the incapability of applying the scheme reported by Abegg et al. 39 for the assembly CS recognition.
Jasim and Plapper 38 were successful in using fuzzy clustering technique for building efficient fuzzy models and the need for the assembly sequence is relaxed. The fuzzy clusters are tuned by the gravitational search algorithm (GSA), and excellent mapping capability was obtained for each model. Relying on the sensed pose and wrench signals, expectation maximisation–based Gaussian mixtures model (EM-GMM) was proposed for the assembly of multiple rigid parts, and excellent performance was reported. 39 Based on the EM-GMM CS modelling scheme proposed by Jasim and Plapper, 39 only wrench signals were employed with the EM-GMM CS modelling scheme for the hole position identification problem and large position uncertainties were accommodated. 40 Despite the excellent modelling and search performance reported by Jasim and colleagues,39,40 the number of GMM components was considered to be arbitrarily 3 that might not reflect the optimal choice for such a modelling process in which all manipulated objects are rigid parts. Even though efficient CS modelling was reported by Jasim and colleagues,38–40 only rigid manipulated objects were considered and accommodating the object flexibility is not yet addressed.
Object flexibility leads to a more challenging CS modelling situation since the sensed signals would be significantly impacted with the object elasticity resulting in higher non-stationarity in the signals distribution and fixing the number of GMM components (as proposed in Jasim and colleagues39,40) might not be enough for modelling the captured signals distribution. Inspired by the similarity measure between the developed models and the distribution of the captured signals, this article proposes a distribution similarity measure–based Gaussian mixtures model (DSM-GMM) CS modelling scheme for peg-in-hole assembly tasks of flexible rubber materials. Only the wrench signals of the manipulated object are utilised in developing the models of the DSM-GMM so that more robustness against position uncertainty is achieved. Different numbers of GMM components are studied and the classification success rate (CSR) is considered as an index for measuring the similarity between the developed models and the distribution of the captured signals. For each number of GMM components, the expectation maximisation (EM) algorithm is used in computing the GMM parameters. The number of GMM components resulting with the highest CSR is considered as the optimal number of components and the obtained model is said to be an optimal GMM model. Hence, the DSM-GMM is an optimised modelling scheme compared to the EM-GMM proposed in Jasim and colleagues39,40 and elasticity variation from an object to another can be accommodated through finding the number of GMM components that optimally model the given input data. As a summary, the contributions of this article are summarised as follows:
Developing CS modelling scheme for elastic rubber objects;
Finding the number of GMM components that optimally model the captured data.
Experimental validation is carried out on a KUKA lightweight robot (LWR) doing two peg-in-hole assembly experiments of elastic rubber objects. In the first experiment, the robotic peg-in-hole assembly process for an elastic object is considered. The object is made from a rubber silicone material with hardness of 30 Shore A. For the second experiment, a softer rubber silicon material with hardness of 6 Shore A is considered for the relevant robotic peg-in-hole assembly task. For both experiments, DSM-GMM is used in modelling different phases and excellent modelling performance is demonstrated. The available CS modelling schemes are also implemented in order to have a clear comparison study with the proposed DSM-GMM CS modelling scheme. Conventional fuzzy classifier (CFC), 20 SGB classifier, 34 gravitational search-fuzzy clustering algorithm (GS-FCA) classifier, 38 and support vector machine–based fuzzy inference mechanism (SVM-FIM) 36 are implemented for the considered experiments, and the superiority of the proposed DSM-GMM CS modelling scheme is shown.
The rest of this article is organised as follows: section ‘Problem description’ describes the CS modelling problem in force-controlled peg-in-hole assembly processes with flexible rubber object. Section ‘DSM-GMM’ explains the proposed DSM-GMM CS modelling scheme and the experimental validation is detailed in section ‘Experimental validation’. Discussions of the results obtained from the experimental validation are explained in section ‘Discussion,’ and ‘Conclusion’ summarises the concluding remarks along with recommendations for future works.
Problem description
Consider the robot system shown in Figure 1 which is composed of a KUKA LWR doing a peg-in-hole assembly process of a flexible rubber object. If one drives the robot to assemble the peg into the hole, then different possible phases could be brought about during the task execution. In order to model the CS for each phase, the overall motion is segmented according to the corresponding phases. For each segment, the wrench signals of the manipulated object are collected and the models, realising the desired input–output mapping, are developed. Suppose that the Cartesian force signals of the manipulated object are
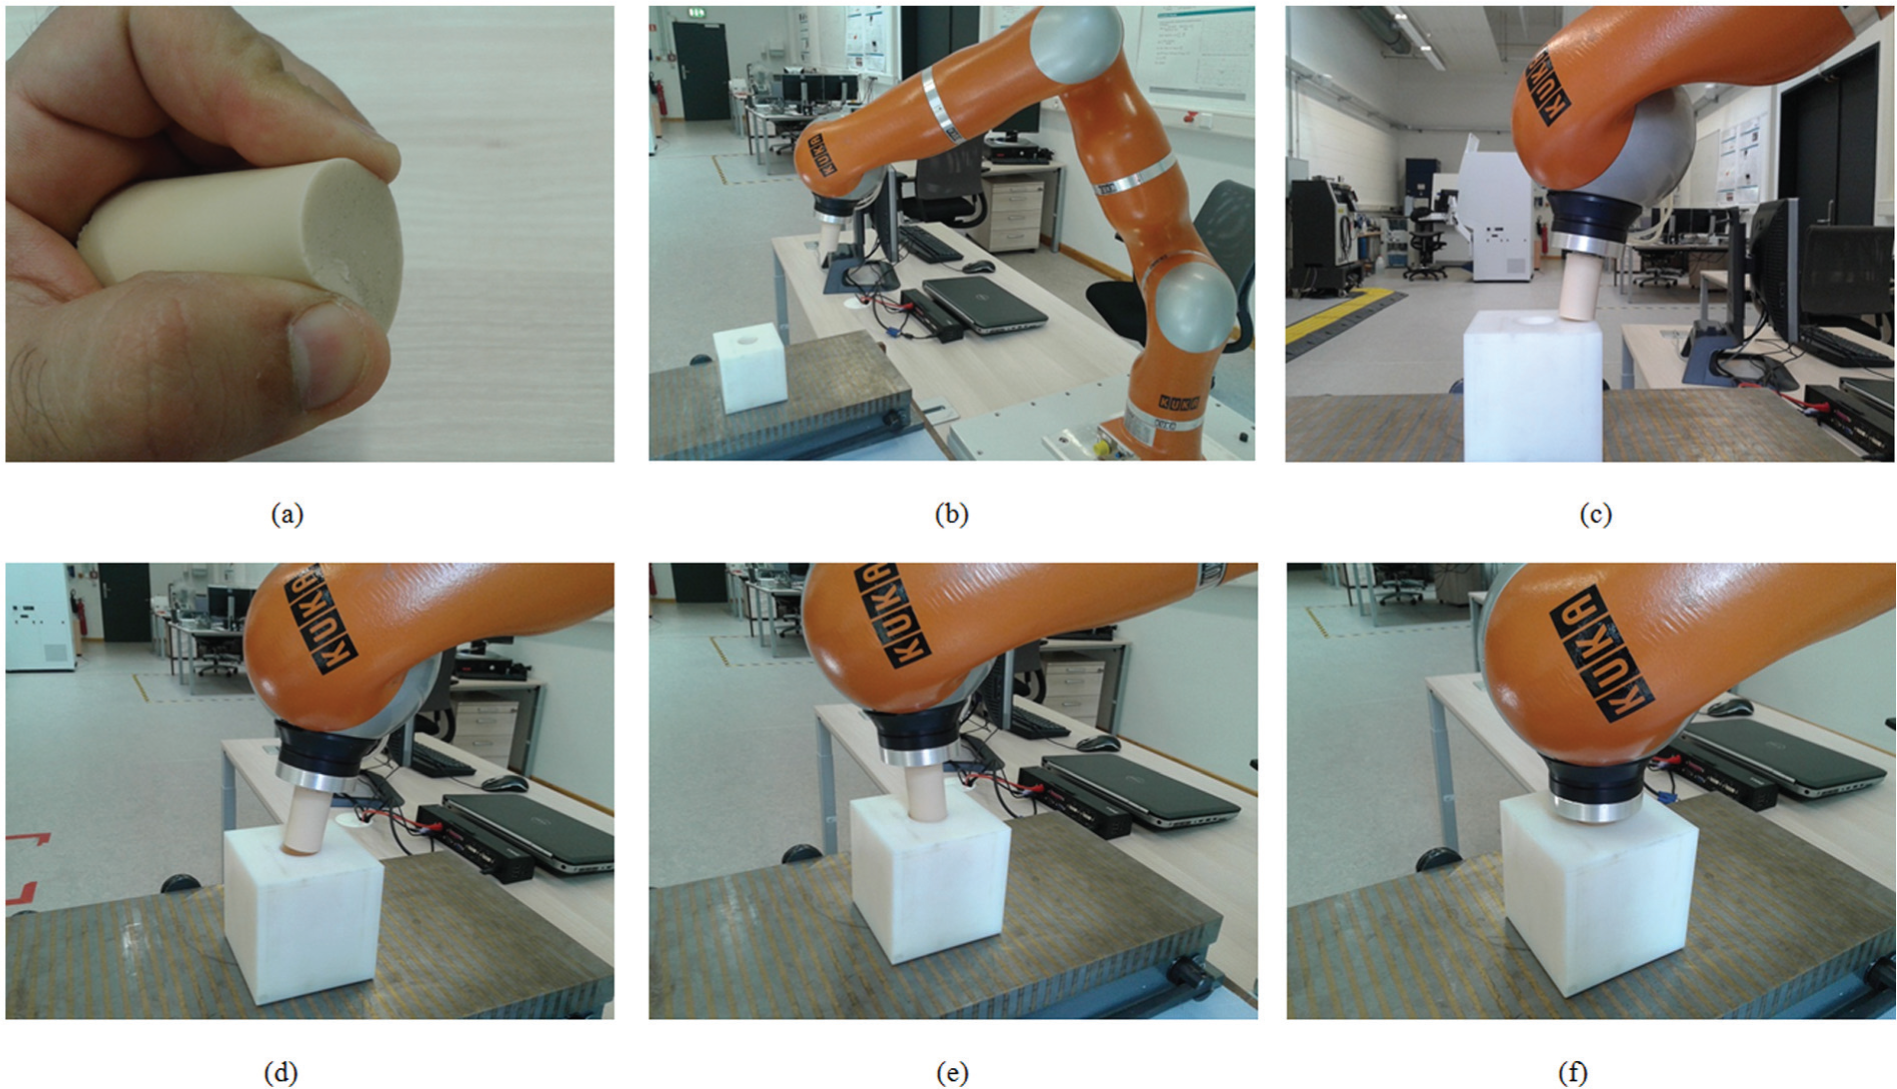
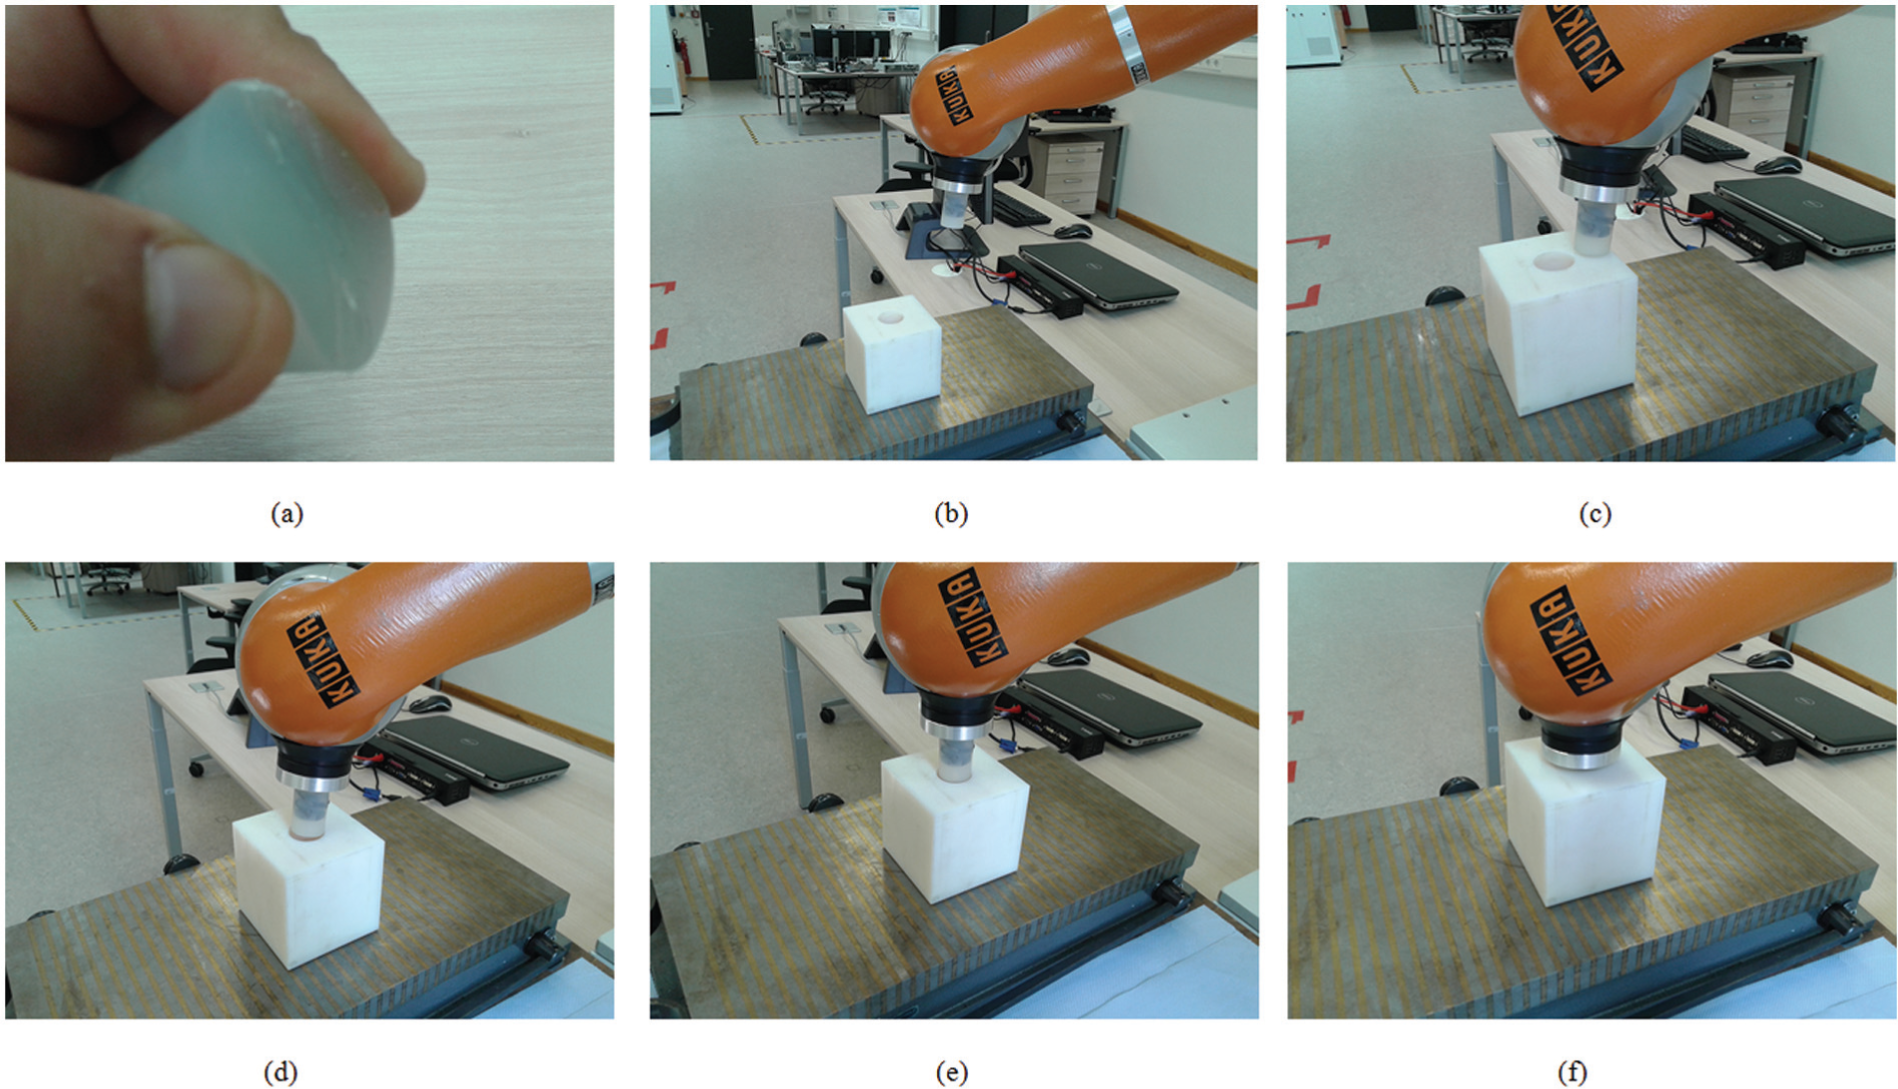
Test stand of experiment 1: (a) the flexible rubber object and its deformation when it is grasped, (b) Phase 1, (c) Phase 2, (d) Phase 3, (e) Phase 4, and (f) Phase 5.
where
where
Hence, each model has six input signals, say
where
DSM-GMM
The DSM-GMM is based on the blending of the Bayesian modelling (or classification), Gaussian mixtures model (GMM), and distribution similarity measure (DSM). Hence, these concepts are explained before detailing the DSM-GMM.
Bayesian classification
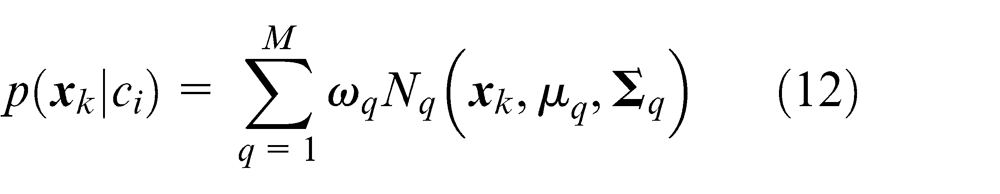
In the Bayesian classification, one can say that a given data vector
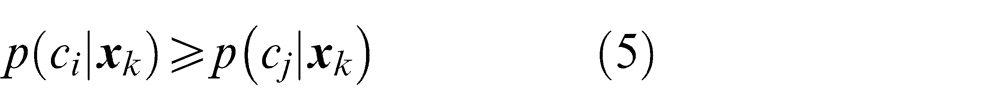
for all
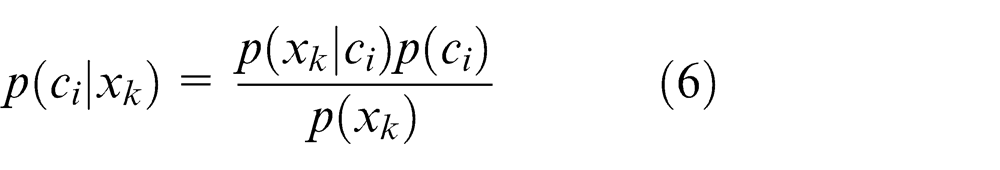
where
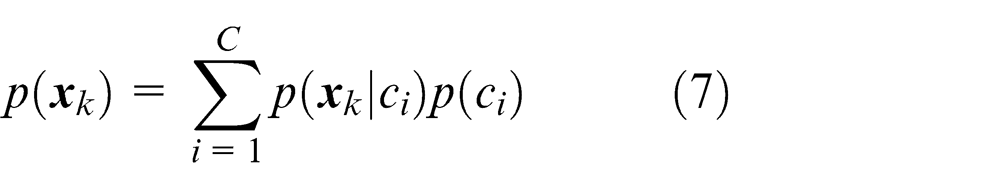
where
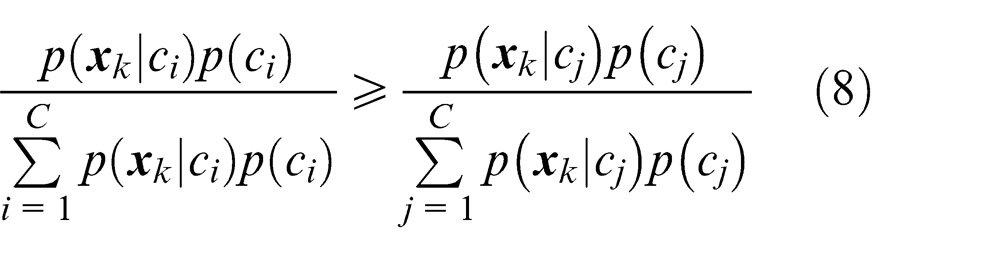
One can see that the denominators of the left- and right-hand sides of equation (8) are equal. Therefore, equation (8) can be re-written as
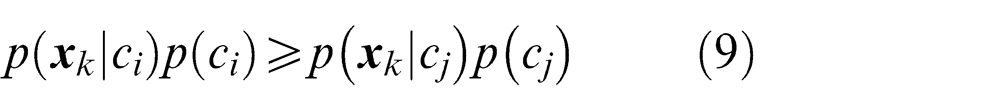
For equal priori probabilities
where
GMM
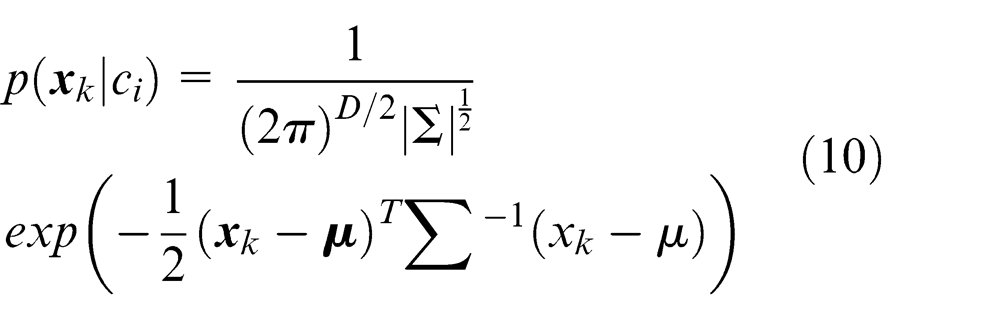
In order to accommodate the possible non-normal distribution of the signals, Gaussian mixtures are employed in modelling the features (input signals), that is, assigning more than a Gaussian component for each feature. Suppose that a single Gaussian distribution is represented as
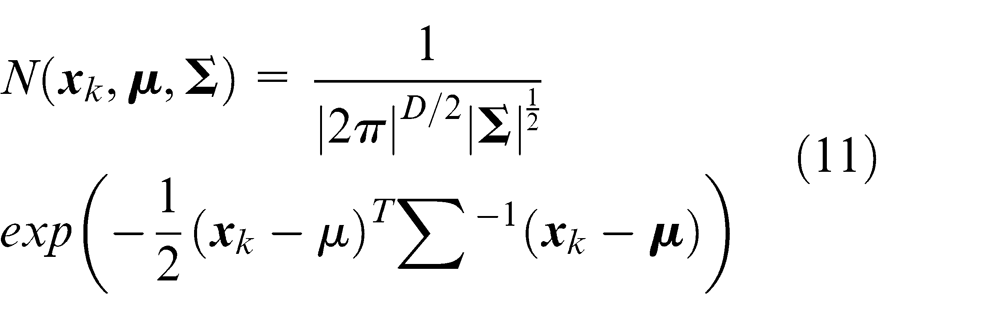
One can describe a GMM as
where
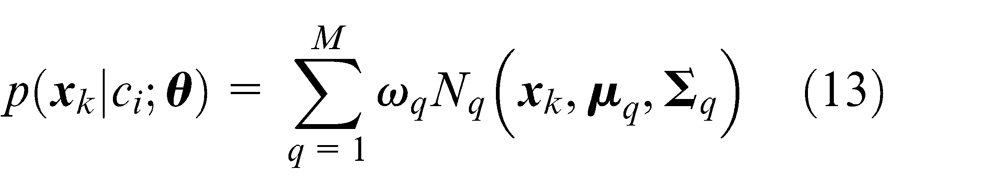
Finding the best parameter set
EM
One of the most efficient approaches in finding the parameter set
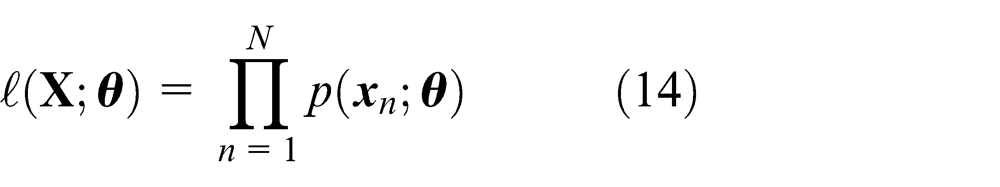
Define the logarithm of
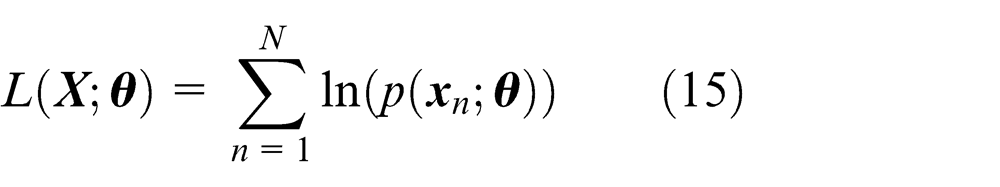
The parameter set
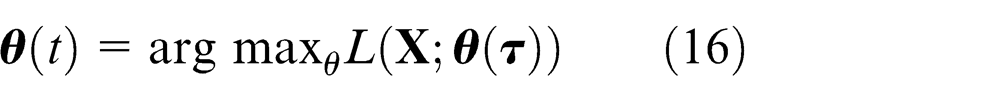
subject to
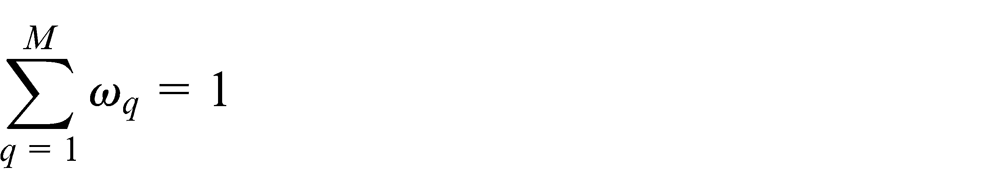
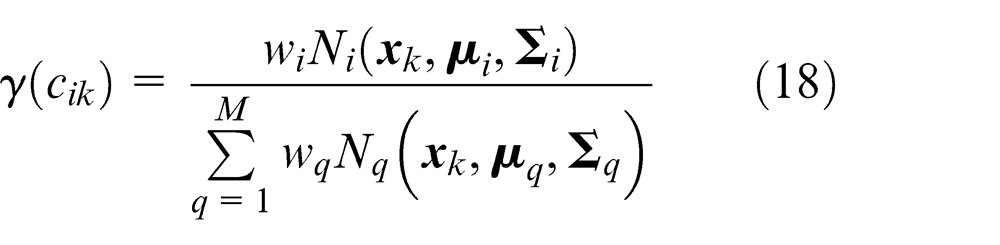
where equation (16) is a constrained optimisation problem and the analytical solutions can be intractable. Therefore, iterative solutions, like the EM algorithm, were suggested to solve such a problem. An important quantity that plays a vital role in the EM algorithm is the conditional probability of
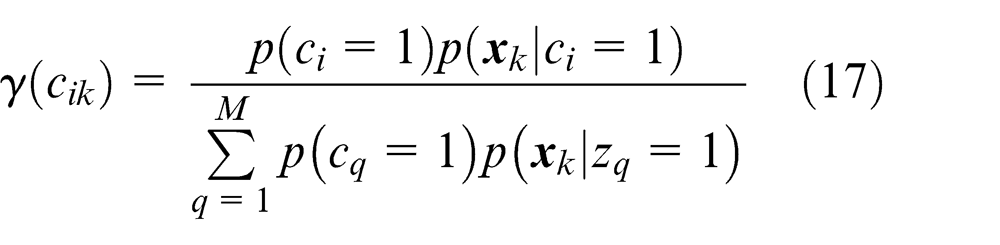
that leads to
Step 1. Initialise the parameter set
Step 2. (E-Step) For the current parameter set
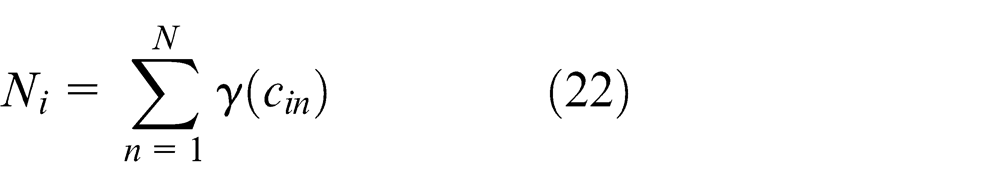
Step 3. (M-Step) Re-estimate the parameters using the current responsibilities
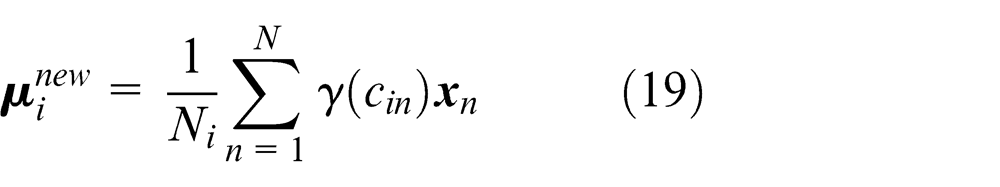
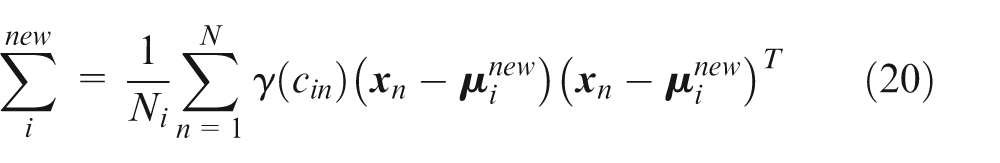
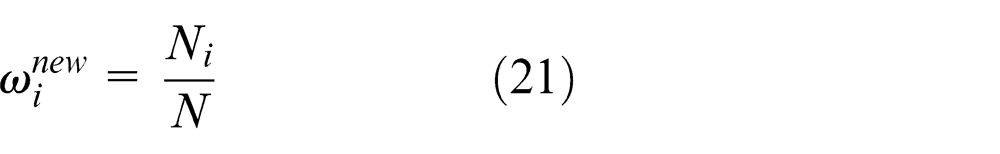
with
Step 4. Compute the log-likelihood
Step 5. Check for the convergence
If
See the book authored by Bishop 42 or other related monograph for more details on the EM algorithm and the derivations of the equations above. Even though the EM algorithm results in desirable GMM parameters, the choice of the number of GMM components remains important in having an optimal modelling of the given data. In the next subsection, a simple and reasonable approach is proposed for the identification of the optimal number of GMM components. Incorporating the identification process of the number of GMM components in the proposed CS modelling scheme would significantly enhance the modelling of the captured signals.
DSM
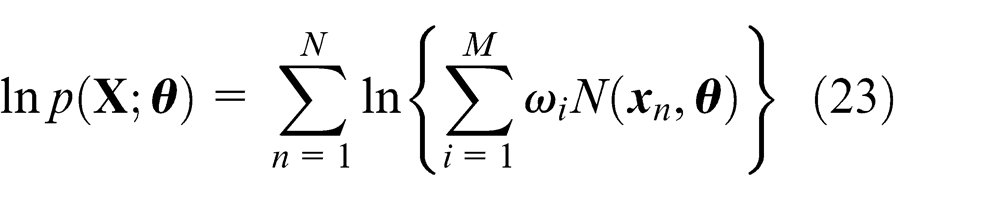
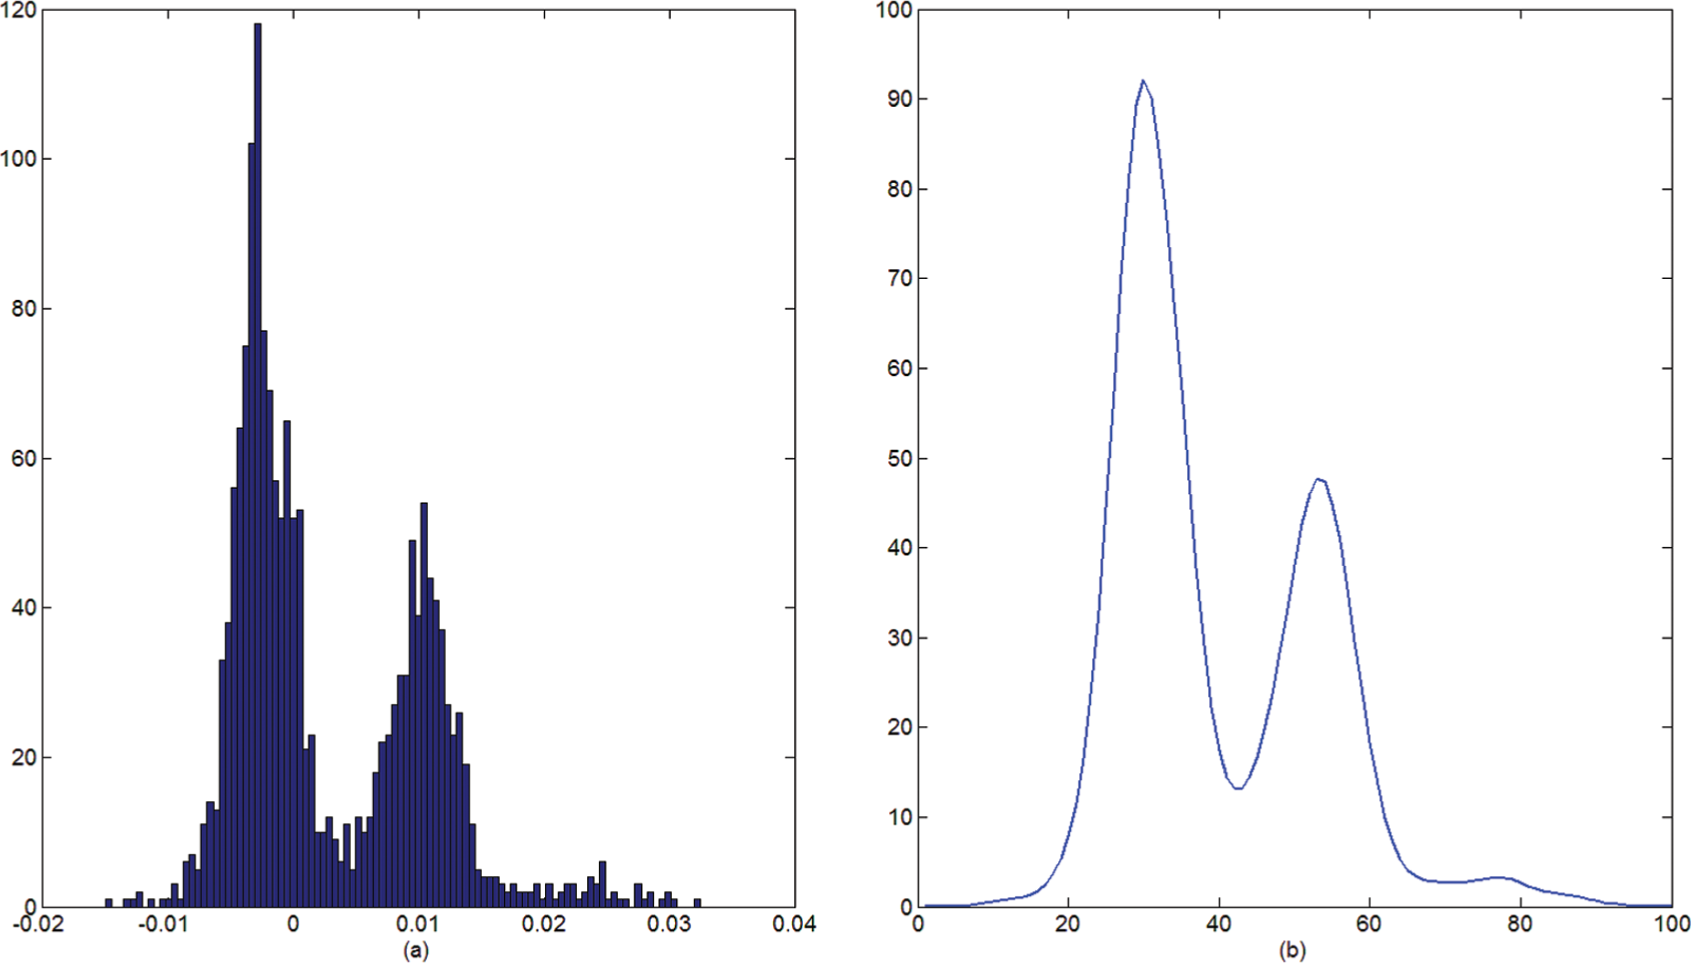
One of the crucial elements that quantifies the efficiency of data-driven models is the similarity between the developed models and the distribution of the given signals. For instance, let's consider the histogram shown in Figure 2(a), which is taken for the torque signal around the x-axis of one of the experiments. In order to see the optimal number of GMM components that can optimally model this signal, it is needed to find the number of GMM components that gives the highest similarity between the developed model and the signal distribution. Different approaches were developed in quantifying the similarity between two distributions; however, probabilistic similarity measure (PSM) is considered as one of the most effective similarity measure schemes. In the PSM, the CSR performance is used as an index for the similarity measure between the histogram of Figure 2(a) and the developed model. 42 The best CSR results from the highest similarity between the developed models and the signals histograms. For the example of Figure 2(a), the best CSR results with three GMM components. Figure 2(b) shows the GMM that can optimally model the given histogram. If we increase or decrease the number of GMM components, then the similarity between the histogram of the signal and the developed model is decreased causing CSR degradation.
(a)
In the framework of DSM, the number of GMM that optimally models the CS from the given wrench signals can be estimated and enhanced CS modelling scheme would be resulted. The next section explains the experimental validation when using the DSM-GMM for modelling the CS of robotic peg-in-hole assembly process with flexible rubber materials.
Experimental validation
For evaluating the performance of the proposed DSM-GMM CS modelling scheme, a test stand was built that is composed of a KUKA LWR doing peg-in-hole assembly tasks of flexible rubber materials. The key features of the KUKA LWR are detailed in LWR 4+ specification.
43
The KUKA LWR is equipped with appropriate sensors that enable researchers in capturing the wrench signals of the manipulated object through an fast research interface (FRI) port which is installed within the robot hardware. The FRI port is connected to a remote PC that performs the computational aspects of the modelling process. The features of the PC used in the experiments are Intel® Core™ i5-2540 CPU with 2.6 GHz speed and 4 GB RAM running under a Linux environment. The rate of communication between the remote PC and the robot, through the FRI, is 100 Hz. The programming is done in a C++ platform. In order to see the performance of the suggested DSM-GMM CS modelling scheme, two experiments are conducted for two flexible rubber objects with different stiffness values. For both experiments, the tolerances, say
Experiment 1
In this experiment, the assembly of a flexible rubber manipulated object (peg) is considered in evaluating the performance of the proposed DSM-GMM CS modelling scheme. The object is made from Neukasil RTV 230 which is a plastic silicone rubber material with hardness of 30 Shore A (see Appendix 1 for more features of this rubber material). Figure 1(a) shows the considered flexible rubber peg that can be deformed when grasped. Figure 1(b)–(f) shows different phases of the peg-in-hole assembly process. When executing the task of Figure 1, the wrench signals of the peg were captured and plotted as shown in Figure 3. The captured wrench signals were segmented into their corresponding phases and they were considered as training data. Using the DSM-GMM scheme, along with the training signals, a model is developed for each phase. Three Gaussian components were considered for each model and the justification for using this number of components will be detailed shortly afterwards.
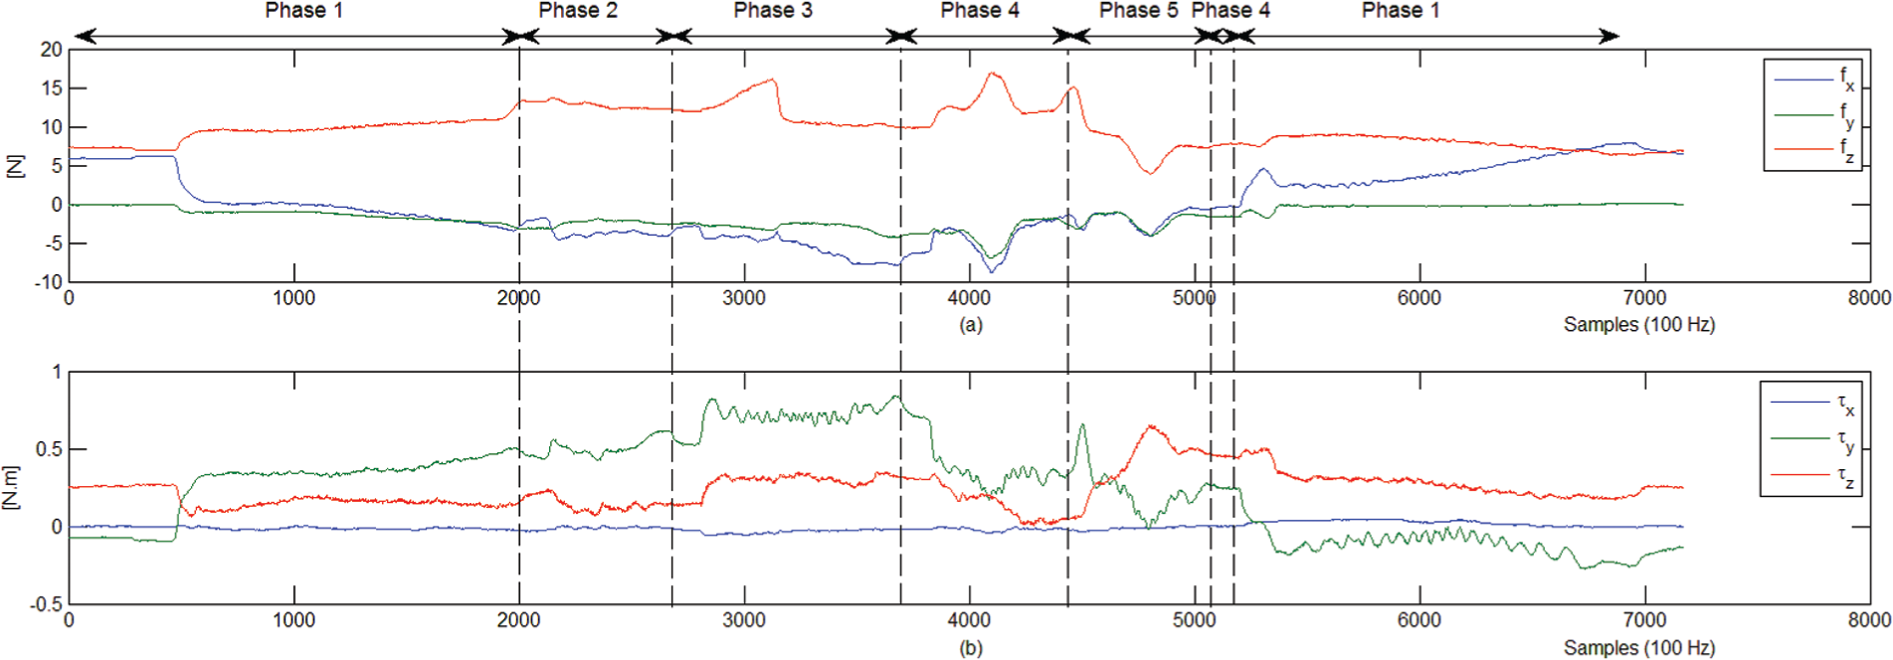
Experiment 1: training signals: (a) force signals [N] and (b) torque signals [N m].
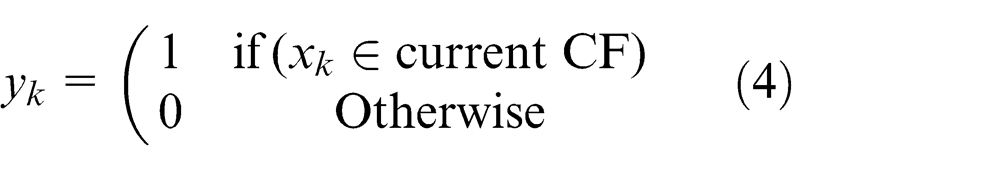
In order to test the performance of the developed models, the same peg-in-hole assembly process was repeated again with re-capturing the wrench signals that are considered as test signals. Figure 4 shows the wrench test signals used for evaluating the performance of the DSM-GMM CS modelling scheme. There are five models and the one resulting with the highest likelihood is assigned with 1 for the output and all the rest are assigned with 0 outputs. As per using the CS models, that were developed by the DSM-GMM CS modelling scheme, in classifying the test signals shown in Figure 4, the models outputs were evaluated and plotted in Figure 5. For the test set of Figure 4, it has 7175 samples and when using the DSM-GMM CS modelling scheme, 6774 samples were correctly classified and the rest were misclassified. As a result, the CSR for the DSM-GMM is computed to be 94.4%. For the sake of comparison, we developed the corresponding models using the SVM-FIM, 36 the GS-FCA, 38 the SGB, 34 and the CFC. 20 The total number of correctly classified samples were found to be 4729, 4606, 4356, and 1959 samples for the GS-FCA, SVM-FIM, SGB, and CFC schemes, respectively. One can compute the CSR to be 65.9%, 64.2%, 60.7%, and 27.3% for the GS-FCA, SVM-FIM, SGB, and CFC modelling schemes, respectively. Comparing the performance of the DSM-GMM with the rest, we can see that the DSM-GMM CS modelling scheme is outperforming the rest. The main two reasons behind such superiority of the DSM-GMM scheme are the accommodation of the non-stationary behaviour of the signals through the use of the GMM in building the likelihood functions and using the EM in computing the GMM components such that the log-likelihood is maximised. In order to see the non-stationary nature of the captured signals, the samples of Phase 3 were taken as an example and the histograms of the training signals, of this phase, were sketched. Figure 6 shows the histograms of Phase 3 signals. One can see that almost all signals are having non-normal distribution, that is, non-stationary behaviour. Therefore, the use of the DSM-GMM results in optimal likelihoods for the underlying signals that would significantly enhance the performance of the suggested CS modelling approach. The computational time (CT), that is, the time required for developing the models, of the DSM-GMM, GS-FCA, SVM-FIM, SGB, and CFC modelling schemes was measured and found to be 18.795, 237.307, 70.719, 92.083, and 0.002 s, respectively. Table 1 summarises the CSR and CT for all approaches mentioned above.
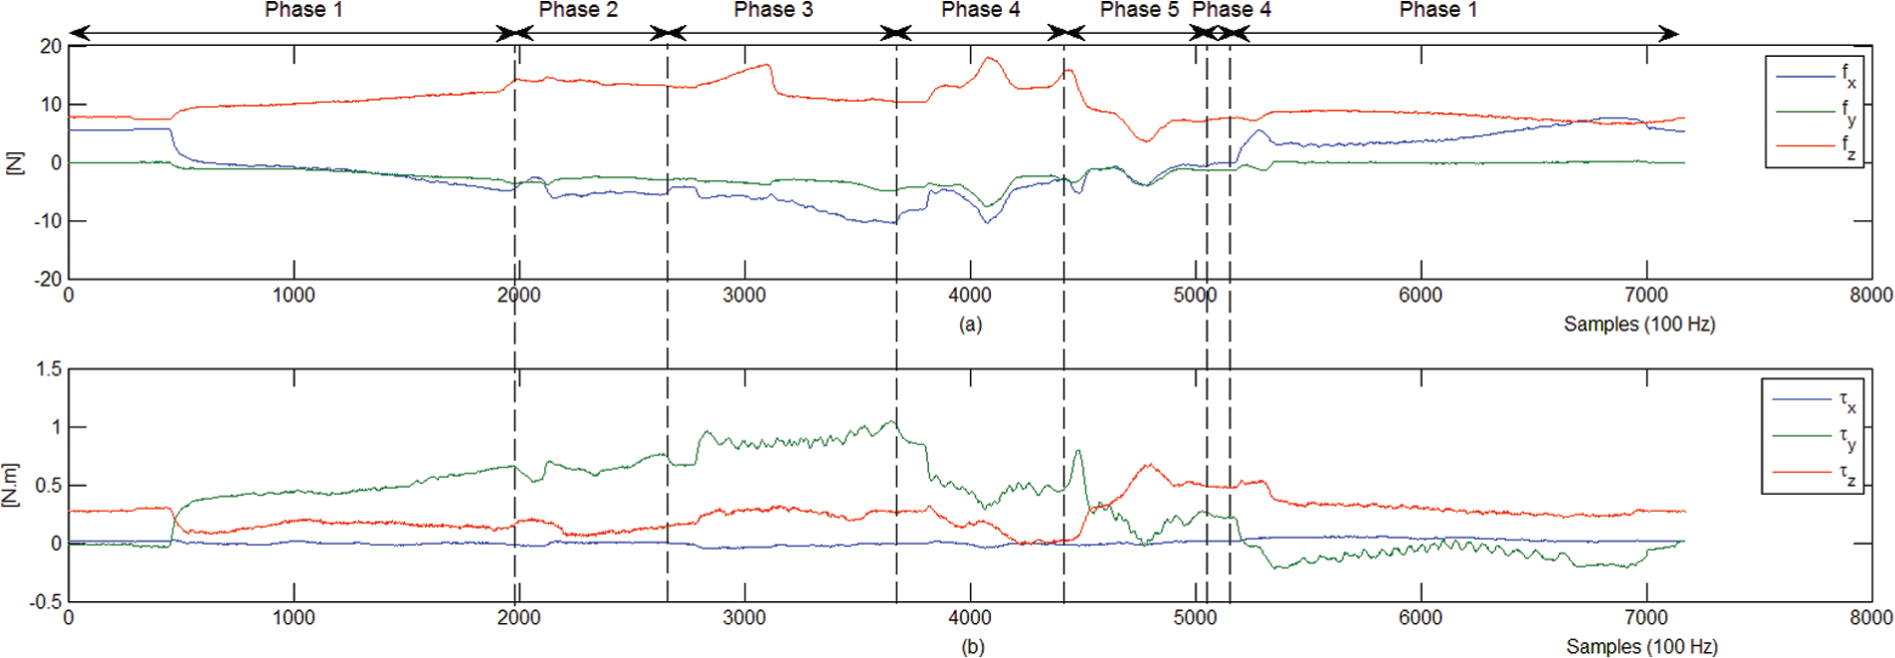
Experiment 1: test signals: (a) force signals [N] and (b) torque signals [N m].
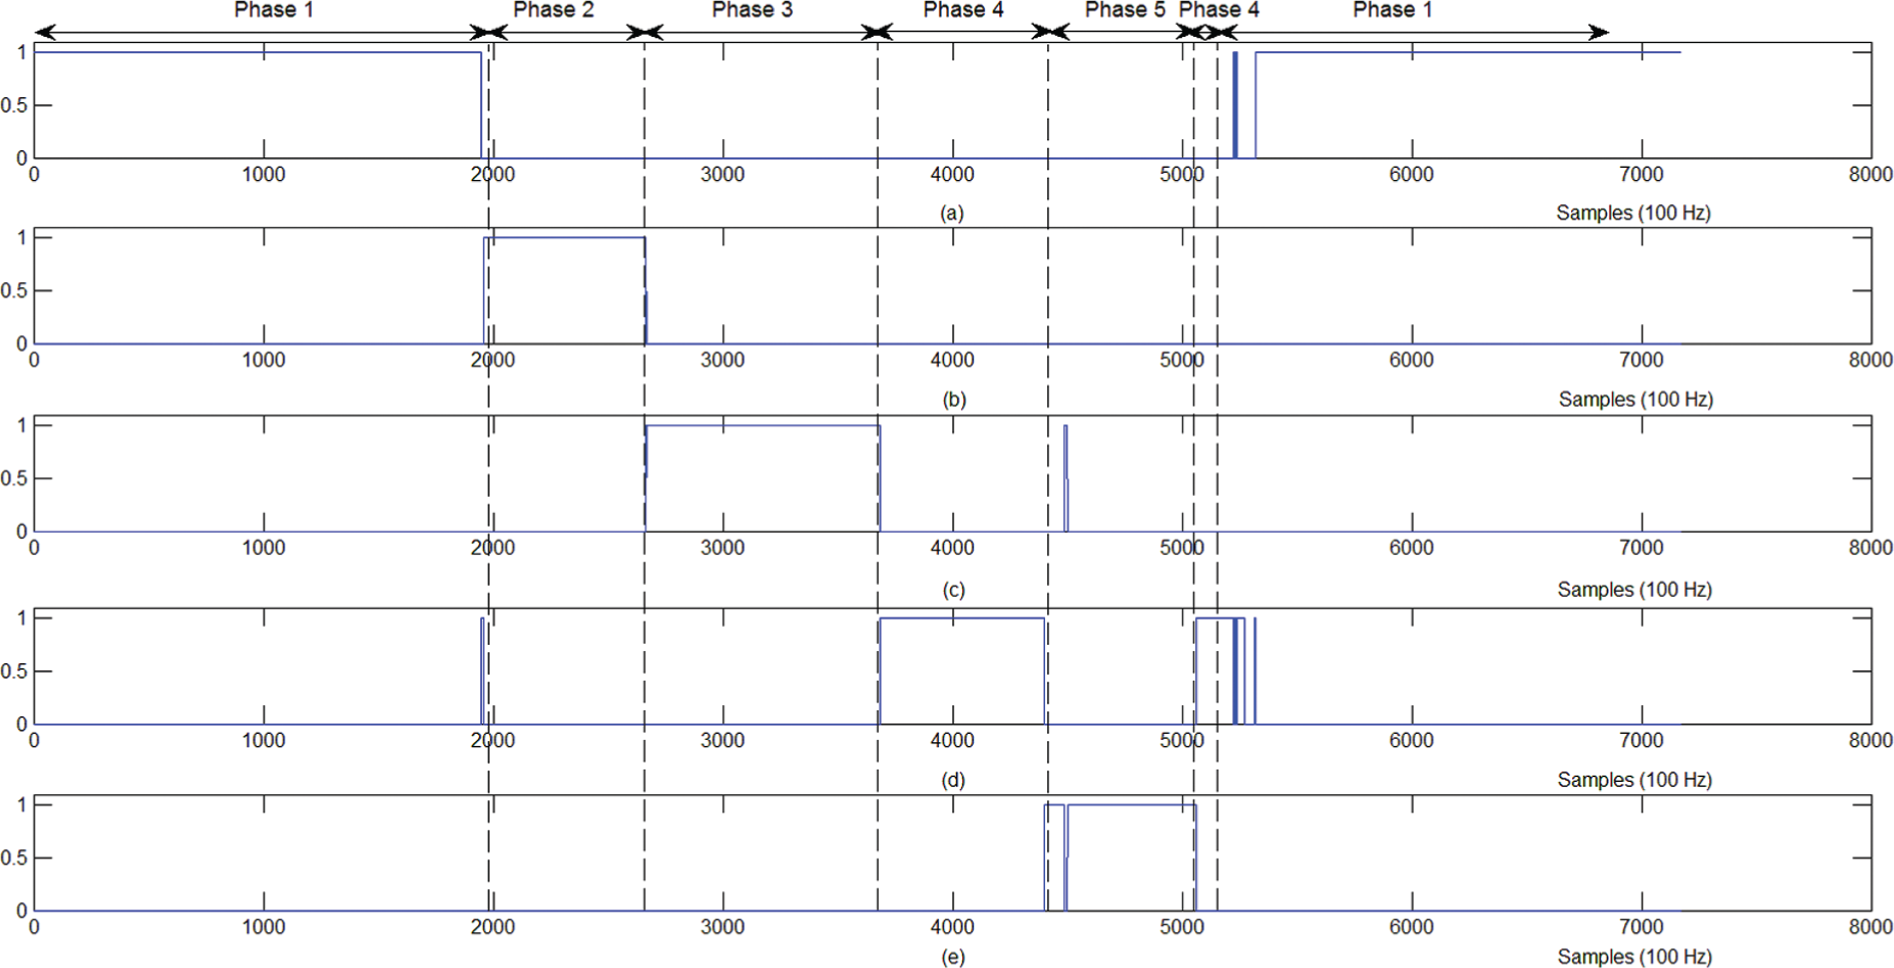
Experiment 1: DSM-GMM CS models outputs: (a) Phase 1, (b) Phase 2, (c) Phase 3, (d) Phase 4, and (e) Phase 5.
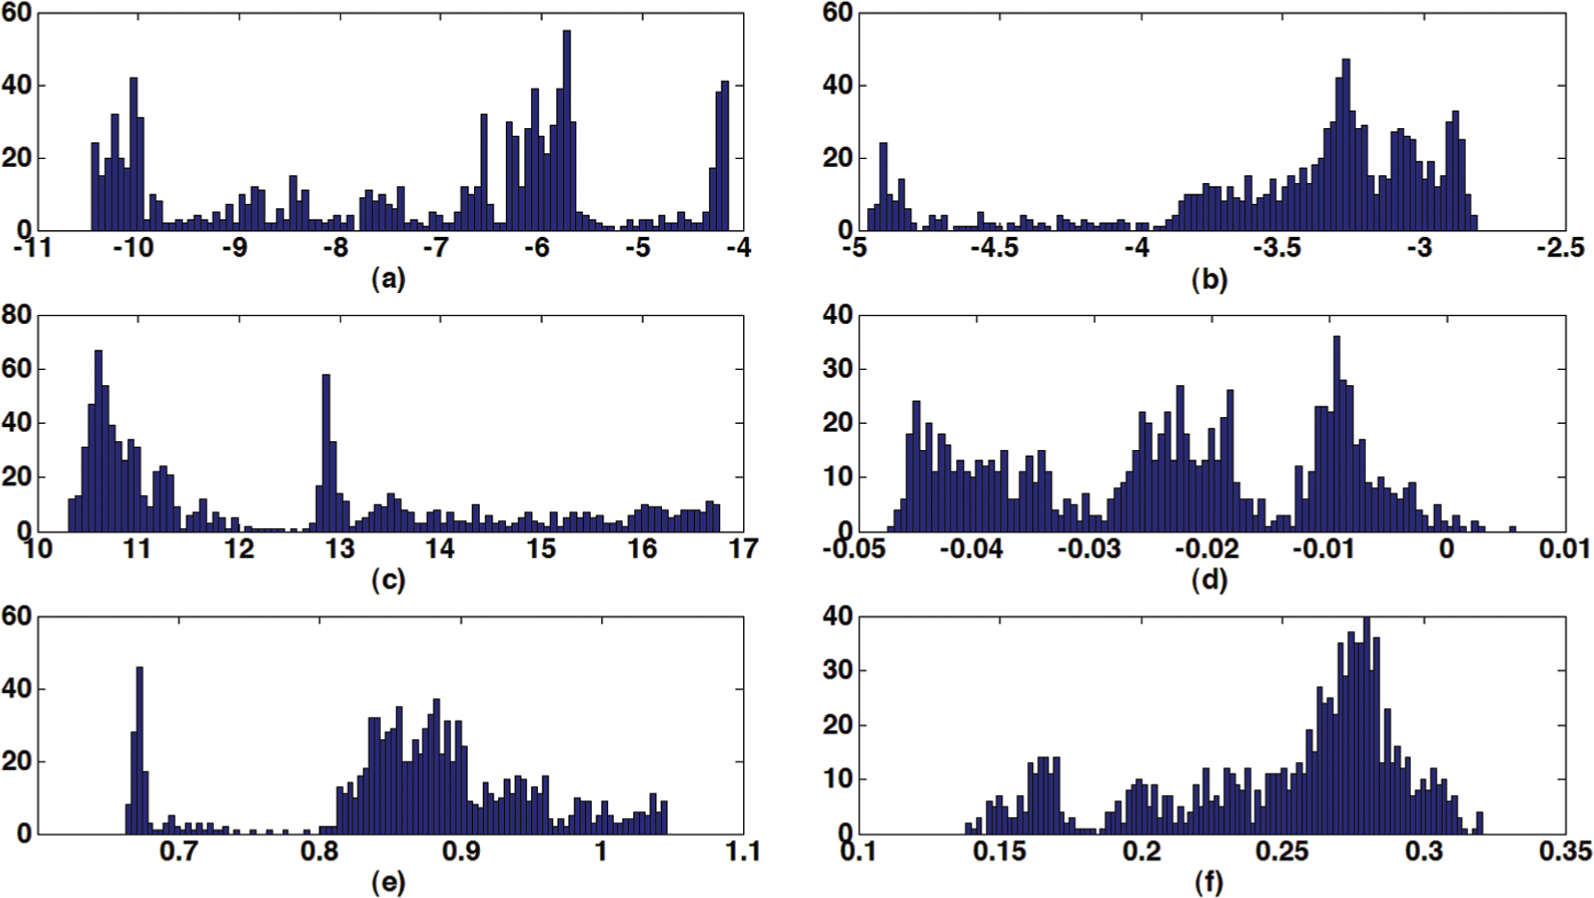
Experiment 1: signals histogram of Phase 3: (a)
Experiment 1: CSR and CT for the DSM-GMM, GS-FCA, SVM-FIM, SGB, and CFC CS modelling approaches.

CFC: conventional fuzzy classifier; CSR: classification success rate; CT: computational time; DSM-GMM: distribution similarity measure–based Gaussian mixtures mode; GS-FCA: gravitational search-fuzzy clustering algorithm; SGB: stochastic gradient boosting; SVM-FIM: support vector machine–based fuzzy inference mechanism.
From Table 1, it can be seen that the DSM-GMM CS modelling scheme provides an excellent performance with a reduced CT. In order to see the effect of the number of Gaussian components, say
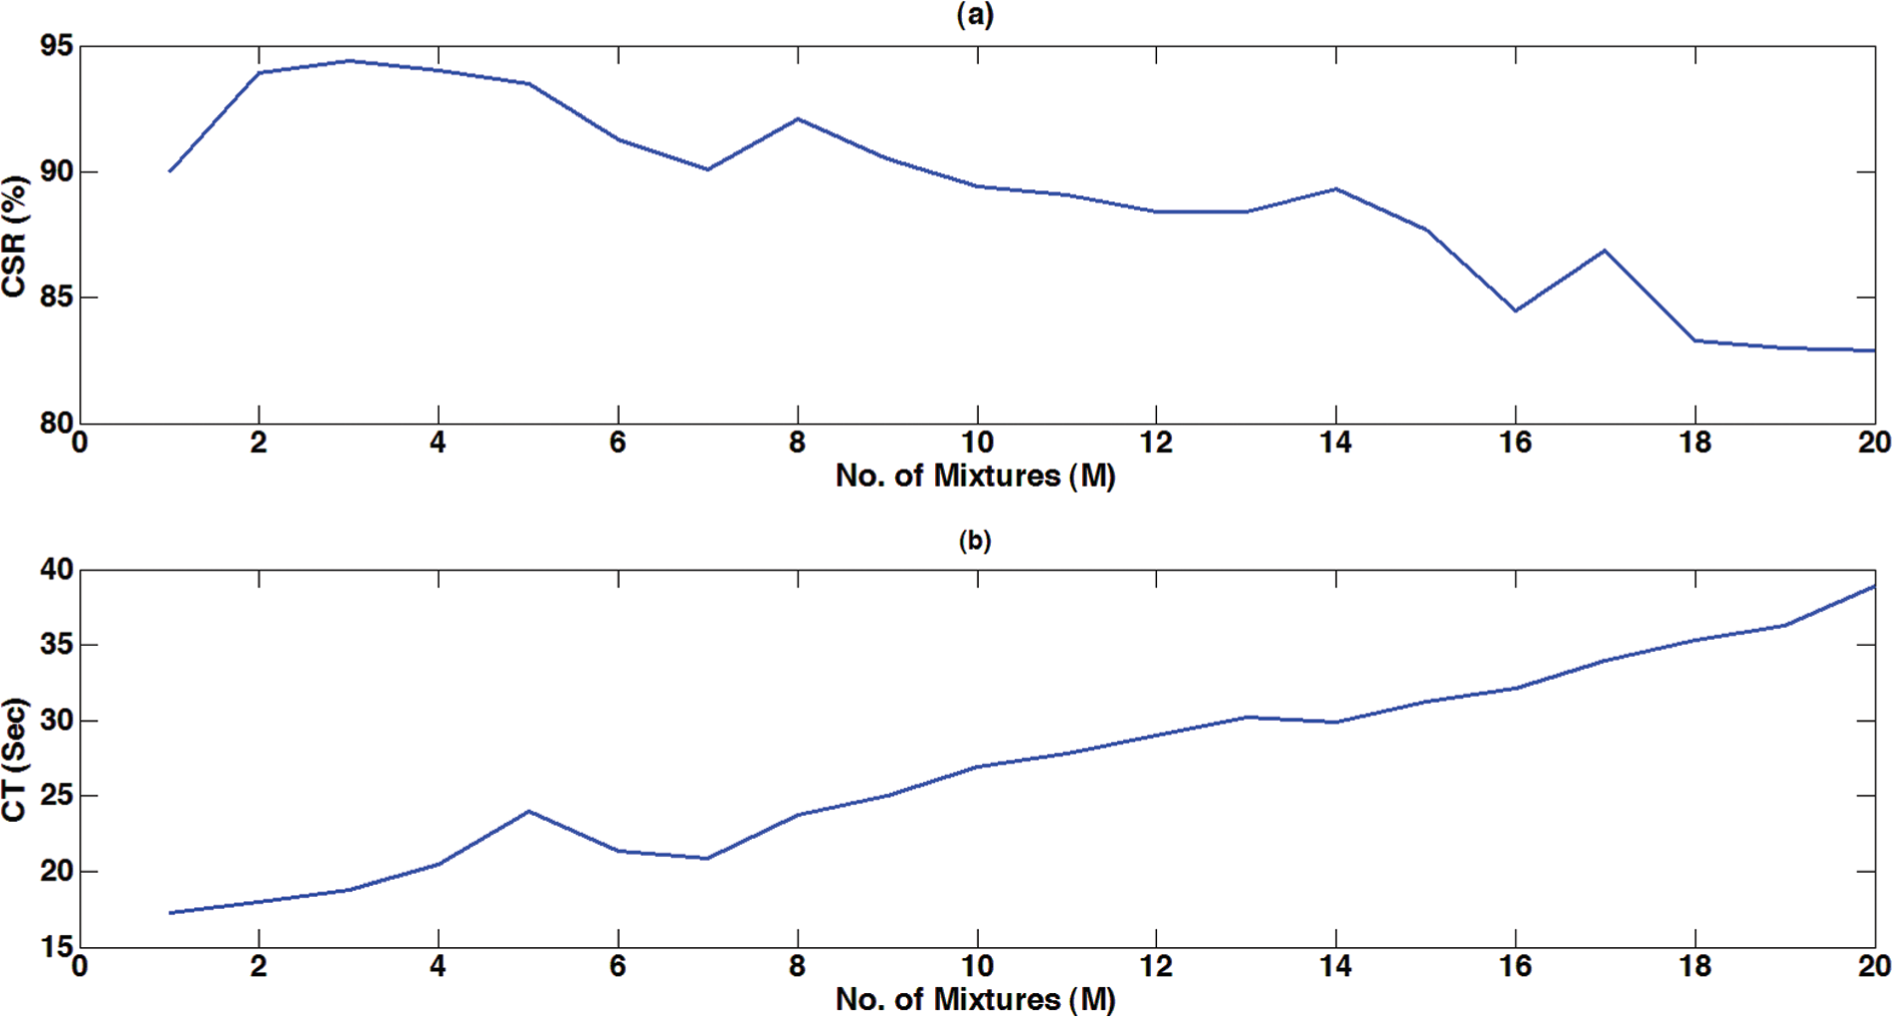
Experiment 1: DSM-GMM CS modelling scheme CSR and CT for different Gaussian components: (a) the CSR versus the number of Gaussian components (M) and (b) the CT versus the number of Gaussian components (M).
Experiment 2
This experiment considers a less stiff manipulated object for the given peg-in-hole assembly task. The utilised material is Neukasil RTV 23 which is a plastic silicone rubber with hardness of 6 Shore A (see Appendix 2 for more features of this material). Figure 8 shows the peg-in-hole assembly process of experiment 2 which is similar to that of experiment 1 except for the manipulated object. When executing the peg-in-hole assembly process of Figure 8, the wrench signals were captured for different phases of the given task. Figure 9 shows the captured wrench signals and using the DSM-GMM CS modelling scheme, a model was developed for each phase. Four Gaussian components were used for each model. In order to evaluate the performance of the developed models, the task of Figure 8 was repeated again and the corresponding wrench signals were re-captured, as shown in Figure 10, that are considered as test signals. Using the signals of Figure 10 as inputs to the developed DSM-GMM CS models, we obtained the model outputs shown in Figure 11. The total number of the test samples is 6749 and using the DSM-GMM CS modelling scheme, 6351 samples were correctly classified. When using the available CS modelling schemes, the number of correctly classified samples was found to be 4218, 4097, 3921, 3806, and 1762 samples for the GS-FCA, SVM-FIM, SGB, and CFC modelling schemes. One can compute the CSR for the DSM-GMM, GS-FCA, SVM-FIM, SGB, SVM-FIM, and CFC modelling schemes to be 94.1%, 62.5%, 58.1%, 56.4%, and 26.1%, respectively. Furthermore, the CT was measured to be 20.491, 221.931, 66.317, 85.816, and 0.002 s for the DSM-GMM, GS-FCA, SVM-FIM, SGB, and CFC schemes, respectively. Therefore, one can say that the DSM-GMM CS modelling scheme provides an excellent CSR performance with a reduced CT. Table 2 summarises the CSR and CT for all CS modelling schemes considered in this experiment.
Test stand of experiment 2: (a) the flexible rubber object and its deformation when it is grasped, (b) Phase 1, (c) Phase 2, (d) Phase 3, (e) Phase 4, and (f) Phase 5.
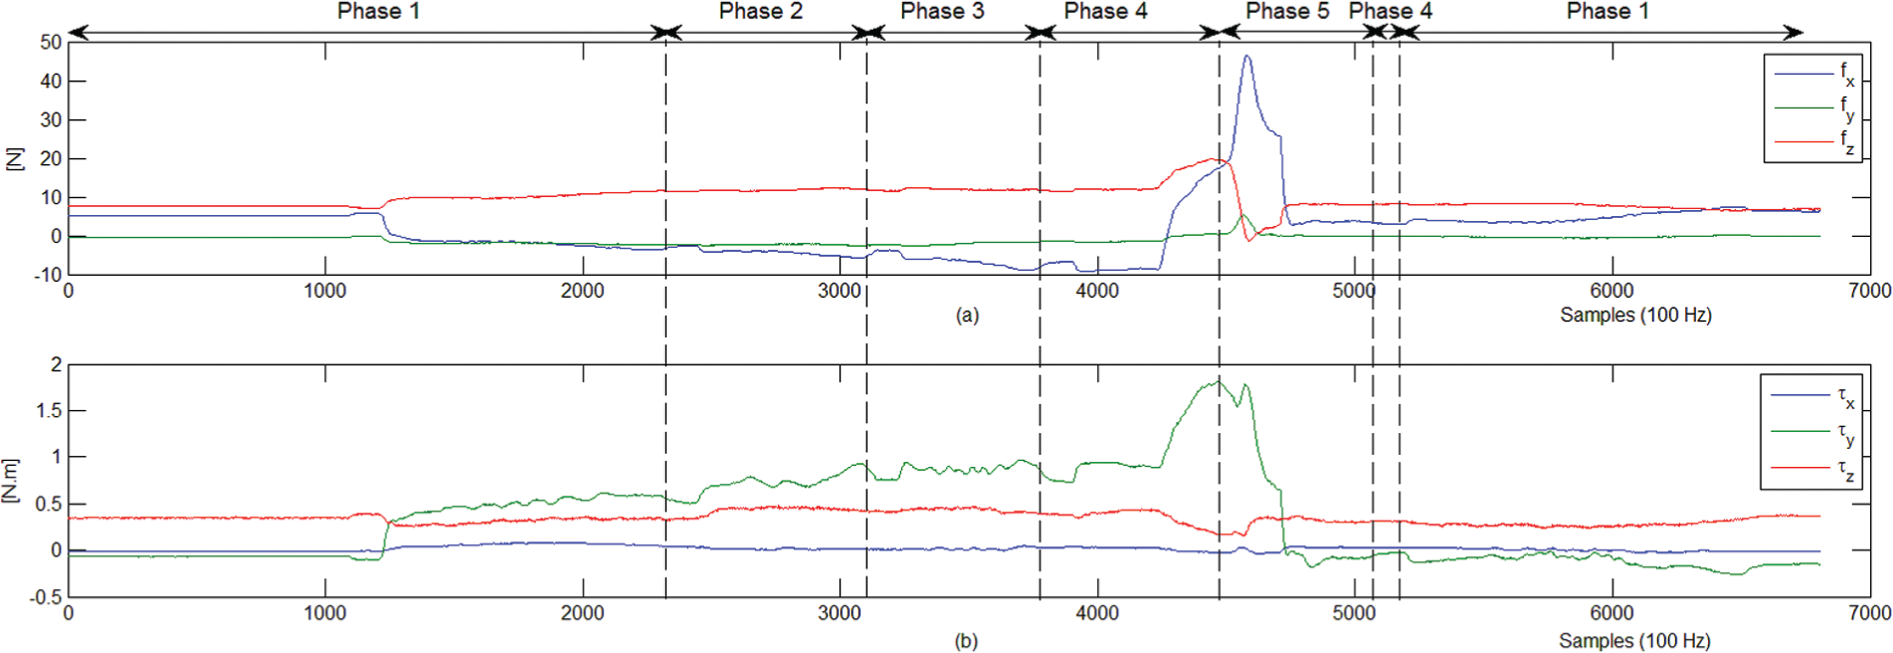
Experiment 2: training signals: (a) force signals [N] and (b) torque signals [N m].
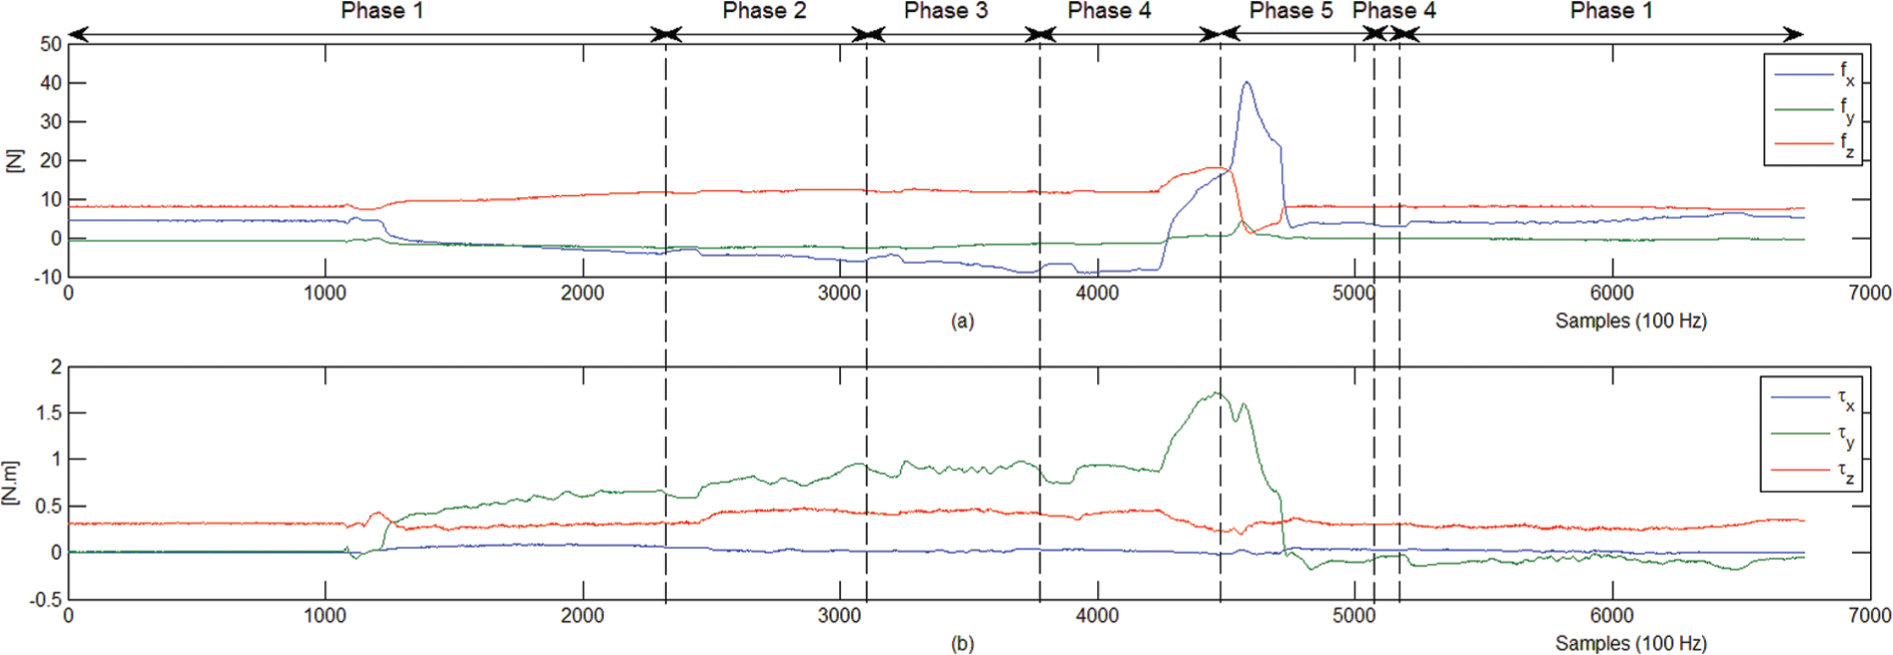
Experiment 2: test signals: (a) force signals [N] and (b) torque signals [N m].
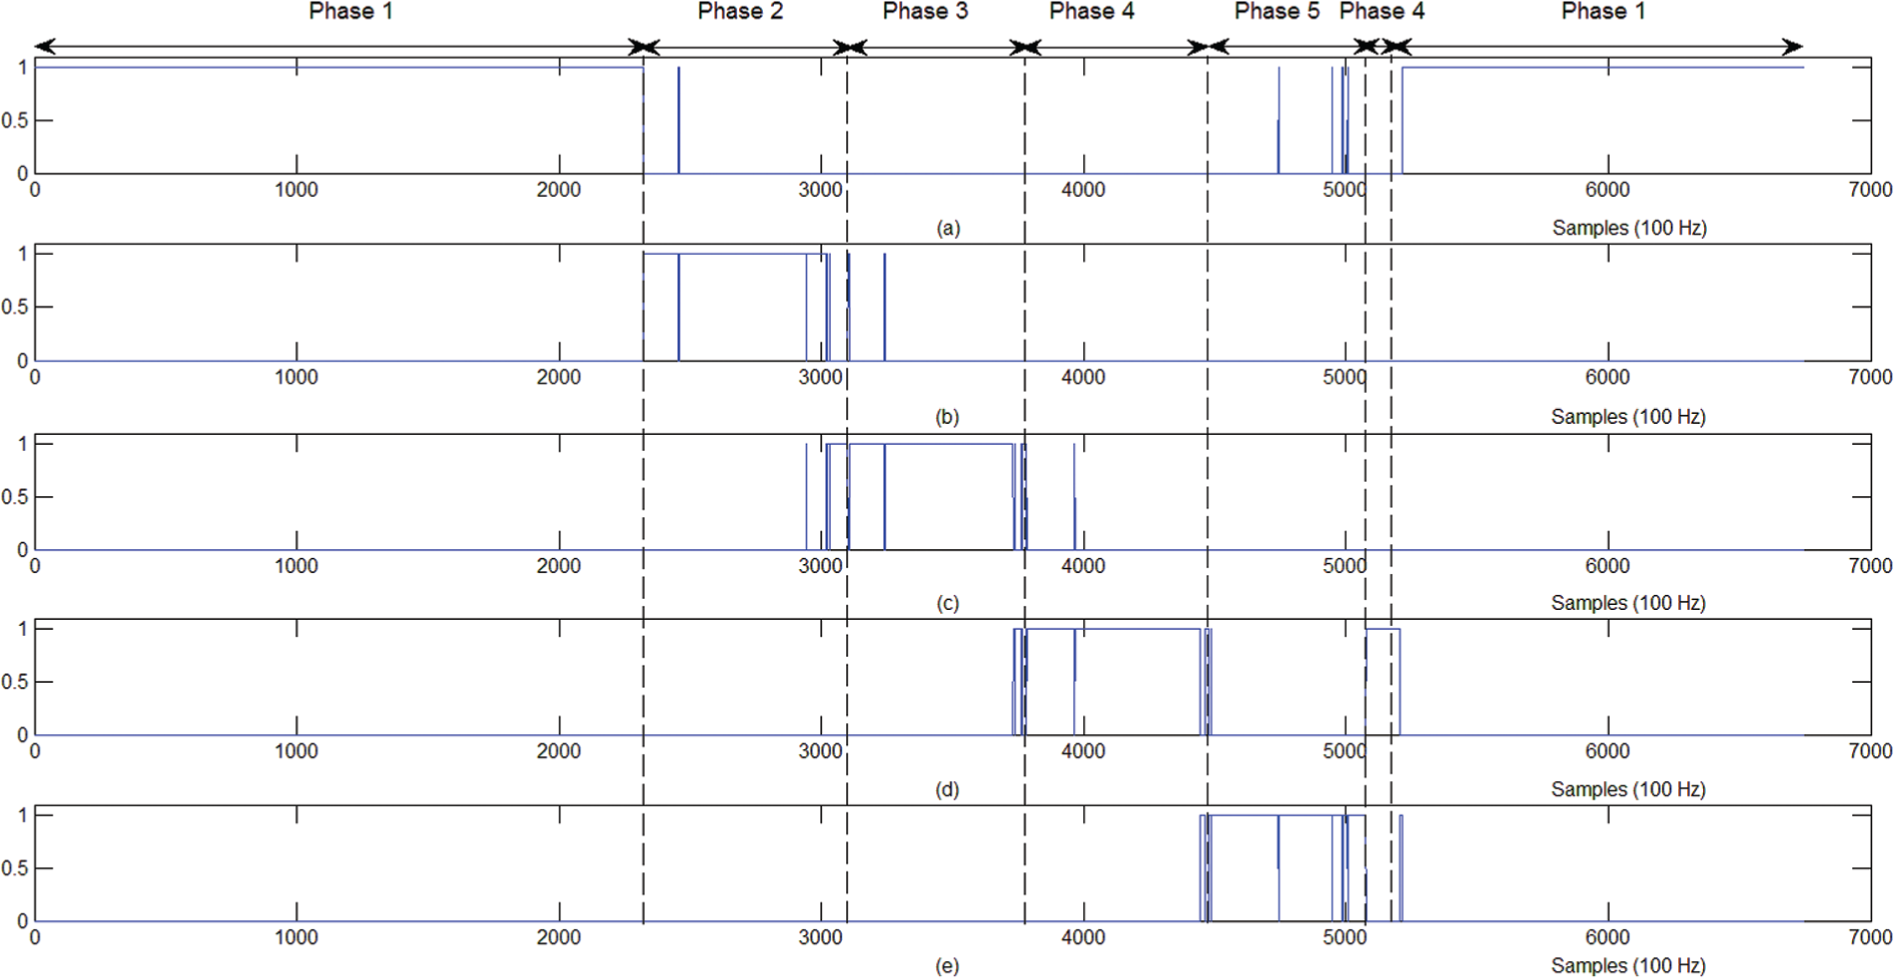
Experiment 2: DSM-GMM CS models outputs: (a) Phase 1, (b) Phase 2, (c) Phase 3, (d) Phase 4, and (e) Phase 5.
Experiment 2: CSR and CT for The DSM-GMM, GS-FCA, SVM-FIM, SGB, and CFC CS modelling approaches.
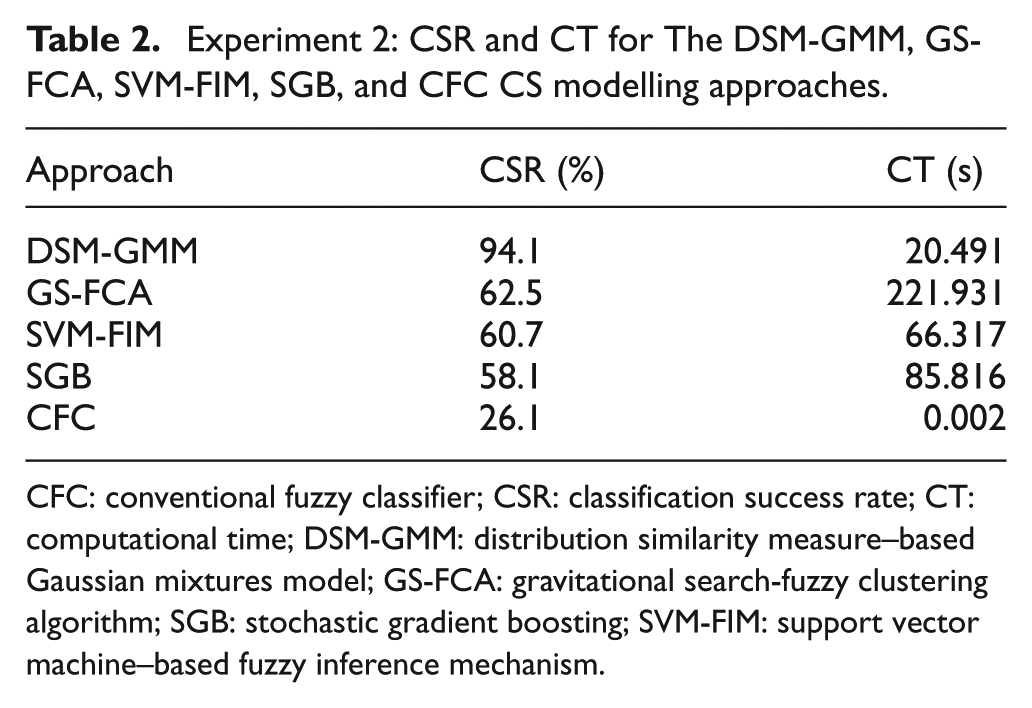
CFC: conventional fuzzy classifier; CSR: classification success rate; CT: computational time; DSM-GMM: distribution similarity measure–based Gaussian mixtures model; GS-FCA: gravitational search-fuzzy clustering algorithm; SGB: stochastic gradient boosting; SVM-FIM: support vector machine–based fuzzy inference mechanism.
The superiority of the DSM-GMM CS modelling scheme stems from the accommodation of the signals non-stationarity, by employing the GMM, in modelling the signals and the use of the EM algorithm in finding the parameters of the GMM likelihoods for each signal. In order to see the non-stationary behaviour of the signals, Phase 4 is taken as an example and plotted the histograms of its signals and as shown in Figure 12. It is clear that all signals are non-stationary. The signals of other phases are also non-stationary and their histograms were not graphed for saving space. Hence, an excellent PDF’s similarity, between the developed models and the captured signals, is achieved that results in enhanced CSR performance. The experiment above was repeated for different numbers of Gaussian components, say
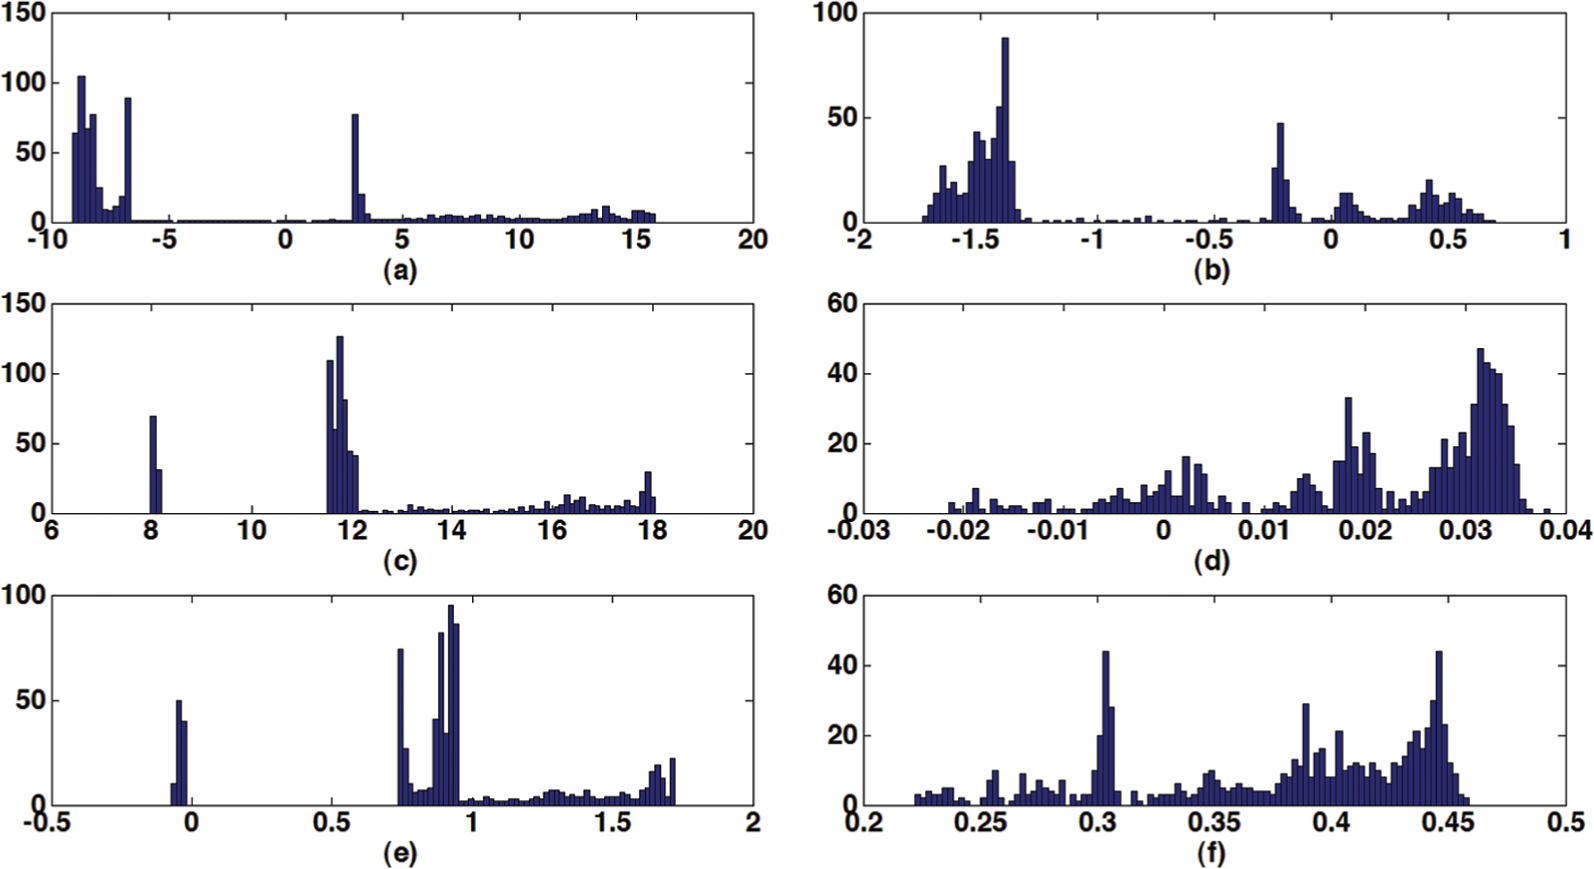
Experiment 2: signals histogram of Phase 4: (a)
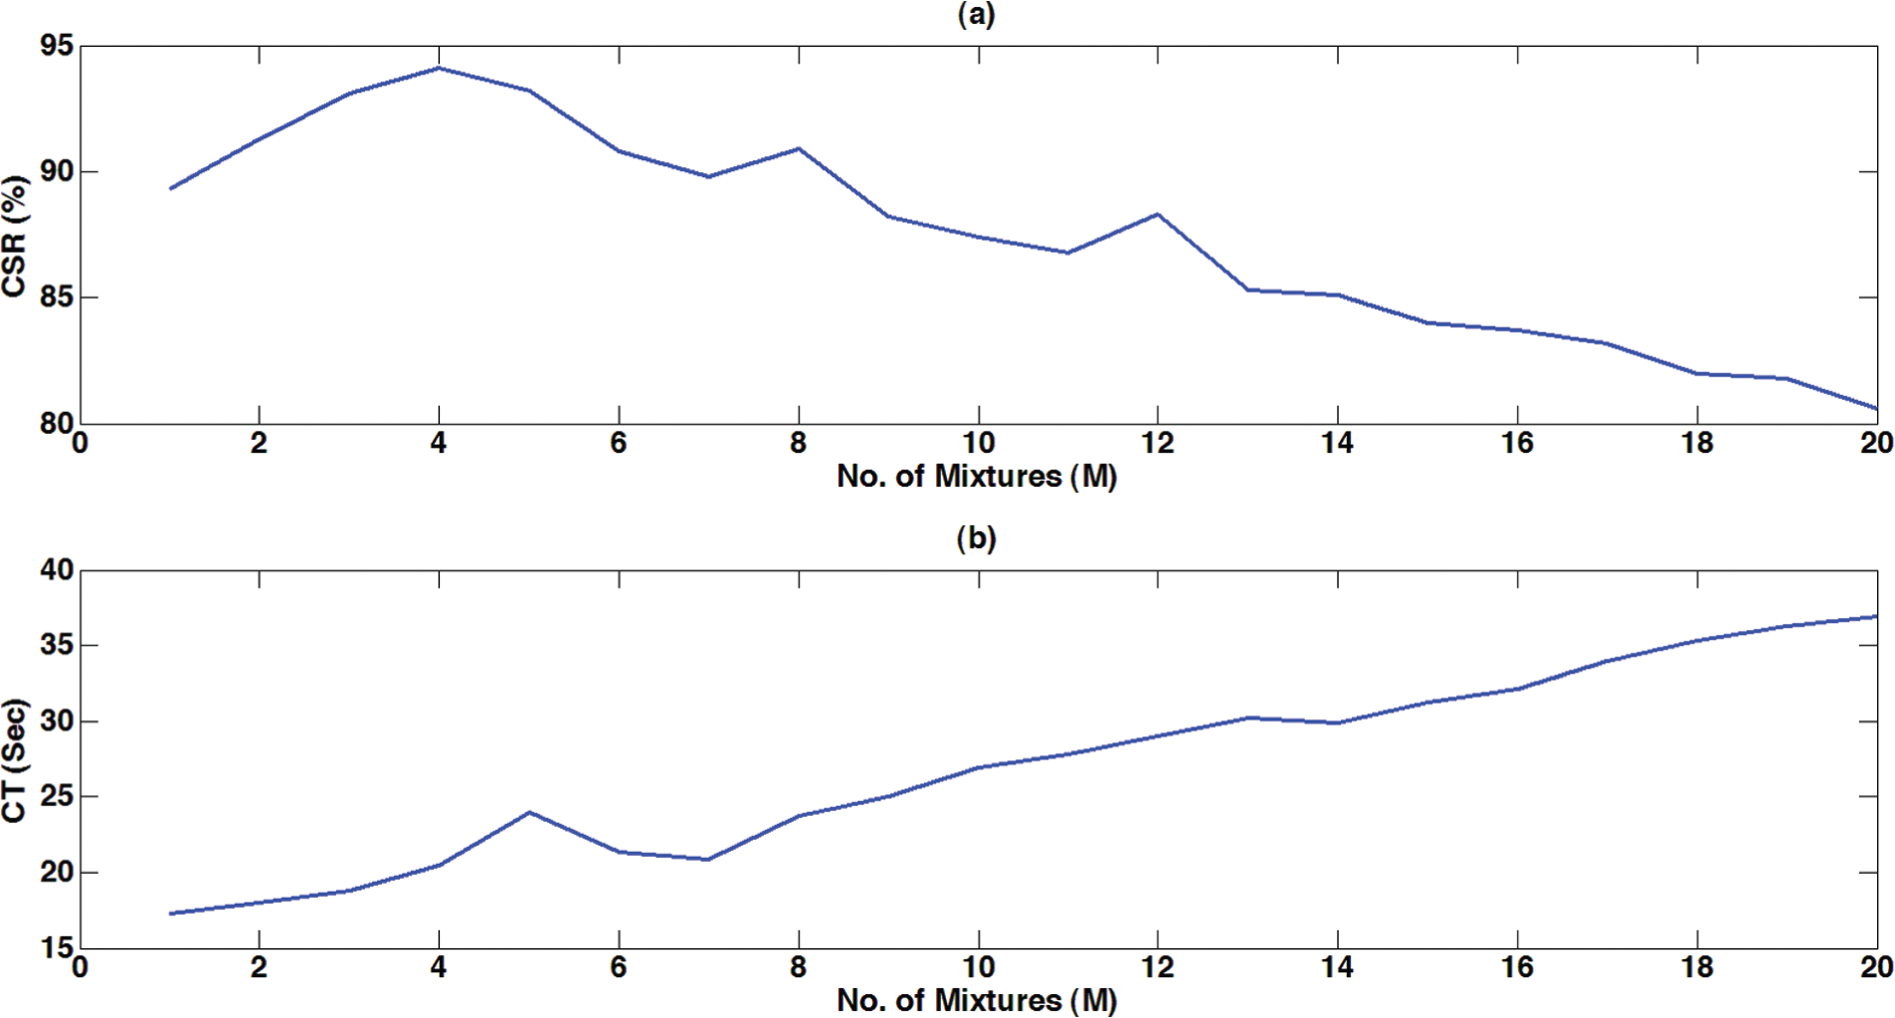
Experiment 2: DSM-GMM CS modelling scheme CSR and CT for different Gaussian components: (a) the CSR versus the number of Gaussian components (M) and (b) the CT versus the number of Gaussian components (M).
Discussion
In order to have a clear vision of the justifications behind the superiority of the proposed DSM-GMM compared with the available CS modelling schemes, the following points were noted:
In addition to its sensitivity to the position variation, the EM-GMM CS modelling strategy reported by Jasim and Plapper 39 is not featuring optimised number of GMM components. In the direct application of the EM-GMM CS modelling scheme in experiment 2, with three GMM components, 6269 samples were correctly classified that gives a CSR of 92.9%. Compared to the 94.1% CSR obtained with the DSM-GMM, one can have a strong impression that due to optimising the number of the GMM components, optimal similarity, between the distribution of the captured signals and the developed models, was obtained. Hence, the non-optimised EM-GMM CS modelling reported by Jasim and Plapper 39 would not result in enhanced modelling performance as that obtained with the DSM-GMM. Stemming from this fact, one can deduce that including the optimisation of the number of the GMM components may even lead to further enhancements, specifically in the computational cost. Moreover, further enhancements can be brought about using minimal number of features for each CS model. Possible use of simultaneous optimisation of the number of GMM components and feature selection reported by Figueiredo and Jain, 44 Law et al., 45 and Markley and Miller 46 or other relevant works might be suitable for the given situation. However, this requires further investigations, that is, left for future efforts.
Even though excellent CSR was reported by Jasim and Plapper 38 for the cube-in-corner assembly process of a rigid object, it can be seen from experiment 1 and experiment 2 that the CSR of the GS-FCA is suffering from a significant modelling inaccuracy for the case of peg-in-hole assembly of flexible objects. The use of fixed number of clusters (which is 7) for each CS model along with the fixed amplitude of 1 for each of the fuzzy set in the GS-FCA modelling scheme results in a significant dissimilarity between the distribution of the captured signals and the developed GS-FCA models, that is, directly influencing the CSR of the whole GS-FCA modelling performance. Likewise to the SVM-FIM CS classification scheme reported in Jakovljevic et al., 36 even though efficient use of SVM assists in having efficient fuzzy sets, the fuzzy membership functions are indeed not reflecting precise distribution of the captured signals since fixed amplitude of 1 is used for the SVM-FIM as well. Whereas for the DSM-GMM CS modelling scheme, in addition to the optimised number of GMM components, the weights of the GMM play a vital role in having more accurate fit for the distribution of the captured signals bringing about a significant enhancement in the performance of the DSM-GMM.
The SGB strategy reported by Cabras et al. 34 is based on fitting linear models to the given training set such that
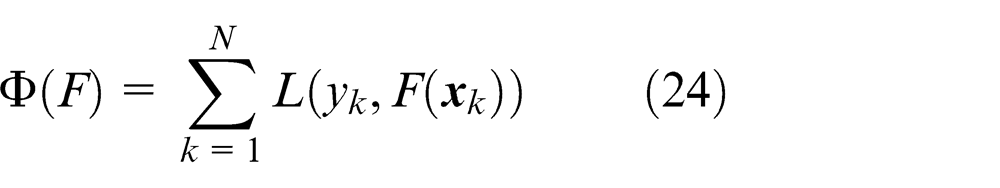
is minimised.
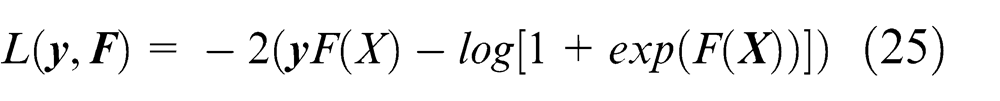
Even though the SGB was shown to be very efficient in fitting the same data, equations (24) and (25) make this scheme to be very sensitive to the prediction of data samples other than the training set that might result misclassifications even for samples with slight deviations of the original training samples. Hence, a significant performance degradation would be expected when using the SGB classifier for the CS modelling of flexible parts assembly since object elasticity shrinks the possibility of having very much similar training and test signals. Moreover, equations (24) and (25) constitute a non-convex optimisation problem that could be trapped into local minima.
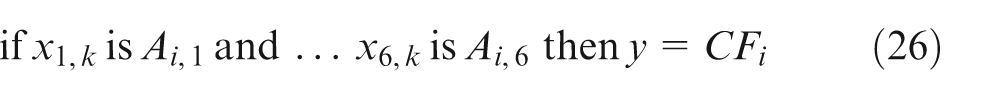
For the CFC modelling scheme proposed by Skubic and Volz,
20
the output of the
Comparing Tables 1 and 2, the CSR of the DSM-GMM is decreased by 0.3% due to the decrement in object stiffness. Such object stiffness decrement results in the increment of the non-stationary behaviour of the captured signals that required the increment of the number of Gaussian components for each CS model from 3 (for the object of experiment 1) to 4 (for the object of experiment 2). Regarding the other CS modelling schemes, they were degraded by 3.4%, 3.5%, 2.6%, and 1.2% for the GS-FCA, SVM-FIM, SGB, and CFC, respectively. Therefore, one can say that the DSM-GMM CS modelling scheme is more robust against object deformation due to the accommodation of the increment in non-stationarity degree of the captured signals by slightly increasing (or decreasing) the number of Gaussian components. It is worth noting that the requirement to increase the number of the Gaussian components in experiment 2, compared to the experiment 1, gives us a strong impression of the increment in the signals non-stationarity as the object stiffness decreases.
Conclusion
In this article, DSM-GMM was proposed for the contact-state (CS) modelling of force-controlled robotic peg-in-hole assembly processes with flexible rubber parts. In order to accommodate the signals non-stationarity, the DSM-GMM CS modelling scheme employs the GMM in modelling the captured wrench signals. EM is utilised for computing the GMM parameters and the DSM is used for finding the optimal number of GMM components. The CSR is considered as the DSM and number of GMM components resulting with the best CSR is considered as the optimal GMM number for modelling the captured signals. Hence, the DSM-GMM results in more accurate modelling performance even with multiple objects of different elasticity. Experiments were conducted on a KUKA LWR doing peg-in-hole assembly tasks of flexible rubber parts. Two experiments are studied; in the first one, a peg made from Neukasil RTV 230 material, which is an elastic silicone rubber material of hardness 30 Shore A, is considered. Using the DSM-GMM, excellent CSR was obtained and the optimal number of GMM components was found to be 3. For the second experiment, a softer manipulated object made from Neukasil RTV 23, which has hardness of 6 Shore A, is studied and outstanding CSR was obtained. However, the number of optimal GMM components for the second experiment was found to be 4. For comparison purposes, the corresponding CS models were developed for both experiments using the available CS modelling schemes like the GS-FCA, the SVM-FIM, the SGB, and the CFC. From the comparison, the superiority of the DSM-GMM CS modelling scheme is shown with a reduced computational cost. Learning parsimonious GMM models in which both optimal number of GMM components and minimal features to be computed in the learning process would significantly enhance the modelling performance and computational efforts for the CS modelling of flexible objects. However, this is left to future research efforts.
Footnotes
Appendix 1
Appendix 2
Acknowledgements
The authors would like to thank the teams of KUKA Roboter GmbH in Houthalen, Belgium and KUKA Labs in Augsburg, Germany for their support on the technical issues of the KUKA LWR.
Declaration of conflicting interests
The author(s) declared no potential conflicts of interest with respect to the research, authorship, and/or publication of this article.
Funding
The author(s) disclosed receipt of the following financial support for the research, authorship, and/or publication of this article: This work was supported by the Fonds National de la Recherche (FNR) in Luxembourg under grant number AFR-2955286.