
Abstract
Economies of scale, globalization and mass production have pushed the scale of manufacturing processes and the ability to compete beyond the scope of most small and medium enterprises. With the affordability of standard, off-the-shelf industrial and computer numerical control components, software and allied tools, we investigate a systematic model that looks at a number of possible ways of downscaling machines and operations that are of particular relevance to small and medium enterprises. The concepts presented here specifically deal with understanding dependencies and scale factors in complex systems, where the design is realized on the basis of commercial “off-the-shelf” components and subsystems commercial off-the-shelf). It is systematically integrated into proven design methodologies such as the Verein Deutscher Ingenieure V-models, axiomatic design and quality function deployment.
Keywords
Introduction
This article introduces a new design methodology—design for scalability—where scale refers to the physical size, performance and capability of a process or machine. The reason for proposing this is principally to enable small and medium enterprises (SMEs) to compete in the market place. This is because economies of scale, globalization and mass production have pushed the cost of manufacturing processes beyond the scope of most SMEs. The design-for-scalability methodology addresses scalability in three different ways.
First, design for scalability allows production processes to be designed so that their level of technology and performance is appropriate to both the requirements of the process and to the ability of the SME to manage and operate them. Second, design for scalability can take advantage of the greater availability of economical, high quality, commercial “off-the-shelf” (COTS) components and systems that enable the design and production of relatively low-cost, small-scale, high-performance production systems. Further to this, such systems can be modular and reconfigurable, which both supports the flexible nature of low-volume manufacturing and reduces the investment risk associated with purchasing specialized machinery. Third, the design for scalability process considers both the capital cost and performance at each level in the functional hierarchy and thereby assesses its feasibility from a system integration as well as economic point of view.
The costing model is an important element of this methodology. The model is based on the ability of a machine or process to generate output at a given level of operating cost. This allows the designer to determine two key parameters for analyzing economic feasibility, namely, the level of value added of the process and the ratio of cost to capital investment, also known as capital velocity (van Breukelen et al. 1 ).
By identifying those design drivers that contribute to the ability of a process or machine to be scaled either up or down, the designer can assess and compare different design specifications and the effect these have on scalability. Identifying which design variables constrain the scale of a process allows the designer to overcome these through either a redesign or an adaptation of the operating context.
There are many challenges in designing modular systems. One of the main ones is the difficulty in transforming functional requirements into design variables associated with COTS components. Unlike machinery designed and built from the ground up, modular systems are assembled from various components and subsystems of varying levels of performance, capability and tolerance. Accordingly, there are fewer degrees of freedom with respect to design variables. Understanding which process variables need to be closely specified or controlled is critical in the selection of these components as this drives the performance and cost of the machine at different scales.
The current proposed “design-for-scalability” methodology allows process designers to systematically design a technically feasible plant for complex processes at different scales. Through an iterative tuning process, the method intrinsically seeks feasibility and optimality by utilizing commercially available equipment and adapting the operating context from the very outset of the design process. The methodology focuses on the early identification of functional requirements, design parameters, process variables and interactions that are likely to affect the commercial or technical feasibility of the process. This ensures that feasibility and optimality are inherent in the scaled designs from the early stages of the design procedure. The methodology also recognizes the varying optimal application of different scales of plant. For example, small-scale machinery is often built to operate under entirely different technical and economic constraints when compared to large-scale industrial processes. This scale difference is an advantage for designing a process for a particular operating context to minimize the weaknesses of the process at a given scale. The design-for-scalability methodology also reveals design variables or items of equipment that become limiting factors as a function of scale. Through interfacing concurrently with a simulation and cost model, limitations to feasibility can be identified early in the process and “designed out” of the plant. By removing these traditional weaknesses of small-scale processes and enhancing operational advantages such as flexibility and agility, small and medium sized businesses can design processes that are economically competitive with large-scale operations.
This article follows a logical sequence, starting with a definition of “scalability.” This definition takes into account both historic and recent thinking in the idea of scalability. Design theory is discussed with references to modular and scale-based design methods and also in relation to how the methodology proposed in this article can enhance the results obtained with traditional design methods. These include the V-models (Verein Deutscher Ingenieure (VDI)-2206/2221), 2 axiomatic design principles, quality function deployment (QFD), design structure matrix (DSM) methods and the integration and evaluation of systems through simulation. The model is validated using three case studies, namely, a wine fermentation tank, a biodiesel plant and an industrial delta robot design.
Definition of scale and scalability
There is a lack of published literature dealing with the definitions of the words “scale” and “scalability” (see for example Spicer et al. 3 and Nussbaum and Agarwal 4 ). In this work, we are concerned with scalability at the machine or process level. This approach is more appropriately termed “machine scalability.” Here, the word “machine” refers to a mechatronic system, consisting of structural, mechanical, electrical, sensing and control subsystems, arranged so as to enable product to be manufactured. It can be either discrete, as in the case of a computer numerical control (CNC) milling machine producing individual prismatic parts, or continuous, as in the case of a biodiesel conversion process.
We define scalability (or machine scalability) as the ability of and/or the extent to which a machine can remain both technically and economically feasible over a certain level or range of scale. We suggest that scale can refer to one or a combination of different machine characteristics. These include its physical size, capacity, performance (e.g. cycle time) and capability (i.e. precision, tolerance or error). Down-scaling generally refers to a reduction in size, performance and so on, whereas up-scaling means the opposite. Scalability is defined as the ability of and/or the extent to which a machine can remain technically and economically feasible over a certain level or range of scale.
Design
The essence of any design process is that one has to create, evaluate, manipulate and communicate.
Designing a machine requires establishing functional, operational and performance requirements and satisfying these by understanding how the detailed design of the machine and the interactions between critical variables allow these requirements to be met.
If the focus of machine design is on scalability, then the first step is to establish (functional) scale requirements, that is, the physical size, capacity, throughput, cycle time and quality requirements. These requirements then need to be translated into specific design parameters, and further devolved into key process variables. This is the underlying philosophy and principle of both QFD and axiomatic design. The next step is to determine to what extent the functional specifications of the critical modules, the this case the COTS components, support the process variables. After iterating through this process, one or more feasible designs may result that satisfy both economic and operational requirements.
In normal design practice, the functional specifications of equipment and component items are themselves decision variables and are optimized in the design process. When designing for scalability and using COTS items, this is much less the case, since the designer is limited in choice to what is commercially available. The design process needs to take this into account. Furthermore, the machine operational and performance requirements may need to be less rigidly specified up front, as the final performance of the machine is much more a function of the COTS items selected in the detailed design phase. And, as will be evident later on, the economic and commercial feasibility of the machine is as much a function of the operating context and associated operating conditions as it is of the design itself.
Whatever design methodology is adopted, it will need to incorporate at a very minimum, the information and data described above. Since the very objective of designing for scalability is to reduce both capital and operating costs, the focus of developing a suitable design methodology must also consider the cost and effort required in the design stage.
Design methodologies
Recent research on the topic of modular and scalable design, relevant to the problems identified in this article, has focused on resolving complex dependency issues that arise as a result of combining multiple subsystems into a larger design. Axiomatic design (Suh 5 ), the V-models (VDI) 2 and Robust design methods (Taguchi and Clausing 6 ) all address the issue of dependencies to a greater or lesser extent, but also in a complementary way.
In the case of axiomatic design and variations involving DSM approaches, as complexity grows, the number of requirements, parameters, variables, specifications and interactions grow accordingly. However, it is conceivable that the magnitude of these may cause the implementation of this methodology to be unduly costly and time consuming as some machinery does not warrant this level of analysis. In addition, it is highly unlikely that the independence axiom will be maintained as the complexity and modularity of the system grows.
Recent publications look at combining different methods coupled with robustness theory, ranking of design alternatives, improved DSM representations and identifying appropriate objective functions, all with the aim of identifying an optimum or near optimum set of modular design specifications as part of a product architecture strategy.
Emmatty and Sarmah 7 developed an integrated framework based on QFD, formulating functional requirements and cross-referencing these against knowledge and “part-attribute” databases for previously used solutions. Then they combined system elements according to familiar product architectures and solutions requiring minimum modification and maximum standardization. The resulting design candidate(s) are further developed using design for assembly (DFA) and design for manufacturing (DFM) techniques. The final step involves a verification and validation step against customer requirements.
Hasenkamp et al. 8 comment on how robust design methodologies are still not widely used in industry and most design activities are approached in an unstructured manner. As a remedy, they propose a framework incorporating a number of practical activities into a generic design methodology broadly based on the design process developed by Pahl et al. 9 These activities include gathering data on product failures from sources such as warranty claims, applying QFD to establish key target values for module performance, capability and tolerance, performing design of experiments (DOE) during the concept design stage, establishing transfer functions in order to characterize system response to noise and variation and, importantly, to generate multiple design proposals to screen and identify a set of feasible or near optimum design solutions. This set of design proposals can be ranked on the basis of variation risk, the extent to which variation of a product design characteristic contributes to performance degradation.
Li et al. 10 interestingly are among the very few that have identified the important role of the operating environment or context as a key factor in the design process, especially in engineered-to-order products. They, and others, propose a platform-based product family design methodology as a strategy to generate cost-effective and robust designs. The authors also examined the issue of scalability by identifying key scale variables within each design platform and use a mathematical model that simulates the effect of scaling these variables up or down. They achieve this by mapping relationships between product functions, using the bill of materials (BOM) domain as their functional representation. The strength of the relationship between modules forms the basis of their DSM. They proceed to develop a clustering methodology to categorize modules or components into “basic,”“adaptive” or “individualized” functionality within the overall design.
Marinelli et al. 11 recognized that there exist two types of component attributes, depending on the nature of the component, namely, continuous and discrete. This is useful because most COTS items are better represented in a discrete rather than continuous way. They use a BOM method to develop the “functional breakdown structure” (FBS) and “physical breakdown structure” (PBS) of a design. Physical attributes are assigned to each component in the PBS whereas functional attributes are assigned at the functional module level in the FBS. The relationships between the different domains are established using “dependency relations” between the attributes belonging to each different domain, and these relationships may be linear or non-linear. A range or set of feasible values is established for each of the levels or components in each of the domains and a Boolean “module interface function” is derived on the basis of whether module attribute values are compatible with each other. This then allows a mathematical programming formulation to be applied in order to select modules that are compatible in a complex design.
Yoshimura et al. 12 developed a design improvement methodology aimed at identifying a set of optimum design variables from an initial set of feasible variables, based on analyzing the relationship among all design variables and characteristics and identifying compatibilities and conflicts, akin to QFD. In order to deal with high levels of complexity, the authors revert to a hierarchical method, thereby decomposing a complex problem into a set of simpler ones. They incorporate a form of screening or prioritizing method based on the extent to which a lower-level design variable positively influences a higher-level design characteristic, and these may form part of an objective function to be optimized as part of a design improvement. Interestingly, they also recognize the importance of establishing the operating environment as part of the design optimization method.
The research and methodology presented in this article is consistent with the underlying philosophy of these other research teams, but differ in the sense that it combines scalability and modularity with COTS components. In addition, an alternative “evaluation-manipulation” method is proposed, one that incorporates simulation, component selection and modification of the operating context. Also, the physical domain is represented by a combination of the process function block diagram (FBD) and system block diagram (SBD), as opposed to the more commonly used BOM.
We also use the basic formulation of
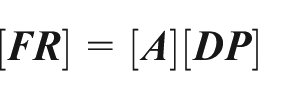
where [
In our case, designs are driven by the selection of COTS components and the design space or physical domain is defined by the limited set of discrete design parameters, each tuned to a specific level and definition of scale. In addition, the corresponding set of functional requirements include not only machine performance metrics but also economic, productivity, effectiveness and efficiency ratios. The nature and role of the transformation matrix,
The physical domain
There are different ways to characterize a machine but in this work, the FBD, the SBD, the process flow diagram (PFD) and a system’s representation collectively represent the physical domain.
At the highest level, a machine in its operating context can be considered a system with inputs and outputs and an internal structure that can be represented at different levels of abstraction, depending on the complexity and need for detail. A generic system’s representation is shown in Figure 1.
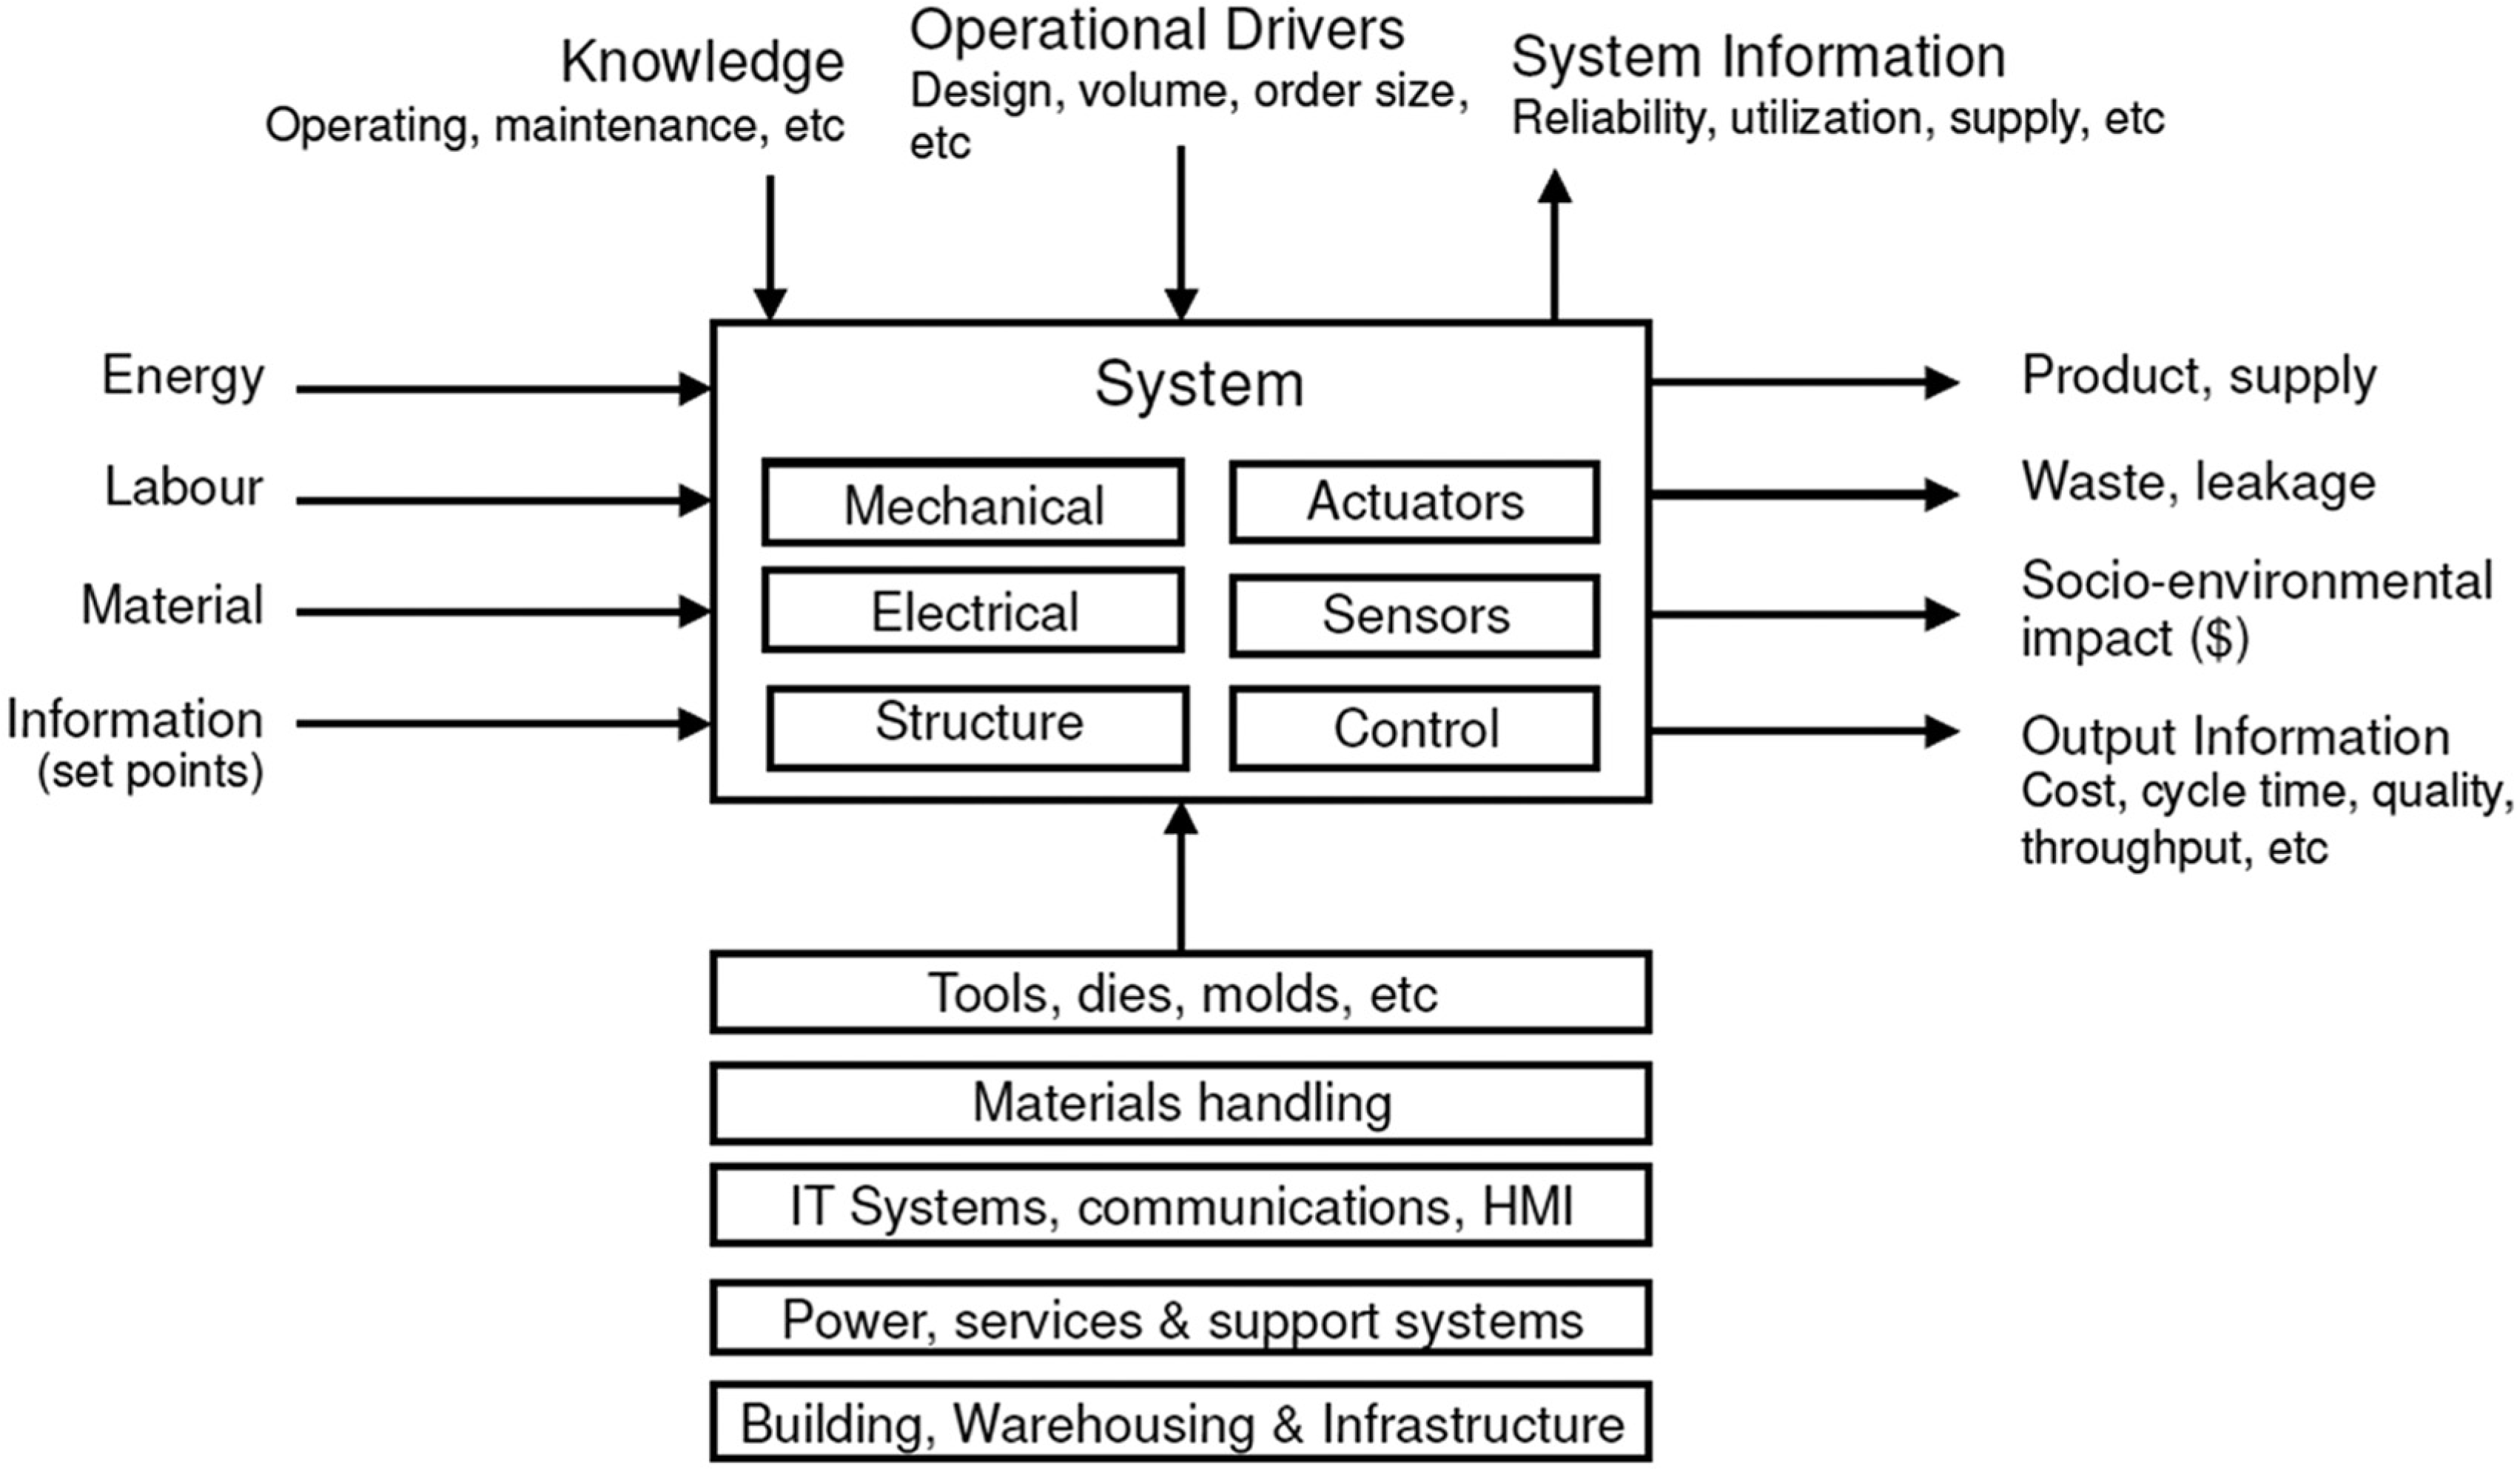
Abstract representation of a process.
The machine as a system consists of multiple internal functional groups, including its structure, mechanical and electrical systems, sensors and actuators, a control group and power group. In its operating context, the machine requires ancillary items including tooling, materials handling equipment, energy supply, communications and its physical environment. The machine has inputs and outputs, also defined as part of its operating context. Common inputs are raw material, labor and energy. Common outputs are finished product, waste material and entropy. Less obvious inputs include information related items such as operating set points and maintenance actions, and utilization parameters such as production schedule demands and batch sizes. Information outputs include cycle time, quality, reliability and cost. Machine design needs to consider the operating context as a fundamental objective. It can present itself as a constraint or an opportunity. As will be seen, the operating context does in fact offer degrees of freedom that allow low-scale machines to be implemented in an economically feasible way. 13
The internal structure of the machine can be modeled as a FBD that identifies all the major systems, subsystems, equipment and component items and their function(s). For this application, the FBD provides the most logical data structure in terms of operational and functional specifications of the different functional groups down to the component level. This allows the scalability function for each branch to be developed in the same way as is done in axiomatic design. Three case studies are dealt within this article, namely, a wine fermentation vessel, a biodiesel conversion process and an industrial delta robot. Figure 2 shows a cross-sectional view of the wine fermentation vessel while Figure 3 shows its corresponding FBD. Figure 4 shows the biodiesel conversion process while Figure 5 shows its corresponding FBD.
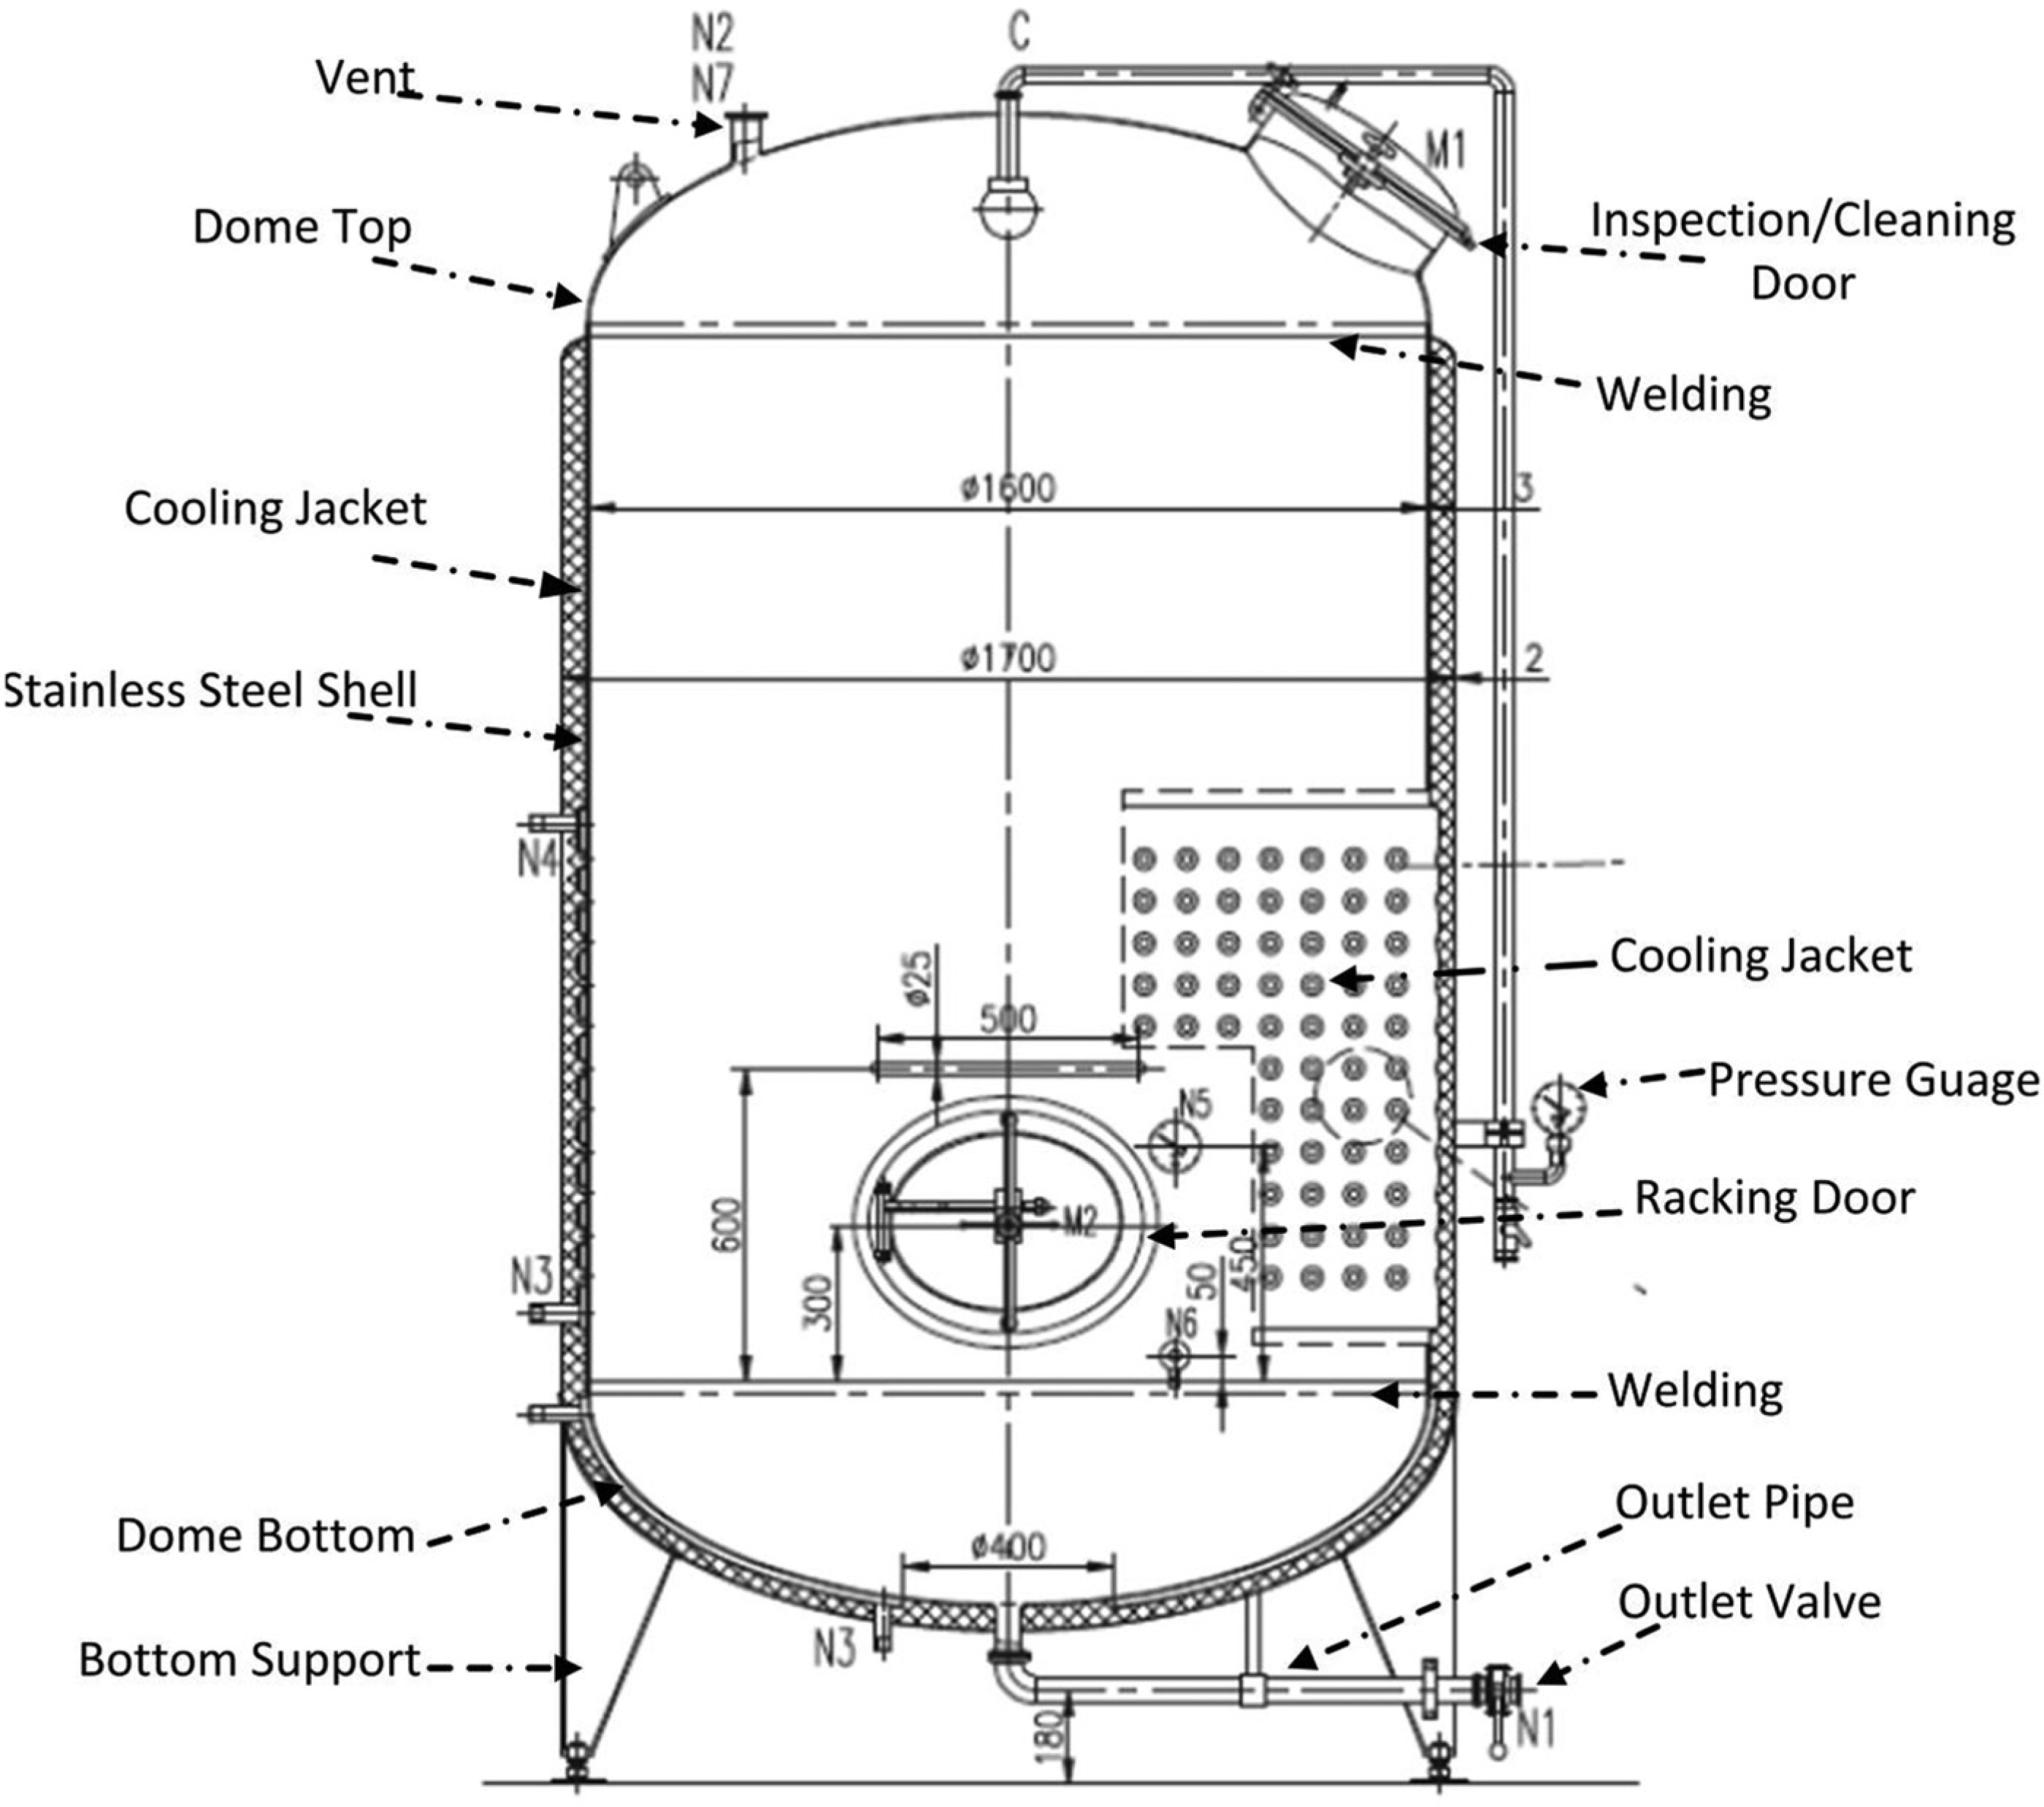
Cross-section of wine fermentation tank (vessel).
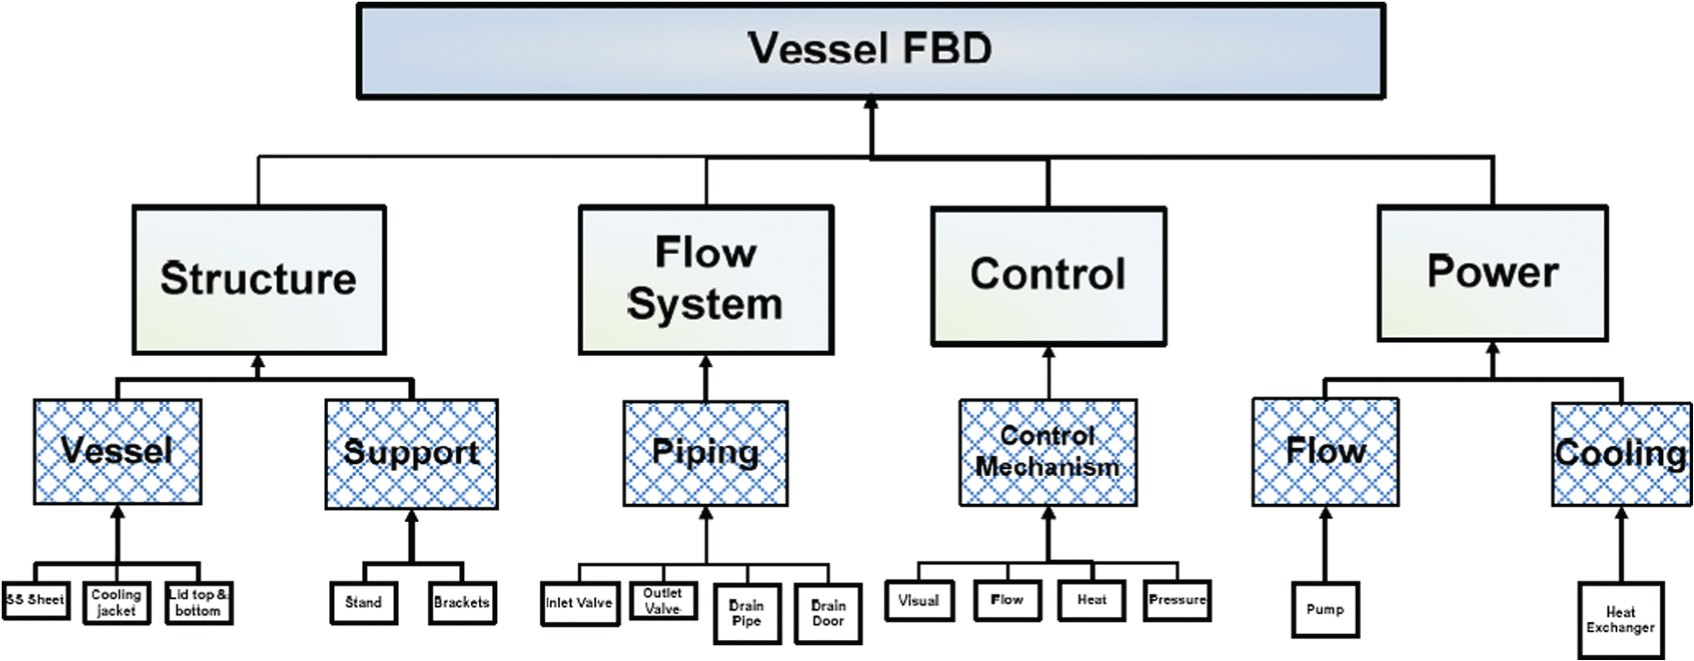
Function block diagram (FBD) vessel.
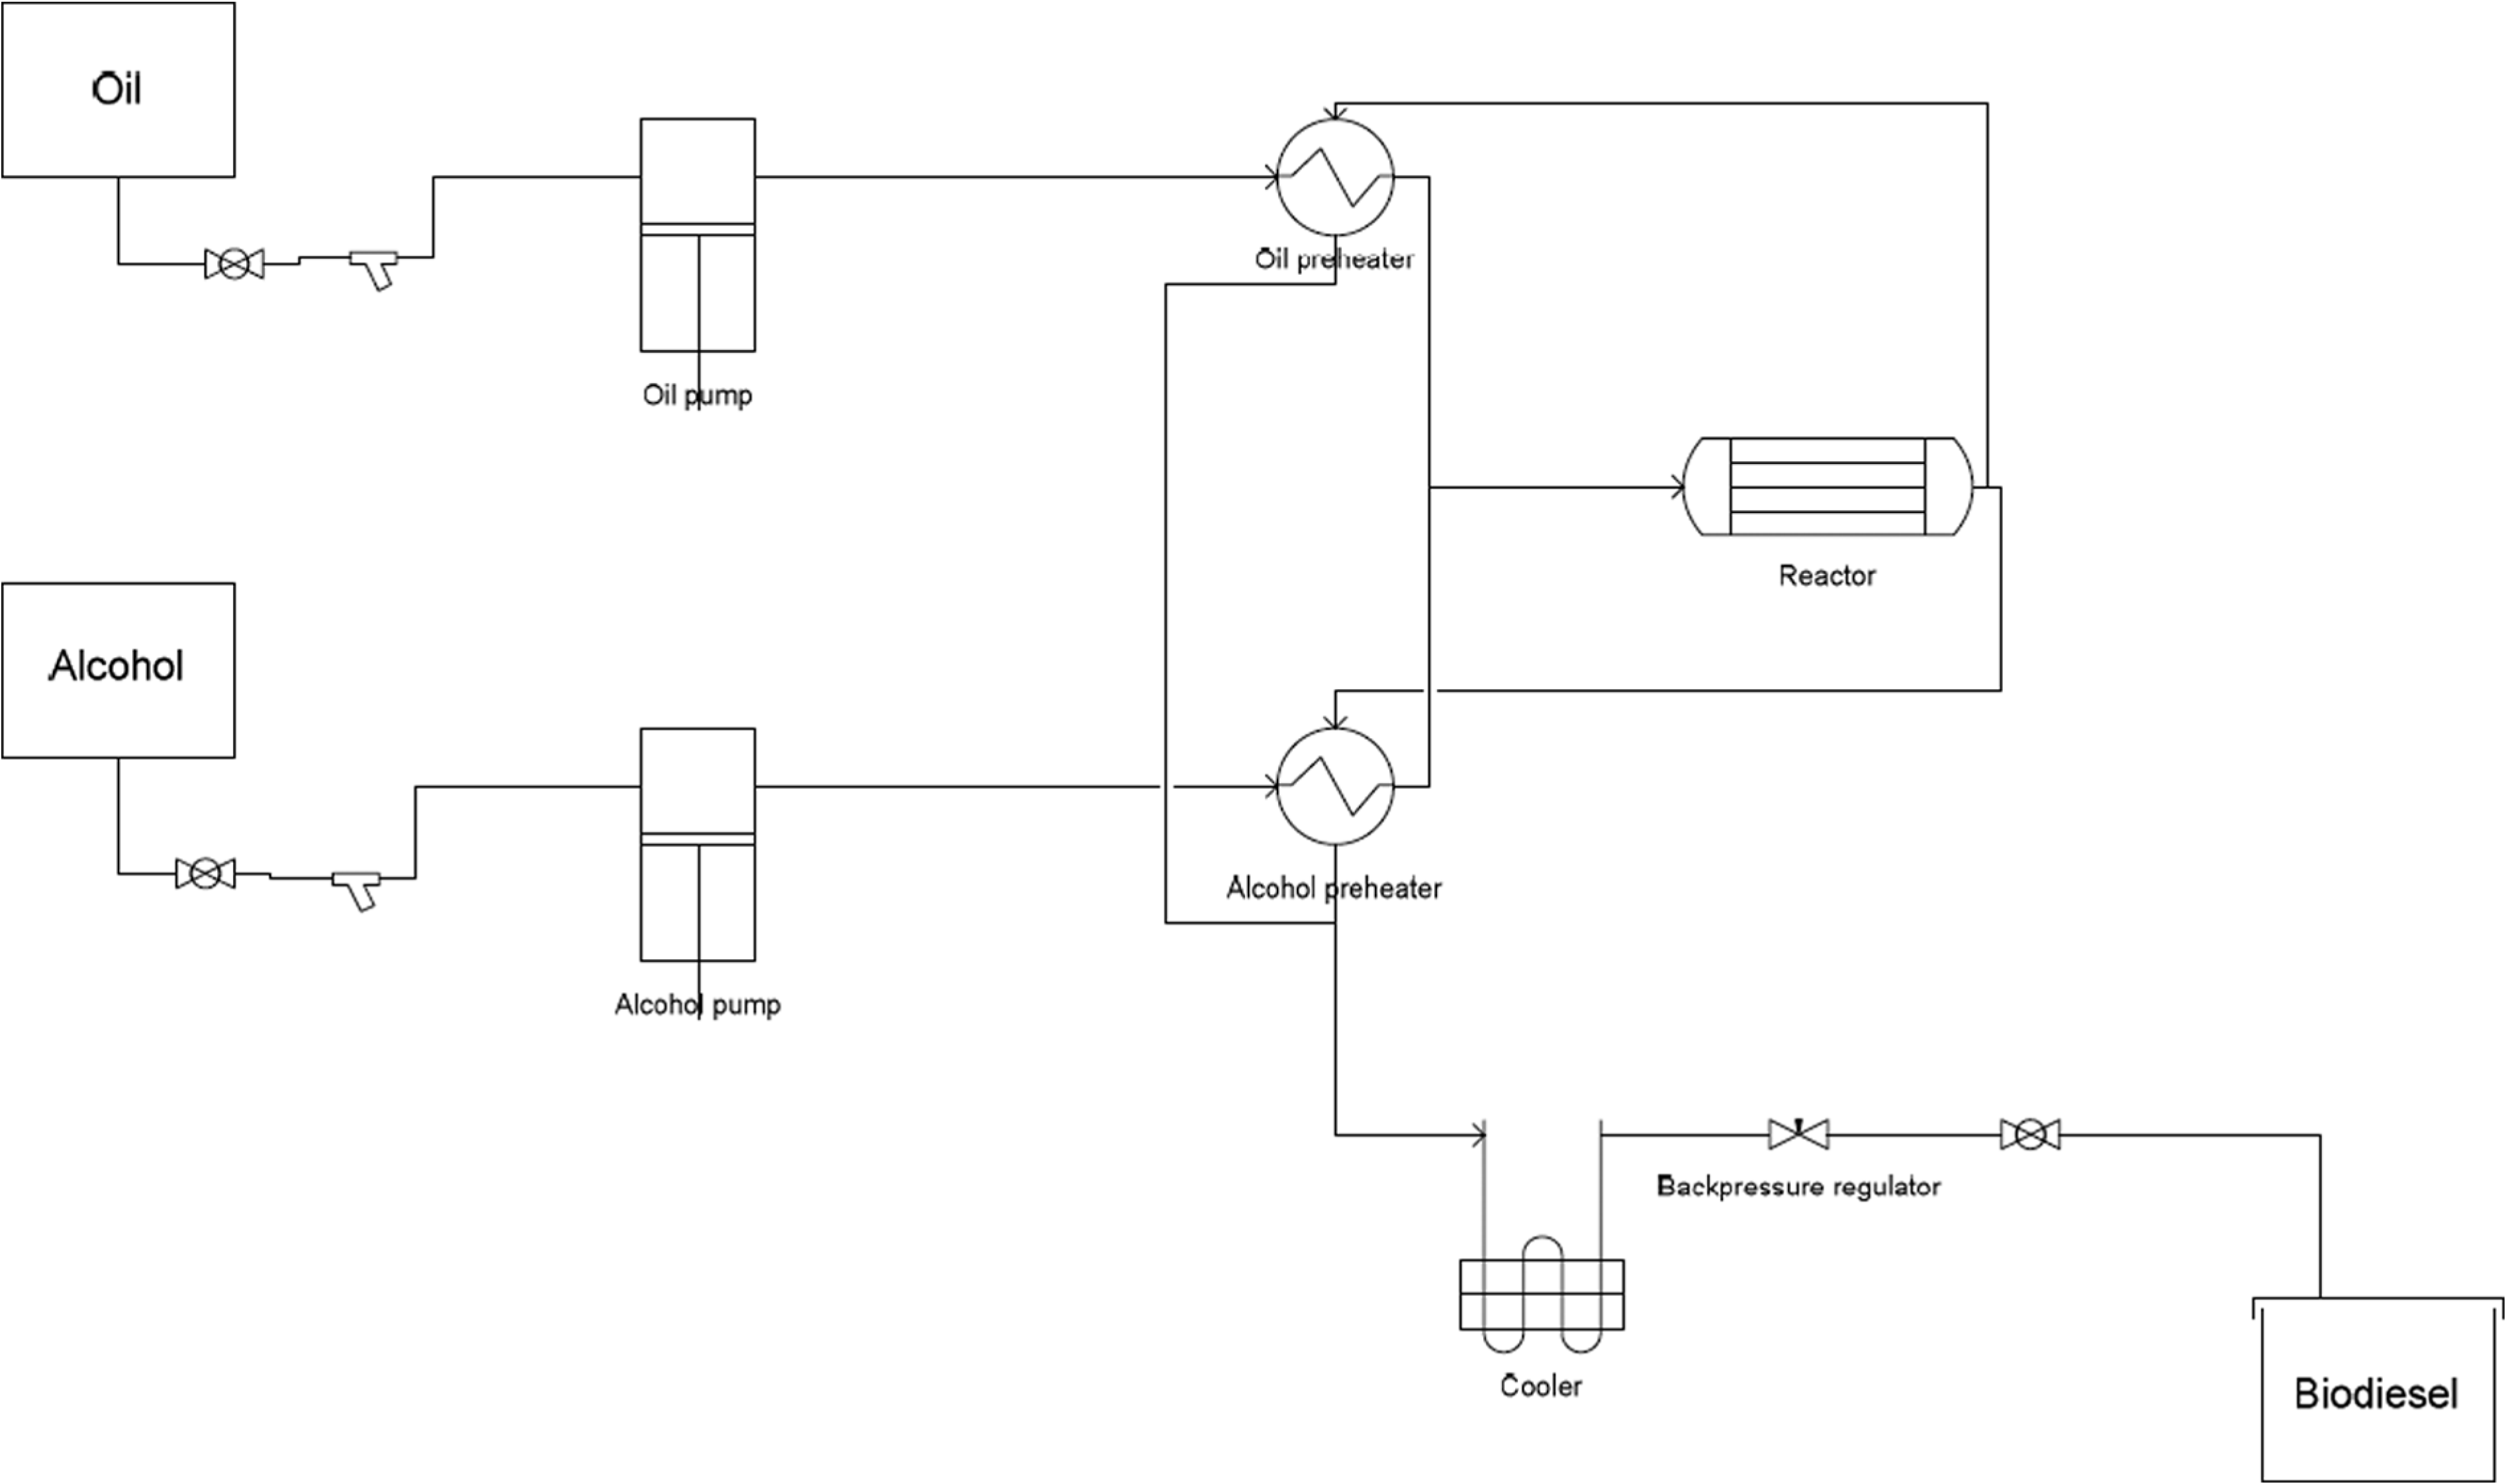
Schematic layout of a small/medium biodiesel plant.
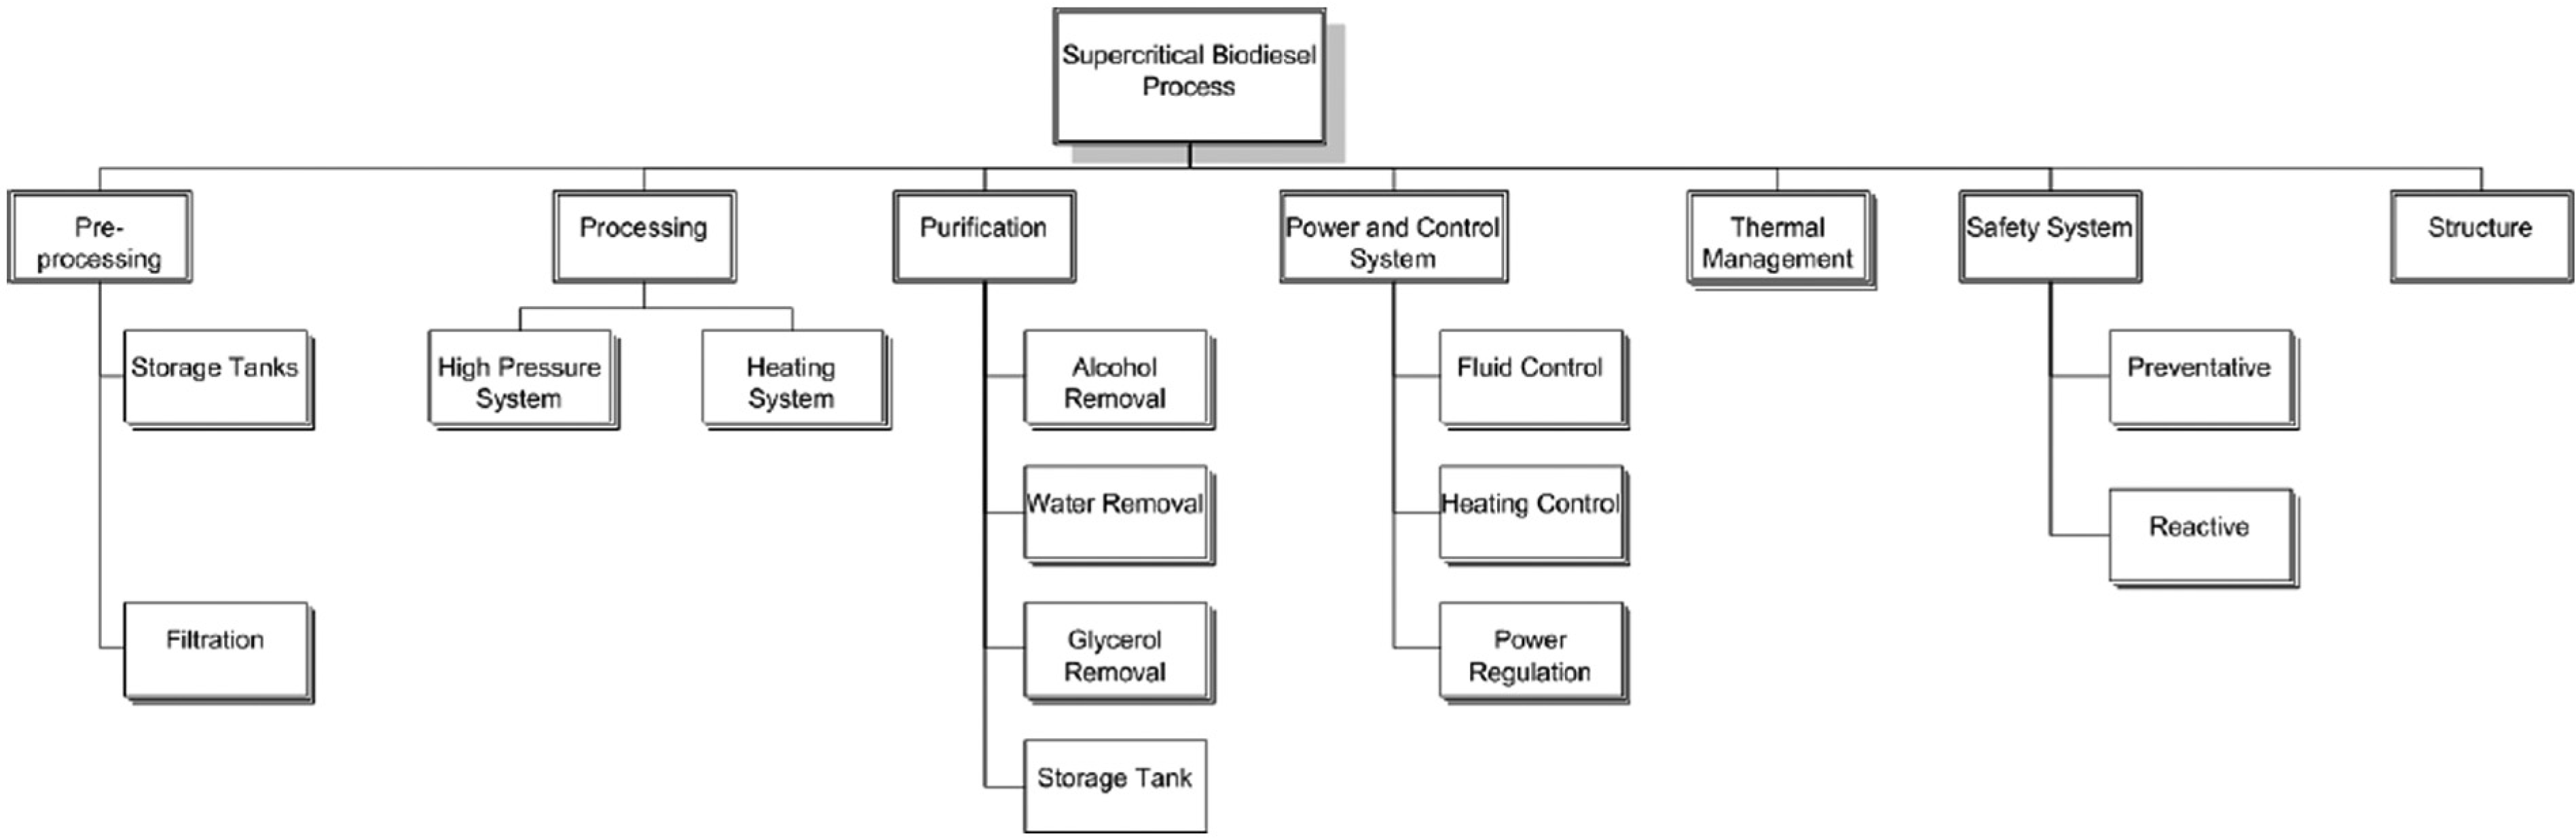
FBD biodiesel plant.
From the FBDs, it is possible to derive a more detailed representation of the internal structure of a component or plant. This representation is given in a SBD. Its function is to capture critical relationships between the equipment level items in the FBD and to quantify them. It can be thought of as a combination of the FBD and PFD. The SBD therefore becomes the basic architecture for developing the process model. Figure 6 shows the SBD for the fermentation vessel while Figure 7 shows the SBD for the biodiesel process.
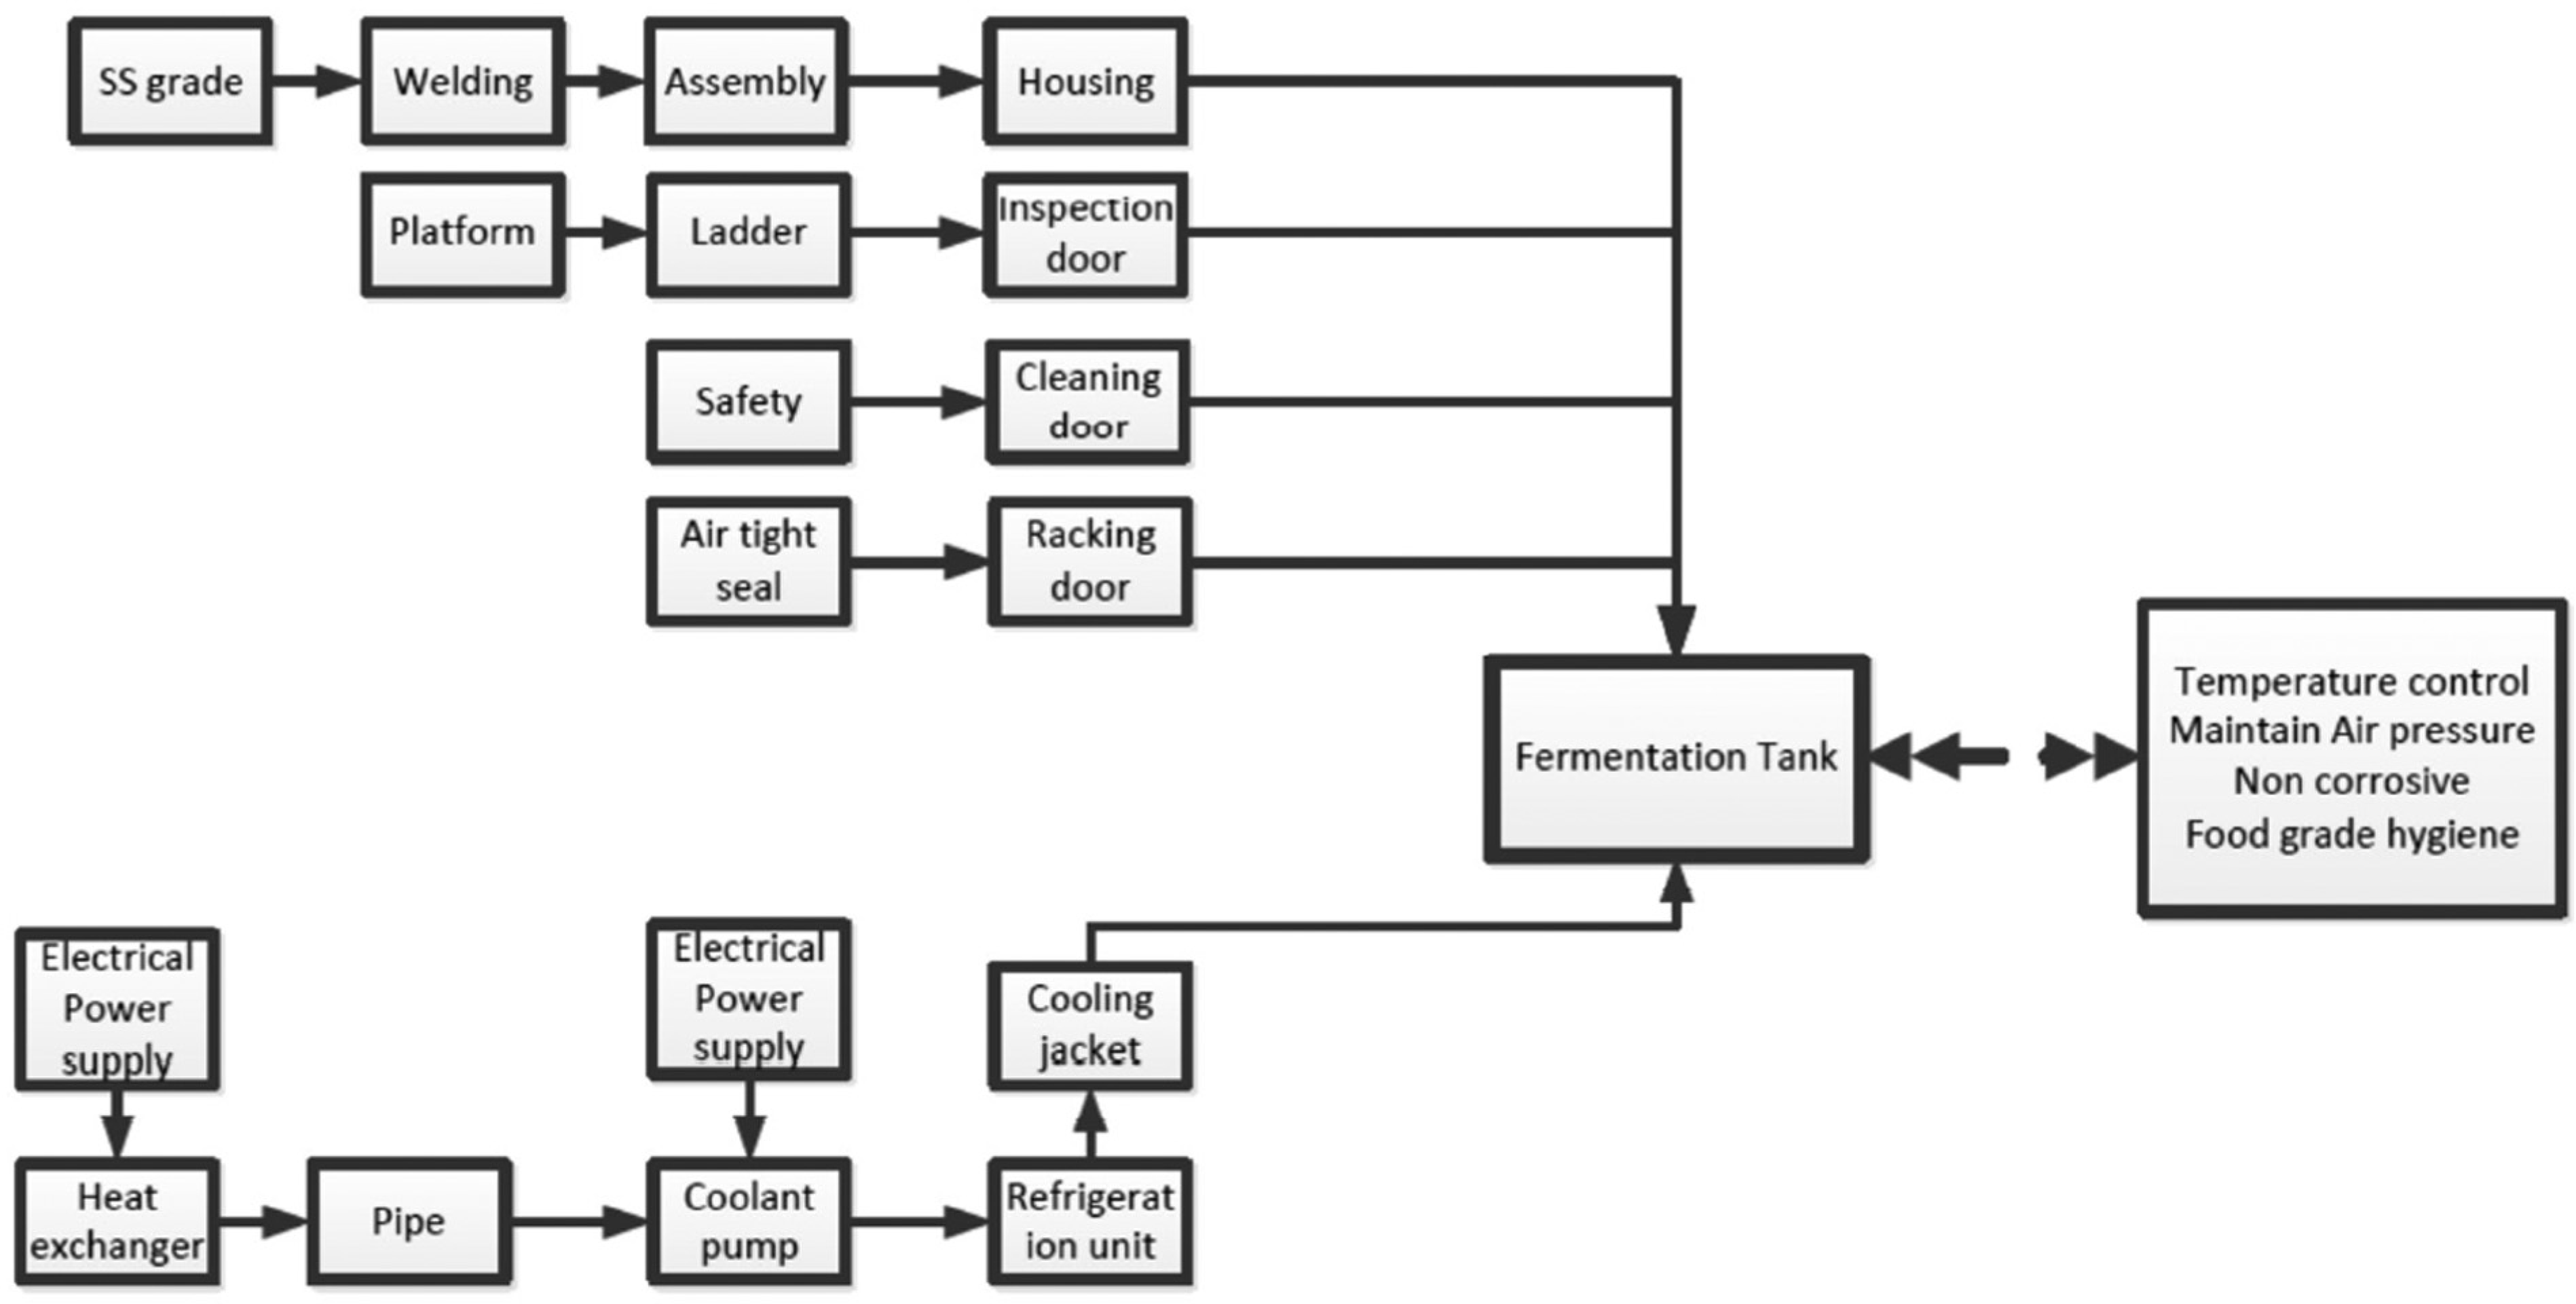
System block diagram (SBD) vessel.
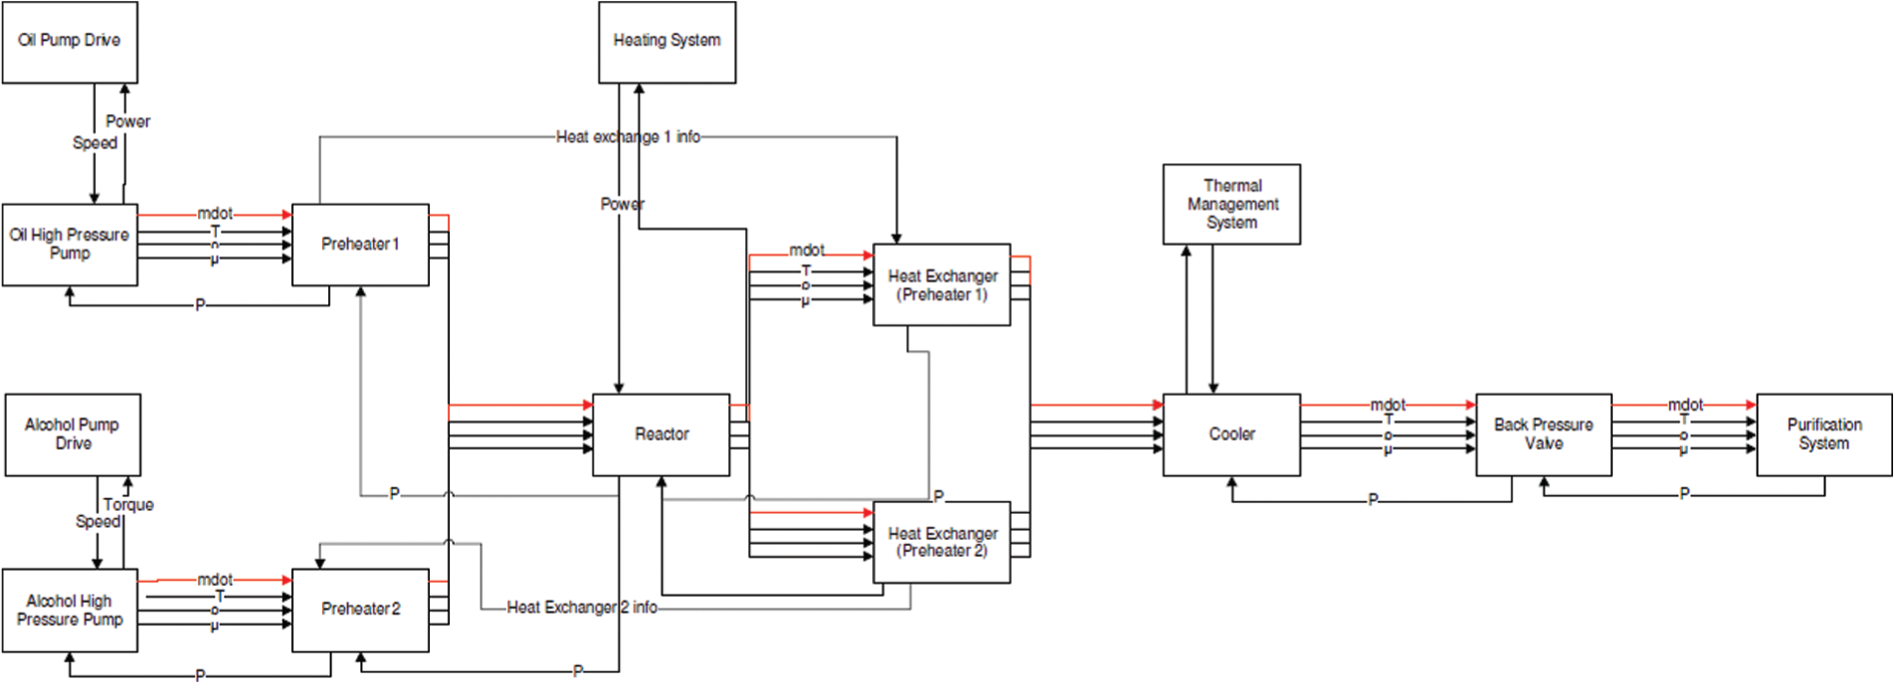
System block diagram (SBD) biodiesel plant.
Machine economics
Traditional payback and breakeven analysis is based on determining the minimum production volume such that the sum of the fixed and variable costs equal the revenue generated by this minimum (or breakeven) volume.
To estimate the capital cost of a process, the cost-capacity equation is frequently used. It has the following form
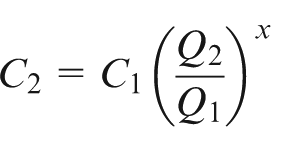
where C
2 is the cost of the up- or down-scaled machine at capacity Q
2 and C
1 is the known cost of the machine at capacity Q
1. When the exponent x
Capital cost can also be estimated using the Lang cost factor methods. 14 This involves obtaining quotes or firm prices of main items of equipment and modeling the cost of ancillary equipment as factors of these prices.
It is common practice to combine the capacity-cost model or Lang cost models with factorial cost-estimating models to estimate the annual direct as well as indirect operating costs associated with operating machines. These factors are usually based on either historical operating data or industrial benchmark data published periodically by industry bodies.
van Breukelen analyzed industrial data for process costing, where the ratio of capital velocity/value added was found to be a major indicator of the efficiency of investment in productive assets, and an indicator capable of being benchmarked as well as act as a boundary condition on the design of a process or machine.
A design methodology for scalability with COTS components
The proposed methodology focuses primarily at integrating COTS equipment items and components into a system that is able to provide the performance and capability required at an acceptable level of capital expenditure and operating cost. Part of this requires the operating context of the machine to be considered very early in the design process.
Figure 8 shows how the relationship between the functional requirement vectors [
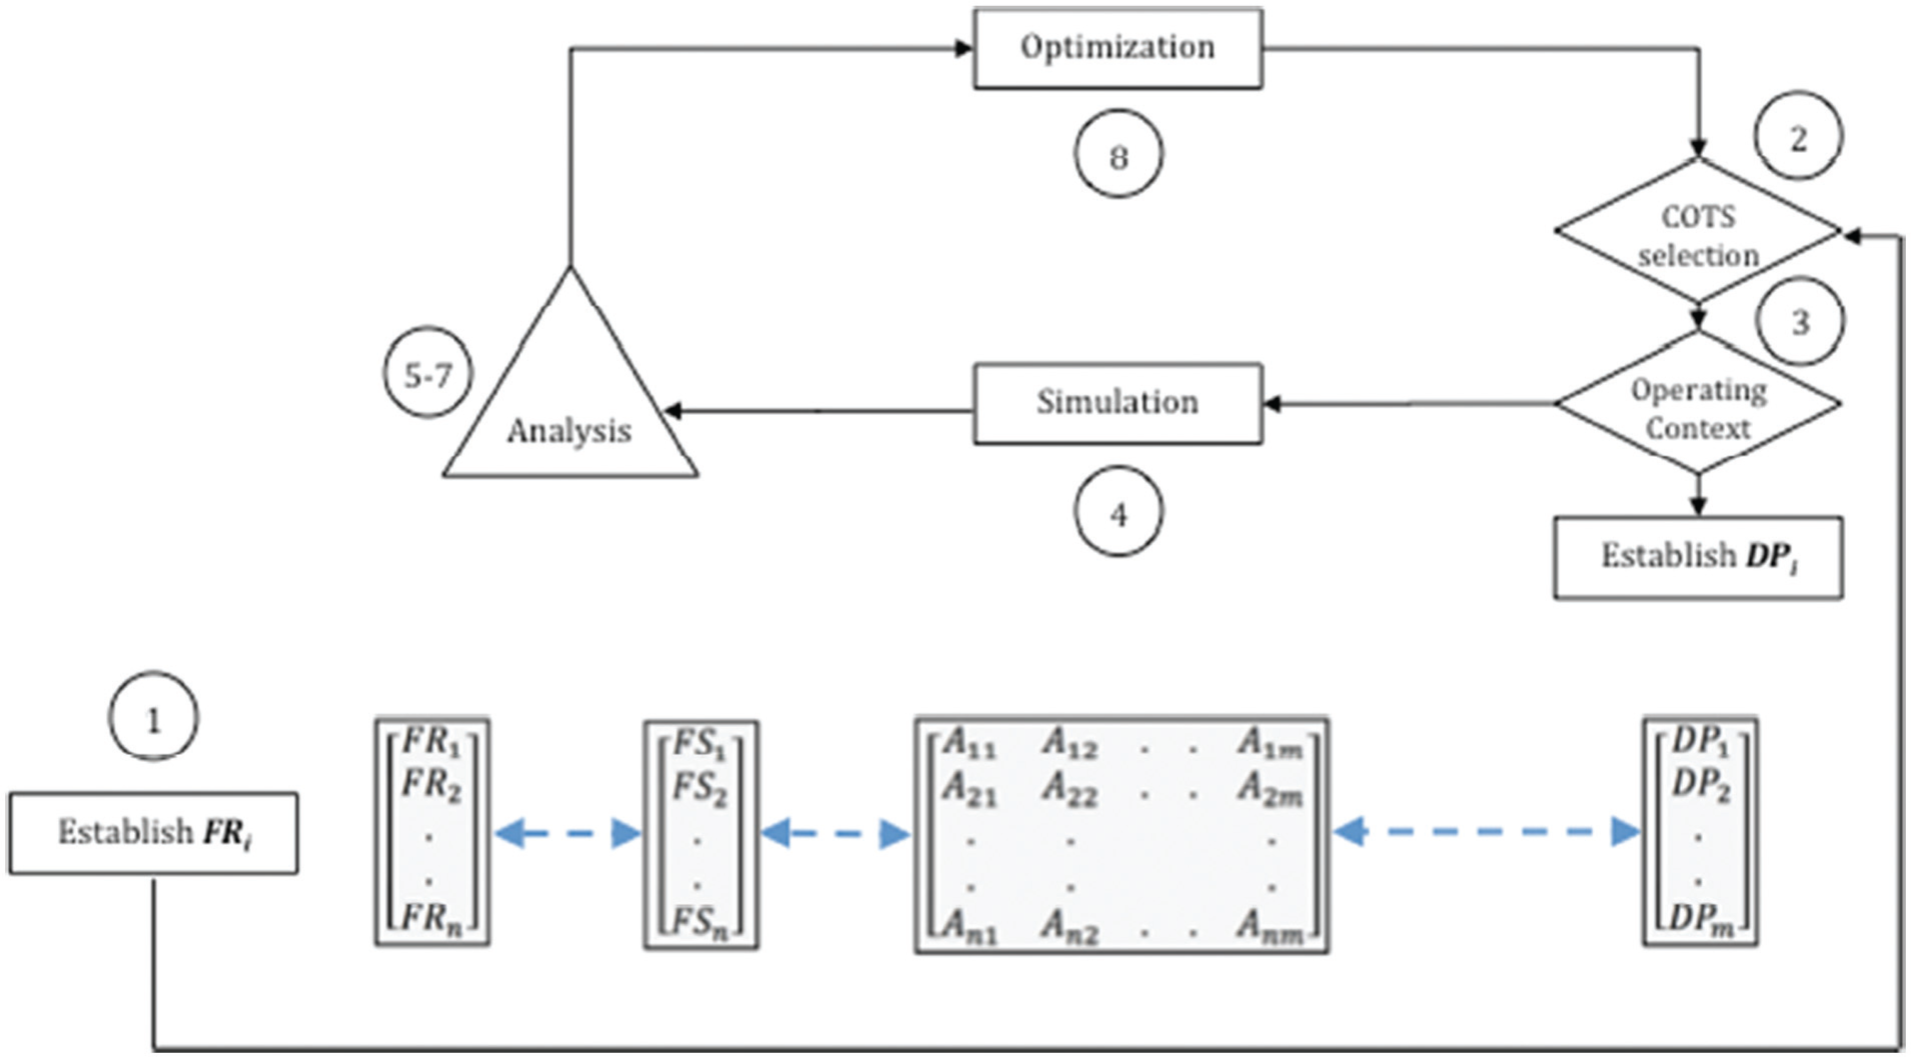
Proposed design methodology.
The model execution can be detailed as follows:
Step 1. The design team specifies a set of functional requirements, denoted by the vector [
Step 2. The designer selects a suitable set of COTS components and establishes a set of design variables, based on the functional specifications of these components. These variables are included in a simulation model. The level of detail represented in the model determines the size and complexity of this vector.
Step 3. The designer establishes an operating context for the design and selects appropriate variables that represent the operating environment. Examples of such variables include labor content and cost, planned utilization, operating set points and so on. Together with the result from Step 2, this completes the [
Step 4. The designer builds a simulation model contingent on the application, behavior and dynamics of the process. This model is appropriately detailed and is inclusive of all critical variables and relationships. This enables an accurate representation of the real system using the variables and parameters included in the [
Step 5. The vectors [
Step 6. The designer establishes critical relationships between design variables and design specifications. This can be done in a variety of ways:
By taking into account a priori knowledge about causal relationships between variables, parameters and constructs.
By conducting sensitivity studies on one or more elements in the
By the introduction of formally structured DOE methodologies for critical variables.
By conducting a Monte Carlo simulation on critical variables.
This analysis highlights those variables and relationships that are critical in terms of meeting the functional requirements of the design. In some cases, this will be obvious upon inspection of the data. In other cases, more advanced techniques should be employed, including regression analysis, partial least squares (see Pratley et al. 15 ), response surface modeling and so on.
Step 7. These relationships and constraints are then assigned a weight, based on the strength of the relationship. Each relationship between a functional requirement and each element of the design variable vector becomes an element
Step 8. The design is fine-tuned and optimized based on the criticality rankings of the [
Step 9. Calculate and evaluate the scalability factors,
This methodology can be extended in the sense that a complex machine can be designed in a hierarchical way, bottom-up by designing appropriate subsystems and equipment items first followed by integrating these at the next level in the system hierarchy, or top down.
Importantly, the methodology incorporates a feedback loop as part of the “evaluation-manipulation” process. In this loop, the designer selects components and adjusts and modifies the operating context, reruns the simulation model and analyses the technical and economic feasibility until one or more suitable design solutions are found.
Simulation
The machine needs to be modeled as a system, but this time in such a way that the key relationships and objective functions can be identified, characterized and modeled. This is the final abstraction phase. This phase effectively combines the functional specifications and data structure for each of the machine subsystems (from the FBD) with the operational specifications (from the SBD) and with critical interactions. This model is rarely mathematically deterministic, and it is more appropriately represented by a data driven analysis technique, involving simulation coupled with regression. The detail and complexity of the model depends on a number of factors, which include the extent of both the knowledge of and understanding of the process, the availability of data and on criticality and complexity in terms of process control and safety.
Case studies
Three case studies have been carried out, the first involving the analysis of the design and scalability of a wine fermentation vessel, the second involving a more complex assessment of a biodiesel process and the third, the design and build of an industrial delta robot manipulator.
For the fermentation vessel, the characterization of the process is a simple one, and is based on the following:
Material: cost of stainless steel, its characteristics;
Forming: rolling, shearing and welding;
Assembly, cleaning and erection.
However, for the biodiesel project, the process model is more complex. The purpose of the simulation model is to analyze scale in terms of performance, equipment specifications, efficiency and operating cost. In addition, results from the simulation have the potential to show any key process variables and parameters that become constraints at different scales. This information aids in the selection of COTS components as well as determining the optimum scale.
What makes the biodiesel case study an interesting one is that it is difficult to make such a process economically feasible on a small scale. Global renewable energy investment saw a sharp decline of 12% from 2011 to −2012 and this trend has been observed to continue through 2013 (Bloomberg New Energy Finance 16 ). Investment from the public market in renewable energy declined 61%, while investment from venture capital and private equity investors fell 30%. 16 Biofuels have been particularly over-represented in this decline by exhibiting a reduction of 40% from 2011 to 2012. 16 Volatile global market conditions have driven investors away from traditional large-scale plants due to a lower appetite for the risk associated with the large capital investment, fixed capacity and long planning and construction times. Investors have preferred smaller-scale ventures developed from a technology which exhibits proven flexibility and agility and lower capital costs (Lux Research 17 ). Indeed, small-scale renewable energy investment increased 3% globally from 2011 to 2012; however, the distributed modular nature of photovoltaics meant that this technology represented almost the entirety of this increase. 16
Biofuel—particularly biodiesel—plants have not been proven to be commercially successful on a small scale, and this is generally attributed to the excessive cost of production compared to fossil fuel alternatives18,19. The designs of these smaller plants have demonstrated sensitivity to operating points and feedstock20,21 which undermines the ability to maintain flexibility and the agility to respond to changing market conditions or demand.
Traditional design methodologies on which these plants are based restrict their criteria to produce fuel at the lowest cost, 22 rather than considering the operating context and rethinking the design approach to achieve the most economically attractive use of the plant and its output.
The case study of a biodiesel plant was chosen to determine whether smaller-scale arrangements that yield positive returns and lower financial risks to investors can be designed by using design for scalability. The key factor involves rethinking the design approach by adapting the use of the plant to match the operating context and thereby allowing the flexibility to vary the proportion of the plant’s outputs—fuel, electricity and heat—to match market conditions.
Constructing the contingent model and simulation involves the following steps:
Establish relatively simple chemical interactions. In this work, a single chemical reaction was assumed to take place, involving a single type of fatty acid alkyl ester (either methyl oleate or ethyl oleate) with either methanol or ethanol as the reactant. 23
Identify critical process variables, their dynamic behavior and possible interactions with other variables. A distinction must be made between global and local variables. Global variables are variables that are common to all subsystems. For a biodiesel process, they may include pressure, temperature and fluid density. Local variables tend to be unique to a particular subsystem, such as the displacement of a pump. Global variables can be thought of as the essential communication links between subsystems. Local variables can be thought of as functional or operational variables that in turn will define the global variables. Figure 5 illustrates this relationship.
Define what can be called the “driving variables.” Where there exist multiple and strong interdependencies, as for instance in the case of mass flow rate with temperature, pressure and volumetric flow rate (pump speed), the model can quickly become overly complicated. It is proposed in such cases to use the concept of the driving variable, where this variable can be chosen to be constant for a particular modeling or simulation run. This variable should be a core global variable. In the case of the biodiesel process the mass flow rate should be the global variable to allow the other global variables to be solved. Ideally, the driving variable should be constrained by continuity laws, such as mass or energy balances.
Develop the characterization model for the process on the basis of mathematical relationships (algebraic or difference equations) or data driven techniques such as statistical or artificial intelligence (AI) models. Figure 9 illustrates the model used for the biodiesel process.
Linking the various subsystems and equipment level items often requires incorporating what may be called “property modifiers.” These property modifiers change the properties of global variables, either based on known physical or chemical reactions or, in the case of experimental or published data, on the basis of look-up tables. In the absence of experimentation or real life data, this study uses multiple linear regression in a number of instances to adjust the properties of the fluid and its reaction, based on published results.
Once the overall architecture of the model has been established, attention should focus on the subsystems and equipment level items in terms of verification and validation of their basic functionality and their effect on the global variables. This often happens concurrently with model development, consistent with V-model design methodologies.
Finally, all the subsystems are linked via the global (and driving) variables to simulate critical process parameters, such as yield. Again, these equations can be based on physical, chemical, statistical or combined methods.
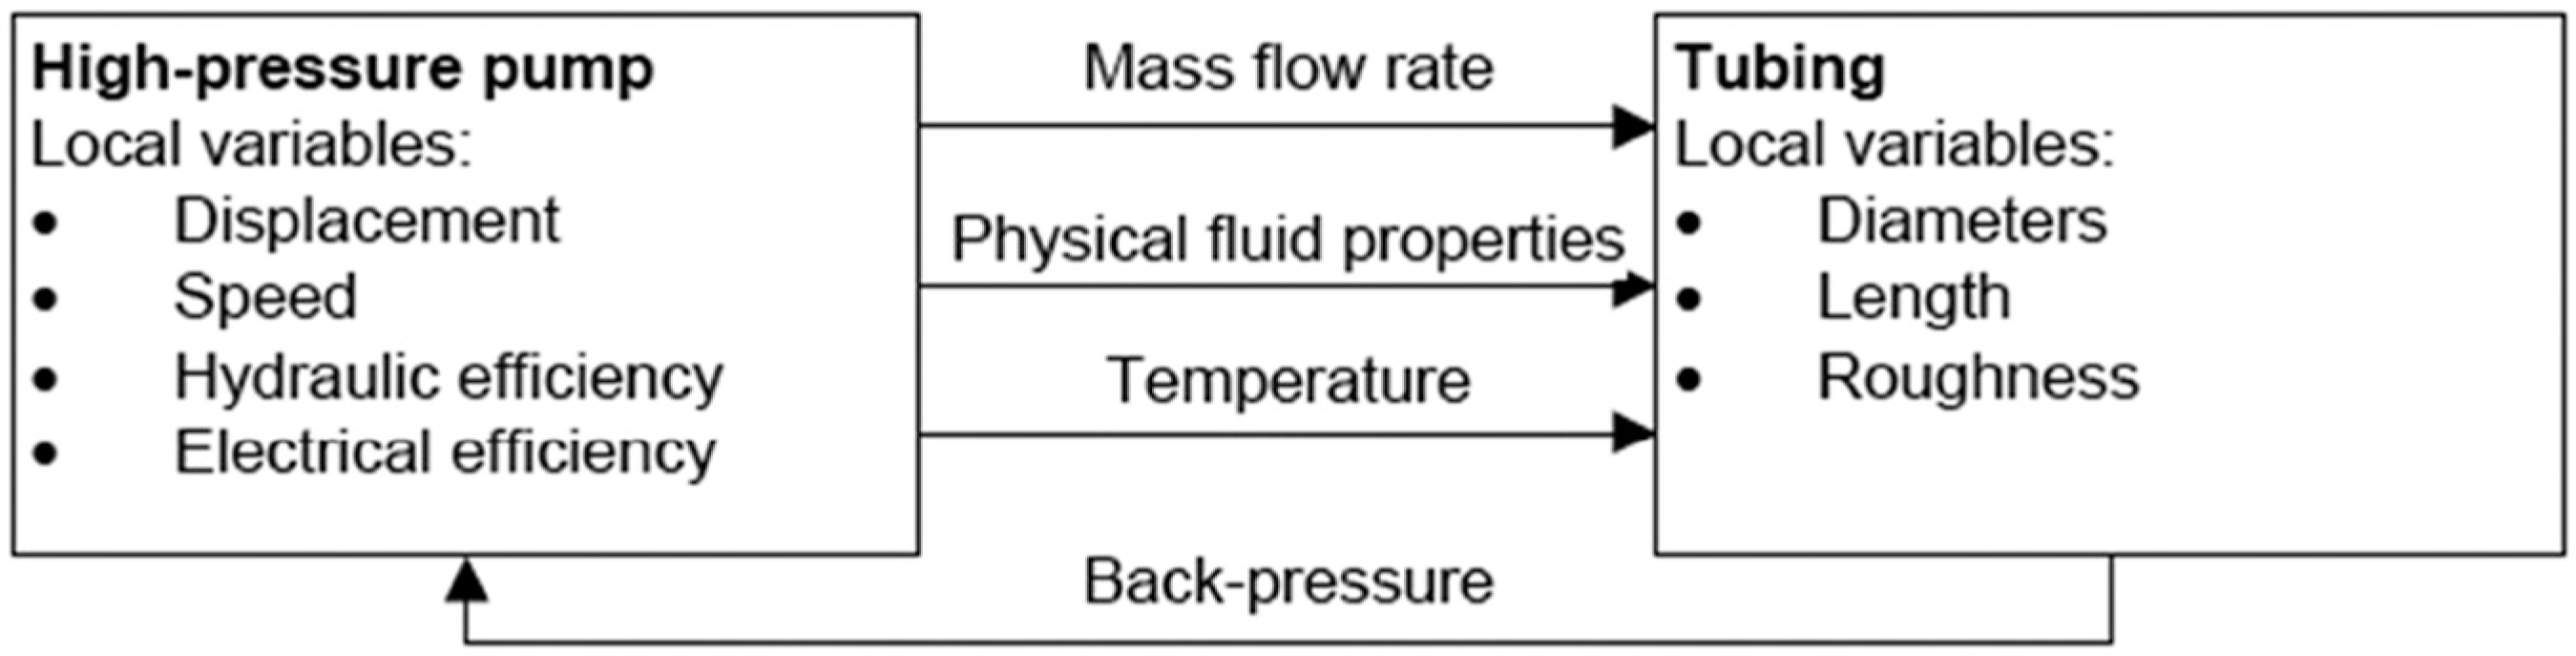
Link between global and local variables.
The third case study focused on the design of delta robots. Their performance in terms of accuracy, rigidity and their ability to manipulate loads at high speed is excellent. They provide a good case study for exploring opportunities in cost versus performance optimization and applying the proposed design model.
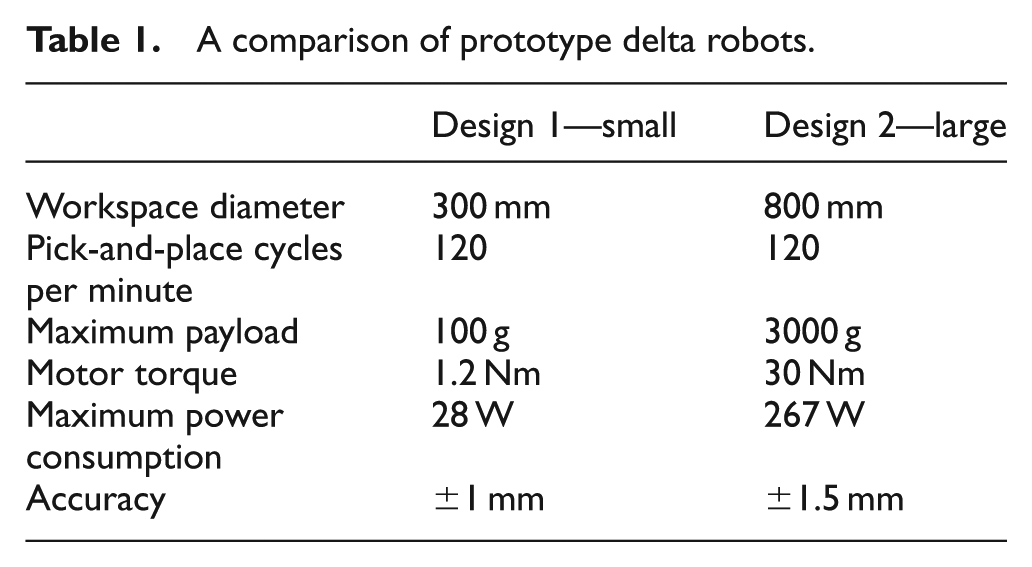
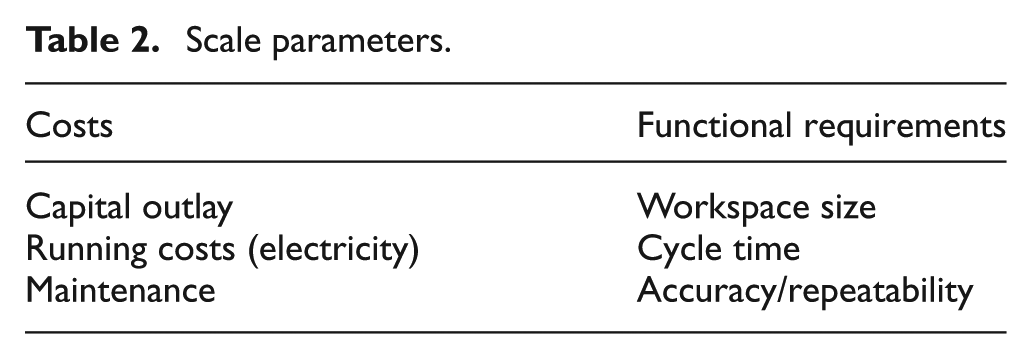
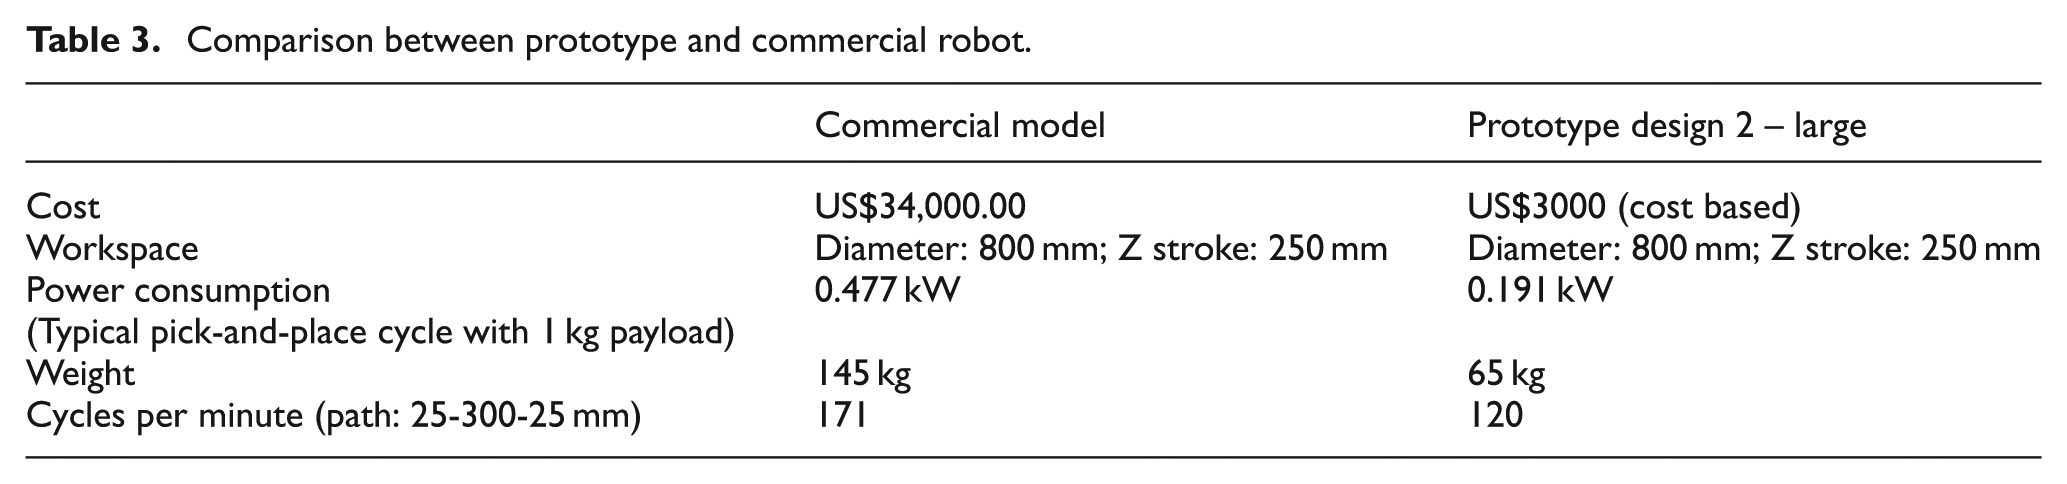
The design model was applied to both the downscaling and the design simplification of a delta robot. Two different scale levels were considered, small and large (Table 1). The designs were compared to a commercially available model. In both designs, the cycle time, an important performance parameter, was fixed to 120 picks (or cycles) per minute. A design simplification of the delta robot resulted in fewer components and less assembly steps. The machine design was very much guided by the choice of COTS motors and controllers. Mass produced, economical, high-quality stepper motors, converted into closed-loop, direct drive servo motors were used for the drive system. The largest size of stepper motor, a NEMA 42 frame size, was used so that the robots workspace could encompass a typical human’s working envelope and also to mimic the workspace size of existing delta robots for comparison purposes. By eliminating the use of a gearbox for each motor, a dramatic cost saving was realized. One of the key aims was to reduce both capital and operating costs, the robot needed to run using less power consumption (Table 2). By using these motors with a field oriented control motor drive, the power consumption, operational noise and maintenance requirements were all reduced as a result.
A comparison of prototype delta robots.
Scale parameters.
A smaller sized robot using these particular motors will have a high accuracy because the encoder resolution and angular error due to torque ripple of the direct drive motors was fixed irrespective of size (Table 3). As the robots positional error was a percentage of the workspace size, a reduction in workspace size resulted in a proportional reduction in the positional error. This was assumed that the motor torque was scaled accordingly to the size of the workspace as the accuracy also depends on the motor torque in relation to the lever arm length due to the direct drive design.
Comparison between prototype and commercial robot.
The cycle time was very much dictated by the selection of motors and controllers and the associated motor torque. A higher motor torque enables higher accuracy and cycle time. Significant cost savings were realized through the use of the selected drive system and just a small reduction in cycle time resulted.
Results and discussion
Since the FBD framework is, on the one hand, the simplest representation of the system and, on the other, perhaps also the most detailed and comprehensive, it makes sense to use this framework as the template for storing relevant machine design and operating and economic data.
From the results of the simulation, it is possible to calculate relevant metrics such as value added, capital velocity and cost per unit produced. For the wine fermentation vessel, the capital cost per liter for major subsystems as well as fabrication and welding is shown in Figure 10(a)), while the cost is shown in Figure 10(b)). Aggregating these costs into an overall cost per liter for the vessel is shown in Figure 11. What these results show first is that the economic size of a fermentation vessel is 5000 L or larger. A substantial penalty is paid for smaller vessels. Second, and perhaps more interestingly, are the individual item cost curves. These show that three items are responsible for the lack of scalability below 5000 L. These are the cost of welding the vessel, the cost of the cooling jacket and the cost of dome pressing. These items become the focus for redesign at lower scales, particularly costs associated with welding, as well as the dome and bottom of the tank. For example, it may be possible to replace these items with similar ones made of different material, such as polyvinyl chloride (PVC). The low scalability of the temperature control jacket is due to the fact that there are no off-the-shelf options at the lower scales, and so this item becomes the driving constraint for scalability.
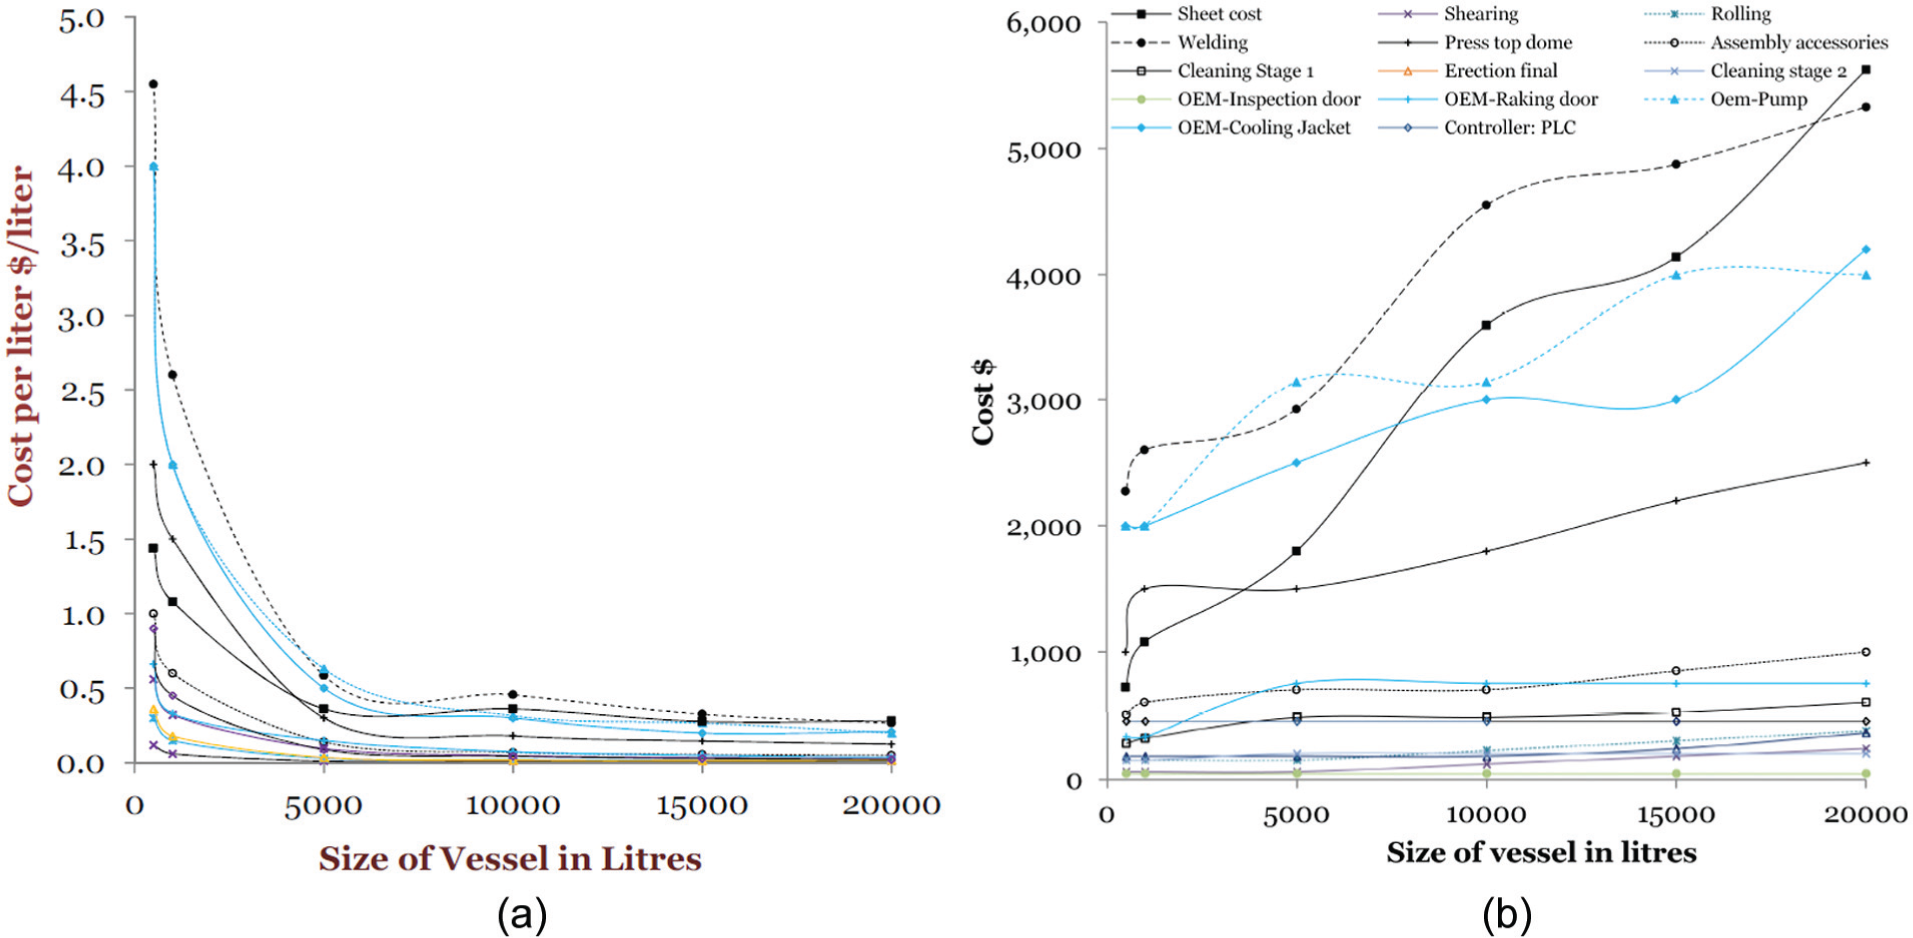
(a) Capital cost expressed as a cost/liter as a function of vessel size (scale) and (b) capital costs as a function of vessel size (scale). The legend for this chart appears in (b)).
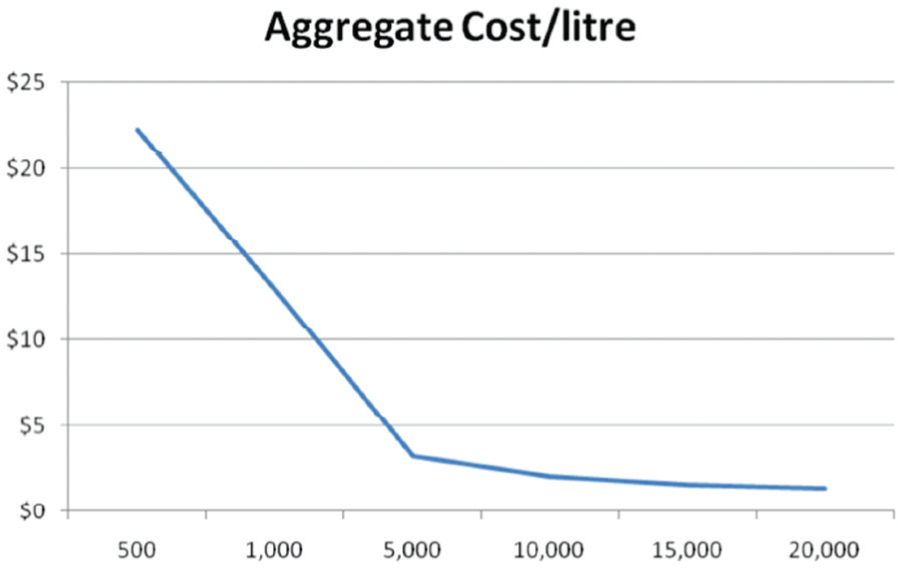
Aggregate cost/liter as a function of vessel size (scale).
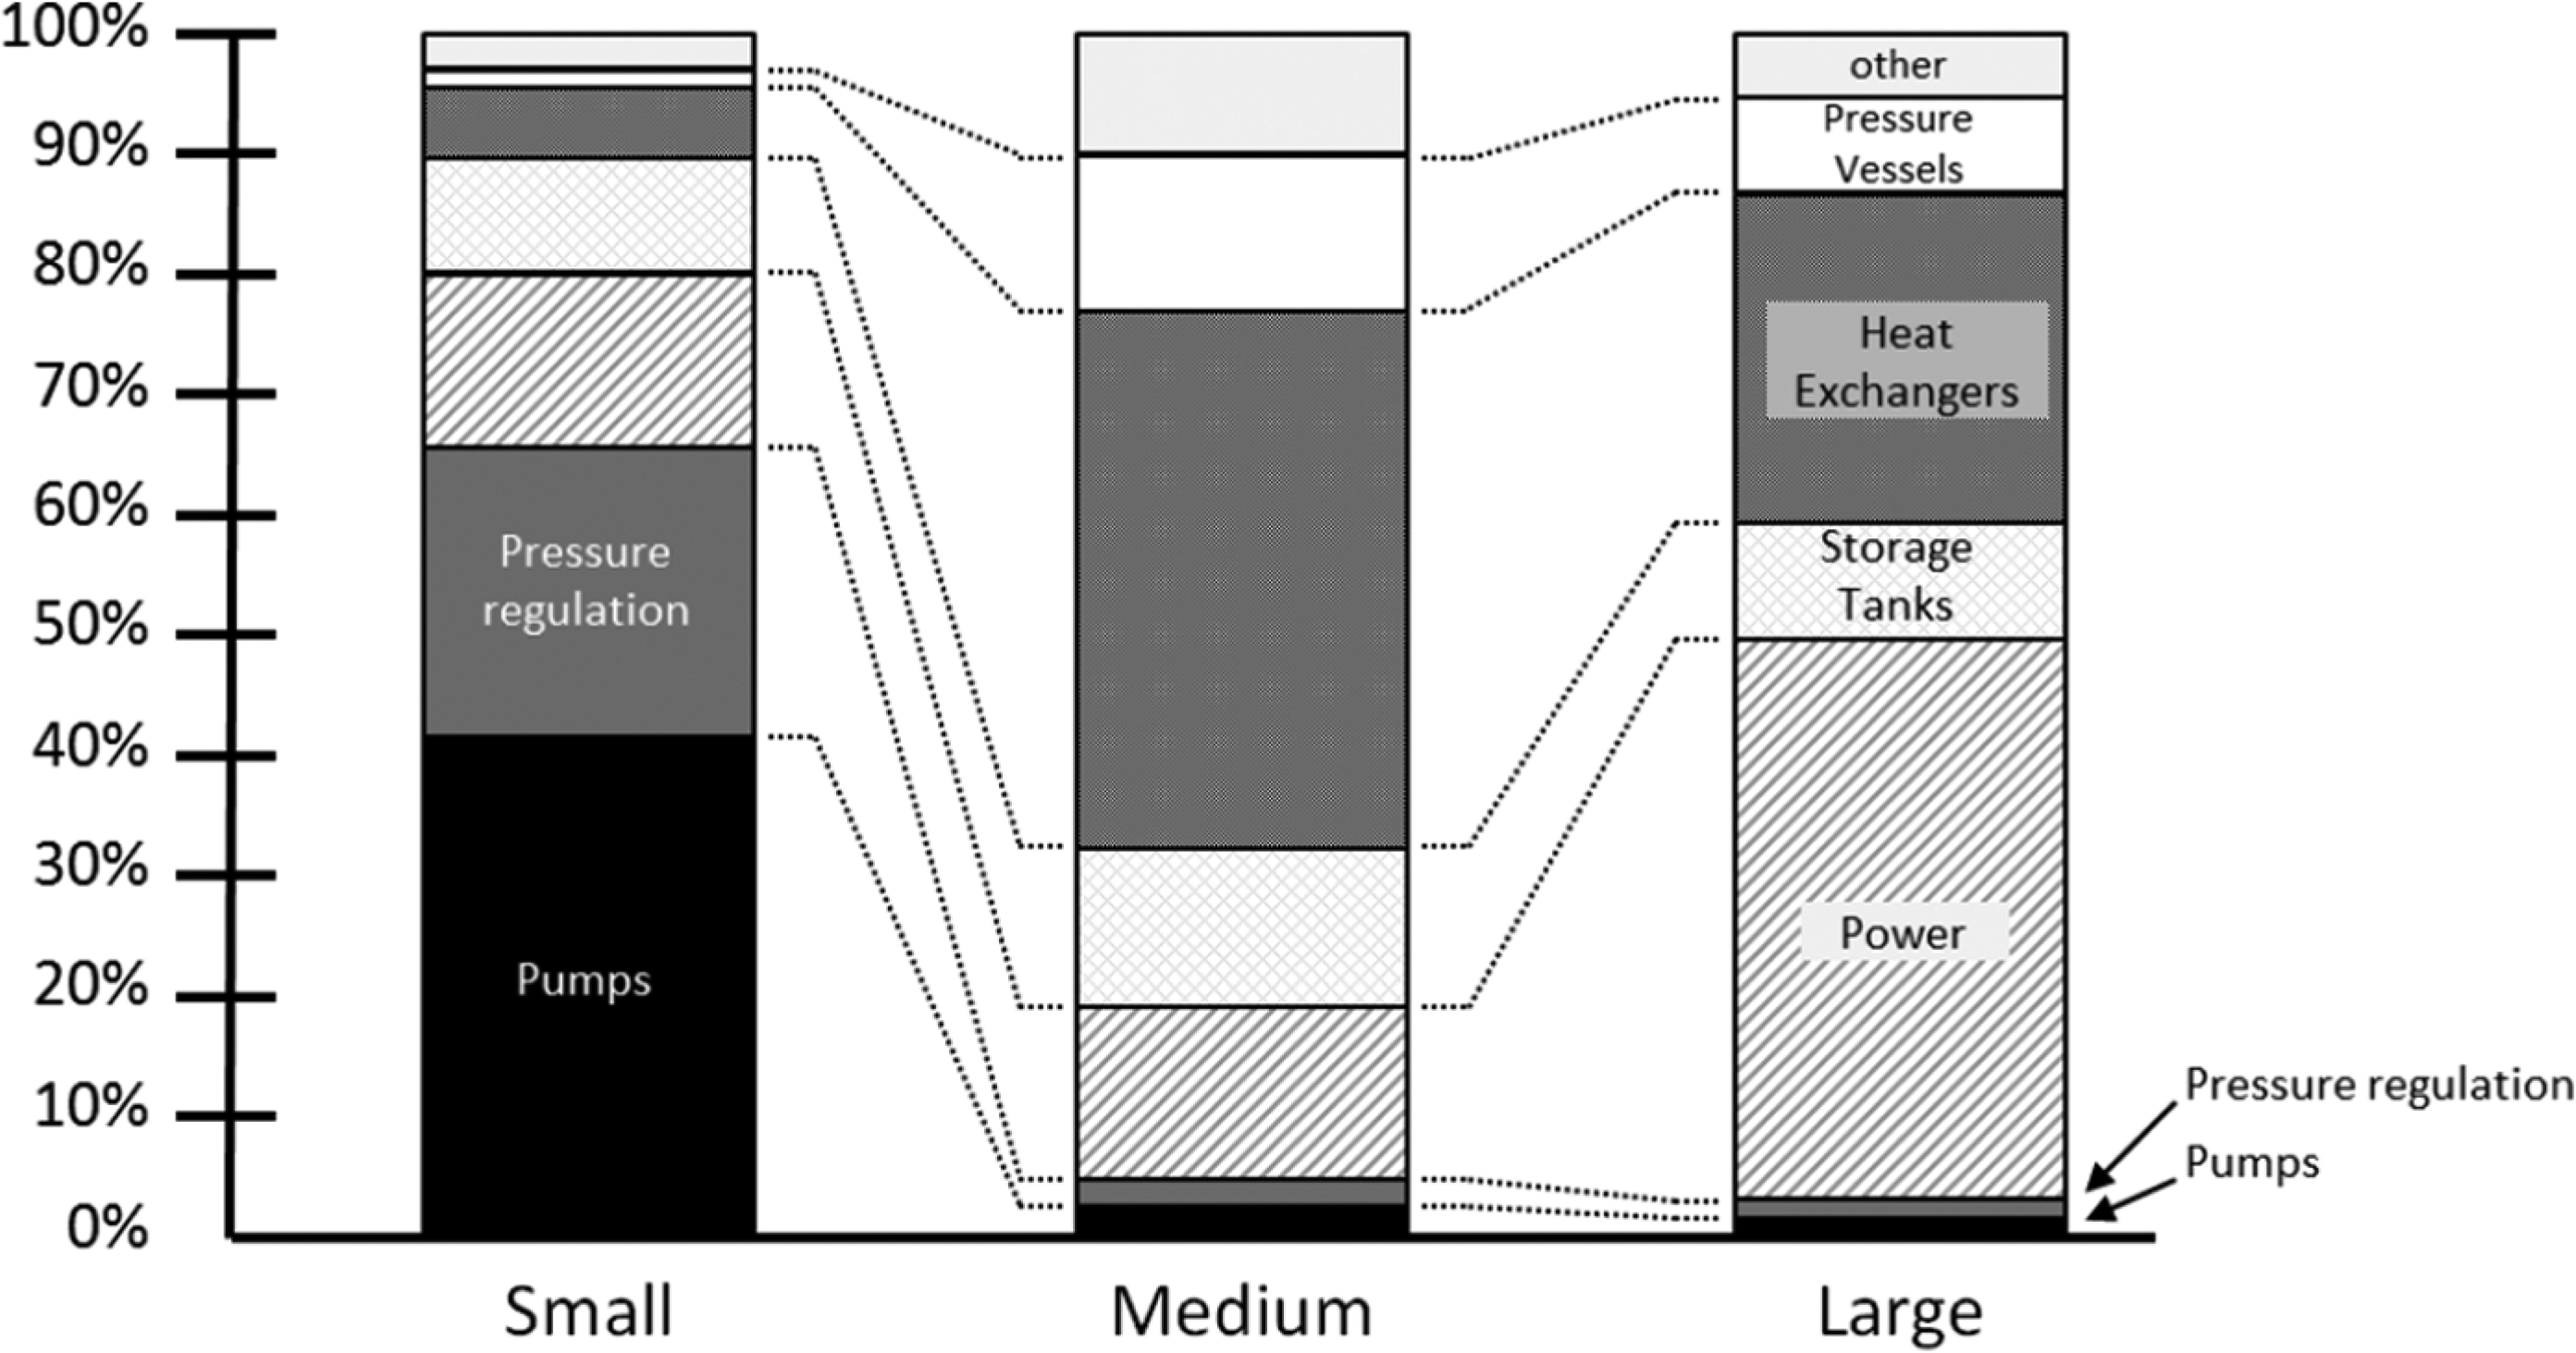
Overall relative cost of major equipment biodiesel plant.
For the biodiesel process, three different scale designs were evaluated using this model, namely, small scale (100 L/day), medium scale (100,000 L/day) and large scale (1 × 10⁶ L/day). The simulation model indicates that the heat load of the system is an order of magnitude larger at each scale than the pressure (or pumping) load. Therefore, the thermal equipment such as heat exchangers rather than pressure equipment influence the overall efficiency and energy consumption of the process at larger scales. Thermal loads are therefore likely to place a limiting constraint on the maximum size of the process. On the smaller end of the scale, pumps and back pressure regulators are the major cost drivers as there is a distinct rise in the cost/performance ratio for pumps that are smaller than off-the-shelf industrial standard sizes. The overall relative costs of major equipment items are shown in Figure 12.
This analysis has shown that a small-scale biodiesel process suffers efficiency losses as a result of non-optimal energy balances and equipment constraints. By adapting the context in which the process operates, the effect of some of these inefficiencies can be reduced. For example, the small-scale process can be operated as a cogeneration plant that operates in a household or small business that requires electricity, heat and fuel. By operating the process on a subsistence basis, the operating cost of the process is reduced and the capital cost now becomes the main economic driver. Overall, thermal efficiency is improved as the waste heat can be used to either warm buildings or provide hot water or to run vapour-absorption refrigeration cycles to provide air conditioning. The fuel produced can be used locally or to produce electricity. The medium-scale plant has been designed as a mobile plant that can be transported, to say cooperatives of farmers or local businesses to process stockpiled oil into biodiesel. At this scale, standard industrial off-the-shelf equipment items can be used resulting in a lower capital cost per liter of fuel produced and increased thermal efficiency. The large-scale system has been designed as a chemical plant and can co-exist as a small power plant. At this scale, the availability of feedstock may be an issue and this may in fact limit the feasibility of larger scale process.
The costs of operating the processes in their operating context have been evaluated and the value added for each scale can be compared against the capital velocity. Table 4 gives the results for each design. The magnitude of the scale factor
Functional requirements and associated scalability factors across a range of plant scales.
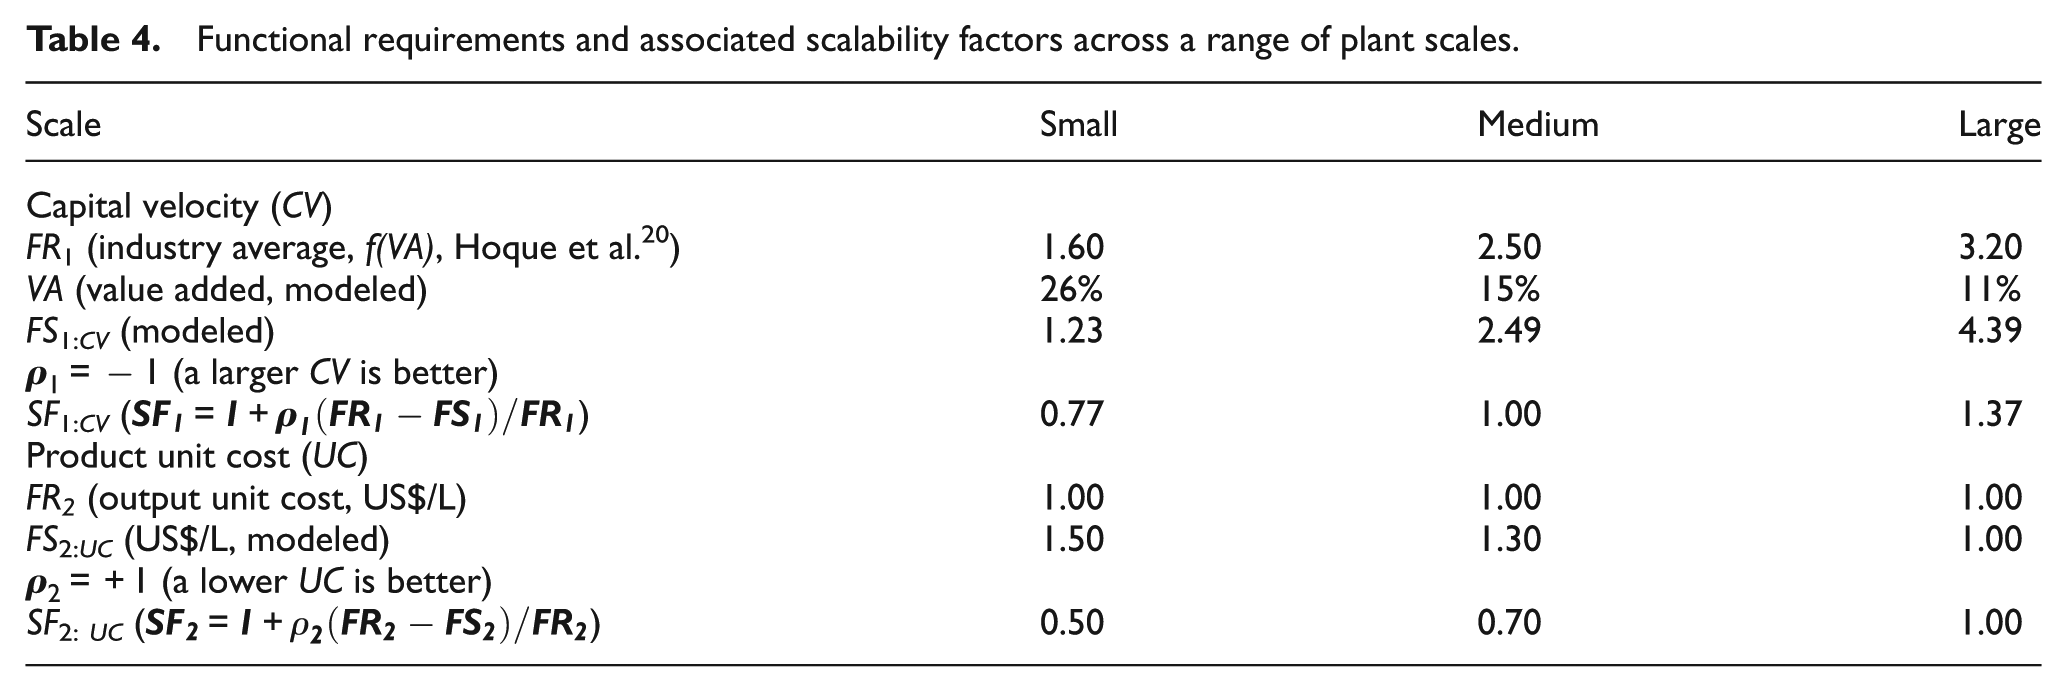
The results show that the large-scale biodiesel process can indeed approach benchmark economic efficiencies, but also that the small- and medium-scale versions are comparable to overall industry averages in terms of capital efficiency (industry averages are shown in brackets). This is provided that the operating context is adapted to each design. This is an important conclusion. Significantly, the economic feasibility analysis presented here does not take into account any social or environmental costs but is capable of doing so. The purpose of the model is to validate the feasibility on purely competitive economic indicators in the first instance. This is what appropriate technology needs to be able to demonstrate where it is to be successful.
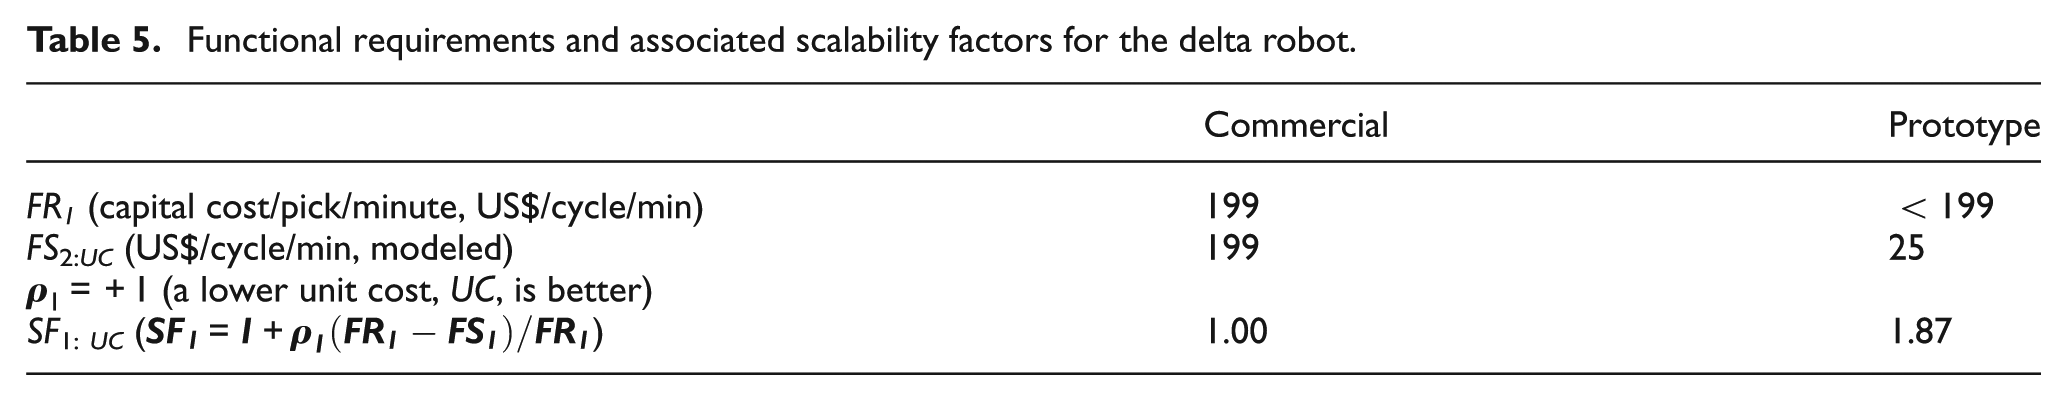
The resulting scalability factor for the delta robot design is shown in Table 5. The main functional requirement is expressed as investment cost in US$ per pick operation per minute. For the commercial robot this amounted to AUD$ 199 and for the prototype design, as tested, this came to AUD$ 25, a significant improvement in the performance to cost ratio.
Functional requirements and associated scalability factors for the delta robot.
Even though the design process consists of nine, seemingly linear and consecutive steps, it does embody the philosophy of the V-model design theory, in the sense that each design decision, at the detail as well as integration level, is simulated, evaluated and consequently adapted or manipulated together with the operating context to ensure that functional requirements are met.
The methodology proposed is both top-down and bottom-up. The design will always be driven by the set of functional requirements, whereas the design comprised an integration of COTS design elements, which is tested in conjunction with a specified operating context within the simulation loop. The relationship or DSM [
The designer has three distinct sets of degrees of freedom: the set of functional specifications, aligned with the set of functional requirements; the choice of COTS elements; and the specification of the operating context. The designer then has to decide to either select alternative elements, or relax certain functional specifications (requirements), or modify the operating context, or any combination of these. This is an interactive process and requires an interdisciplinary approach.
Perhaps the most complex step within this methodology is the simulation of the system, once the design has been specified and the design variables are identified. The nature of this step is quite flexible and depends to a large extent on the complexity and nature of the set of functional requirements. In the case of the biodiesel process, the entire design and process was modeled in MATLAB/Simulink because the [
The effort required in implementing and executing this methodology is therefore related to the complexity of the design itself, perhaps not surprisingly. The simulation step is the most important activity within this methodology and the benefit of this approach is that it reduces the amount of analytical design and evaluation work substantially. This is one of the important outcomes of this research.
Conclusion
There has been a dramatic decrease in the cost of standard industrial equipment including motors, control systems, robotics and sensor and actuator technologies over the last few decades. This opens the door for the design of low cost machinery and appropriate technology, especially for SMEs. This together with the reluctance in the use of structured design methodologies in many organizations, especially SMEs makes it imperative that user friendly and practical methods are developed that they can use in the design of modular, scaled down machinery with off-the-shelf components.
The proposed methodology addresses these issues by setting out nine basic steps, consistent with best practice design theory including QFD, V-model and axiomatic design. It has been applied to a complex biodiesel process and it demonstrated a successful outcome from a technical as well as an economic point of view.
Research will continue on developing improved and efficient methods for characterizing modular design elements as well as developing improved indices for calculating and ranking relationship parameters in the DSM.
Footnotes
Appendix 1
Declaration of conflicting interests
The author(s) declared no potential conflicts of interest with respect to the research, authorship and/or publication of this article.
Funding
The author(s) received no financial support for the research, authorship, and/or publication of this article.