
Abstract
Given the challenges in increasing energy prices and environmental issues, energy efficiency is becoming a major concern in manufacturing industries. To reduce energy consumption, manufacturing operations need to develop energy efficient techniques. This development will also help reduce greenhouse gas emissions and production costs. The aim of this research is to create a simulation methodology and to investigate the modelling of thermal and energy management (called e-ProMan) across manufacturing site. Using simulation, the ‘e-ProMan’ system generates a real-time, virtual and user-friendly factory model. A ‘Big Data’ approach is taken in which a large set of data are acquired from both inside and outside the factory in order to analyse the correlation between work flow, data flow and energy flow to provide real-time decision making. In particular, four data sources are gathered including weather forecast, temperature and humidity sensors, machine energy consumption and production process and scheduling. The ‘e-ProMan’ system is specifically designed to suit manufacturing operations of small and medium sizes to complement limited budget and lower resources especially in data gathering infrastructures.
Introduction
Recently, manufacturing industries have been confronted with increasing energy prices and environmental issues.1,2 Energy is now one of the major costs in manufacturing and is responsible for a significant proportion of CO2 emissions in manufacturing.1,3 In general, energy costs account for up to 60% of total manufacturing costs; 4 for instance, in cement and aluminium manufacturing, energy represents about 30% and 40% of the production costs, respectively. 3 Electrical energy is the main energy used for equipment and machines.5,6 The International Energy Agency (IEA) predicts that the world’s energy consumption will rise by more than 7% per annum by 2035. 6 The development of energy efficiency techniques in manufacturing systems is therefore crucial to reduce energy consumption, CO2 emissions and also production costs.7–10
There are many ways to make energy efficient, such as using applications, switching off lights, pulling out plugs, optimising machine tools and minimising energy consumption of heating, ventilation and air conditioning (HVAC) systems.9,11 Increased energy efficiency can be achieved through energy management of HVAC. 11 In all manufacturing applications, facility HVAC systems account for around half of non-process energy consumption by end use. 11 With such a large amount of energy consumption attributed to HVAC, there is still room for improving efficiency and reducing energy consumption, particularly through the model-based smart energy-management system supported by real-time ‘Big Data’, and the corresponding predictive control and optimisation of the HVAC system. 12 Energy models working with large datasets can help understanding the evolution of consumption patterns, predicting future energy trends and providing the basis for optimising the performance of large-scale manufacturing systems. 13
This article presents a simulation-based approach to modelling thermal and energy management, which considers the whole manufacturing system based on thermal and energy consumption and its implementation perspectives against the requirements of the energy-management system for production systems (e-ProMan) at manufacturing small and medium enterprises (SMEs) in particular. The approach is to use conventional equipment and tools that can be integrated in an industrial-feasible manner so as to give the flexibility and scalability for SMEs companies. The state-of-art for energy consumption reduction strategies, energy-saving methods and thermal management can be thus thoroughly pursued by developing and using performance measurement tools and optimal implementation. This research takes place in Advance Manufacturing Laboratory, Brunel University, London. Then, it would be applied into Precision Technologies Group (PTG) Holroyd Precision Company, which is a SMEs manufacturer in UK.
Big Data within the shopfloor manufacturing environment
The term ‘Big Data’ refer to high-volume, high-velocity and/or high-variety information assets, which tend to double every 18 months and which need new processing system in order to provide enhanced decision making. 14 The data include government data holdings, company databases, sensor networks and public profiles on social networking sites that can be gathered from numerous sources. 15
In manufacturing, Big Data can aid productivity, product and process discovery, and policy-making. 15 Extremely useful information can be provided by Big Data. These data allow manufacturers to understand their current situation and to learn more about their workforce. 15 This information is essential in increasing efficiency and productivity. 15 In this research, the chosen Big Data are divided into four sections, which are weather forecast, temperature sensors, machine energy consumption and production processes and production schedules.
Machine energy consumption
The Department of Energy (DOE) stated that machinery consumed 204 trillion Btu of energy in 2012, which is considered as significant amount of energy. 11 In manufacturing processes, there are a variety of machines which consume different amounts of energy and may not necessarily work simultaneously. 16 Some of them are set as idle and some may work half load; hence, this complexity can cause machine energy consumption to become big complex data.16–20 Therefore, energy usages of machines need to be clearly illustrated in order to find solutions to reduce energy consumption.9,16–18
Production processes and production schedules
According to manufacturing complexity research, production planning and control is one of the main complexities in industrial manufacturing. 21 This issue crucially deals with a variety of products and uncertainty in customers’ demand. 21 This information is one area of big manufacturing data that needs to be managed.
In this research, Arena Simulation programme is used to demonstrate production system including production processes and production schedules in order to illustrate energy flow, data flow and work flow, and to calculate energy consumption and CO2 emissions in each machine and process.
Temperature variation and control
Real-time temperature in a manufacturing plant also creates one of the big datasets that constantly changes due to the weather. Temperature sensors are installed to acquire surrounding temperature in a manufacturing facility. In different areas of the facility, temperatures can be very different. In this research, three-dimensional temperature sensor mapping data are illustrated with the linkage between the temperature sensors and LabVIEW programme.
Forecastive control using climate data
To establish an accurate forecastive control system, real-time weather forecast data must be acquired. The more climate data are frequently updated, the more precise forecastive data are provided. 22 There are a number of commercial weather forecast websites that offer real-time climate data, such as Met Office, British Broadcasting Corporation (BBC) Weather, Metcheck, AccuWeather.com and Weather Channel. Numerical weather prediction (NWP) model is a weather prediction system that uses computer simulation. It is generally considered as the most reliable climate prediction system. 22 This research obtains predictive weather data from Met Office because the Met Office is the UK’s meteorological specialist, who uses NWP model for prediction.
Development of the e-ProMan system
The e-ProMan system demonstrates real-time, virtual friendly factory displays using computer-aided design (CAD) models. This is a predictive system that functions by obtaining the input from the big manufacturing data and the factory, and analysing the correlation of multi-dimensional star, which are energy flow, data flow and work flow chart in order to make accurate real-time decision-making possible (based on good investigation, modelling and simulation which has established the proper relationships) as shown in Figure 1.
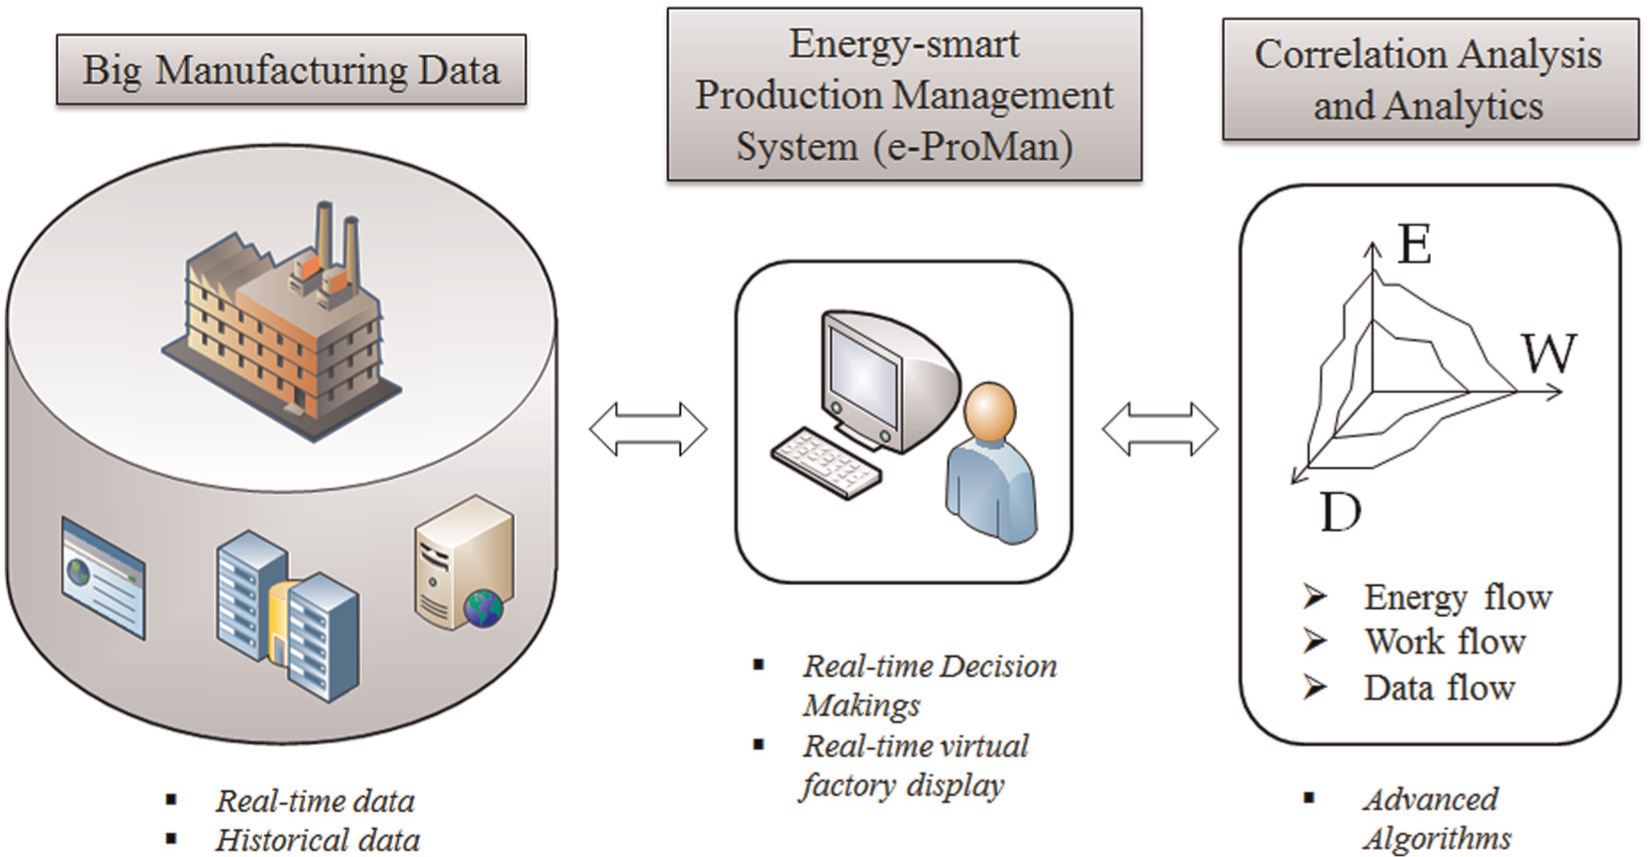
Architecture of the Energy-smart Production Management system (e-ProMan).
The big manufacturing data include weather forecast, temperature sensors, production processes and production schedules and energy consumption from machines (e.g. computer numerical control (CNC) machines and HVAC system), which consist of both historical and real-time data. In order to gather the big manufacturing data, LabVIEW and Arena Simulation programmes are used as analysis and implementation tools. The e-ProMan system (1) monitors temperature in manufacturing facility with temperature sensors, (2) acquires production process and production schedule data via Arena Simulation programme and (3) measures energy consumption of machines using power logger equipment.
This information is used to provide a thorough understanding of the relationship among the energy flow, data flow and work flow in the manufacturing environment. The development of a control system will proceed from this understanding, followed by optimisation in order to minimise energy usage and greenhouse gas (GHG) emissions.
Implementation perspectives
LabVIEW programmes are widely used by scientists and engineers for virtual measurement and virtual friendly display. 23 In addition, Arena Simulation is considered as one of the best simulation programmes that can model and simulate complex systems. 24 This research uses simulation methods to identify the feasibility of predictive control in manufacturing energy-management system including energy flow, data flow and work flow.
Virtual workshop and forecastive control
In this experiment, a LabVIEW programme is run to implement energy-management system in typical manufacturing plant including data acquisition and virtual display. Arena Simulation programme is used to simulate manufacturing processes and schedules. The e-ProMan system interfaces consist of five main panels, which are machine energy measurement, Arena Simulation in manufacturing production process, three-dimensional temperature sensors mapping in manufacturing plant, weather forecast and HVAC system controller.
The e-ProMan system starts from acquiring four Big Data sources (machine energy consumption, production processes and production schedules, temperature in manufacturing plant and climate prediction consisting of historical and real-time data). This programme runs continuously and displays the results every second.
HAVC
The HAVC system controller part of the e-ProMan system needs to be set to provide a comfortable temperature in a workplace. According to health, safety and welfare regulation 1992, the regulations stated The temperature of indoor workplaces should be reasonable. The approved code of practice defines a reasonable temperature indoors as being normally at least 16 °C unless the work involves severe physical work in which case the temperature should be at least 13 °C.
25
Previous research found that the ideal temperature in light manufacturing (laboratories) needs to be set at a range between 16 °C and 19 °C in order to provide the best working condition. 12
The logical simulation is based on mathematical formula and C language using LabVIEW programme. The controller obtains weather prediction data from Met Office database and uses them to control the HVAC system. This system controls the workshop temperature by comparing the actual and historical temperature in the workshop and weather prediction data in the next hour period from the forecast website. If the temperature in the workshop is higher than 19 °C or lower than 16 °C, the heating and air conditioning system will operate. When the temperature is in the range between 16 °C and 19 °C, the HVAC system will turn off in order to reduce the consumption of energy.
The simulation system is run to provide a comfortable temperature in the manufacturing plant and also to define over energy usage results continuously. This HVAC controller is not only used to control environmental temperature but also as a forecasted controller in nearly future considering weather forecast and current temperature, which could minimise the energy usage. For example, if the forecast says the temperature in 6 h is going to be colder 5°, then the HVAC would stop cooling and prepare heating up the temperature.
Energy consumption
According to the differential temperature of inside and outside, HVAC system requires energy to heat and cool the environment temperature in the shopfloor. The energy usage calculation of HVAC system is represented as
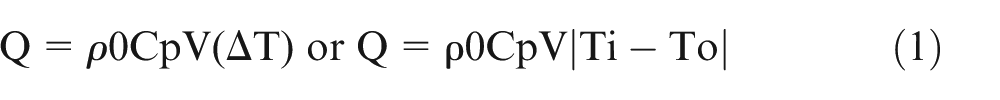
where Q is energy used to maintain the building temperature, ρ0 is the density of outside air, Cp is the specific heat of air, V is the volumetric flow rate of air (volume of air change in 1 h), Ti is the temperature outside the building and To is the temperature inside the building. 15 The general of specific heat of air is 1 kJ/kg °C at normal atmospheric pressure, and standard value of air density is 1.2754 kg/m3. 26
Carbon emission
The carbon footprint of a manufacturing system can be evaluated by using the equation of carbon emission signature (CES™). 26 Thus, the carbon emitted (CE) can be calculated by multiplying energy consumed (EC) to CES as shown in the following
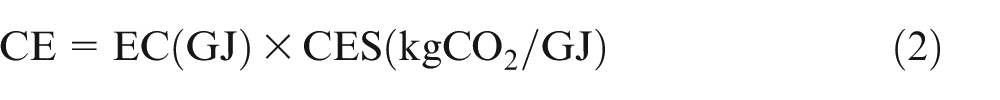
Moreover, there can be more than one primary energy source than an electrical grid, which might include coal, natural gas, petroleum, biofuel, hydro, solar, wind, geothermal, earth, wave and tidal. Each of these can be represented as a function: C (coal), NG (natural gas), P (petroleum), B (biofuel), H (hydro), S (solar), W (wind), G (geothermal), E (earth), W (wave) and T (tidal). The CES can be calculated as the summary of fractions of the primary sources multiplied by the conversion efficiency (η) for each of the primary energy source as defined as follows 26

The coefficients of coal (C), NG and petroleum (P) are 112, 49 and 66, respectively; they are the kilograms of carbon emitted per gigajoule of heat released and are an inevitable fate of combustion in each case. The conversion efficiency (η) = 0.34 is common and is therefore applied in this research. 27
Correlation analysis and analytics
Temperature versus quality
In a manufacturing environment, controlling the temperature is necessary for workers and machines.12,25 Because of the too high or/and too low temperature, workers and equipment could get into poor working conditions and this would lead to lower quality of work.12,25 Hence, the workshop temperature needs to be controlled between 16 °C and 19 °C in order to create a comfortable working environment.
Energy flow versus work flow
Energy is mostly consumed during production processes in manufacturing3,6 The more manufacturing processes run, the more energy is consumed; thus, energy flow is positively correlated with work flow. Unbalanced work load would lead to extra energy usage. 9 For instance, if the production operates overloads of work, machines and equipment will need more energy to manufacture products. 9 If low/empty work load is provided for the operation, the manufacturing may face a standing-by situation which causes energy wastage.18,19 During machine idling, a significant amount of energy is used. 28 Hence, providing a flexible job shop schedule for manufacturing processes is a crucial aspect that can help minimise energy costs.16–19
Optimisation
With regard to energy flow, data flow and work flow, this predictive system proceeds by analysing their multi-dimensional star correlation in order to minimise energy consumption and balance the work flow. This system could make accurate real-time decisions based on the good investigation, modelling and simulation which have established the proper relationships.
System design and user interface
e-ProMan system’s user interface consists of four main elements, which are machine energy measurement, temperature and forecast control on HVAC, three-dimensional temperature sensor mapping in manufacturing plant and HVAC system controller, as shown in Figure 2. First, the power logger experiment is run to measure the energy consumption from a (CNC) machine when it is milling in specific material, job time and tools. It gives results of voltage, current and power and is linked to the LabVIEW programme. However, the power logger experiment is not currently being monitored. The weather forecast user interface is used to acquire the current weather and weather forecast from the chosen weather website, which shows temperature, humidity, wind speed, wind direction and so on for the next 5-day period. Next, the three-dimensional sensor mapping illustrates the temperature flows in each area in the lab where the temperatures are different. Particularly, the red colour indicates hot areas and the blue colour indicates cold areas. As shown in Figure 2, the upper area has higher temperature than the lower ground since hot air travels upwards from the ground. Finally, the controller consists of HVAC temperature and fan speed. The HVAC system uses a simple logic to choose between heating and cooling by comparing three-dimensional factory shopfloor and outside temperature. According to the climate predictions in nearly future, this system can be turn on and off automatically in order to minimise energy consumption.
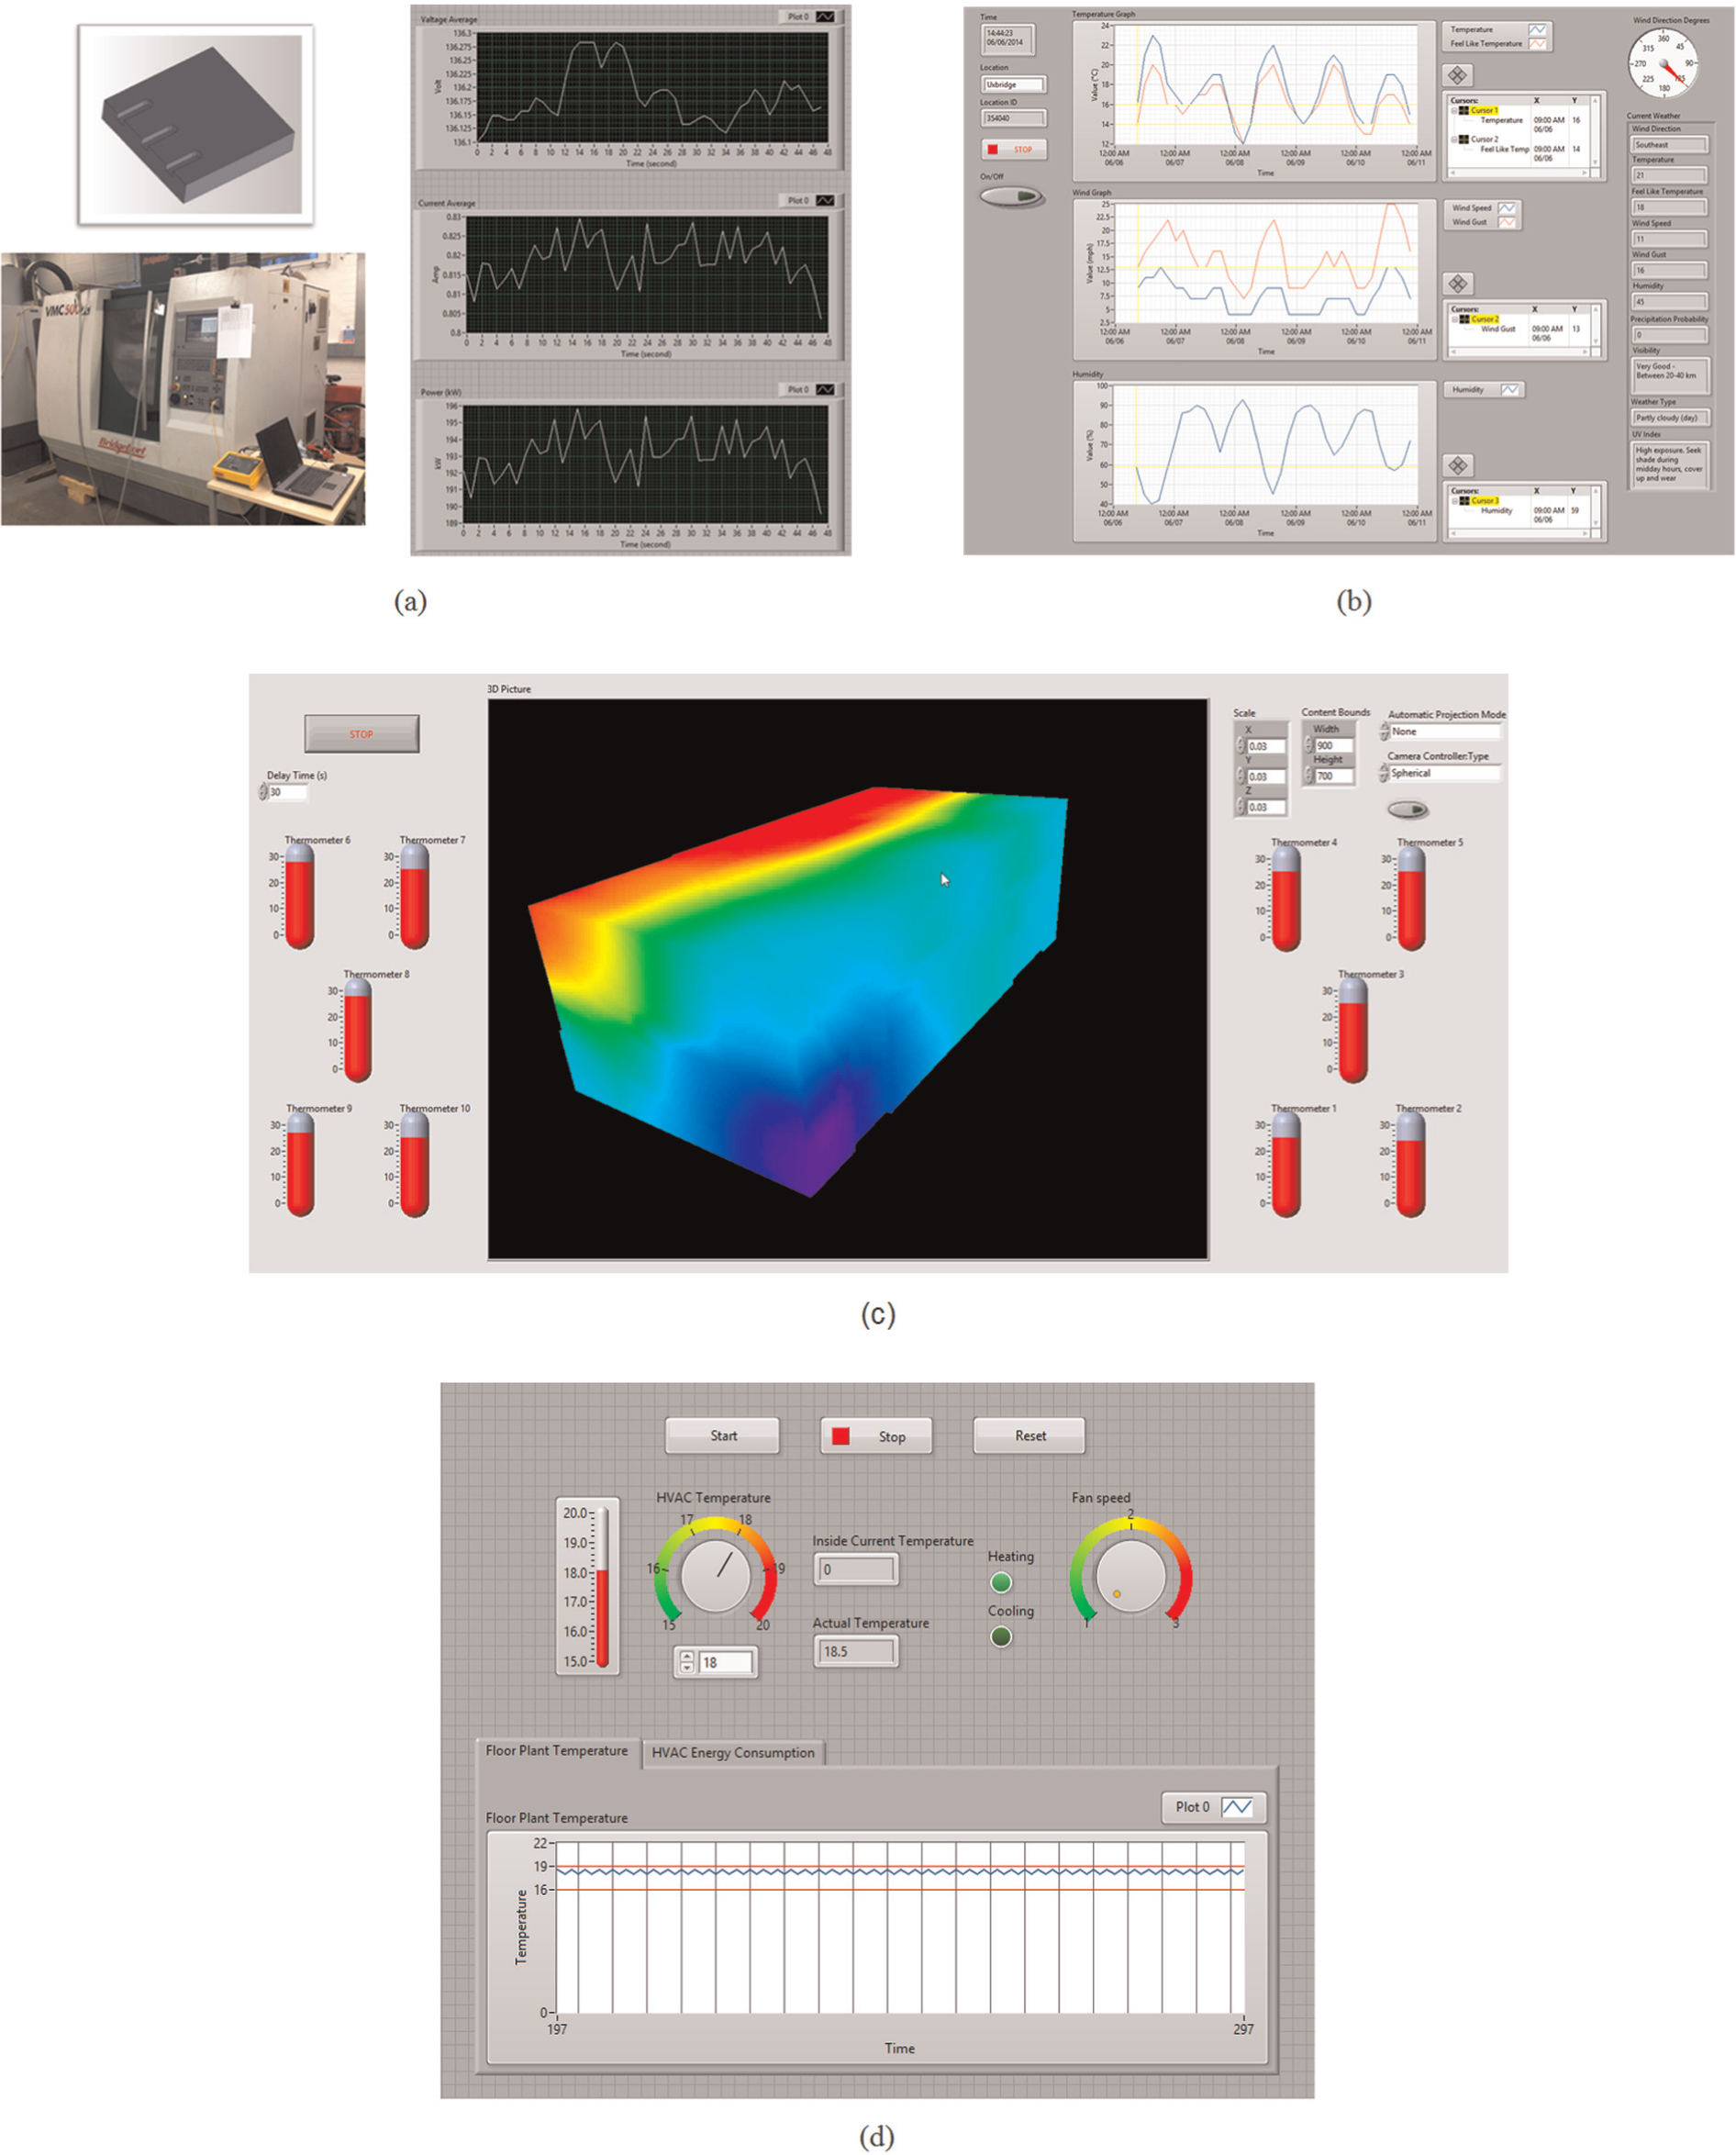
e-ProMan system: (a) machine energy measurement, (b) temperature and forecast control on HVAC, (c) three-dimensional temperature sensor mapping in manufacturing plant and (d) HVAC system controller.
Application perspectives and preliminary results
The thermal generation and consumption are considered in this simulation. The example experiment shown was run at 1 p.m. in Advance Manufacturing Laboratory, Brunel University, London. The results of e-ProMan system consist of two parts. These were actual temperature at shopfloor and energy consumption of HVAC, as shown in Figures 3 and 4, respectively. Figure 3 shows the floor plant temperature over the period of time. The workshop temperature started at approximately 12 °C and increased to 17 °C by heating system. Then, peaks and valleys were consistent between 16 °C and 19 °C across different time scales by controlling the HVAC system. Total energy consumption was 130.7 kW during the time period, as shown in Figure 4. Clearly, more energy was consumed at the beginning because the HVAC system needed a large amount of energy to increase the overall ambient temperature in the shopfloor. The system consumed around 5.7 kW/s until the temperature rose to 17 °C. Then, the energy consumption dropped below 0.7 kW/s in order to keep surrounded temperature between 16 °C and 19 °C by continuously turning on and off HVAC system.
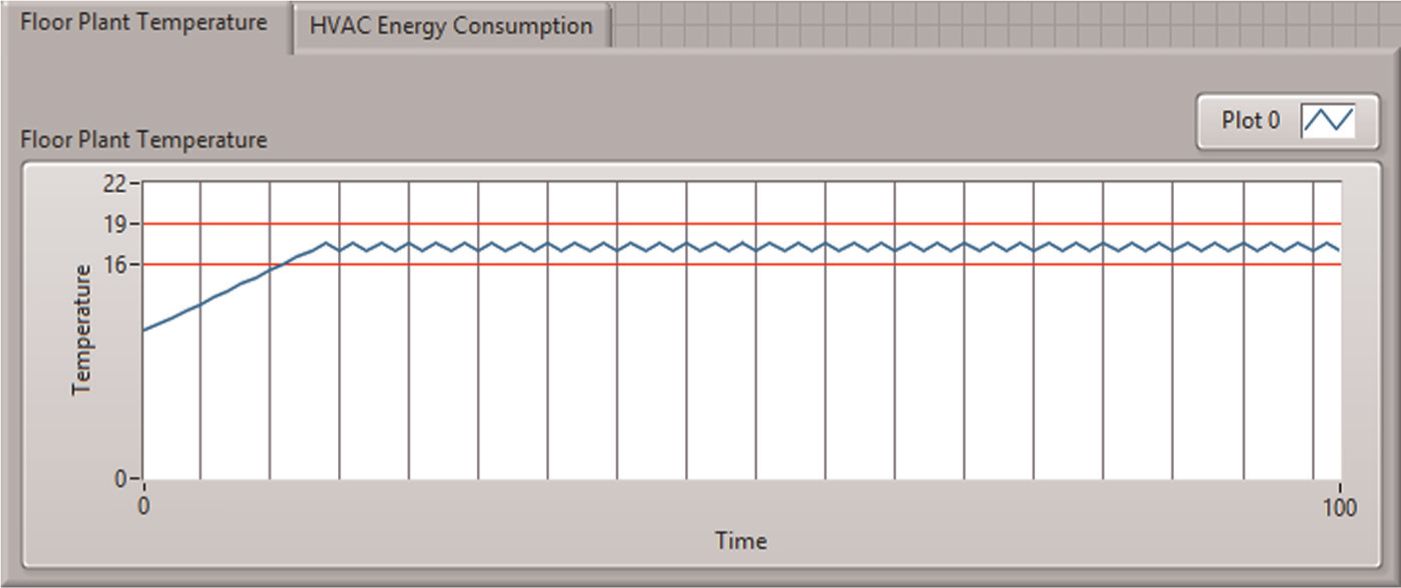
Result of floor plant temperature.
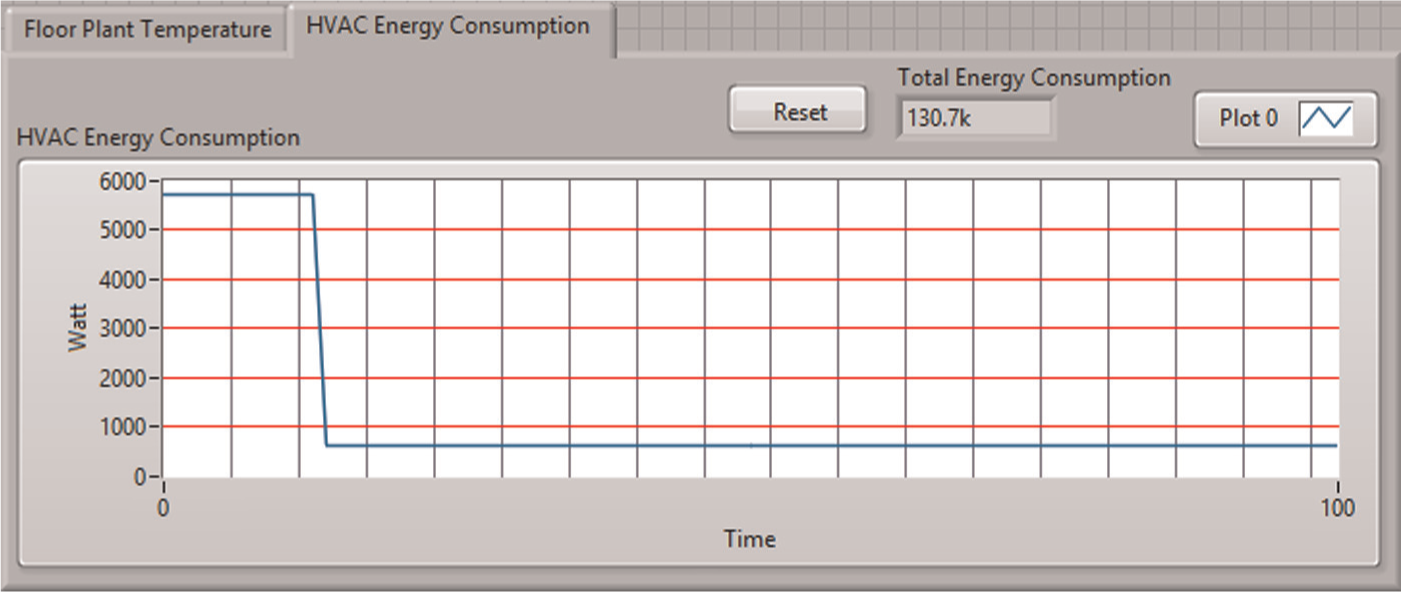
Result of HVAC energy consumption.
Conclusion
In this article, a simulation-based approach is presented to develop thermal and energy-management systems applied to SME manufacturing environments, supported by real-time ‘Big Data’, and the corresponding predictive control and optimisation analytics. A prototype system – e-ProMan is developed, which can enhance efficiency and reliability of energy management by intelligently managing a variety of machines, processes and schedules. Moreover, the approach and associated system (e-ProMan) can be used to control, optimise and manage the use of energy on manufacturing shopfloors by real-time measurement and analysis, so to understand overall manufacturing system flows including energy flow, data flow and work flow. This research will further focus on work flow in the manufacturing system and explore the quantitative relationships among the three flows in order to develop more complex and real manufacturing site–based models for validation purposes.
Footnotes
Acknowledgements
The authors would like to acknowledge for the support of the EU 7th Framework ICT Programme under EuroEnergest project (grant agreement number: 288102).
Declaration of conflicting interests
The authors declare that there is no conflict of interest.
Funding
This work was supported by the EU 7th Framework ICT Programme under EuroEnergest project (grant agreement number: 288102).