
Abstract
Determination of accurate limit of cutting condition in order to obtain broken chips for various chip breaker geometries is essential to improve the machinability. This work presents a hybrid model based on the ratio of broken chip radius to the initial radius of chip to predict the type of chip regarding the characteristics of a chip breaker geometry and cutting parameters. An analytical geometrical model was developed to calculate the initial radius of chip. After running experimental tests for four types of chip breaker geometries and calculation of their chip ratio, type of chips and tool–chip contact were selected as two criteria for classifying chip ratio into three limits representing usable, acceptable, and unacceptable chips. Finally, the normalized data were used to train a neural network model to predict the type of chip which was verified by experiments carried out on a new chip breaker geometry. The trained network could predict the type of chip accurately by providing the geometrical details of the chip breaker and cutting parameters for the network.
Introduction
The presence of undisturbed chip formation in a metal cutting process is directly related to process efficiency, which is a vital issue in the automated production systems. In the turning operation, proper chip flow resulting broken chip is a significant parameter, which affects surface quality, tool life and machine power consumption. 1 Therefore, chip breakers play an important role in obtaining the desired chip size and shape and, consequently, maximizing productivity in computer control systems. The chip breakers can break chips successfully if the efficient range of cutting parameters are carefully selected, as it called the effective range. Accordingly, investigation on formation and breakage of chips for a particular chip breaker geometry is necessary in order to predict the effect of cutting parameters and their desirable range. 2
Trial and error is one the most common methods for assigning the effective cutting range of chip breaker geometries. However, other methods were used in recent years to predict and assign this range which are less time-consuming and more economical. Seah et al. 3 presented a chip breakage criterion based on the ratio of chip strain to the work material failure strain which was studied on chip formation in oblique cutting and verified with experimental tests. The ratio greater than 1 was recognized as the broken chip.
In another research, Choi and Lee 4 developed an optimized chip breaker geometry using the model presented by Seah and Taguchi method, in which this design could be effective in a wider range of cutting parameters. Zhou et al. 5 presented an analytical study on chip breakage cutting condition limits using grooved cutting tools which resulted in the development of a web-based prediction system. Mesquita et al. 6 carried out an experimental study to find out the effect of cutting speed on the chip breakage. They claimed that the cutting range presented by tool manufacture catalog will be limited if the cutting speed increases, while cutting speed effect is more significant at lower cutting feed rates.
In a numerical analysis, Zebala and Slodki 7 used a high-speed camera to verify chip shapes and its formation mechanism with the ones predicted by finite element analysis (FEA). It was concluded that chip will break in the desired form if it contacts with back wall of chip breaker during its formation and flow. Kim et al. 8 studied geometric characteristic of some commercial grooved chip breaker using a neural network based on back propagation algorithm. Depth of cut, land, breadth and cutting edge radius were recognized as the most effective variables in the chip formation. Hence, a method was developed to evaluate the tool performance limit, which helps in the selection of available tools. However, their judgment for desirability of a chip was done only based on the shape of chips, and neither a measurement method nor a criterion was defined. Moreover, their experiments carried out with insufficient geometrical variables in the fixed cutting parameters caused that some important factors in geometric aspects and cutting conditions were overlooked.
Although these attempts have been made to predict the effect of chip breaker geometries and cutting conditions, the presence of a model that is able to predict the effective cutting range and the type of chips (not only broken and unbroken) for a chip breaker considering all geometric characteristics and cutting conditions is still lacking. Therefore, a hybrid model consisting analytical and empirical (neural network) approaches was developed in this study to achieve the objectives mentioned above.
Theoretical and experimental work
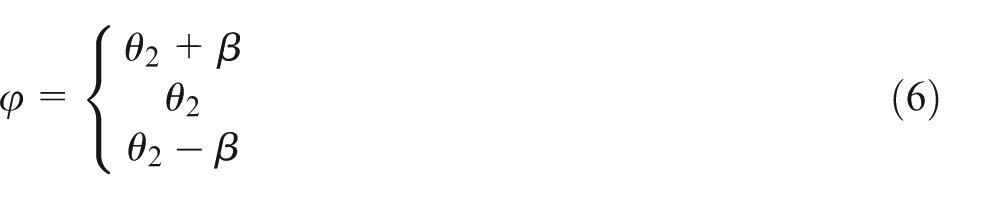
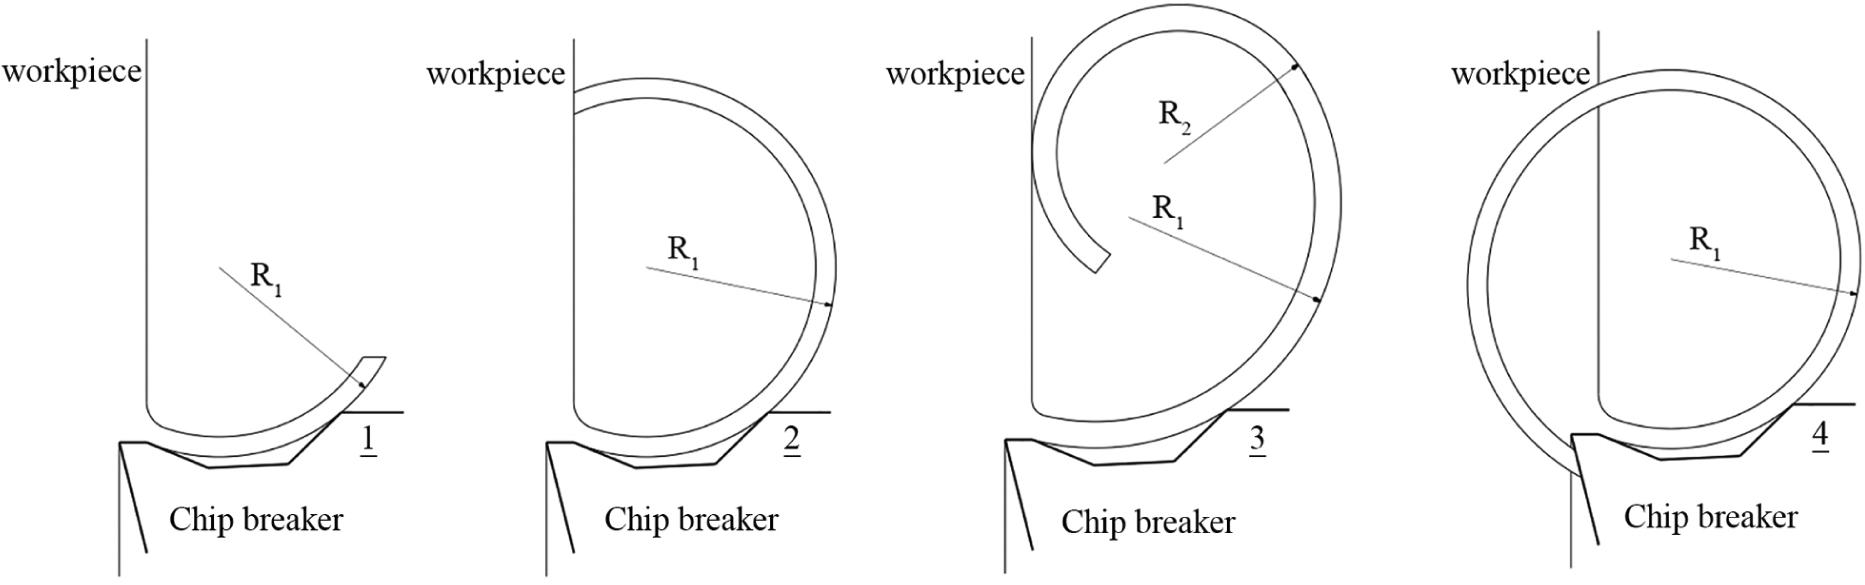
Chip curling can be divided into natural and forced curling. The first one will occur when the chip leaves the rake face without touching any obstacle, while the second condition will occur when the chip contacts with obstacles such as a chip breaker, a face of the tool or the workpiece. 9 Accordingly, the chip continues its natural curling when feed rate is smaller than land length, and the tool acts like a tool without chip breaker (Figure 1(a)).10,11 Chip tends to enter into the chip breaker groove with the increase in feed rate. However, it will not meet the back wall surface if the feed rate (uncut chip thickness) does not reach the critical value. This is due to the fact that thinner chip shows higher ductility behavior and tends to curl on the tool rake surface, and it has almost its natural curling flow (Figure 1(b)).
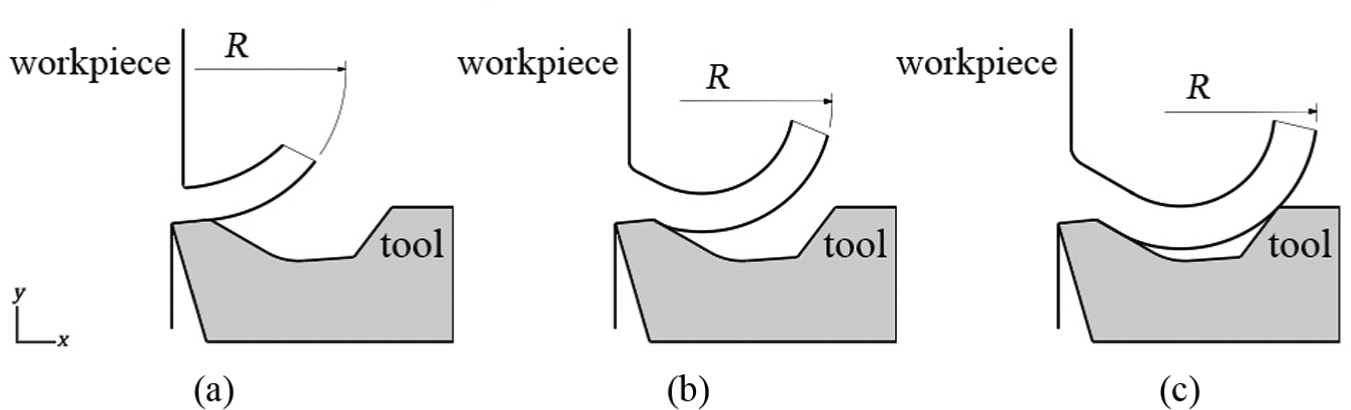
Relationship between chip breaker geometry and chip curling: (a) natural curling in the low feed rate, (b) natural curling in the moderate feed rate and (c) forced curling in the sufficient feed rate.
As shown in Figure 1(c), contact of chip with the back wall surface results in further curling of chip due to the force and momentum imposing from this surface to the back surface and root of chip, respectively. 11 Therefore, radius of chip curve decreases with the increase in feed rate. According to the theory of pure bending (equation (1)), the longitudinal strain is inversely proportional to the radius of arc (Figure 2) where γ is the central angle corresponding to AB with radius of R and y is the distance from the neutral axis, and in fact, this proves the importance of chip curve radius in the chip breakage
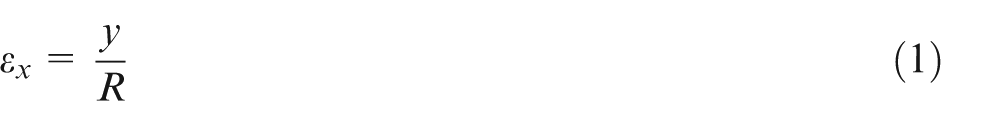
Basic hypothesis of bending.
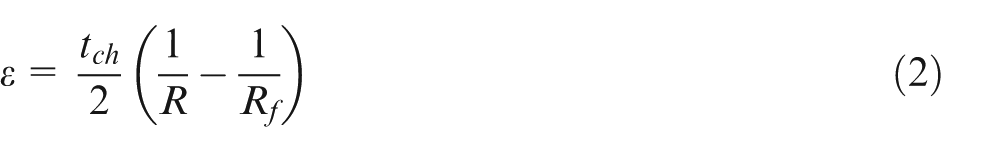
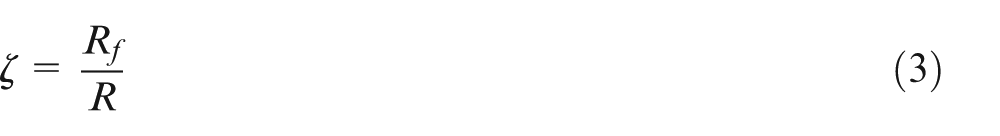
Moreover, Nakayama 12 developed a model (equation (2)) to calculate the maximum strain in deformed chip where tch is the chip thickness and Rf and R are radius of broken chip and the initial radius of chip, respectively
Therefore, selection of a criterion in terms of chip radius in order to predict the chip breakage and consequently, effective cutting range could be satisfactory. In this study, the ratio of broken chip radius to the initial one which is need to be calculated theoretically was used as the chip breakage criterion (equation (3))
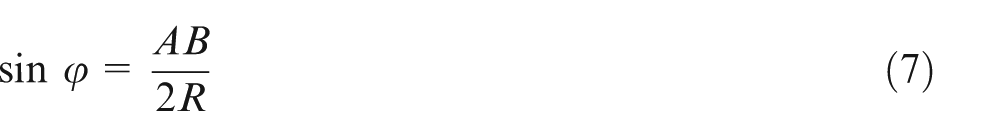
In order to obtain the initial radius of deformed chip, three states of back wall height (h) need to be considered. Figure 3(a) and (c) indicates the higher and lower heights of back wall in respect of land part, while the equal height is shown in Figure 3(b). In this figure,
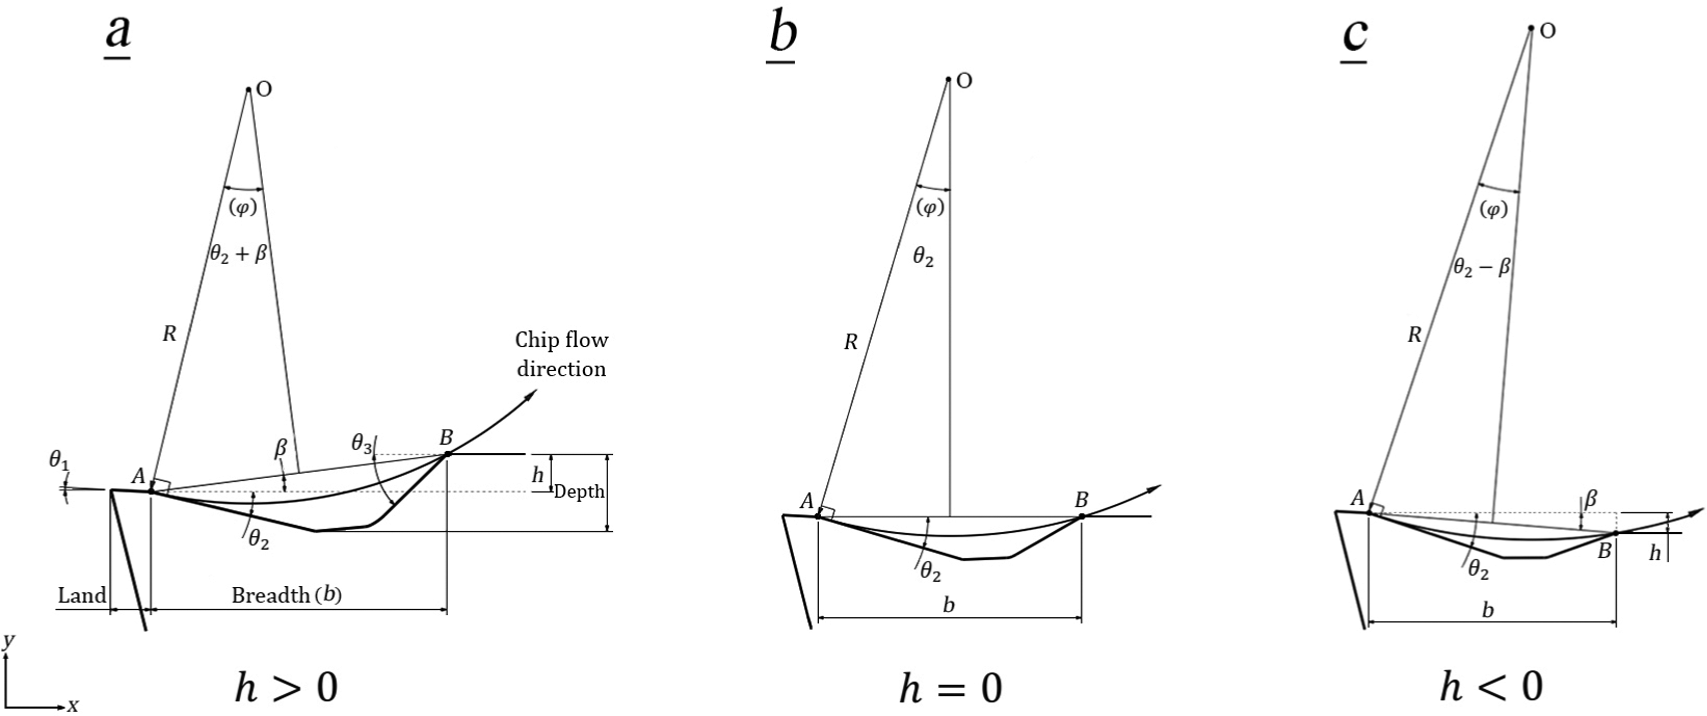
Initial radius of chip in groove section: (a) h > 0, (b) h = 0 and (c) h < 0.
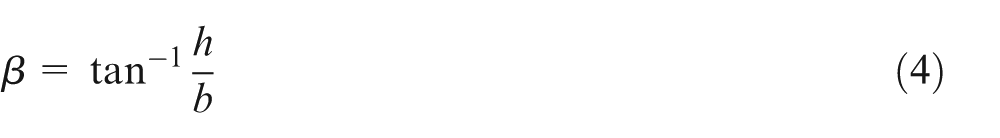
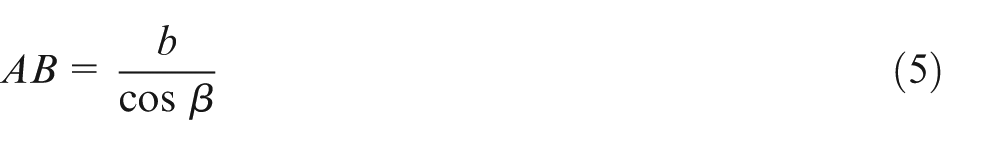
According to Figure 3, angle β is formed by horizontal and AB line joining the land to the back wall of the chip breaker, and it can be obtained by equation (4). Accordingly, the length of AB line and angle
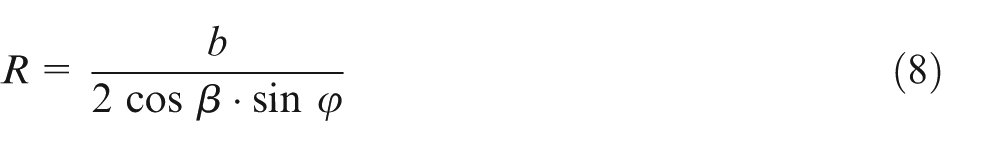
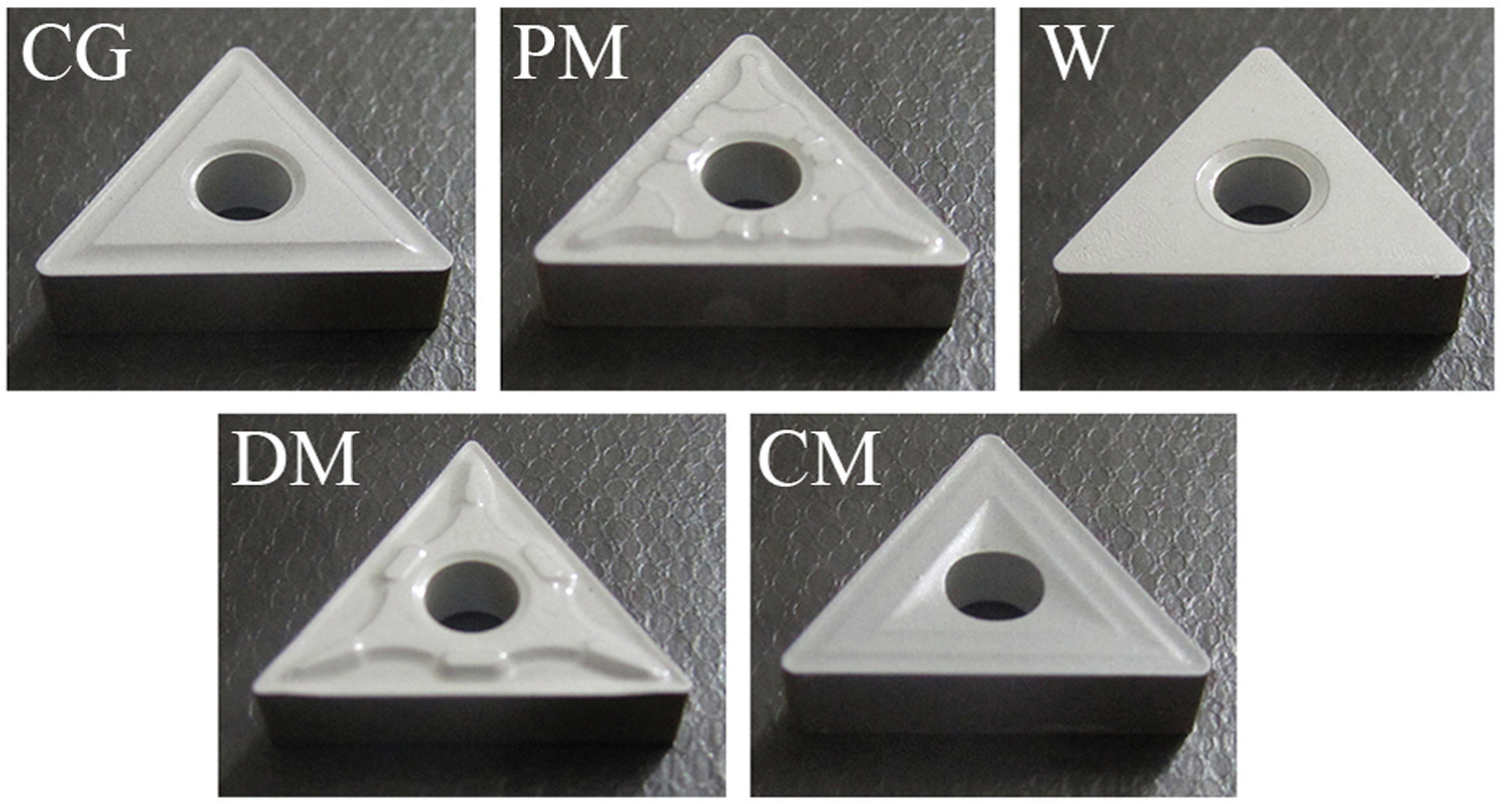
In the following, to perform experimental tests and calculate the initial chip radius, four types of commercial inserts with various chip breaker geometries are selected for this study. These are TNM_220408 tungsten carbon vapor deposition (CVD)-coated carbide inserts comprising TiCN and Al2O3 coatings suggested by Zhuzhou Cemented Carbide Cutting Tools Co. Ltd (ZCC CT) for medium machining of different steels. Their chip breaker geometries include two conventional types (CG and CM) and two chip breakers with more complex geometry (PM and DM). The machining operations were conducted in dry cutting condition. In order to obtain the value of the chip breaker geometries, inserts were sectioned using a wire-cut machine. After that, chip breaker geometries were measured using an optical microscope with 30× magnification coupled with the calibrated image analyzer (Table 1). Figure 4 shows these inserts and their relevant cross-sectional geometries. Moreover, the initial radius of chip for these four geometries was calculated and listed in Table 2.
Chip breaker geometrical characteristics.
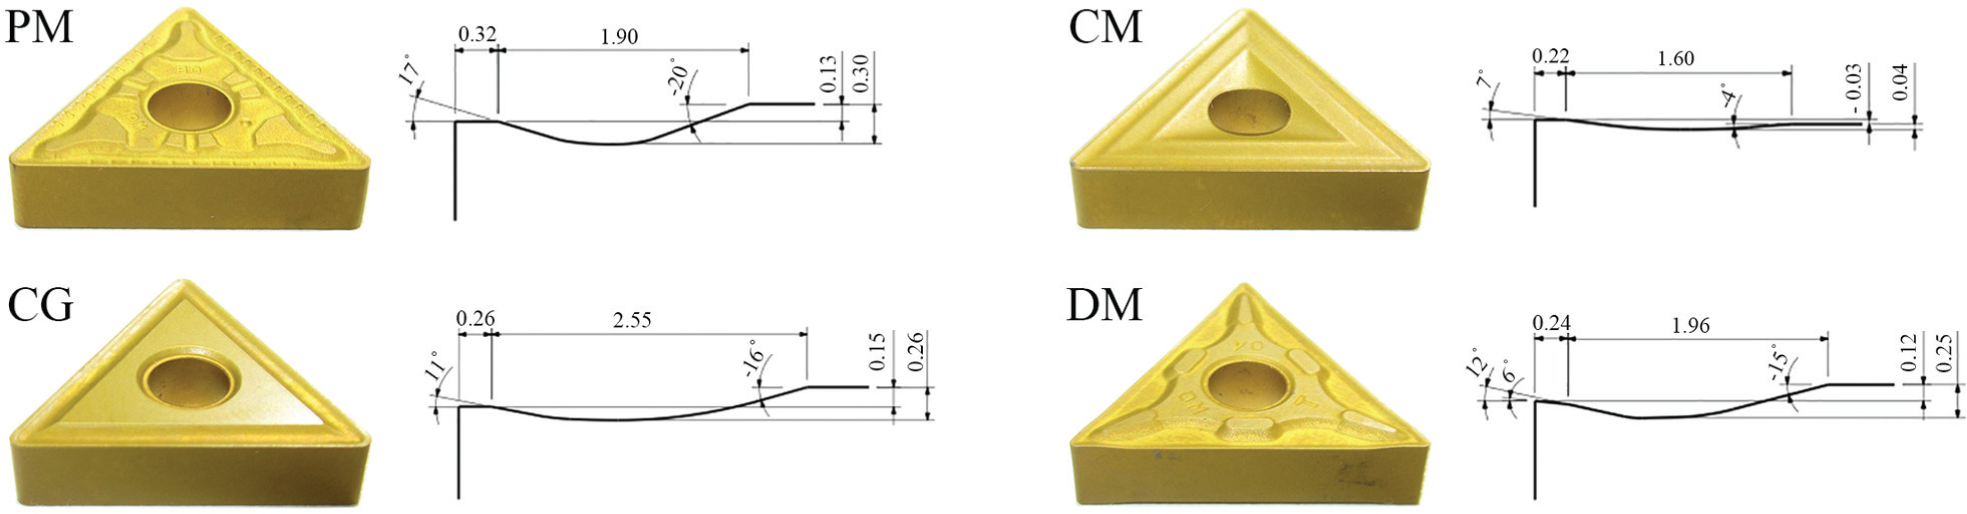
Inserts with their chip breaker geometries.
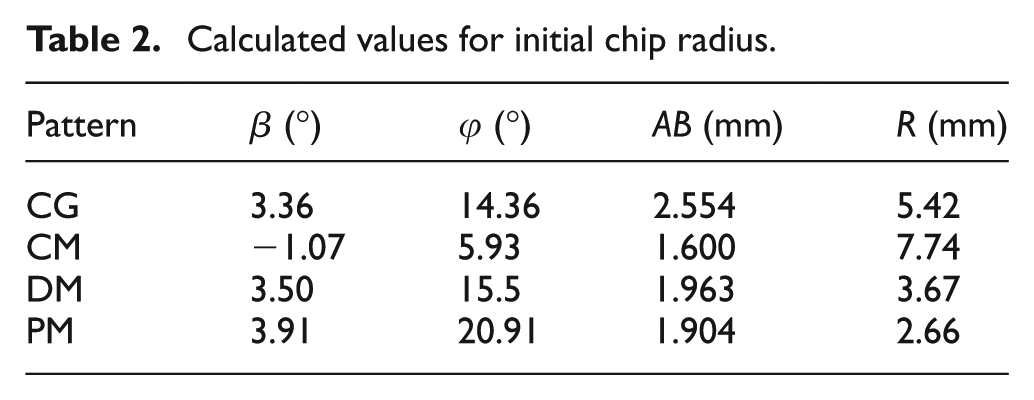
Calculated values for initial chip radius.
To achieve experimental chip radius, 45 cutting tests with the lead angle of Kr = 0° for each insert geometry were conducted on a computer numerical control (CNC) turning center. The cutting conditions and tool geometries are listed in Table 3. The workpiece material was medium carbon steel-AISI 1045, which was widely used in manufacturing industries.
Cutting conditions and tool geometries.
Radius of broken chips was measured using a method shown in Figure 5 and employment of low magnification microscope integrated to the calibrated image analyzer. Average radius was considered as the chip radius since more than one radius existed for some chips. Chip radius values are listed in Table 4, in which C indicates continuous chips.
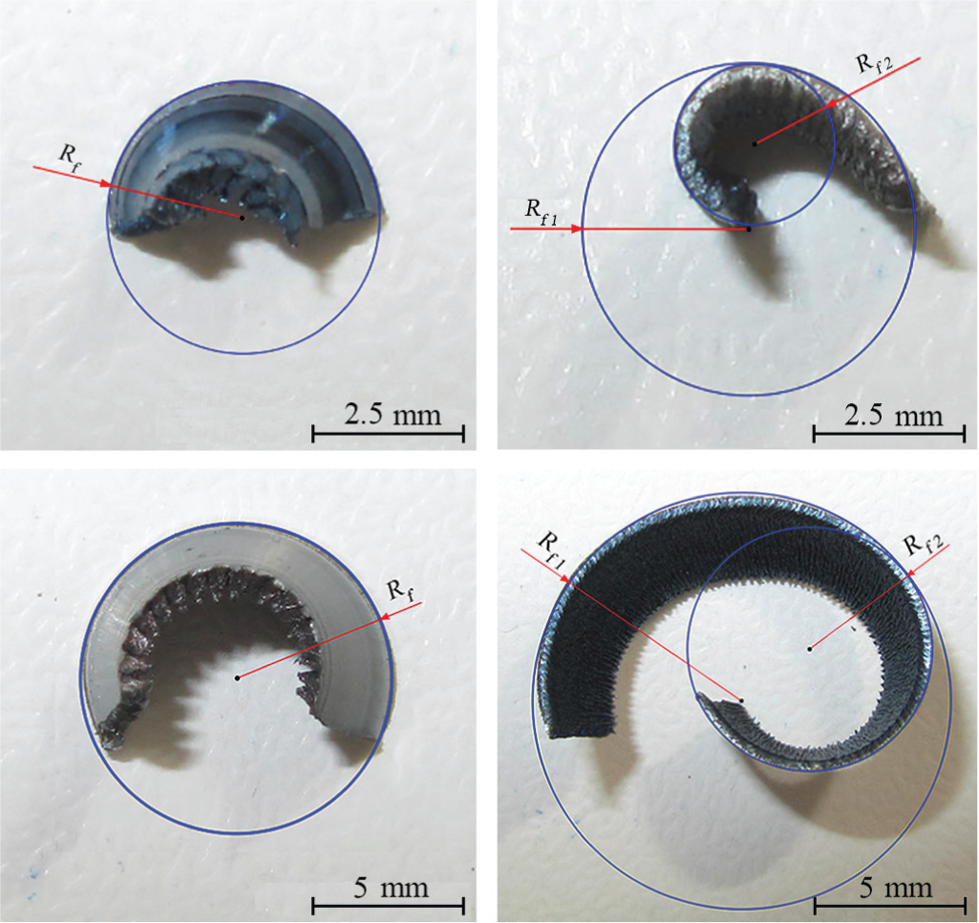
Some measuring samples of chip radius after fracture.
Size of experimental chip radius.
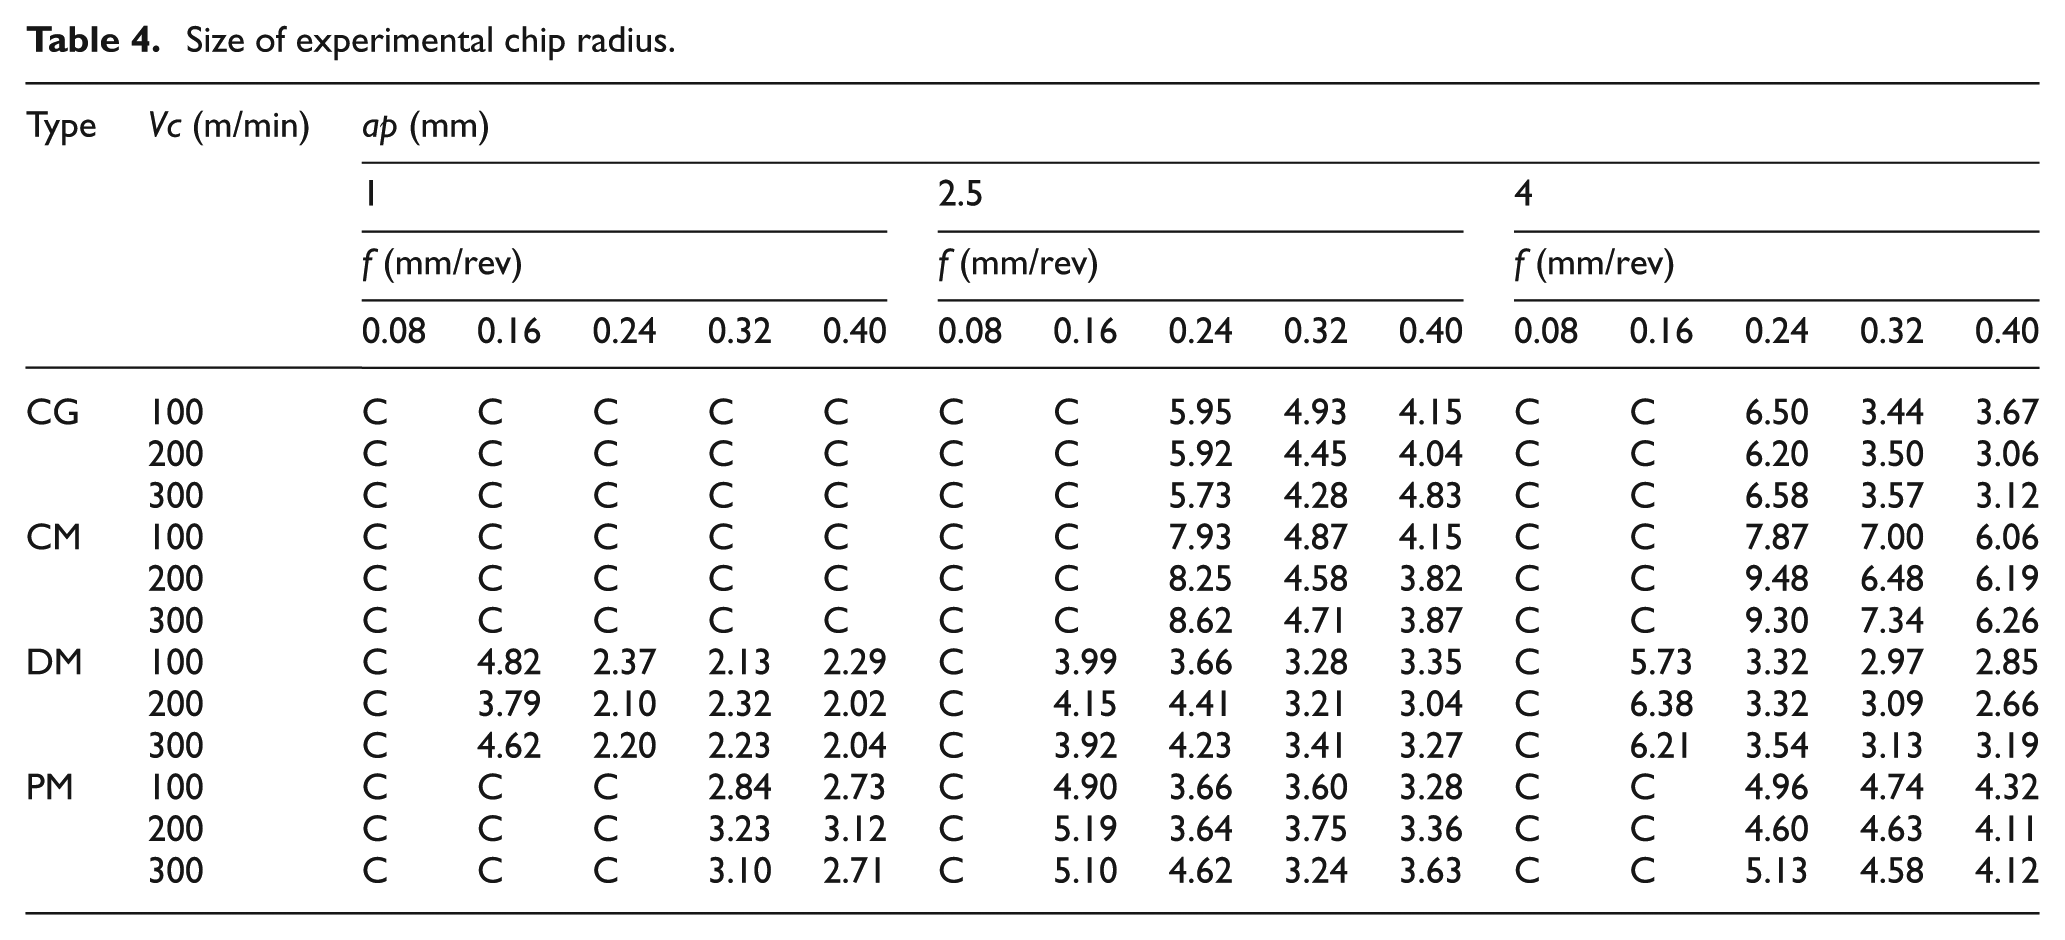
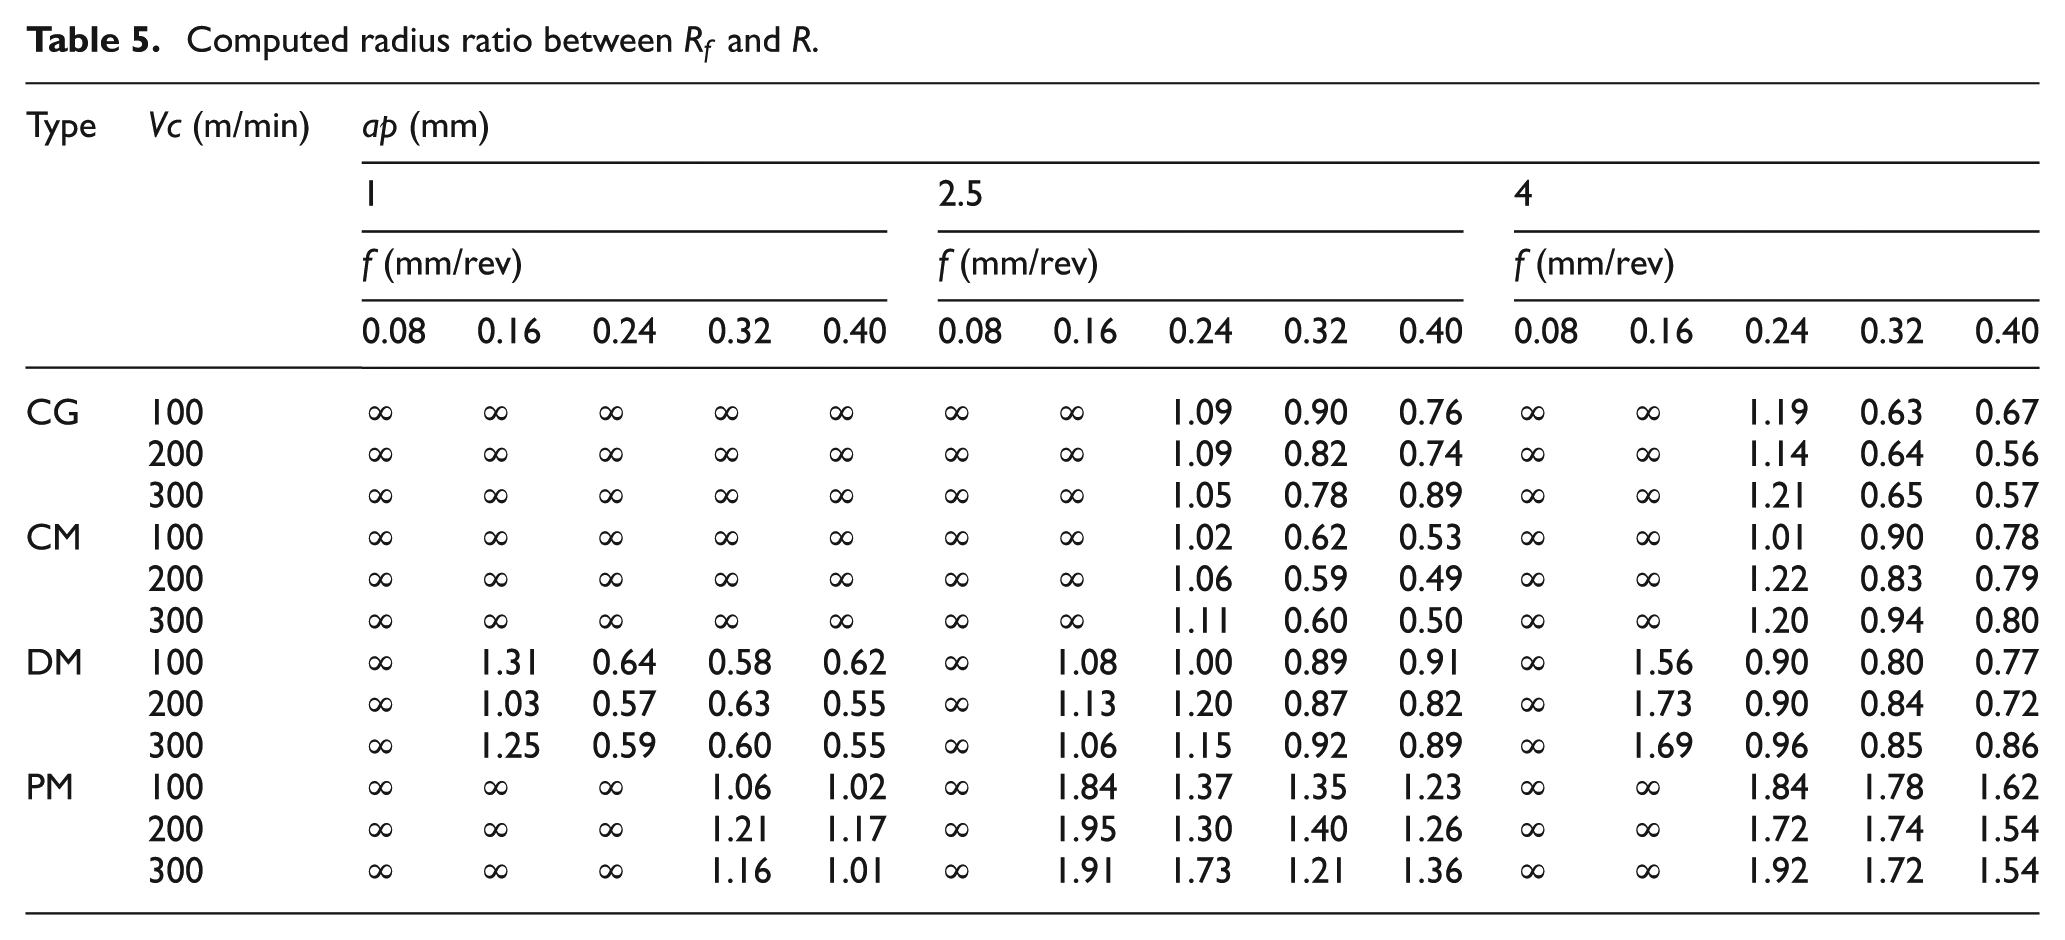
As can be seen in Tables 2 and 4, the biggest initial chip radius belongs to the chip breakers with low depth (CM) and long breadth (CG), while chip breakers with shorter breadth (DM) and higher depth (PM) possess the lower initial chip radius. This trend could also associate with the radius of broken chip as indicated by CM with biggest radius. However, the state of stress may be intensified in some cutting conditions for a particular chip breaker geometry as DM generated smaller deformed chip radius in some tests. This is due to the higher friction force and consequently higher bending moment generated in these cutting conditions for this geometry. Meanwhile, the radius ratios (
Computed radius ratio between
Classification of chip radius
In recent years, many methods have been offered to classify chips which are mostly based on shape of chips such as INFOS classification. In another classification offered by CIRP, chips are categorized based on the ratio of deformed chip volume to the volume of material removed from workpiece, in which the ratio between 8 and 50 named as the most desirable chips.
As mentioned earlier, the ratio of broken chip radius to the initial radius was selected as the criterion for this study. It is evident from Table 5 that all broken chips have ratio less than 2. In general, an increase in feed rate causes a decrease in deformed chip radius and chip ratio consequently, which is due to the increase in chip–tool contact and friction forces. This severe contact intensifies the tool wear rate and shortens the tool life consequently, while reduction of chip–tool contact is one of the reasons for the use of grooved chip breakers. 13
According to the previous research carried out by Sadik and Lindstrom, 14 the chip–tool contact will be ideal while using grooved chip breaker if it does not exceed over 65% of the nonchip breaker state. This means that a cutting parameter resulted in the chip breakage with chip contact of over 65% is not acceptable if long tool life is desirable. However, it could be usable if the breakage of the chip is only aimed. Therefore, classification of all broken chips in one category could not be a right approach. Accordingly, selection of a minimum value for the radius ratios should be considered to meet this matter.
According to the research made by Jawahir 15 and Sharma et al., 16 monitoring of chip breakage by a high-speed camera showed that the chip–tool contact is constant from deformation until breakage of the chip. Assuming that chip–tool contact is 65% or lower if the chip radius be equal or higher than its initial value, and the chip breakage occurs in one of the states declared by Jawahir 15 and Fang, 9 as shown in Figure 6. In this case, the acceptable radius ratios will be equal to or greater than 1, and it can be classified as follows

Different conditions of chip breakage for (a) brittle materials, (b and c) ductile materials in the up curling condition and (d) ductile materials in the side curling condition.
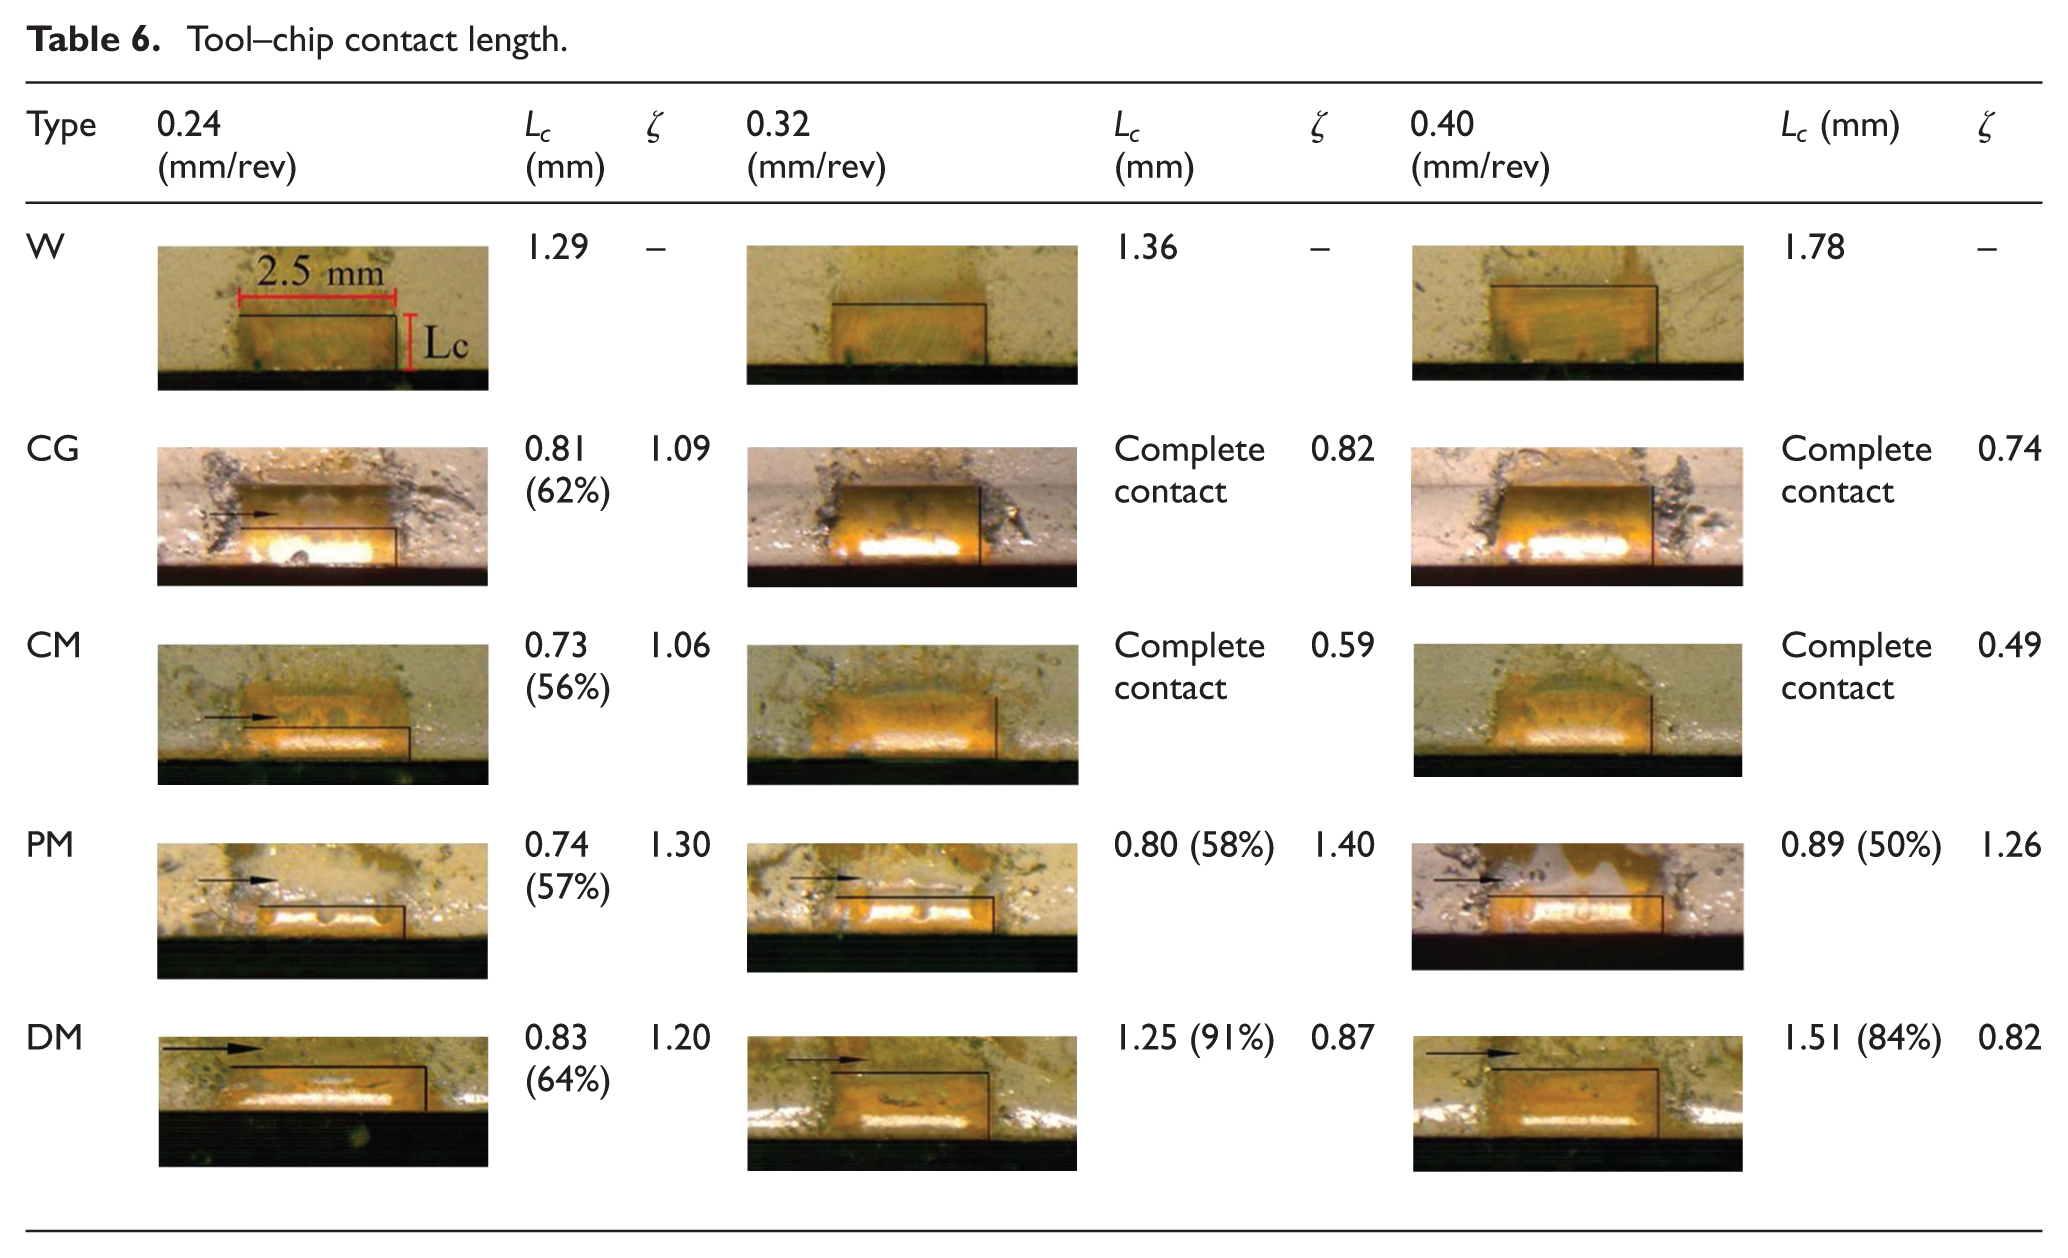
In order to verify the above assumption, an experimental method presented by Jamshidi and Nategh 17 was applied to measure the chip–tool contact length. Accordingly, inserts are painted (Figure 7) and used for some selected machining trials. Machining was stopped in first few seconds of contact, and chip–tool contact was measured under microscope. Table 6 shows the chip–tool contact length measured by optical microscope.
Colored inserts (W is a flat-faced insert).
Tool–chip contact length.
It should be noted that the length measured by microscope is the projection of chip–tool contact on a horizontal plane, and the actual contact length (Lc ) can be drawn by equation (9), in which L1 and L2 are the projected lengths on the land part and secondary rake face, respectively, and L3 is the contact length at the bottom of the groove. This equation is applicable for the case of complete contact as shown in Figure 8. However, it should be adjusted for the cases with partial contact. For example, L3 will be considered zero, and L2 should be calculated separately if the secondary rake face is not fully engaged
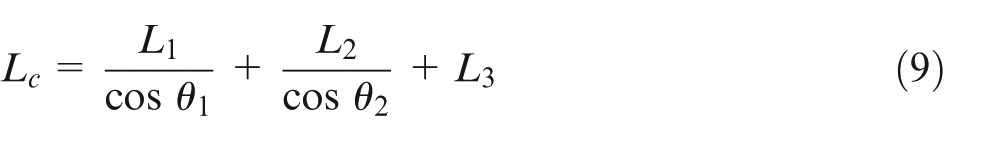
Way of contact length measurement.
Evaluation of results in Table 6 revealed that contact length for CG and CM chip breakers in feed rates of 0.32 and 0.4 were completed, that is, chip breaker groove is fully filled by chip. Moreover, contact length for DM was more than 65%, which results in the radius ratio of lower than 1 in all these cutting conditions. In contrast, the radius ratio of more than 1 was obtained for PM in all feed rates and other cutting conditions of CG, CM and DM with contact length of lower than 65%. Therefore, it can be suggested that radius ratio of 1 and more is valid for acceptable chips.
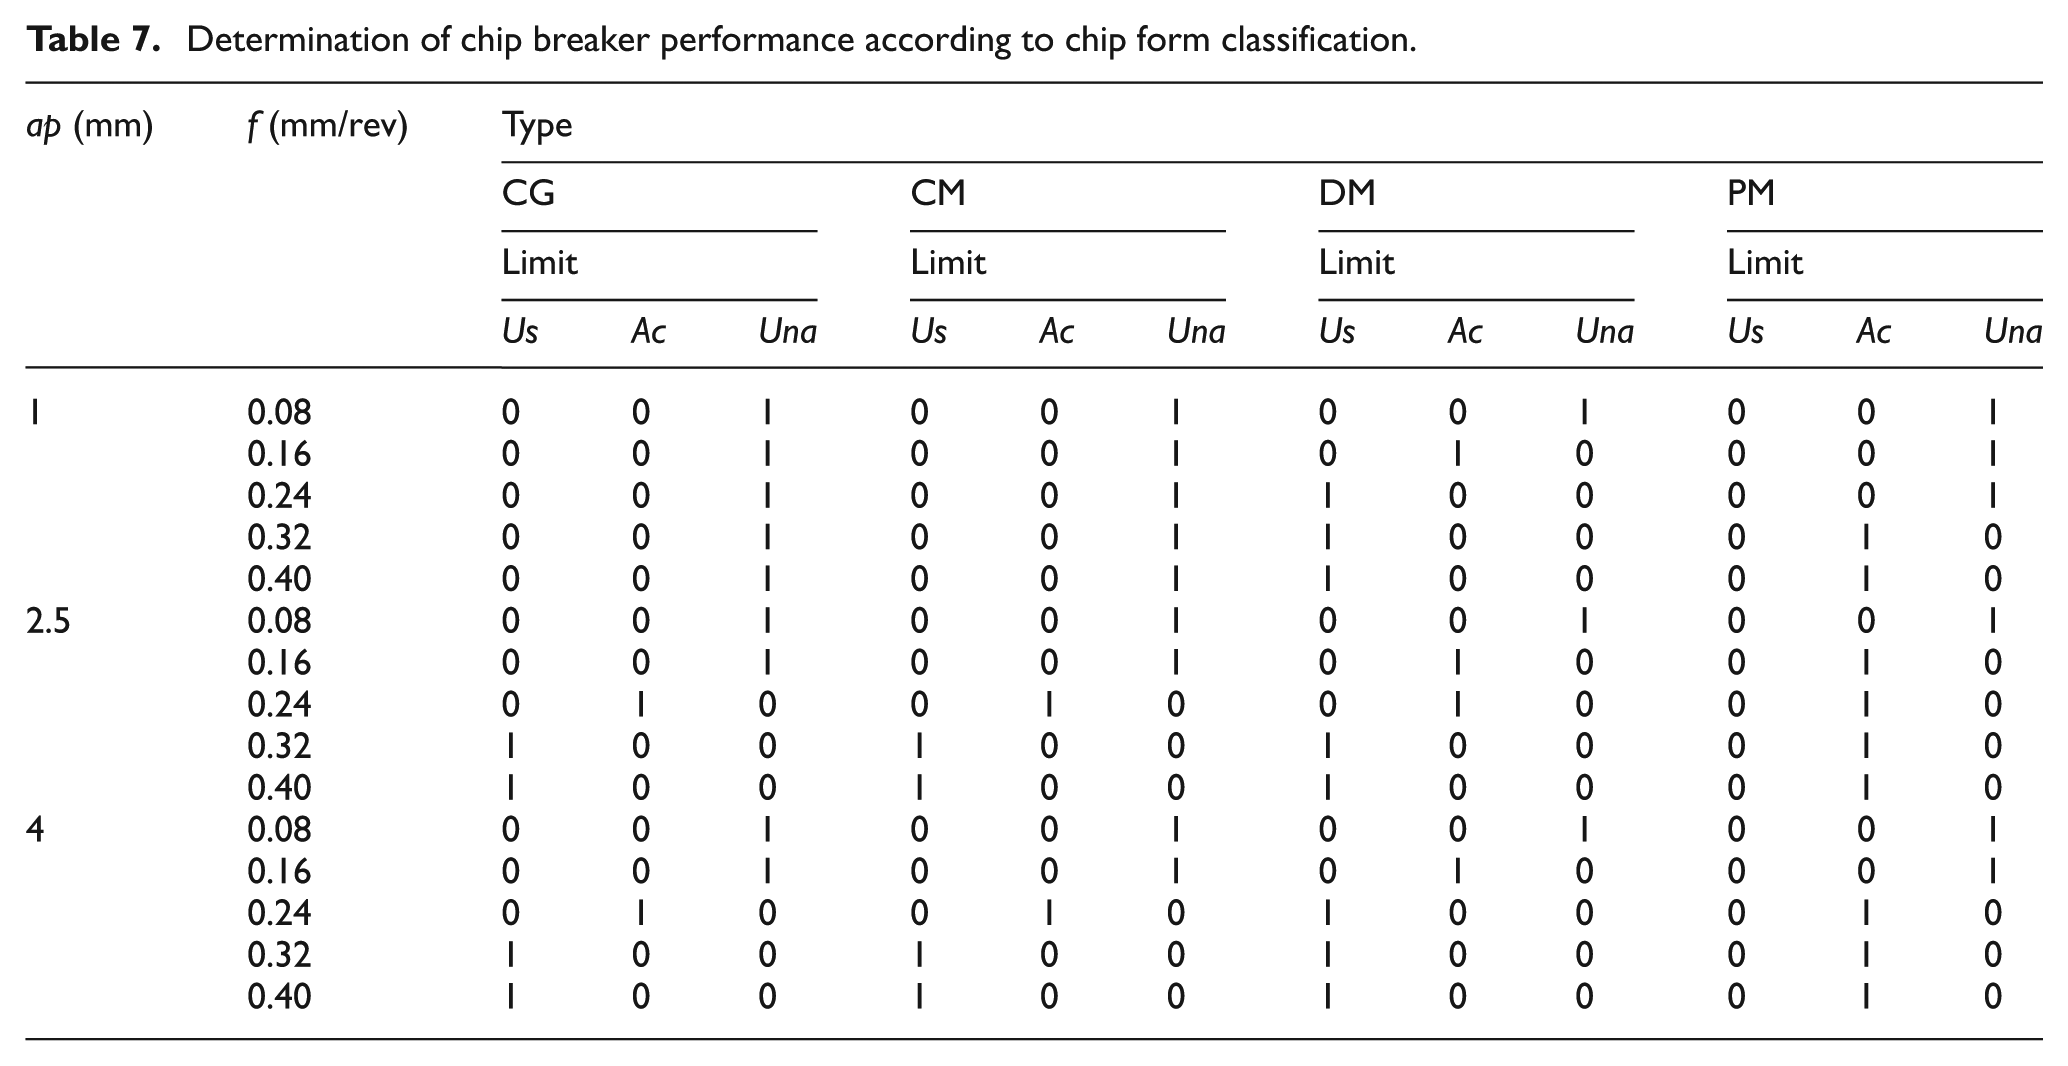
Due to the existing infinitive ratios, it is required to normalize the raw data within a specific range in order to make it meaningful for artificial neural network (ANN), where the presence of a type of chip based on the above classification in every cutting condition is indicated by 1 (Table 7). It is noted that cutting speed variation does not have a significant effect on the chip ratio and chip breakage, and hence, relevant cutting conditions are not shown in Table 7, but they are used for modeling.
Determination of chip breaker performance according to chip form classification.
Thus, Figure 9 shows the comparison of effective cutting range recommended in tool manufacturer catalog with the one obtained by the method offered in this study. Green color shows acceptable areas in which the chip breakers show their best performance. In addition, there are some yellow zones that represented a ratio of less than 1. These areas can be usable for chip breakage, but it may result in the severe tool wear. The gray one is the last area, and it is recommended by tools supplier, while the presence of continuous chips was observed and proven in this area.
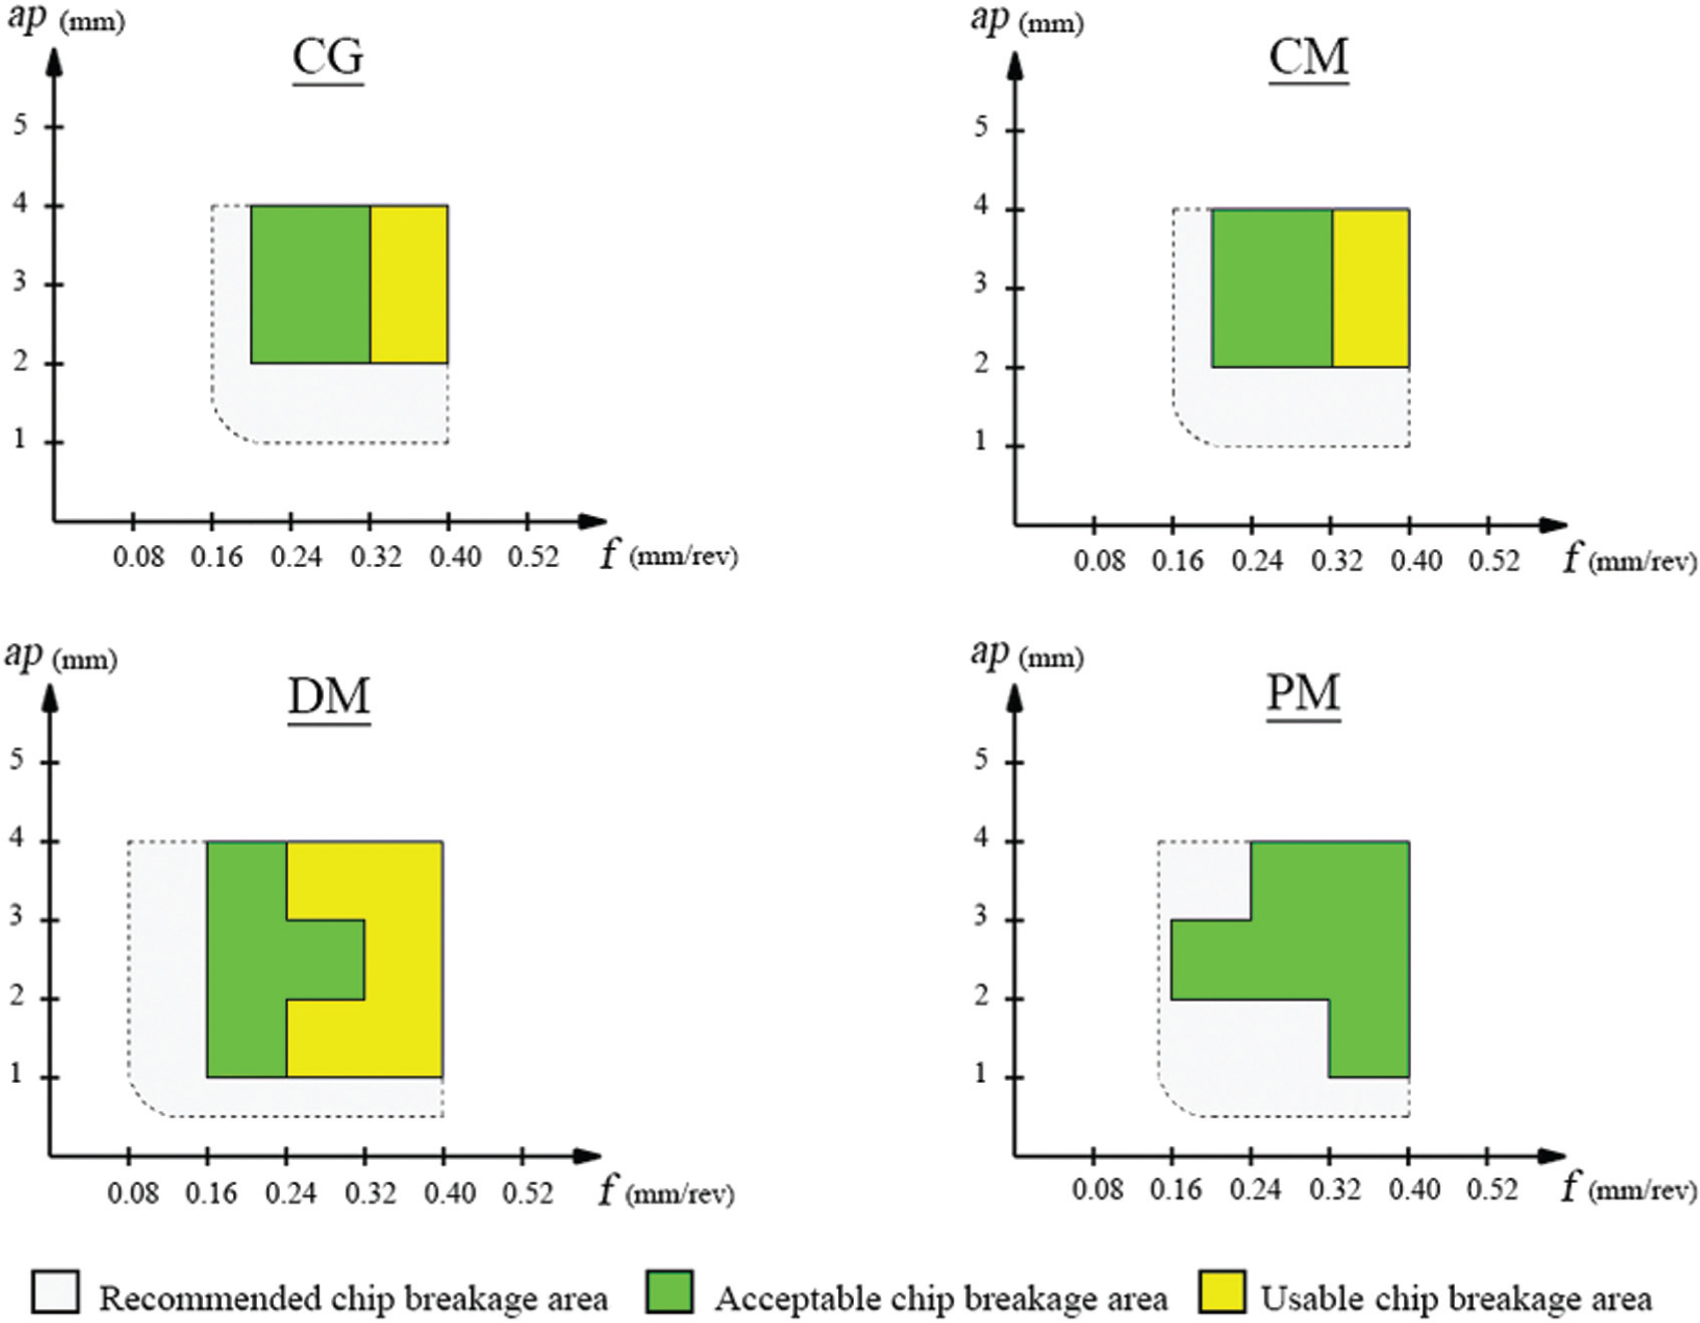
Classification of chip forms in comparison with recommended chip breakage area by tools supplier.
Preparation of neural network model
ANN processes information in a similar to human brain. ANN evaluates and discerns how to solve the problem by a number of neurons (parallel interconnected processing elements). In many fields, ANN is applicable, and particularly, it is a reasonable alternative to the conventional empirical modeling, which is on the basis of polynomial and linear regressions.18,19
As a common description, the network evaluates input data (
where y is the output value and
In this study, tangent sigmoid function was used as a transfer function. Its equation is given in the following
In order to train the network, 10 inputs comprising chip breaker geometric elements (land, breadth, depth, the height of back wall,
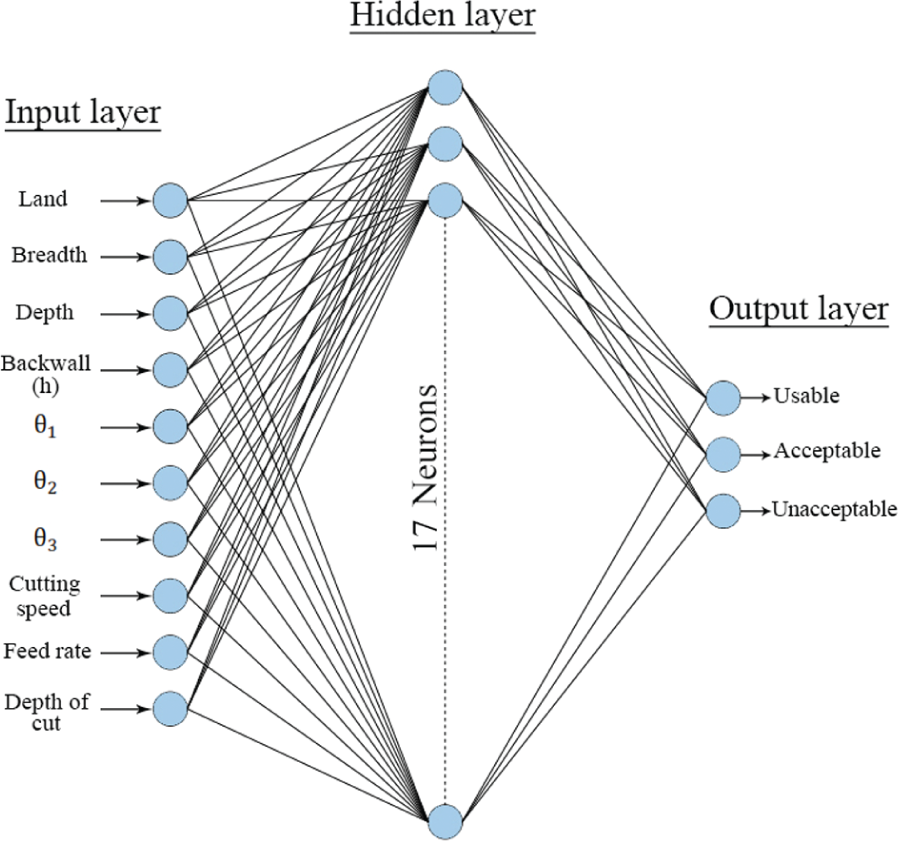
ANN architecture.
There is a couple of performance measurement in ANNs training. In this study, mean square error (MSE) was used as objective function to show average squared difference between the net outputs and the real values (targets). 18 From Figure 11, the best validation performance obtained at epoch 527 was equal to 1.13e−9 (the more close to zero is the better).
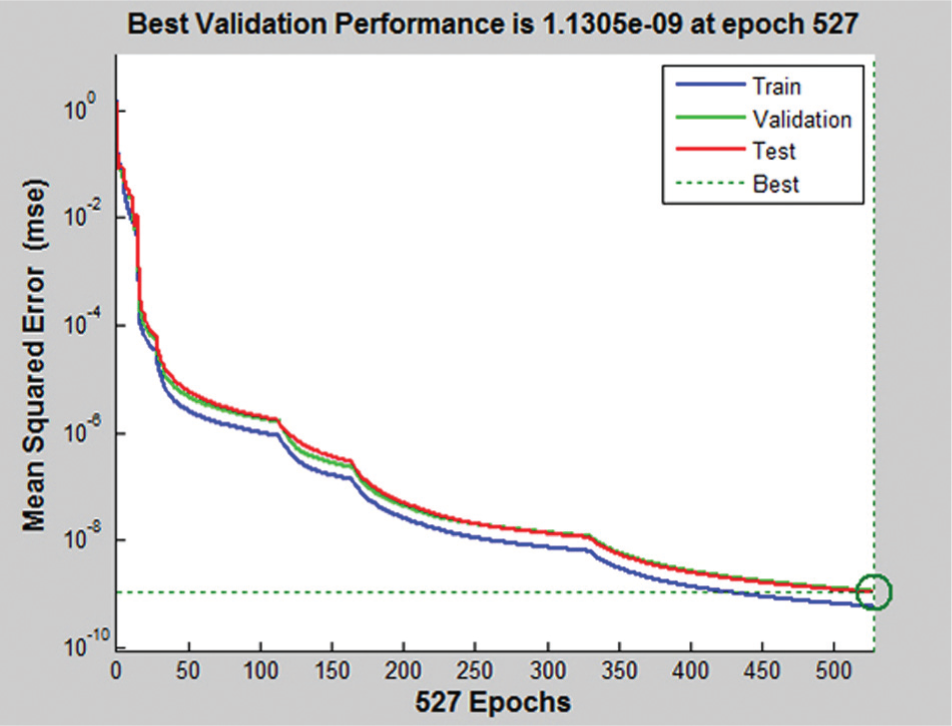
Network performance.
Regression (R) is another factor to evaluate the network performance. It is a relation between the net outputs and the real values (targets). 18 Slope value of 1 means a close relationship. Figure 12 shows the network efficiency during training, validation and test operations with 126, 27 and 27 samples, respectively. The performance of other structures has been tested and is shown in Table 8.
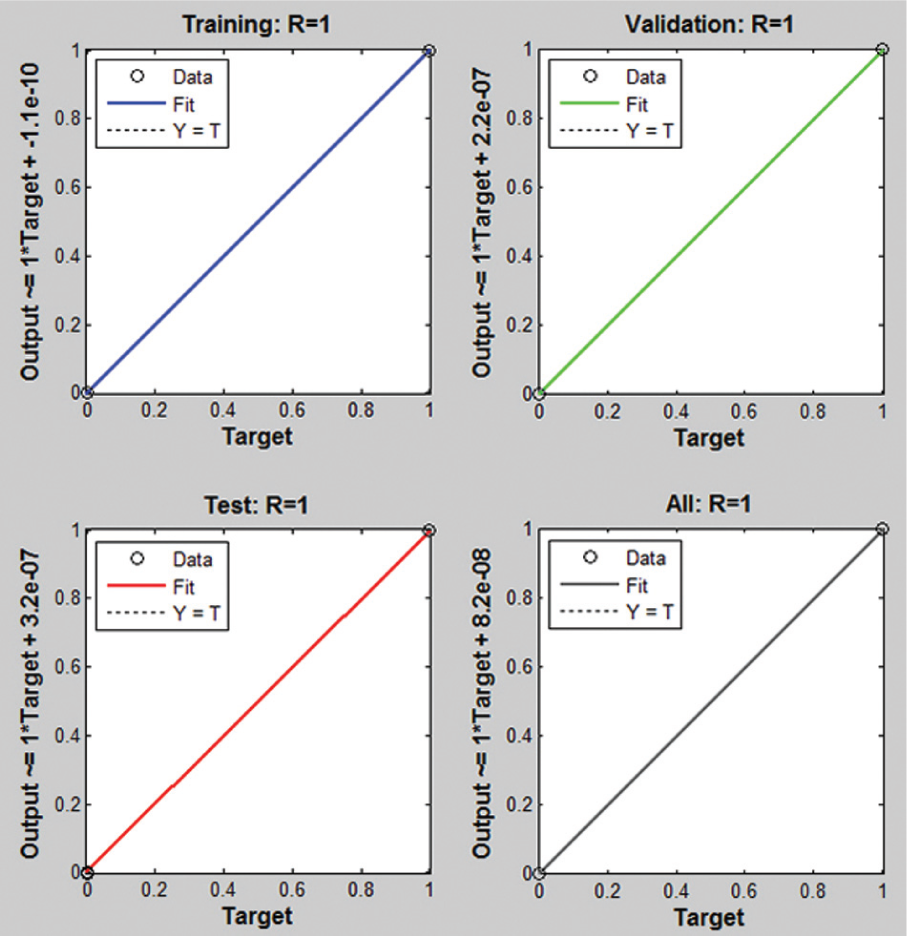
Regression plot.
Regression and performance values of other structures.
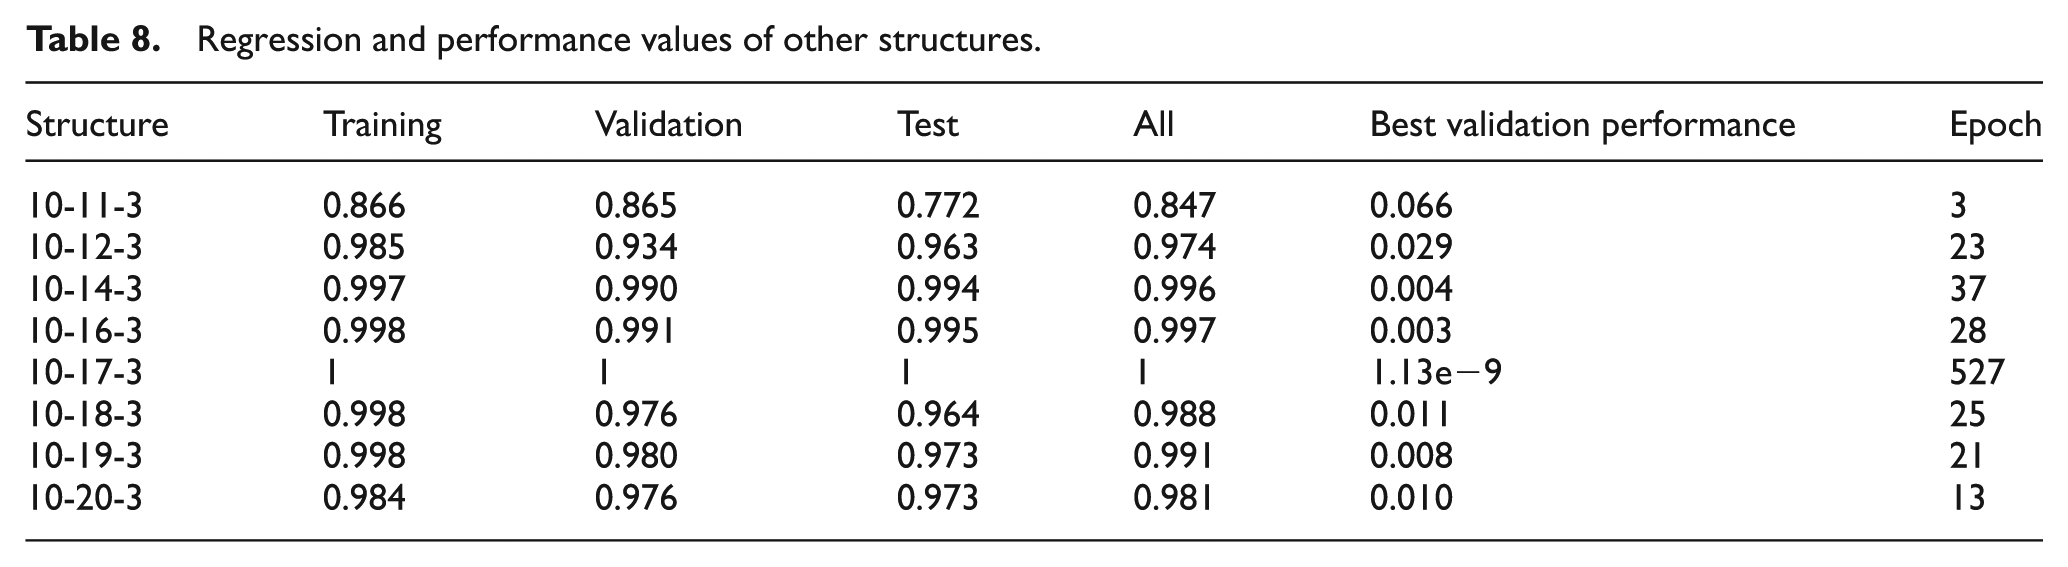
In accordance with Table 8, the best performance was achieved for 17-neurons-structure because others except the 17th one were stopped by validation check criterion (after 6 fails) in primary training epoch, while the 17th one was stopped by gradient criterion after a big training in lower error condition.
Network prediction
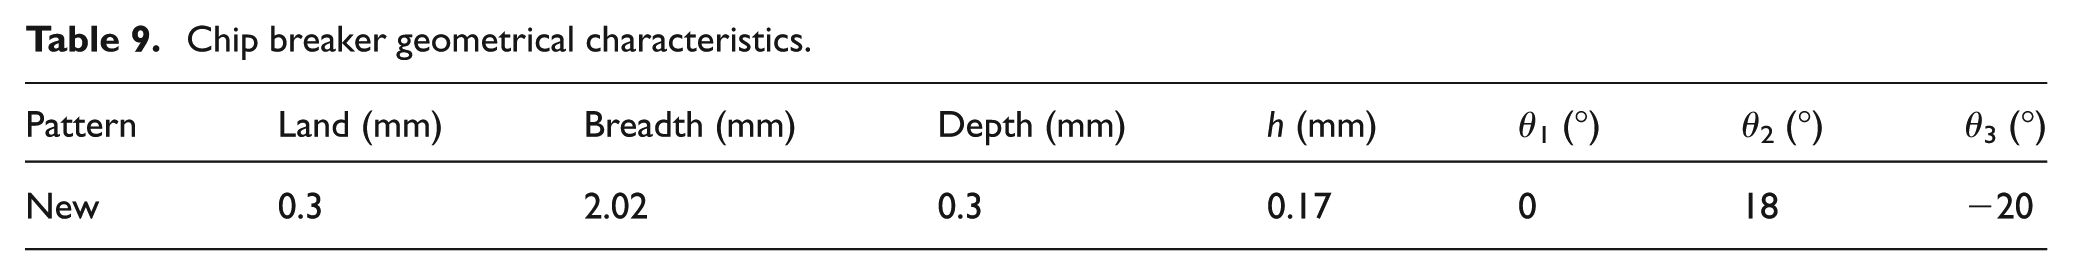
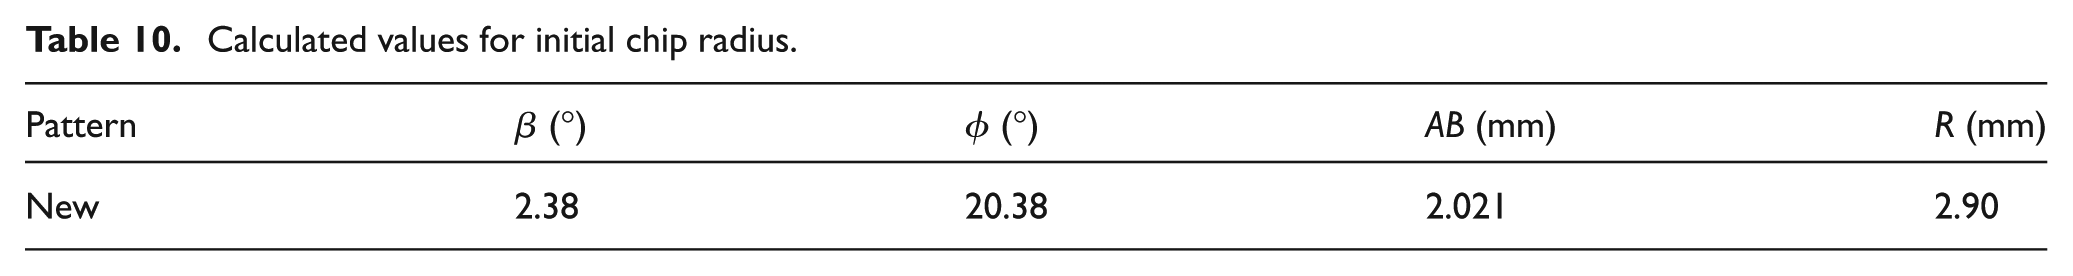
In order to verify the model developed and evaluate its performance, a TNMG insert with new chip breaker geometry was selected to run some verification tests (Figure 13). The insert geometry was measured as described in the earlier section, and its geometrical characteristics are listed in Table 9. Table 10 shows the initial radius calculated for this geometry. Since cutting speed had no significant effect on the selection of cutting limits, six cutting runs were carried out at constant cutting speed of 200 m/min as shown in Table 11.
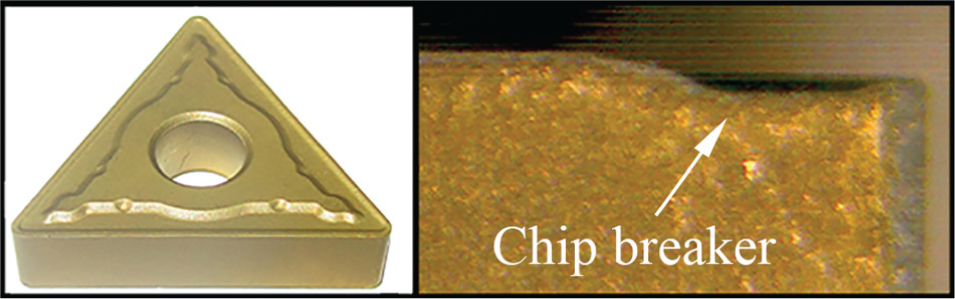
Chip breaker geometries.
Chip breaker geometrical characteristics.
Calculated values for initial chip radius.
Size of experimental chip radius with computed radius ratio.
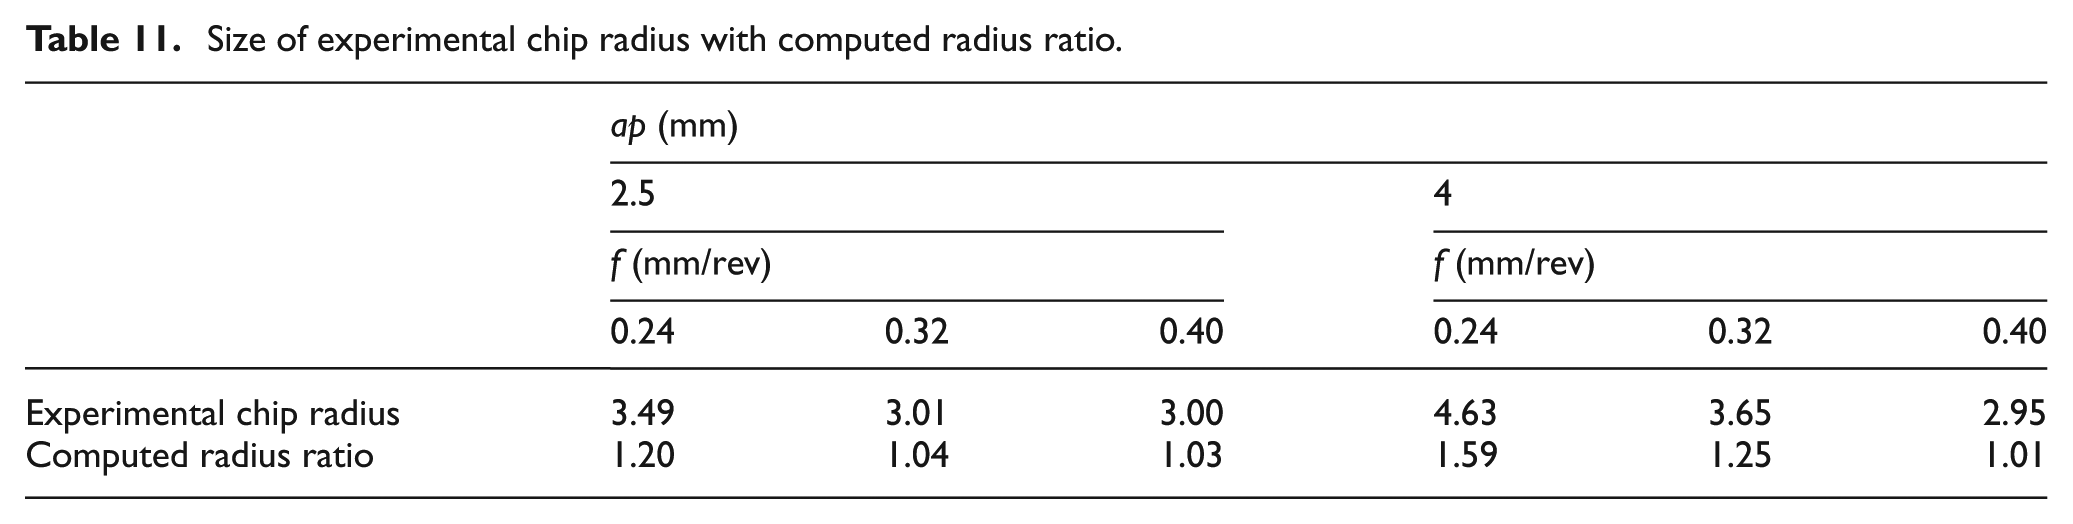
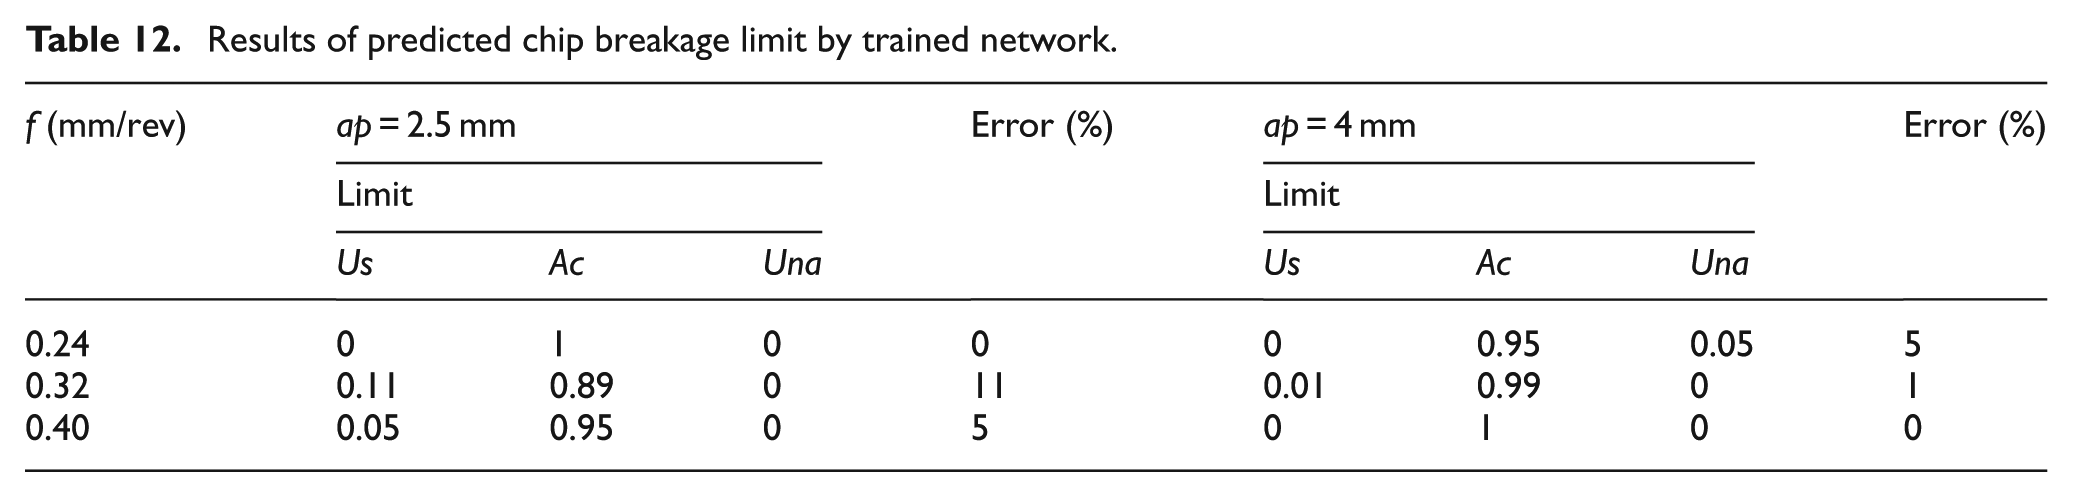
As can be seen in Table 11, the chip ratio obtained for all cutting conditions of this new insert is between 1 and 2 that are categorized as acceptable chips. This was verified by the results predicted by the neural network model and is shown in Table 12. As shown in this table, the type of chip is predicted correctly by the model, although negligible error can be observed which could be reduced by increasing the number of geometries and tests.
Results of predicted chip breakage limit by trained network.
Conclusion
In this study, a hybrid model was developed to determine the effective cutting limit for various chip breaker geometries. This model is used to differentiate broken chips based on the ratio of broken chip radius versus the initial chip radius. The radius of broken chips was measured by a microscope, and the radius of the initial chip was calculated theoretically. Accordingly, chip ratios were classified into three categories which facilitate to determine the cutting limits for every chip breaker geometry. It was indicated that ratios between 1 and 2 result in acceptable chips, while higher levels of feed rate increase the tool–chip contact linking to usable chips with a ratio of less than 1. Eventually, the developed hybrid model was able to predict the type of chips using the chip breaker geometry and cutting parameters. This model might be used to find the effective cutting limits for different geometries to attain the acceptable chip type as it is used for geometries studied in this work.
Footnotes
Acknowledgements
The authors wish to thank the Production Lab of IAUN for their financial and technical supports.
Declaration of conflicting interests
The authors declare that there is no conflict of interest.
Funding
This research received no specific grant from any funding agency in the public, commercial or not-for-profit sectors.