
Abstract
Existing single spark models are subjected to too simplistic assumptions such as uniform or point heat source, constant plasma radius, invariable materials properties and constant surface temperature during discharge making them far from reality. In this study, more realistic assumptions including Gaussian type distribution of spark heat flux, temperature dependent materials properties, latent heat of melting and expanding plasma channel with pulse current and time have been made to establish a comprehensive modeling platform. The ABAQUS FEM software has been used to simulate the mechanism of crater formation due to a single discharge. The non-uniform thermal flux was programmed through the DFLUX subroutine. The simulation results show that the temperature of work piece decreases as the discharge time increases while the volume of melted and evaporated material increases. A specially designed single spark experimental set-up was developed in laboratory to carry out a few single spark tests for verification purposes. The obtained craters morphologies were examined by optical microscopy and scanning profilometer. It has been shown that the present approach outperforms other previously developed thermal models with respect to cavity outline and size possessing the maximum confirmation errors of 18.1% and 14.1% in predicting crater radius and depth, respectively. Parametric analysis reveals that the melting boundary moves onward by increasing discharge current, whereas it moves back prolonging discharge time. Finally, a closer proximity to experimental material removal rates than those predicted by analytical approach has been recognized which confirms its more precise generalization capabilities towards the real state EDM process.
Keywords
Introduction
Electro-discharge machining (EDM) is indisputably an electro-thermal process that removes material from the work surface through the action of repetitive discrete electrical sparks produced by a direct current (DC) pulse generator between the two electrodes (tool and workpiece) separated by a small distance (gap) while being immersed in a dielectric liquid medium. The thermal energy is then utilized to generate high-temperature plasma channel that erodes minute amounts of the work material through local melting and vaporization. The removed material particulates (debris) are subsequently flushed off from the surface of workpiece via cool dielectric flowing into machining region. Since the EDM does not involve any physical contact between tool and workpiece, mechanical factors such as hardness or strength are no barrier to its applications. It thus provides an economic advantage for making sampling tools, wire drawing and extrusion dies, forging dies, hardened steels, intricate mold cavities and so on. Delicate jobs, being too fragile to withstand cutting forces during conventional machining processes, can also be effectively machined by the EDM.1–3
Despite the widespread applications of EDM in today’s industry, such as die and mold, aerospace and automobile, the process itself is inherently complex and stochastic in nature as several disciplines of science and branches of engineering are involved. Phenomena such as heat conduction, energy distribution, melting, vaporization, ionization, formation and collapse of gas bubbles all take place in a very short period of time (of the order of microsecond). Therefore, it is too difficult to develop a universally accepted mathematical model predicting its performance measures while entirely covering the involved physical aspects. 4 Poor quantitative knowledge of the sources of variability affecting this process hinders the identification of its natural tolerance limits. Until now, there is no acceptably comprehensive physics-based process model of the EDM due to the presence of a large number of interconnected variables and complicated process mechanism. 4
Among several theories suggested for the mechanism of material removal in EDM, the electro-thermal approach has gained further popularity being more consistent with experimental observations. 4 It proposes intense local temperature gradients associated with a very high energy density caused by ionization within the discharge column formed between the workpiece and the tool. Hence, except for very short pulse on-times (less than 5 µs) in which there is not enough time for the material to be effectively heated and the induced electrostatic forces have been recognized to be responsible for material removal, 5 the thermal effects resulting in melting and vaporization have been known as the main mechanisms of material removal in EDM process. 6
Therefore, since EDM’s inception and especially in the early 1970s, many researchers attempted to develop thermal models describing the discharge phenomena (plasma channel) and process physics to model the mechanisms of anode and cathode erosion. 7 These early researches have all been based on obtaining analytically exact closed-form solutions through solving heat conduction problem applying different boundary conditions and other simplifying assumptions such as cylindrical spark plasma, 8 uniform (disk) heat source, 9 point heat source, 6 expansion of plasma channel radius with only pulse on-time while ignoring the effect of discharge current 10 and constant thermo-physical properties of materials 11 taken over the temperature domain concerned in EDM. However, recent experimental observations made through high-speed video cameras, optical spectroscopic analysis and fiber optics12,13 have shown that the spark plasma grows with time and is of barrel shape, the cathode arc root being much smaller than the anode arc root due to electron emission while both being smaller than the bulk plasma. It has also been indicated that the distribution of heat flux within the discharge channel is not uniform but changing with time and position over the area where the spark develops. Moreover, the assumption of constant material properties is not in line with the true physical aspects of the process as it involves extremely high temperatures exceeding the work melting point. Accordingly, it is necessary to apply temperature-dependent thermo-physical properties to simulate the process mechanism more accurately. To sum up, all the above referred works can be criticized in some parts considering such simplifying assumptions which severely limit their applicability and hence require suitable modifications.
Salah et al. 14 applied finite difference schema in two-dimensional (2D) case to study temperature distribution in EDM process and obtained material removal rate (MRR) resulted from single discharge. It was indicated that the use of temperature-dependent thermal conductivity is of crucial importance enhancing modeling accuracy and fitting experimental results better than the case when a constant conductivity is assumed.
Shankar et al. 15 conducted a comprehensive attempt based on finite element method (FEM) to analyze the spark profiles and reported that the plasma shape is non-cylindrical having the smallest cross-sectional area at the middle of discharge channel. However, their results are in conflict with those experimental evidences referenced by advanced technological setups12,13 that revealed a non-cylindrical barrel shape for a developed plasma channel.
Ahn and Chung 16 performed a numerical analysis of unsteady approach on alumina–titanium carbide composite under EDM conditions with variable discharge currents and duty cycles. It was found that increasing both current intensity and duty cycle results in higher amounts of erosion rates.
Marafona and Chousal 17 developed an electric–thermal model considering the effect of Joule heating as the main source of thermal energy increasing discharge channel temperature using the ABAQUS/Standard FEM software. Comparing their results with those experimental values reported by AGIE SIT Corporation, USA, for anode and cathode erosion rates,6,11 a good agreement was claimed. Nevertheless, the effect of latent heat of melting was ignored and constant material properties were used as well.
More recently, Somashekhar et al. 18 applied FEM based on the electro-thermal theory to approximate the dimensions of a typical crater formed in micro-EDM. Large deviation between experimental and simulated result was noted, attributed to the assumption of a constant spark radius (2 µm) during discharging.
Although studying the consequences of occurring a single-pulse discharge over a work surface may not completely reveal the whole nature of EDM process in its real state multi-spark phenomenon, it is of great importance helping understand the fundamental mechanism of metal erosion by spark discharge. Additionally, it can be used as a useful tool in parametric analysis investigating the effects of different parameters on the process measures such as crater size, geometry and MRR. This provides a versatile mean to predict process behavior under different operating conditions yielding a cost-effective and economical approach eliminating the need of running exhaustive experimentations. In short, based on the review of related literature considering their restrictions and limitations, the main objectives of the current research can be stated as follows:
Shed a fundamental insight on the principle working mechanism of EDM process using more realistic assumptions being in line with the true nature of EDM. These mainly involve the non-uniform Gaussian distribution of thermal plasma, growth of spark radius, variable material properties, latent heat of fusion and the fraction of discharge energy entering the workpiece.
Study the actual crater morphologies obtained through conducting a few single-spark tests using a special single-discharge experimental setup and verify the simulation results. This also provides a unique basis to evaluate and compare the predictive accuracy of the present model with other approaches against the experimental findings.
Methodology
Electro-thermal modeling of single-spark EDM process
The discharge occurrence in EDM can be modeled as heating the work surface by plasma formed during the process. As cited before, previous researchers have mainly used disk heat source with uniformly distributed heat flux 9 or point heat source model 6 for thermal modeling of EDM process. However, these assumptions are simplistic and not in line with the real EDM process. In fact, recent experimental observations through spectroscopic techniques done by Kojima et al. 12 and Descoeudres et al. 13 have revealed that the temperature distribution within the plasma channel is non-uniform but rather very similar to a Gaussian sharing in which the temperature is maximum at the center of plasma channel. Moreover, the real shape of a crater formed by a single spark can best be approximated as Gaussian distributed. 19 Hence, it is imperative to apply a heat flux with Gaussian distribution as it is more reliable and realistic to characterize the heat flux inside the EDM plasma in terms of relevant process parameters controlling the discharge energy.
Figure 1 illustrates the ideal case in which a single spark has been modeled as a heat source with Gaussian-distributed heat flux with appropriate boundary conditions considering the axisymmetric nature of domain of the analysis. The next sections will elaborate more on the details needed to implement the FEM simulation of a single discharge.
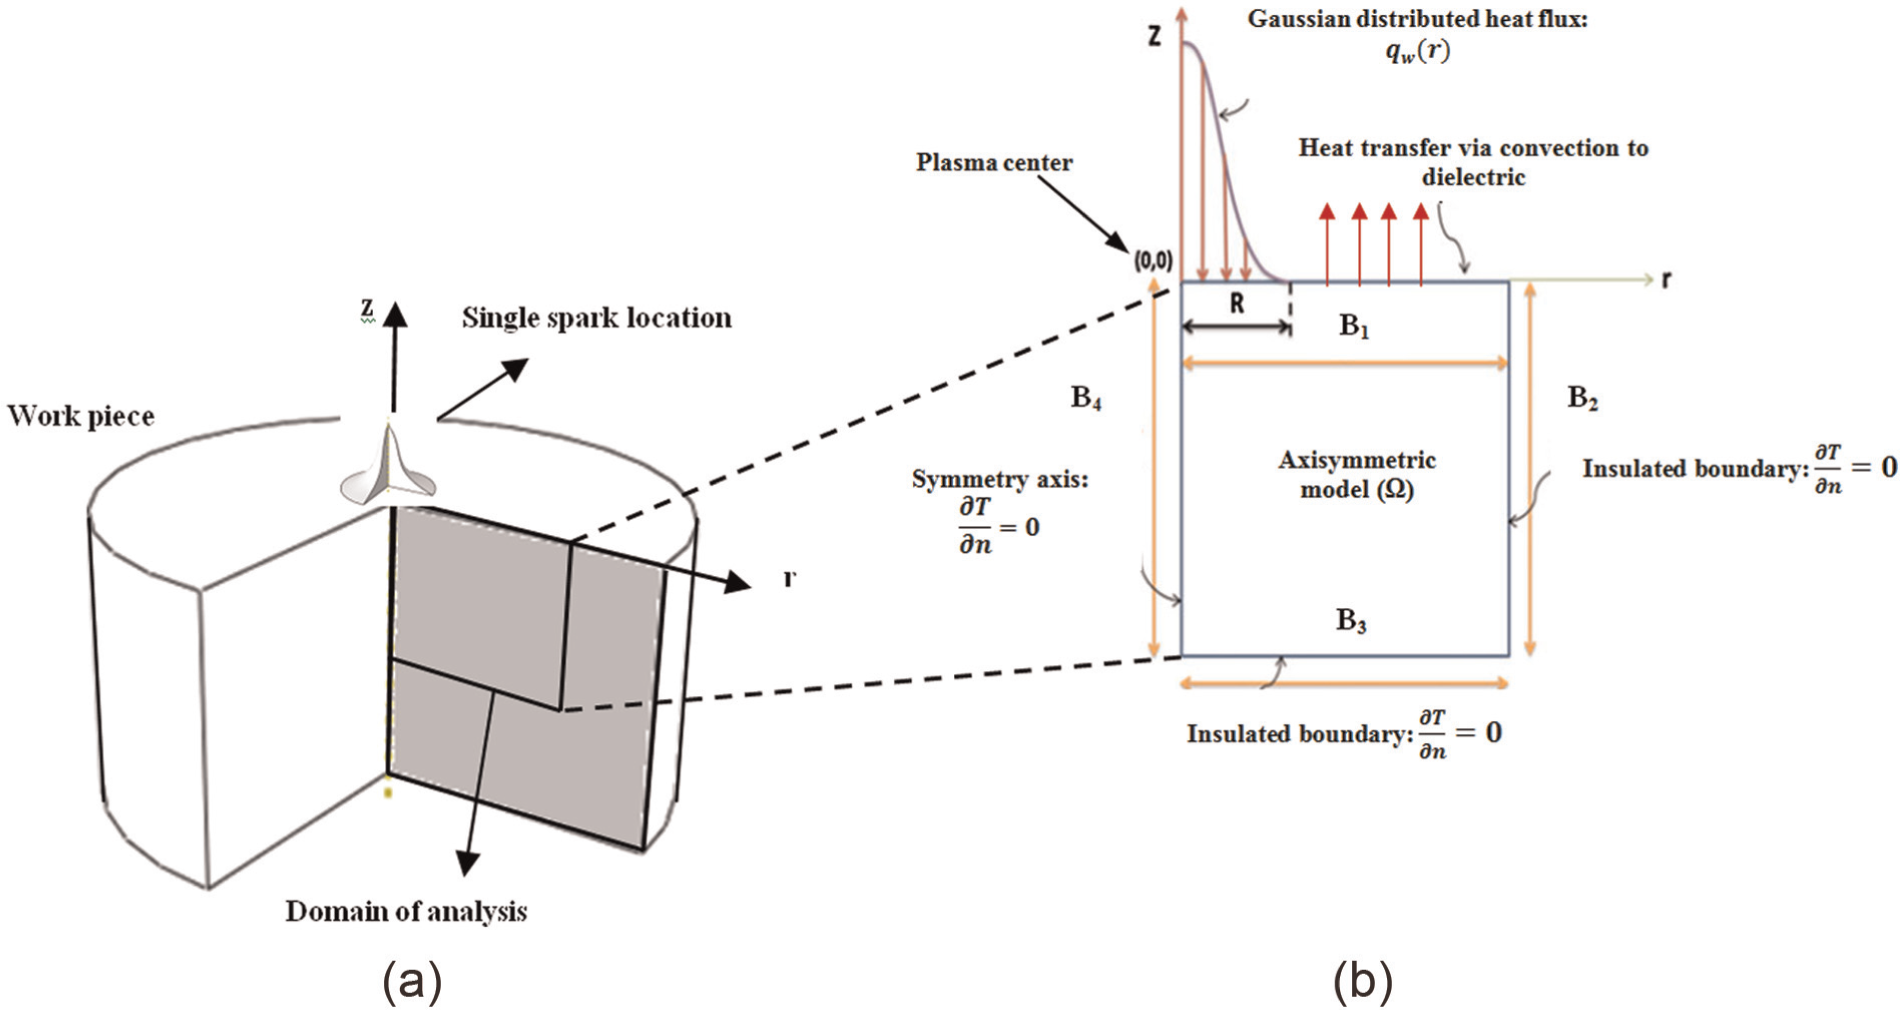
Thermal model of single-spark EDM process: (a) schematic representation of workpiece domain and (b) axisymmetric model with designated conditions.
Modeling assumptions
As the EDM is a highly complex and stochastic process, several suitable assumptions are needed to make its modeling approach mathematically tractable. They are as follows:
As the volume of material removed per each discharge is so small compared to workpiece and tool electrodes’ volumes, both the workpiece and tool are considered as semi-infinite bodies.
The investigated domain for thermal analysis is assumed to be axisymmetric with respect to r–z plane (see Figure 1).
Only one spark happens during each pulse, that is, every pulse duration (on-time + off-time) is equivalent to a single spark.6,20
Only a constant fraction of spark thermal energy is transferred to the workpiece, the rest is used for tool wear as well as dissipating via convection and radiation through the dielectric medium. 6 This assumption will be discussed more in section “Energy sharing in gap” and later on at the end of section “Effects of modeling assumptions on the accuracy of results and comparison with other approaches.”
Conduction is regarded as the main mode of heat transfer from the spark channel to the workpiece surface6,9,14 as the contribution of other mechanisms such as convection and radiation is negligible.
The workpiece is assumed to be homogeneous and isotropic while its thermo-physical properties such thermal conductivity, specific heat and density are considered temperature dependent due to the high temperature gradients created during discharging.
All the materials whose temperature exceeds the melting temperature are assumed to be effectively removed by the dielectric rush upon the collapse of plasma channel. In other words, there is no deposition of recast layer at the bottom of crater cavity formed at the end of each discharge.
Governing equation
It has been established that the main mode of heat transfer from the plasma channel to the work surface in EDM process is by conduction. Therefore, the principal equation, the Fourier transient heat conduction equation with no internal heat generation, which has to be solved, can be stated as follows
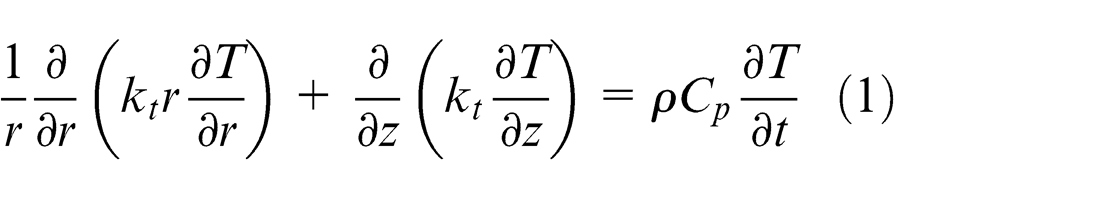
where T is the temperature; r and z are the radial and axial coordinates, respectively; t is the time; ρ is the density;
Input heat
Three main issues contribute to the formation of input heat in EDM, namely, plasma channel radius, heat flux function and energy share within gap during sparking. In order to provide suitable boundary conditions for the incident plasma on the work surface, they should be addressed properly and are explained in the following subsections.
Selection of spark radius growth function
The discharge channel radius is not constant, expands with time during discharging and depends on several factors such as spark energy, tool and workpiece materials as well as dielectric medium as was proved by Erden 21 and Natsu et al. 22 The most comprehensive relation proposed so far which is also used in this research is the one attributed to Ikai and Hashiguchi, 23 known as the semi-empirical equivalent heat source radius written as
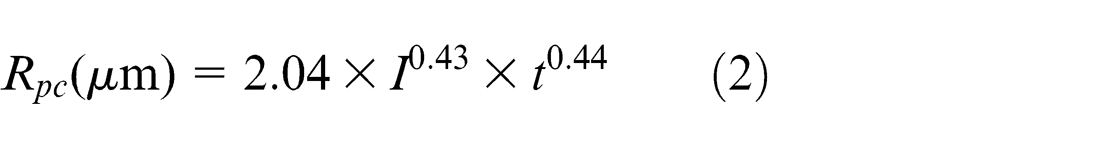
where
Selection of heat flux function
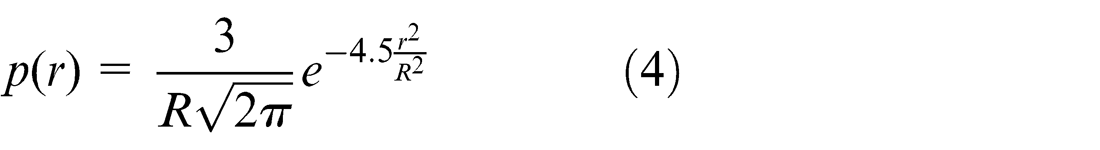
The probability density function of Gaussian distribution for a random variable (
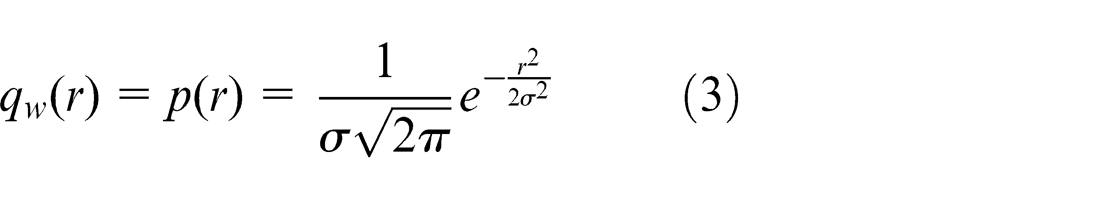
where
Assuming
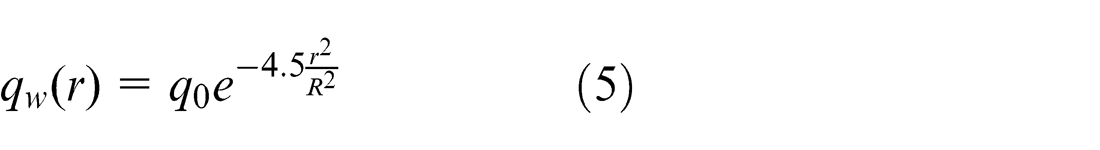
Hence, the total amount of thermal power supplied by the spark over the work surface is
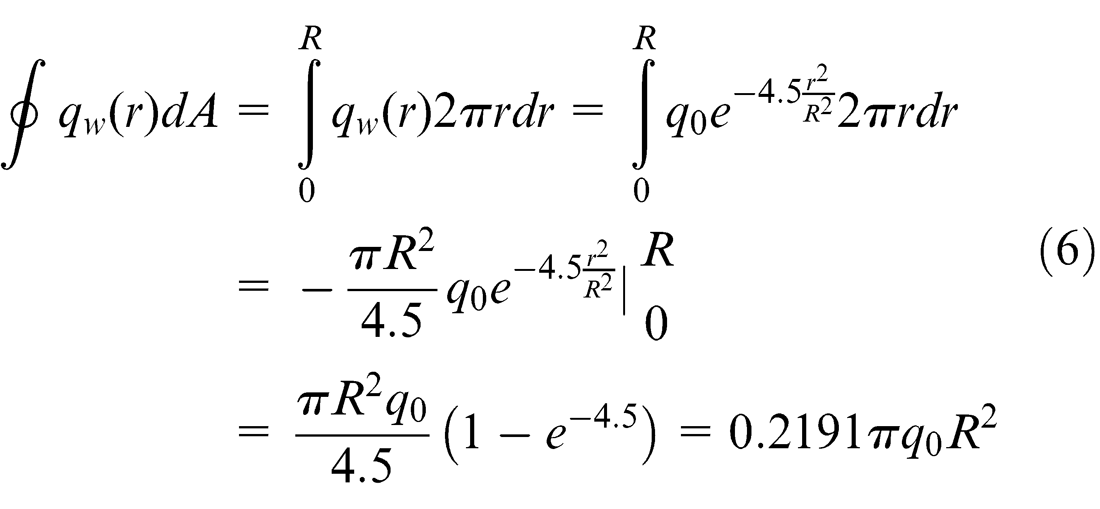
On the other hand, the effective amount of heat rate entering the workpiece can be identified to be a fraction of the overall electrical power, that is,
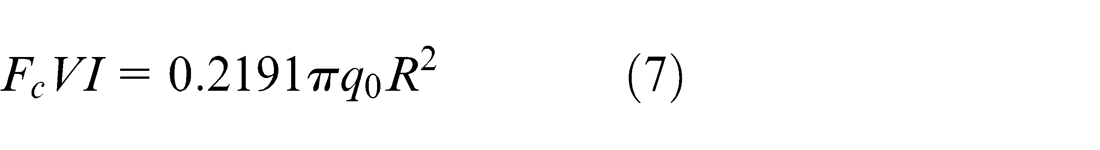
where
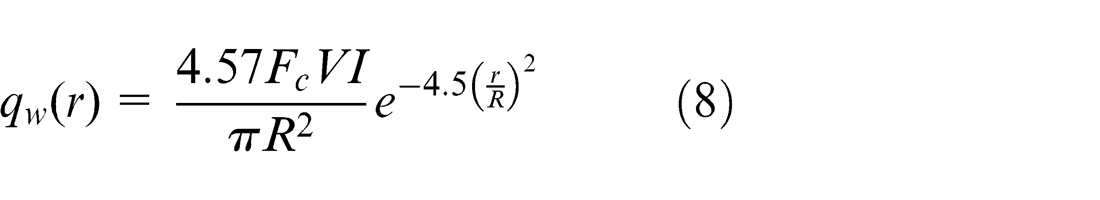
Since the plasma channel radius (R) expands with time till collapsing at the end of pulse on-time (see equation (2)), it can be inferred that the thermal flux in EDM depends on both discharge time (t) and radial position (r).
Energy sharing in gap
The real effective fraction of discharge energy entering each electrode (tool or workpiece) depends on a number of factors, such as thermal properties, flushing conditions, gap distance, conductivity of dielectric, polarity, discharge current and pulse duration.25–27 It is extremely difficult if not possible to define and identify a unique physical quantity fully reflecting the material properties and EDM conditions altogether to be used in assigning the energy share of each electrode.
In this regard, the literature presents a large discrepancy in selecting a reference value for the fraction of energy dispersing into the cathode workpiece (Fc ). It has generally been chosen as a constant percentage of the total discharge energy ranging from 14% to 50% by different researchers. 28 Yeo et al. 29 conducted a comparative study between five analytically based electro-thermal models of EDM suggested by earlier researchers and concluded that the predictive accuracy of MRR models can be enhanced should a proper value be assigned for Fc . Joshi and Pande 30 scrutinized further into the effects of various amounts of Fc on erosion rates of steel workpiece and concluded that this fraction does not vary substantially using copper tool in kerosene dielectric. On the other hand, using water as dielectric, Shankar et al. 15 suggested that about 40%−50% of thermal energy can be received by the 5 Cr die steel as the workpiece.
As can be inferred, there is not a universally accepted value for Fc as these reported amounts have all been obtained under specific circumstances with limited applicability. In this research, Fc has been set constant at 18% for simulation purposes. This has been experimentally verified to be a reliable quantity by DiBitonto et al., 6 which later was also reconfirmed to be used as a proper value of Fc while EDM of steel using copper tool in kerosene dielectric medium. 30 The validity of such a selection will be examined and discussed more at the end of section “Effects of modeling assumptions on the accuracy of results and comparison with other approaches.”
Boundary and initial conditions
According to Figure 1(b), the boundary conditions over the border B 1 can be written as
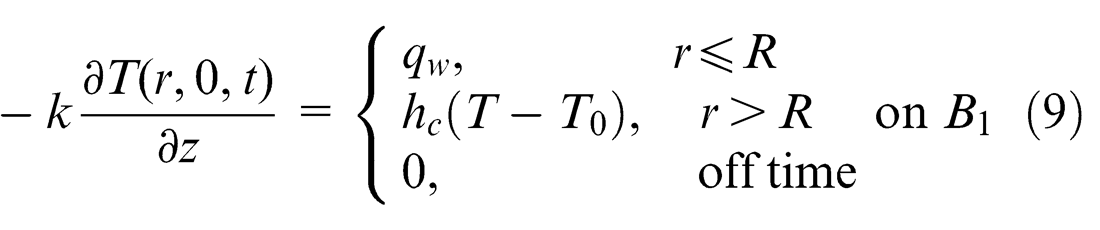
where qw
is the thermal flux generated by a single discharge expressed by equation (8), hc
the convective heat transfer coefficient due to the heat exchange between the upper face of workpiece and dielectric, T
0 the temperature of dielectric, k the thermal conductivity of workpiece and R the plasma channel radius (equation (2)). The boundaries B
2 and B
3 are supposed to be located far enough from the discharge location and can then be specified as insulated borders while the boundary B
4 acts as a symmetry line with no heat flux passing through it. Hence,
Latent heat of fusion due to phase change
In EDM, material removal takes place mainly by melting and vaporization phenomena. However, the contribution of vaporization is negligible compared to melting as a result of tremendously large dynamic pressures within the plasma channel which further restrict material evaporation.31,32 Therefore, to enhance the simulation accuracy, it is essential to include the latent heat of fusion which has been neglected by many researchers.6,16–18 To that end, the specific heat (CP ) is amended to yield the effective specific heat (CPeff ), using the following relation 33
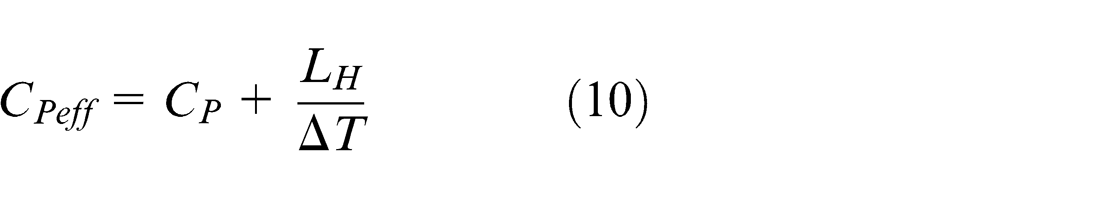
where LH is the workpiece latent heat of melting and ΔT = Tm − T 0 the temperature difference between melting point temperature and dielectric temperature (for the AISI 304 steel: LH = 247 kJ/kg to be released or absorbed over the temperature range of solidus temperature Ts = 1477 °C to liquidus temperature Tm = 1535 °C). 34
Finite element formulation and solution technique
Applying the variational method, 35 the principle governing equation (equation (1)) can be written in final assembled finite element (FE) form as
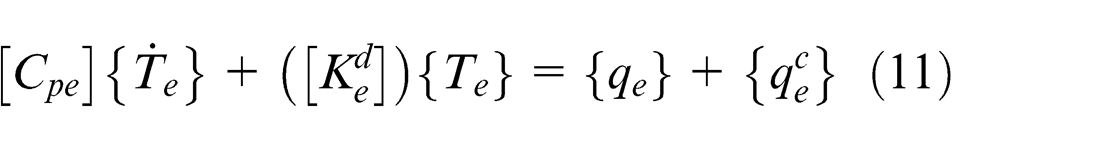
where
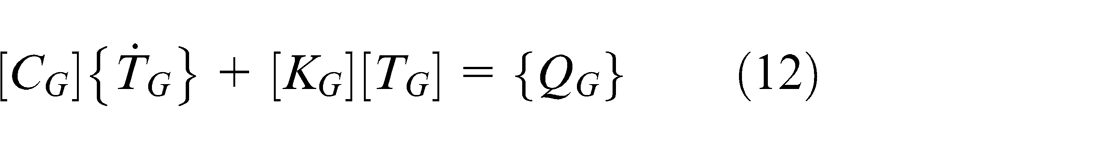
where
The FEM has an important feature over the analytical approaches, and that the temperature dependency of work material properties can be incorporated into the calculations. Table 1 shows the variable thermo-physical properties of the AISI 304 stainless steel as the material used in both simulation and experimental works, while Table 2 lists the variations in convective heat transfer coefficient with temperature over the top surface of work surface (see Figure 1).
Temperature-dependent thermo-physical properties of AISI 304 stainless steel used in simulations. 34
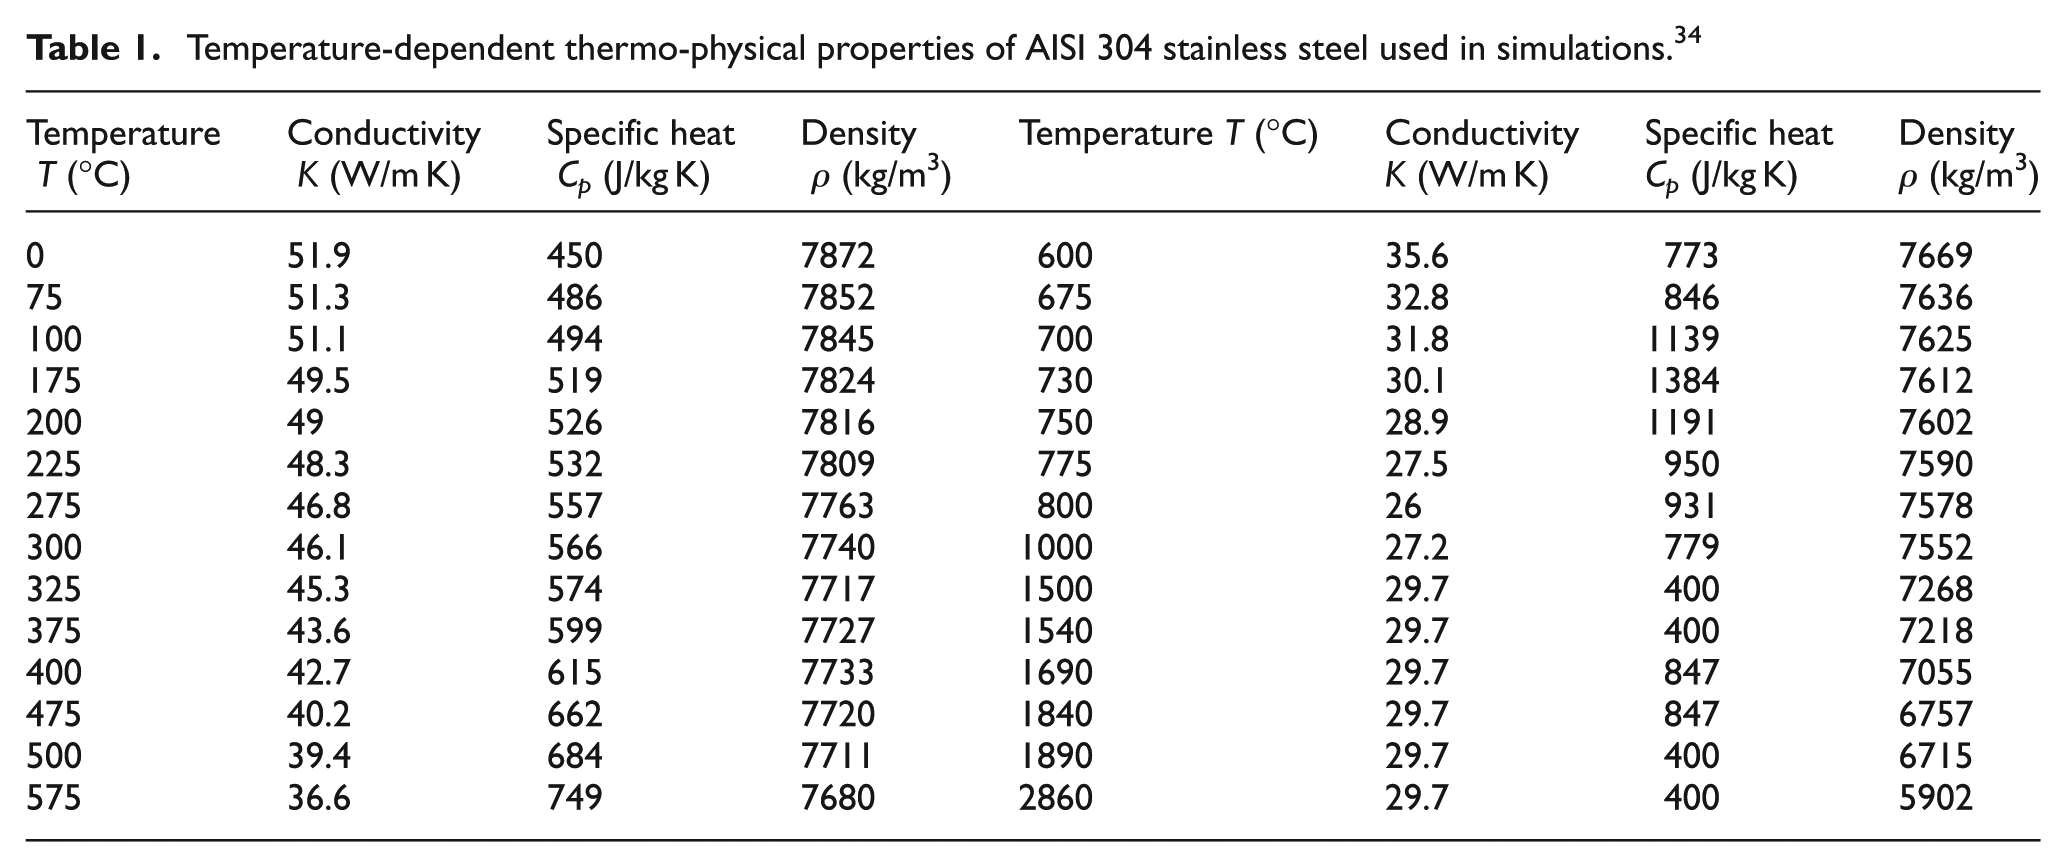
Temperature dependency of convection heat transfer coefficient (h) for kerosene dielectric medium. 36
Mesh, FEM parameter settings and model continuum geometry
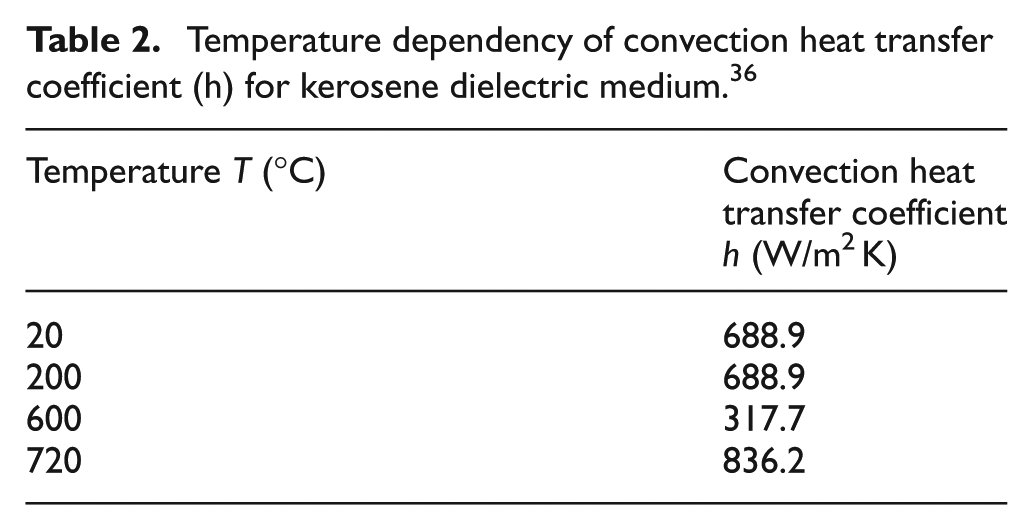
The workpiece is modeled using a 2D continuum with a dimension of 600 µm × 600 µm. In order to capture the extreme temperature gradients arising due to a single-pulse discharge, very small-sized elements should be assigned at the vicinity of discharge location. Hence, an area of dimension 200 µm × 200 µm with a much denser mesh quality is created within the entire domain of analysis, whereas beyond that the mesh density gradually decreases conveying a non-uniformly distributed FE mesh with much more elements mapped toward the heat-affected zone (Figure 2).
2D mesh of a quarter of workpiece used in simulations.
To code a non-uniform Gaussian distribution of heat flux with regard to time and distance imposed over the top surface of the workpiece, the user-defined subroutine DFLUX has been programmed in FORTRAN language and called during the simulation using ABAQUS FEM software, implicit (standard) module. It works by placing the local origin at the center of plasma channel (top left corner of workpiece) and calculating the value of heat flux at each time increment considering the radial distance of each node surrounding this center.
The boundary (B
2) should be far enough from the axis of symmetry (spark center) to be assumed as an adiabatic surface. Byron Bird et al.
37
introduced the parameter “thermal penetration depth (
where
Table 3 summarizes the most important parameters used for the FEM thermal analysis of a typical single-spark EDM process. To select the right element size, a number of simulations were done using elements of different sizes. 0.5, 1, 2 and 3 µm square-type elements were tried and the nodal temperatures were obtained and recorded. Figure 3 shows the comparison of temperature distribution profiles along a typical radial path of 10 µm length on top of the workpiece surface. As is clear, subtle discrepancies can be observed among these cases, especially when the element size is taken to be 1 or 2 µm. As an instance, the peak temperatures at the plasma center are 25362.57 °C, 25362.62 °C, 25362.64 °C and 25358.99 °C for the four aforementioned element sizes, respectively. Similar results have also been obtained along other paths. It is to be mentioned that all the simulations were done on an Intel Pentium IV of 2 Quad Core CPU with 3.23 GB RAM and the times taken to fulfill the tasks were about 83, 20, 6 and 2 min, respectively. Therefore, in view of getting a reliably stable solution within a suitable time frame needed to run the simulation procedure, the optimum element size can be considered to be 2 µm providing a higher computational efficiency. In this case, the considered area will have a total number of 20,201 elements (Figure 2).
Parameters used for a typical single-discharge FEM simulation.
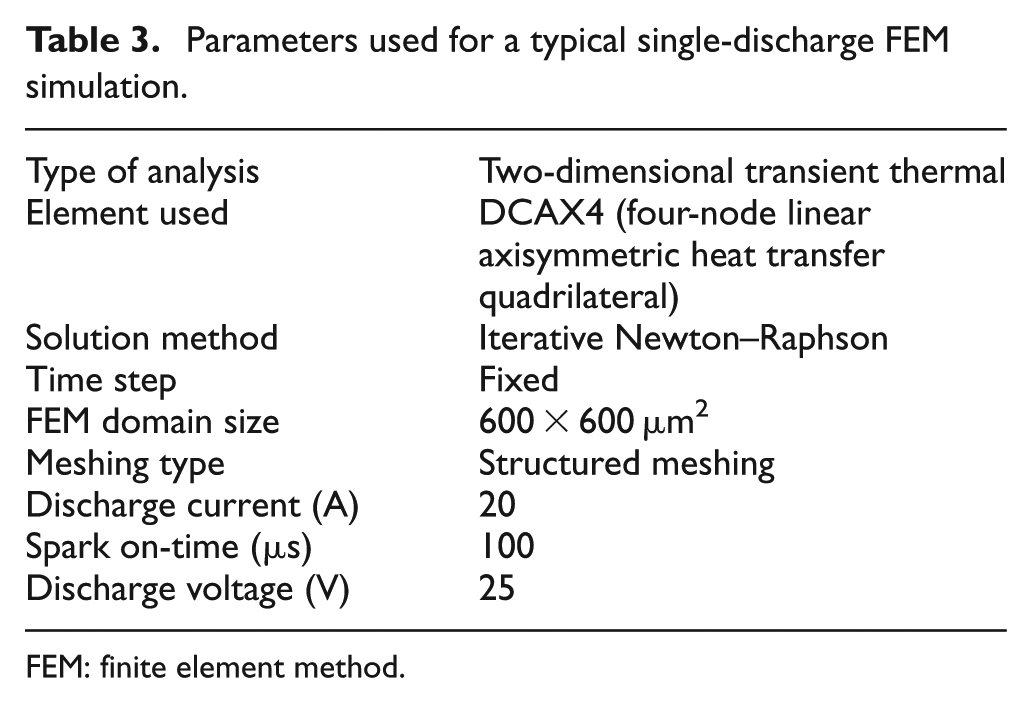
FEM: finite element method.
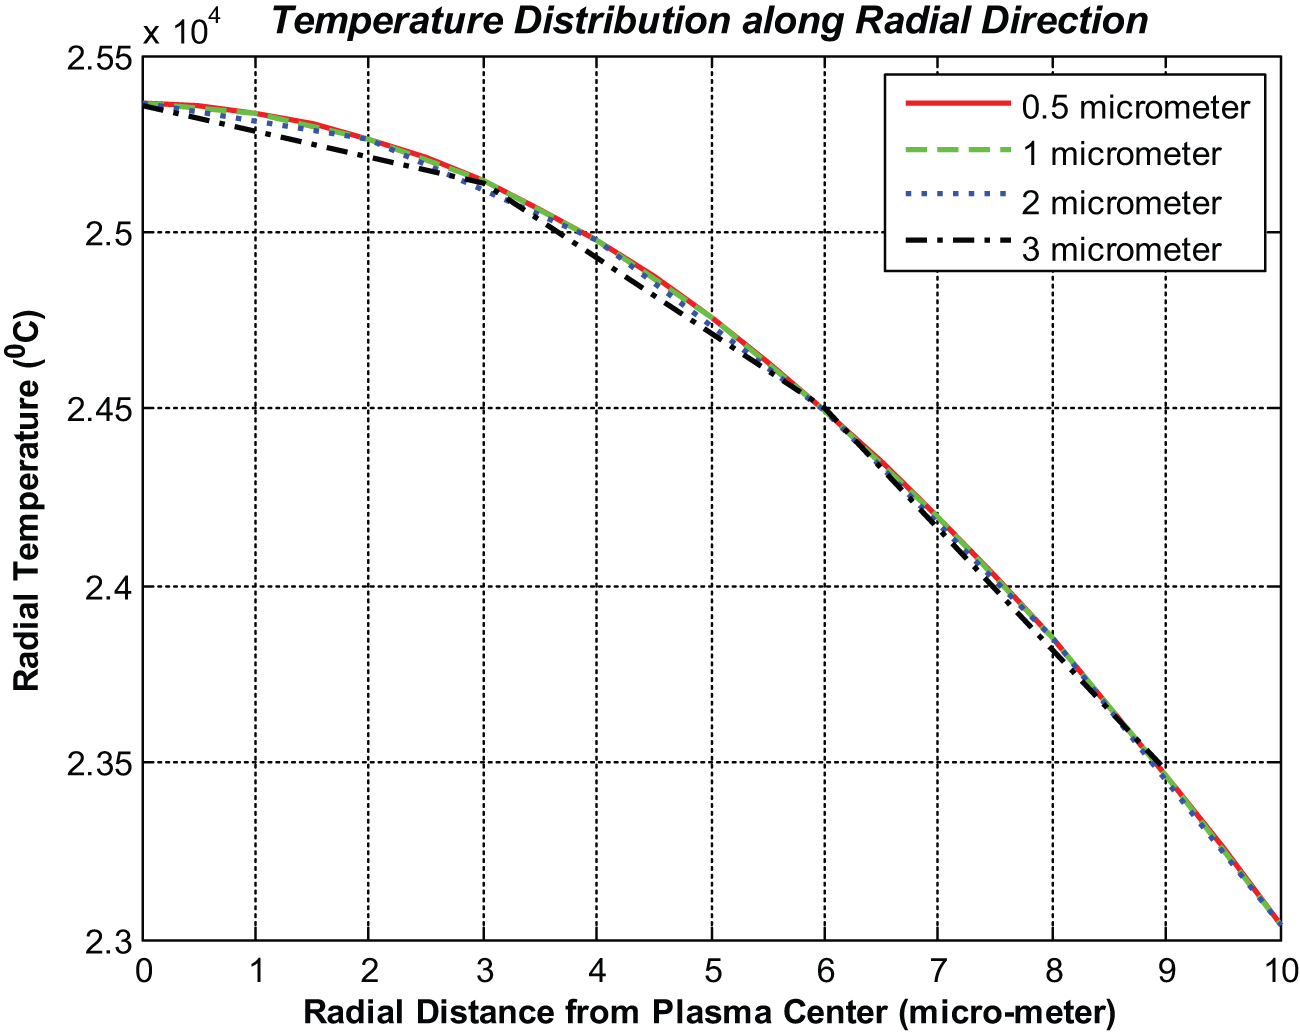
Comparison of simulation results with different element sizes (I = 20 A, Tdis = 100 µs and Vdis = 25 V).
Experimental details
The literature reveals very limited experimental studies on the shape and size of a real crater formed as a result of single discharge. As there is no commercially available apparatus to produce single sparks, an in-house single-spark experimental setup which was specifically designed and built in the laboratory was used to verify the FEM simulations of crater formation under the same conditions. It produces a unique discharge each time by creating a single pulse, the characteristics of which could be selected on the machine manually. Figure 4(a) and (b) illustrates a sample of tool/workpiece used in single-spark experiments and the experimental rig with a close view of discharge cell and different enumerated components, respectively. Side flushing was applied using kerosene as the dielectric liquid while the work specimen was submerged within the tank. A minimum gap distance needs to be attuned so as to be able providing suitable conditions leading to the occurrence of a single-spark over the work surface. A manual adjusting wheel driving the head and positioning the tip of cone-shaped tool electrode over the work surface has been used to control and maintain a constant distance between the tool and the workpiece as the spark gap along the Z-axis. Once the tool comes into contact with the work surface, an alarm buzzer alerts the operator that a zero gap width has been reached. The gap span can then be adjusted and controlled by revolving the manual wheel in a reverse direction with the help of an installed dial indicator (micrometer) having 0.01-mm accuracy.
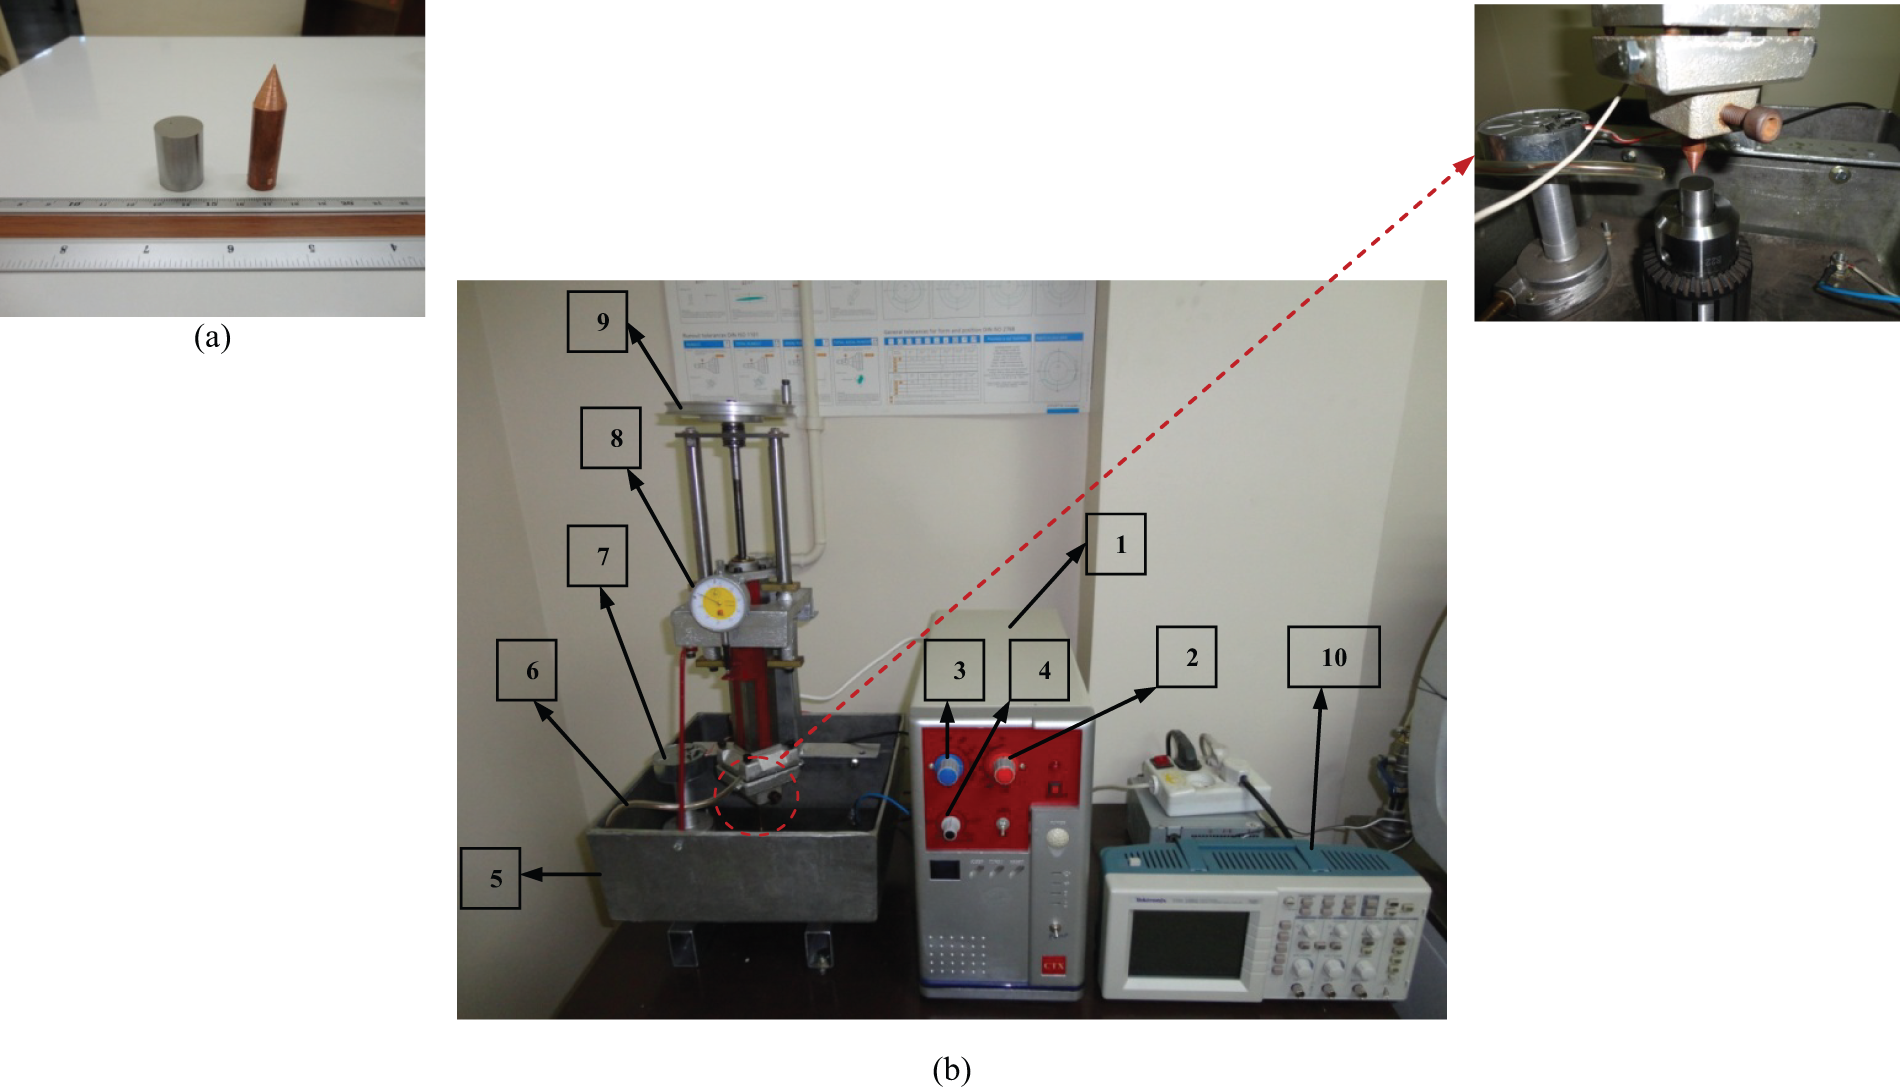
(a) Sample of tool/workpiece. (b) Single-spark experimental setup with a close view of discharging cell.
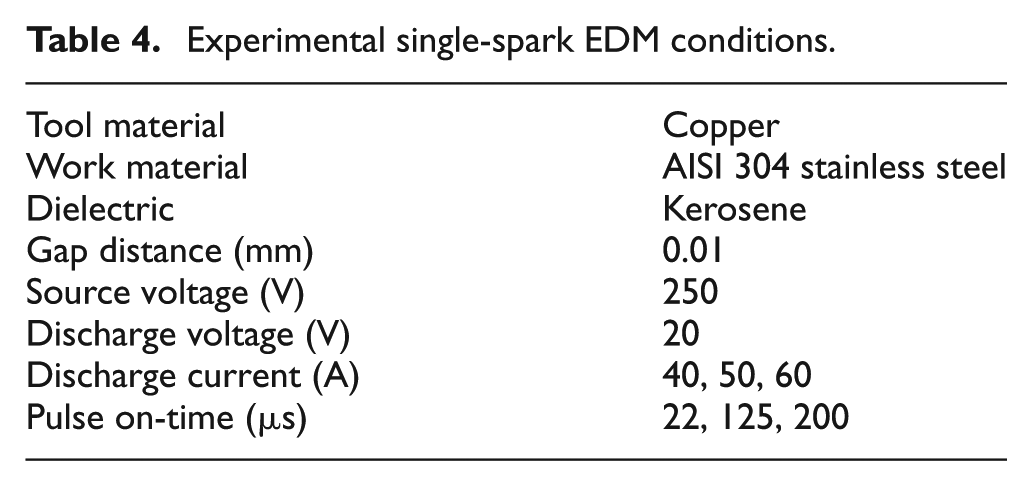
Before running tests and to better observe and measure the dimensions of cavities formed due to single sparks, the workpiece surfaces were first ground and then polished by a very fine emery sheet till a mirror-like finish was obtained. The discharge waveforms of EDM, that is, discharge pulse voltage and discharge pulse current, reflect the amount of discharge energy released during sparking and it is of vital importance to accurately measure and record these values to verify the results of FEM simulations. A Tektronix two-channel digital storage oscilloscope, model TDS 1002, 60 MHz sampling rate, was employed and suitably connected to the experimental setup (Figure 4(b)) to capture the discharge waveforms and quantify the relevant amounts of discharge current and gap voltage. Figure 5 shows a sample of the discharge waveforms of the first single-spark trial according to the parameters: Vdis = 20 V, Idis = 40 A and Tdis = 20 µs, obtained by the oscilloscope during sparking. Table 4 summarizes the conditions that could normally be set on the machine to carry out single-spark experiments. Several replications were made for each parametric combination to ensure achieving reliable data.
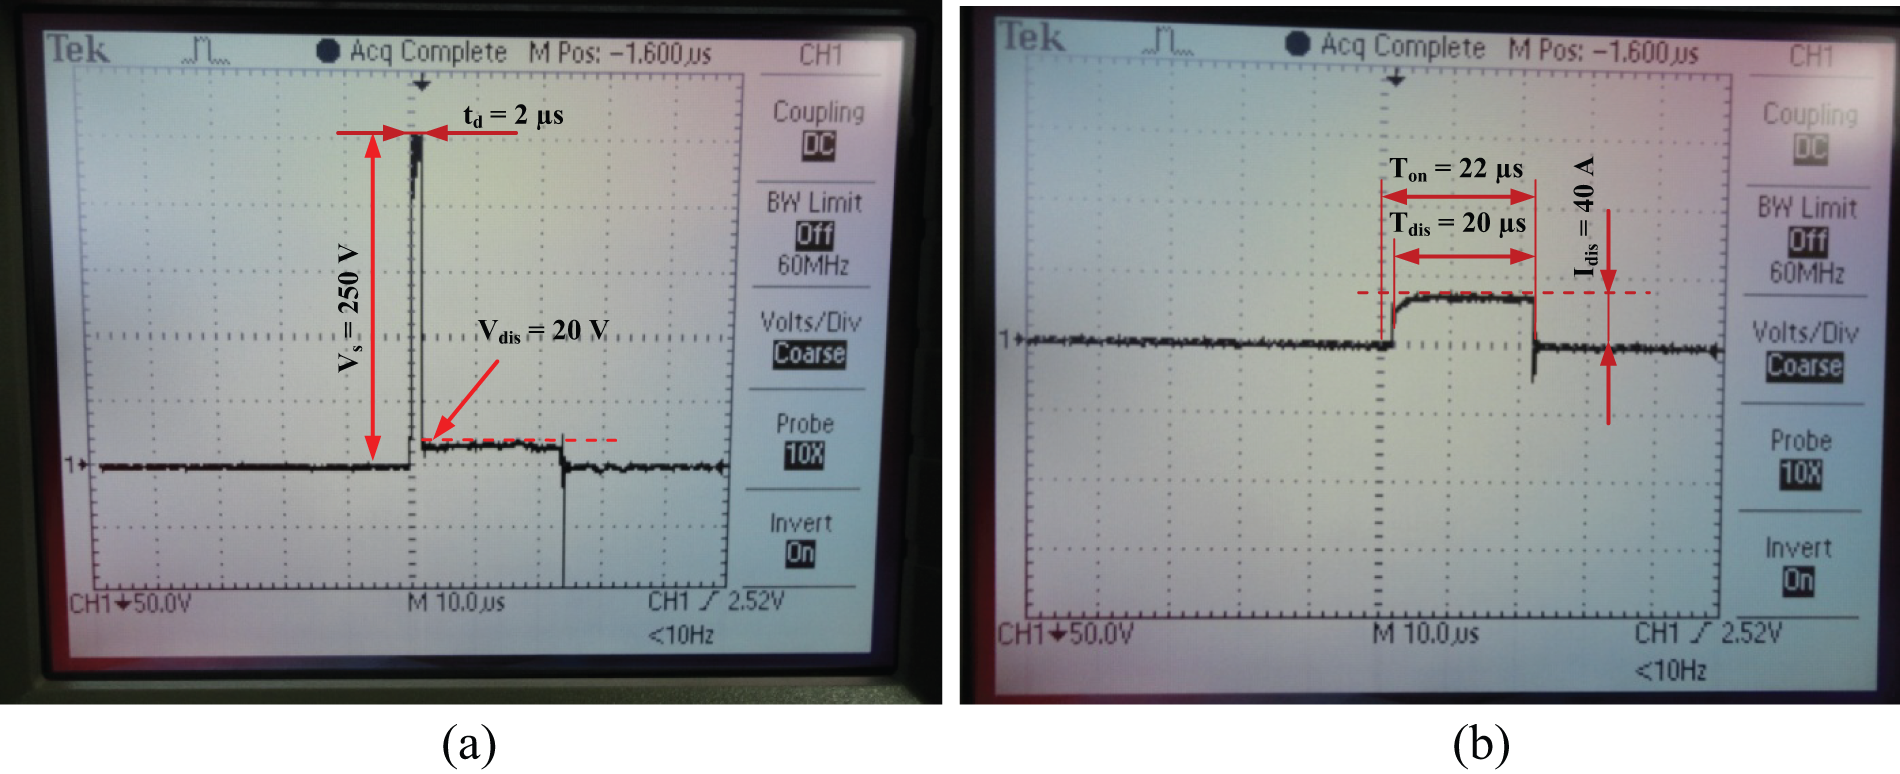
Typical discharge waveforms captured by oscilloscope and characterized for spark energy: (a) voltage pulse and (b) current pulse (source voltage Vs = 250 V, discharge voltage V = 20 V, discharge current Idis = 40 A, pulse on-time Ton = 22 µs, discharge delay time td = 2 µs, and discharge duration T= 20 µ; where these values have been obtained based on the scales set for each unit on the relevant coordinate axes; 50 V and 10 µs for the vertical and horizontal units, respectively).
Experimental single-spark EDM conditions.
Optical metallographic microscope, METALLUX 3, manufactured by LEITZ Company, Germany, equipped with Image Analyzer software has initially been used to observe crater morphologies at 50× magnification and approximately measure the corresponding radius of each crater cavity formed. Figure 6 illustrates the microscopic image of the respective crater formed. Preliminary evaluation through optical microscope estimates the average crater radius as 48.2 µm. As can be seen, a somehow circular-type crater with a portion of molten metal condensed around its edge is evident. The is due to the abrupt collapse of discharge power at the very end of pulse on-time as well as the cooling effect of cold dielectric rushing into the discharge spot, which, in turn, results in the distribution and protrusion of molten material around the crater rim. 38
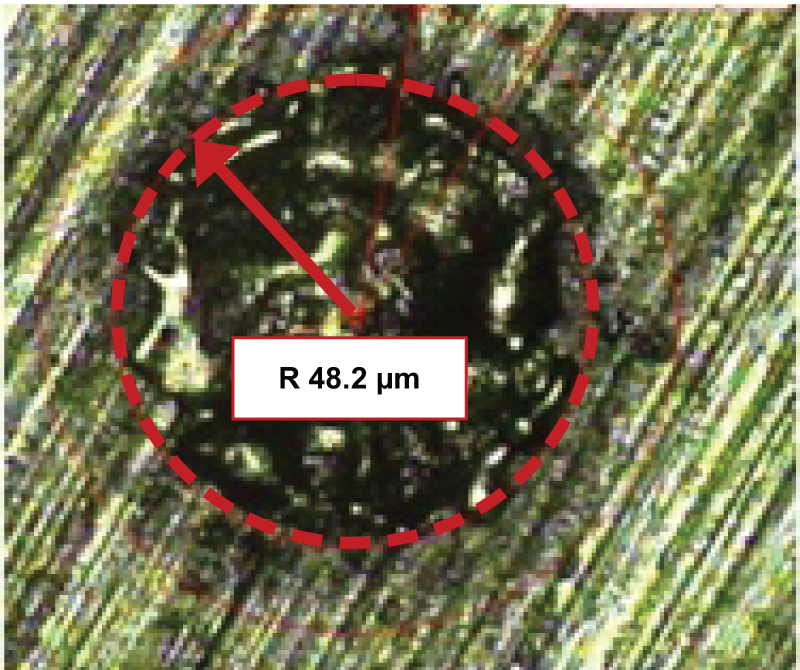
Microscopic image of the crater formed (Idis = 40 A, Tdis = 20 µs and V = 20 V).
In addition, each crater has been examined by Form Talysurf Series 2, a three-dimensional (3D) topography measurement instrument, from Taylor Hobson Company, to better analyze and reveal the crater surface morphology. Figure 7(a) shows the 3D image of the crater cavity produced as per the discharge conditions illustrated in Figure 5. The shape of the cavity has been examined at different sections and Figure 7(b) depicts a typical cross-sectional view chosen for further analysis. As it is clear, the shape of the cavity is neither hemispherical nor disk-like as was assumed by previous researchers,6,39–41 but rather bowl shape in appearance. Crater diameter and depth have been measured as the major geometrical features. The diameter is 95.2 µm (i.e. radius of 47.6 µm) measured as the pick-to-pick distance and maximum depth of 27.6 µm.
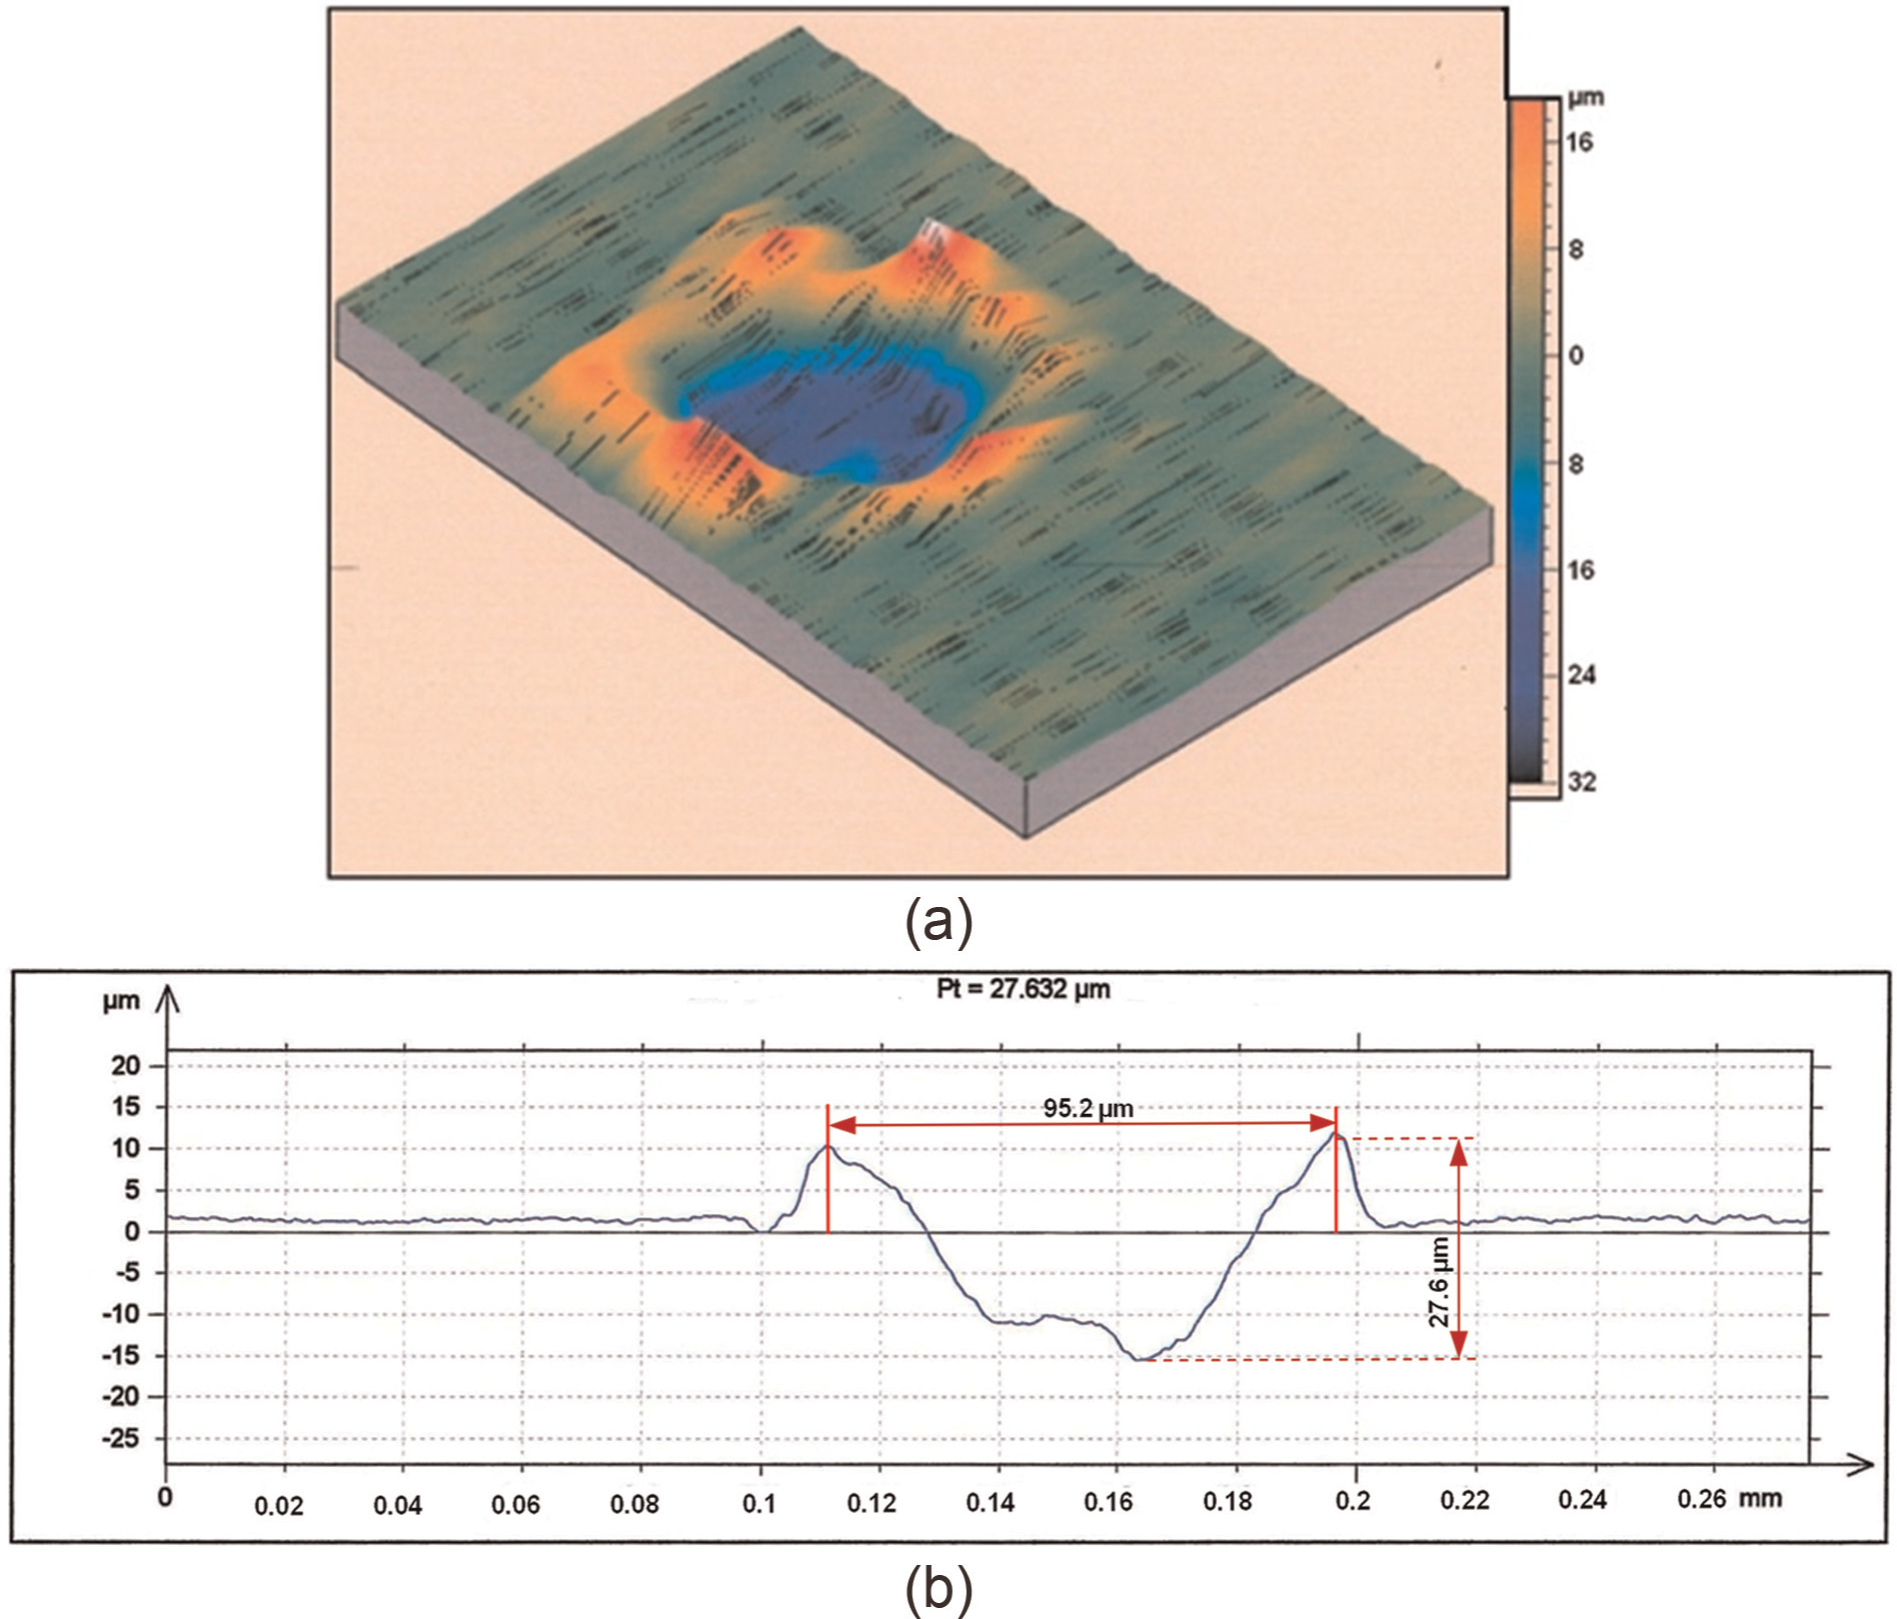
Surface morphology of a typical single-spark depression: (a) 3D view and (b) crater shape and dimensions (Idis = 40 A, Tdis = 20 µs and Vdis = 20 V).
As an example, the corresponding FE simulation of a single spark with respect to crater cavity size and shape will be illustrated later for comparison with the current typical experimental finding.
Results and discussions
Evolution of temperature and crater formation
Solution of a heat conduction problem usually indicates the time dependence of temperature at a fixed location in space. An alternative solution, particularly useful for moving boundary problems, is to calculate how specified temperatures move through the heat conducting medium at specified times, using an “isotherm migration method.” 42 Figure 8(a)–(f) shows the temperature distribution profiles and propagated melting fronts for a representative single-discharge setting as per Table 3, obtained at three distinct conditions, the initial state (t = 5 µs), middle of spark on-time (t = 0.5Tdis = 50 µs) and end of discharge duration (t = Tdis = 100 µs). As can be seen, the isothermal profiles are like quartile concentric circles from the discharge center.
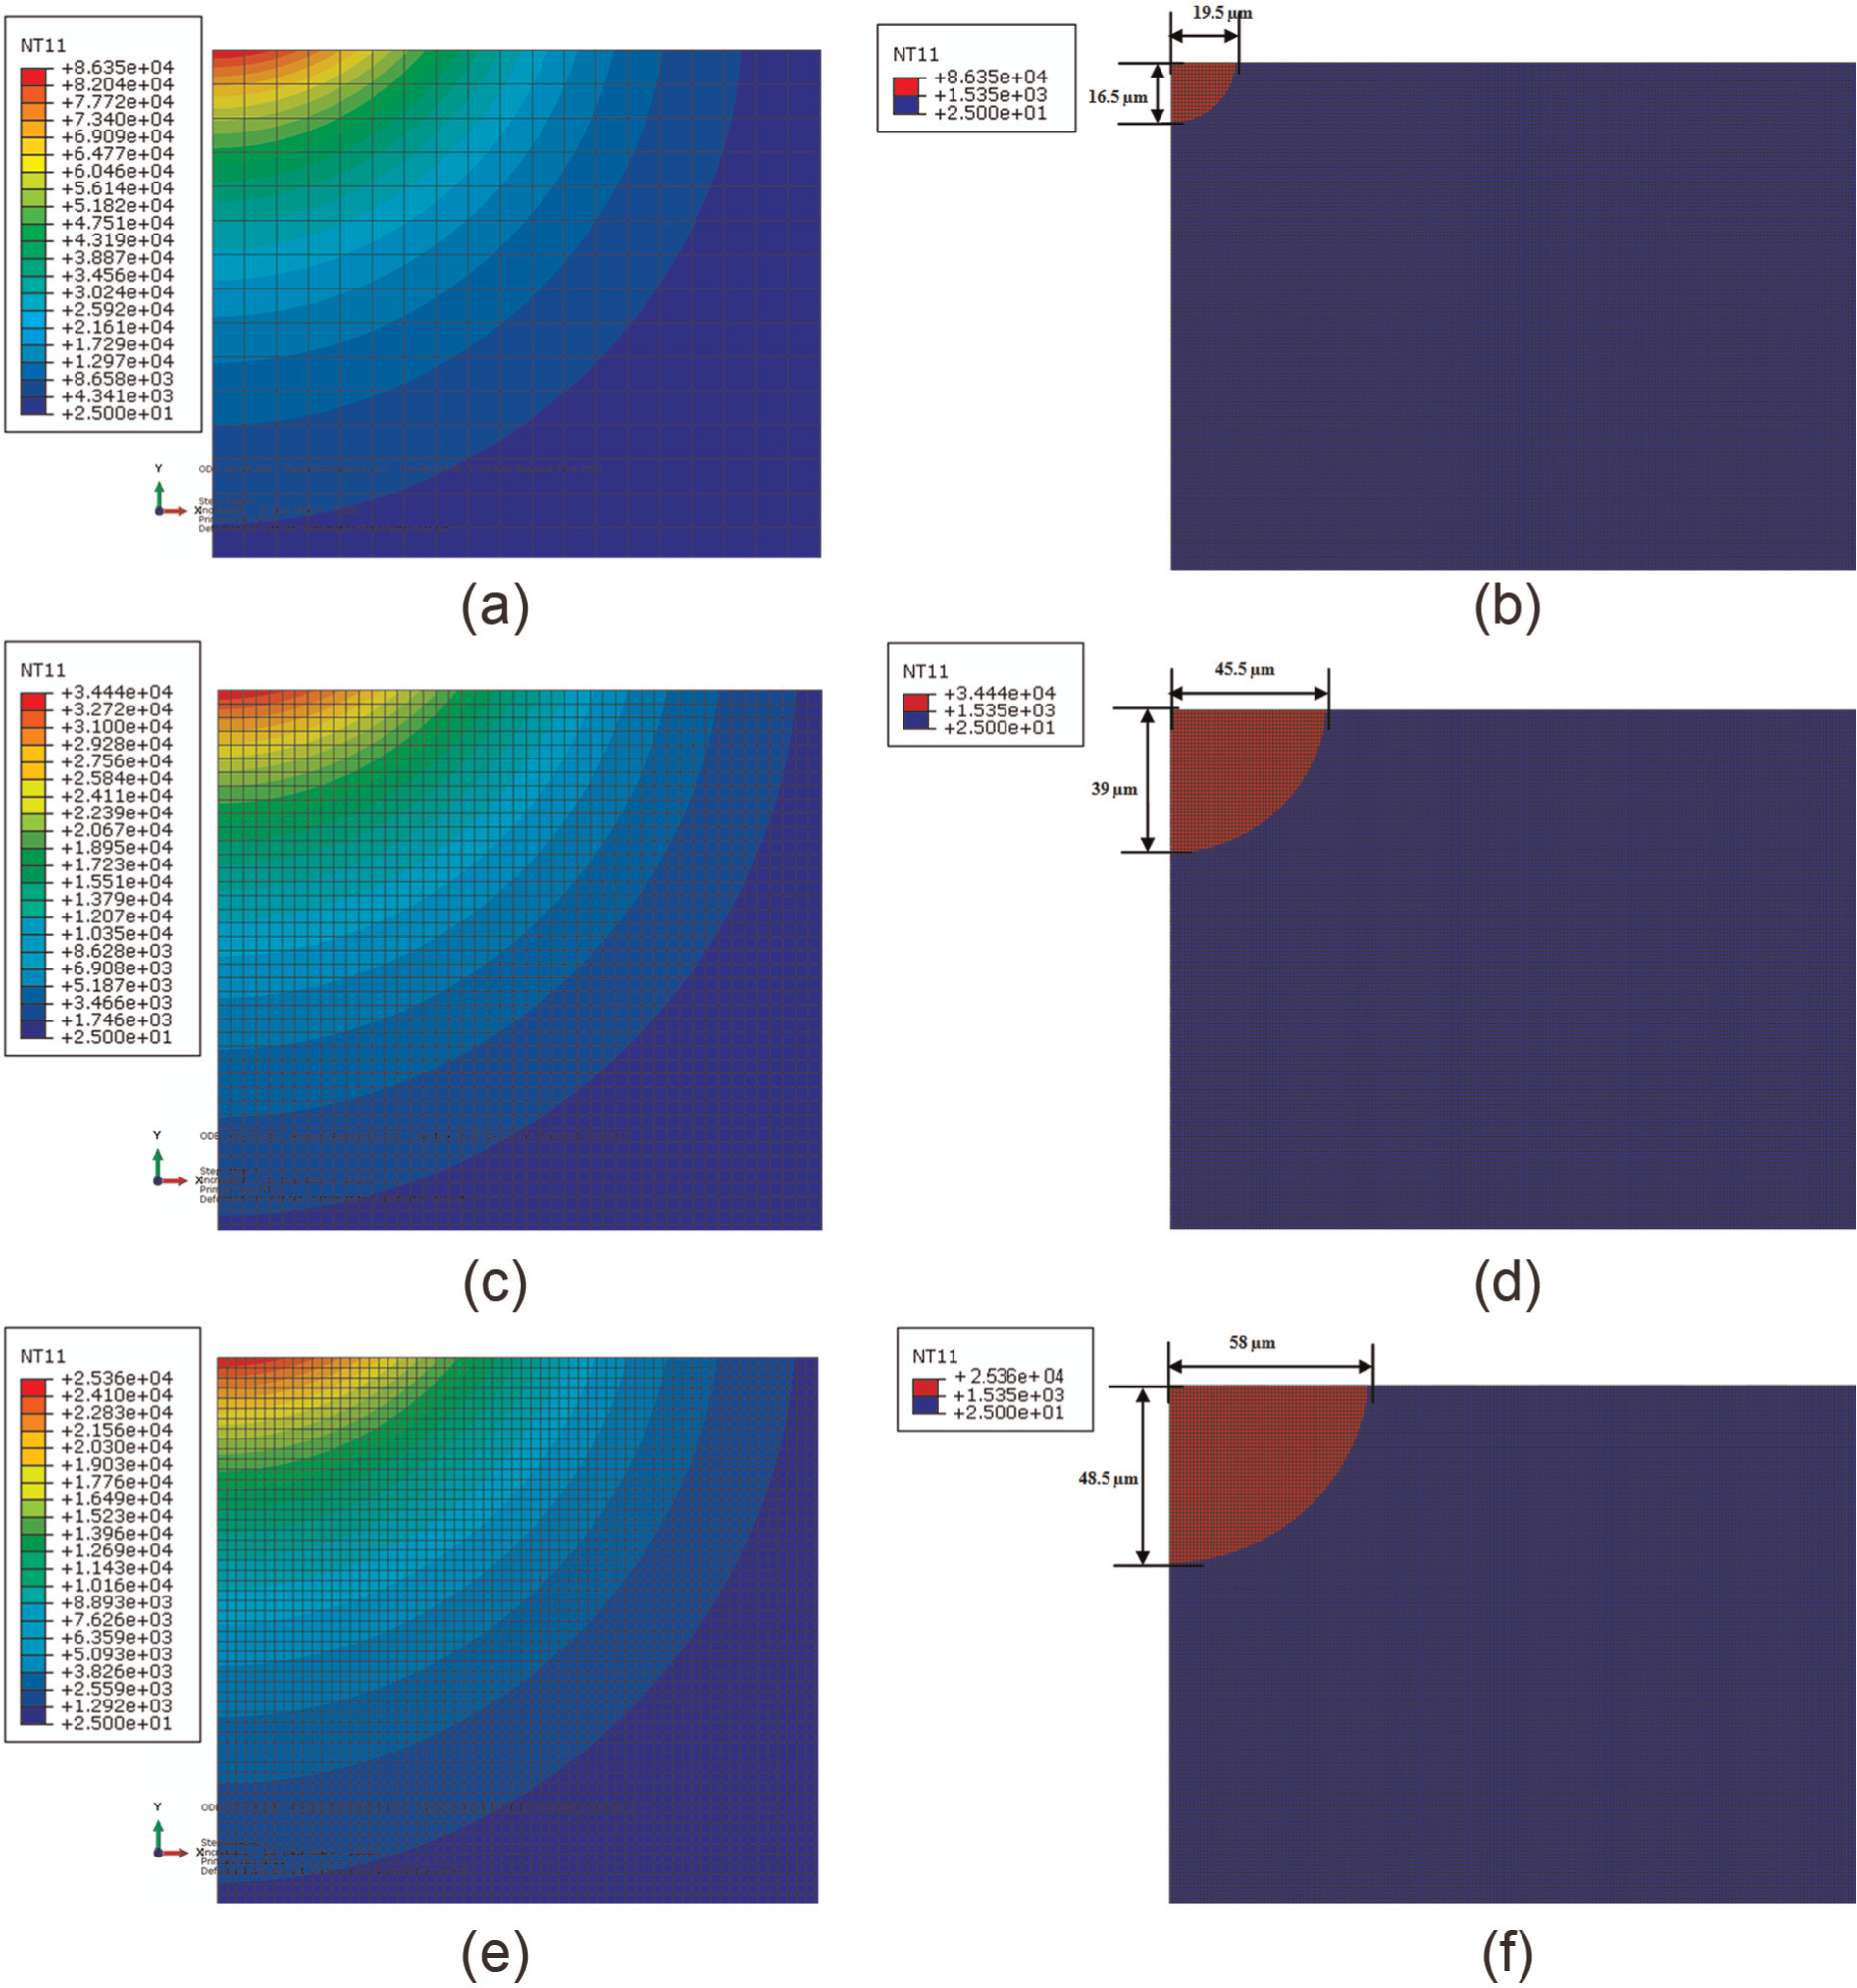
Temperature distribution contours and propagated molten border at three different discharge steps: (a, b) t = 5 µs, (c, d) t = 0.5 Tdis = 50 µs and (e, f) t = Tdis = 100 µs for I = 20 A and Vdis = 25 V.
From Figure 8(a), it can be observed that the work surface experiences very high temperatures at the early stages of discharge, up to about 8.6 × 10⁴ °C as the maximum temperature which occurs at the center of plasma channel due to the nature of Gaussian flux distribution. This temperature is absolutely high enough to melt and even vaporize the workpiece. Meanwhile, the molten boundary, obtained by eliminating all the elements whose temperatures exceeded 1535 °C (the melting point of AISI 304), spreads only to a small volume of material, 19.5 µm/16.5 µm as the ratio of radius/depth of crater as shown in Figure 8(b). Temperature profiles and the formed molten cavity right at the center of discharge duration have been depicted in Figure 8(c) and (d), respectively. It is interesting to note that the peak temperature now gets a smaller value, decreased to about 3.4 × 10⁴ °C, more than 50% lower than the previous case. The reason can be attributed to the growth of plasma channel with time which results in lower density of discharge energy over the involved area. 43 However, the temperature is still large enough to melt the workpiece as the volume of melted puddle extends to a relatively larger volume, radius 45.5 µm × depth 39 µm. The decreasing trend of temperature distribution continues till the end of discharge duration when the highest temperature now gets the lowest amount compared to the two aforementioned cases (about 2.5 × 10⁴ °C, Figure 8(e)). Nonetheless, the induced heat has got adequate time penetrating into the bulk material as the yielded molten cavity reached to its largest value having a size of radius 58 µm × depth 48.5 µm under the simulated conditions (Figure 8(f)). In general, the utmost temperature varies between 2.5 × 10⁴ °C and 8.6 × 10⁴ °C, which is on the analogous order of 6 × 10⁴ K as theoretically predicted by Eubank et al. 8
Figure 9 illustrates the temperature history of the point locating at the center of plasma channel over the time interval of discharge duration. It can easily be observed that the temperature increases drastically within the first microseconds after the discharge initiation due to the instantaneous application of spark flux, and that there exists an extremely sharp temperature gradient during the early stages of discharge after which a continuous decreasing trend is followed until the end of discharge time.
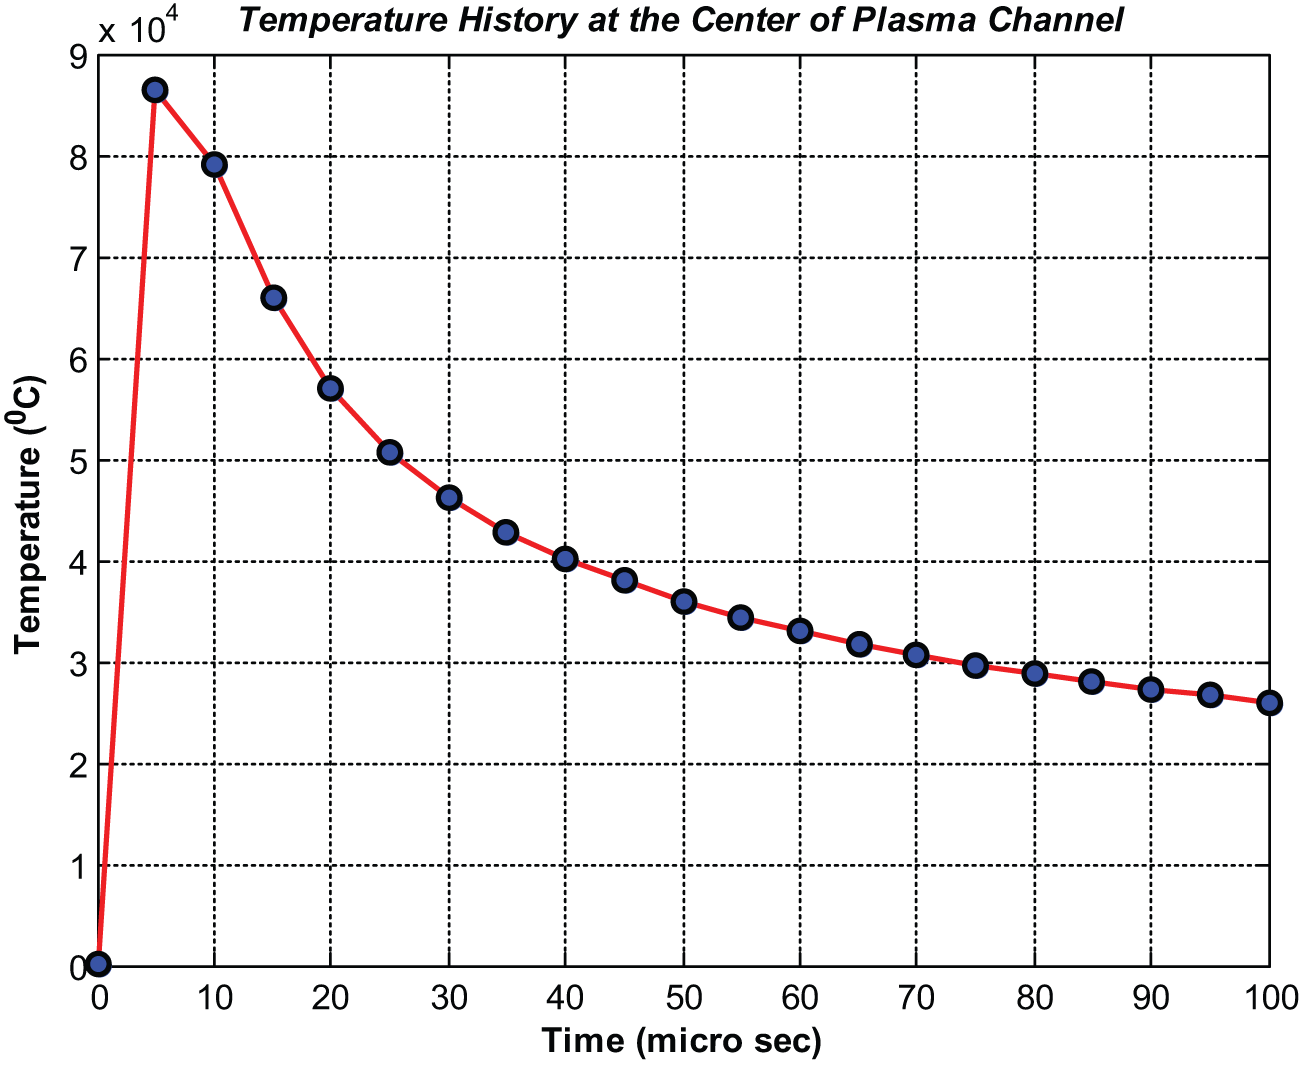
Temperature history of the point at the center of plasma channel (I = 20 A, Tdis = 100 µs and Vdis = 25 V).
Figure 10 depicts the temperature distribution profiles alongside both the radial and subsurface directions obtained at two different times, the middle and end of discharge. It can be inferred that the temperature profiles along the axial way possess rather higher gradients than those at radial direction for both simulated conditions. Furthermore, as expected, the feature of Gaussian trend is also reflected by the temperature profiles. As the discharge time passes more, the volume of melted and evaporated material gets higher values while the peak temperature decreases progressively.
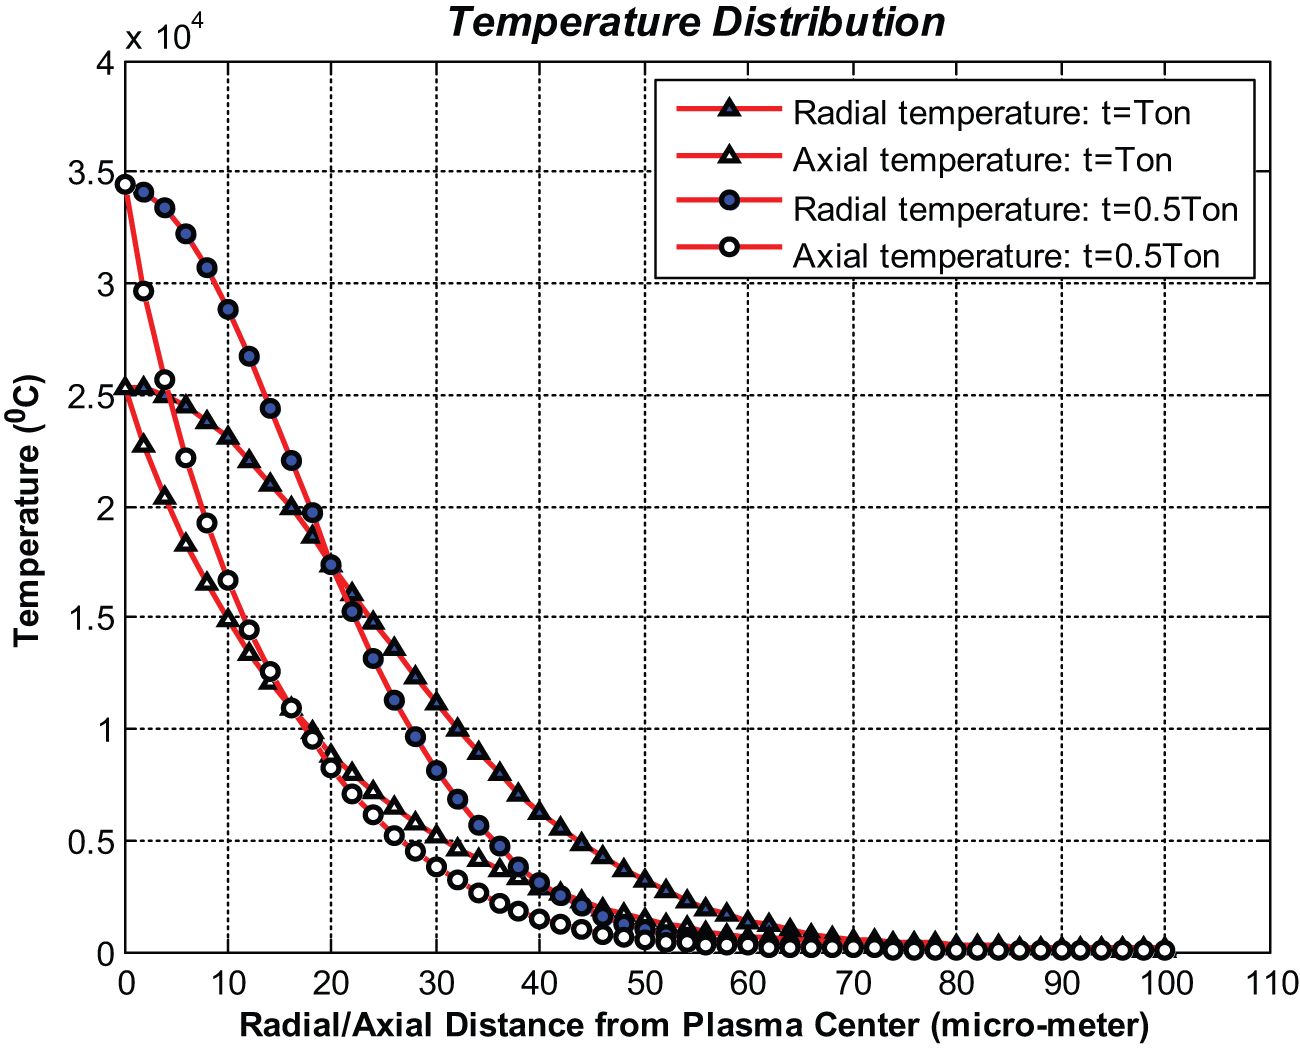
Temperature distribution profiles along radial and subsurface directions at the middle and end of discharge duration (I = 20 A, Tdis = 100 µs and Vdis = 25 V).
The experimental validation of temperature variations and magnitudes with respect to time and position is extremely difficult if not possible due to a very short time interval and size over which a single discharge takes place. However, the final resultant effect of a single spark impinging on the workpiece surface, that is, the formation of crater cavity, can be verified in terms of its size and outline. The results obtained before through running single-spark experiments are used here to verify the simulation results.
Model validation
The FE simulation of crater formation has been done at the same machining conditions reported in section “Experimental details” and the results have been shown in Figure 11(a) and (b) as the molten pool and final resultant cavity, respectively. Only half of the workpiece was depicted as a cross-sectional view due to the axisymmetric assumption of the analysis domain we made before. Elements kill technique has been applied to obtain the border of cavity. It works by removing all the elements whose temperatures exceed the melting temperature of the work material (1535 °C) at the end of discharge making it possible to visualize a hollow area as the crater boundary. Hence, the corresponding values of simulated dimensions are 39 and 31.5 µm for the crater radius and depth, respectively. The discrepancies between the FE-generated and experimental values (Figure 7) are due mainly to the deposition of a portion of melted material over the crater surface known as recast layer. In practice, not all the molten metal can be evacuated at the end of the pulse, which subsequently gets re-solidified. Therefore, the real crater is to some extent shallower than the ideally obtained one. Moreover, the measured crater radius is bigger than the simulated one which is definitely due to the splash of molten material around the crater rim as a result of sudden drop of plasma channel pressure at the end of discharge time and quenching effects of molten material.
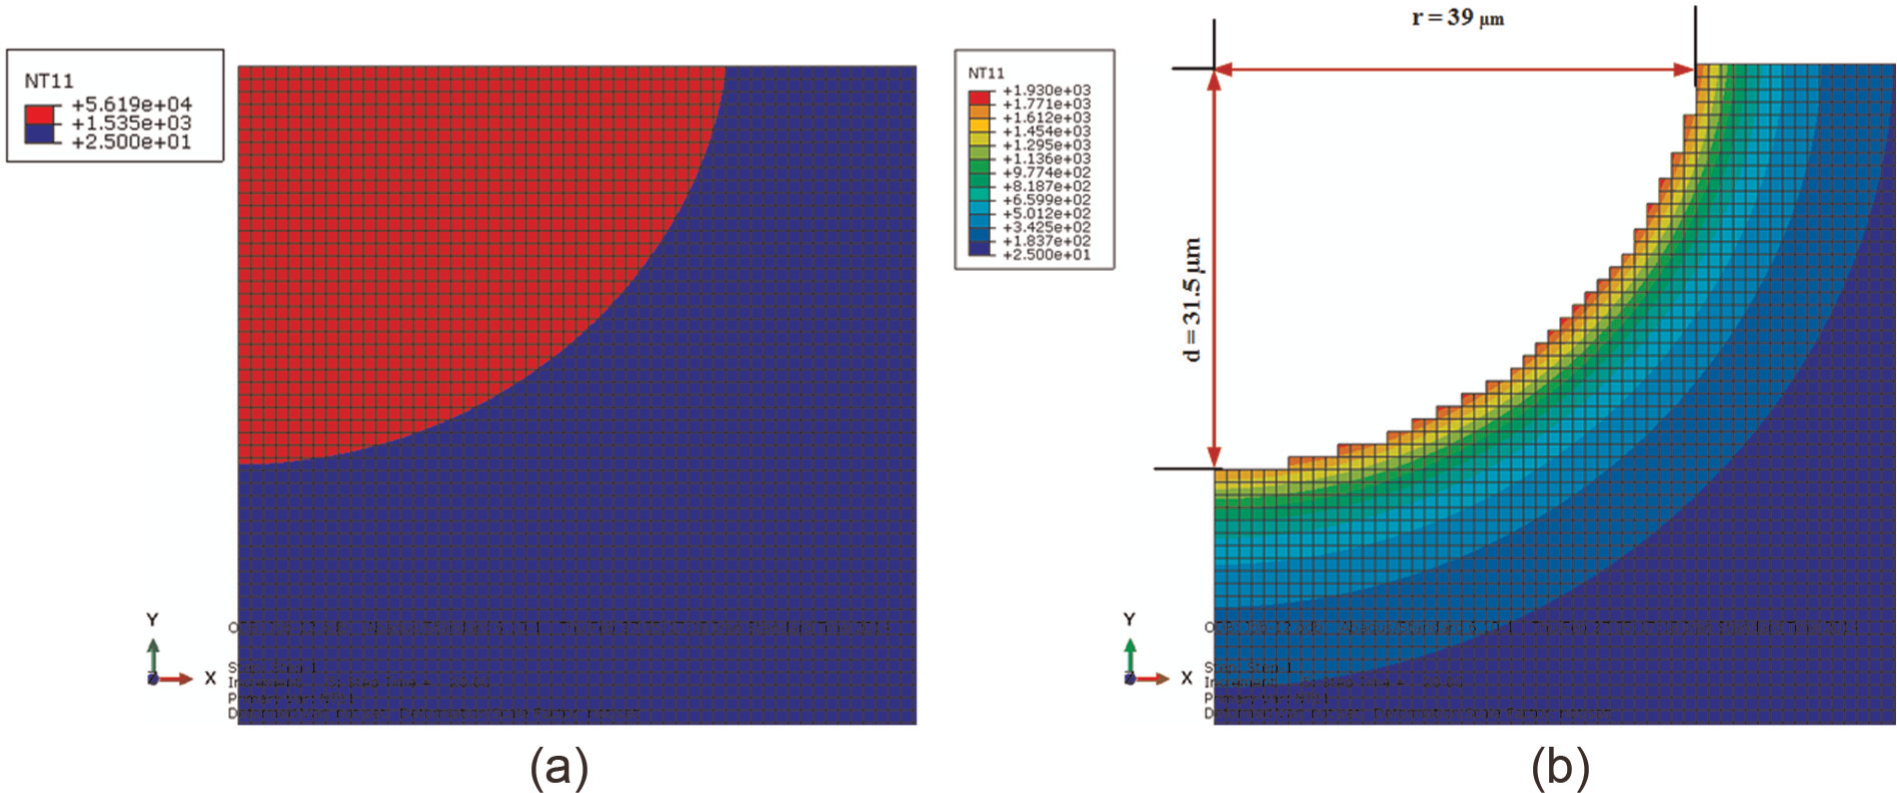
FE simulation of crater formation: (a) molten cavity and (b) crater cavity formed at the end of discharge time (Idis = 40 A, Tdis = 20 µs and Vdis = 20 V, Experiment 1, Table 5).
Table 5 summarizes the results of verification experiments along with the simulation values for all the three different discharge conditions considered in this research. The last two columns show the relative percentage errors in predicting crater radius and depth. Reasonable modeling accuracy can be observed as the amounts of all errors lie within acceptable range in view of engineering discipline; the highest quantity of which is 18.1% corresponding to Experiment 1 in predicting crater radius. Generally, rational consistency can be noted between the experimental and simulation findings in terms of crater dimensions (radius and depth), hence validating the outcomes of FEM simulations.
Comparison between simulation and experimental results.
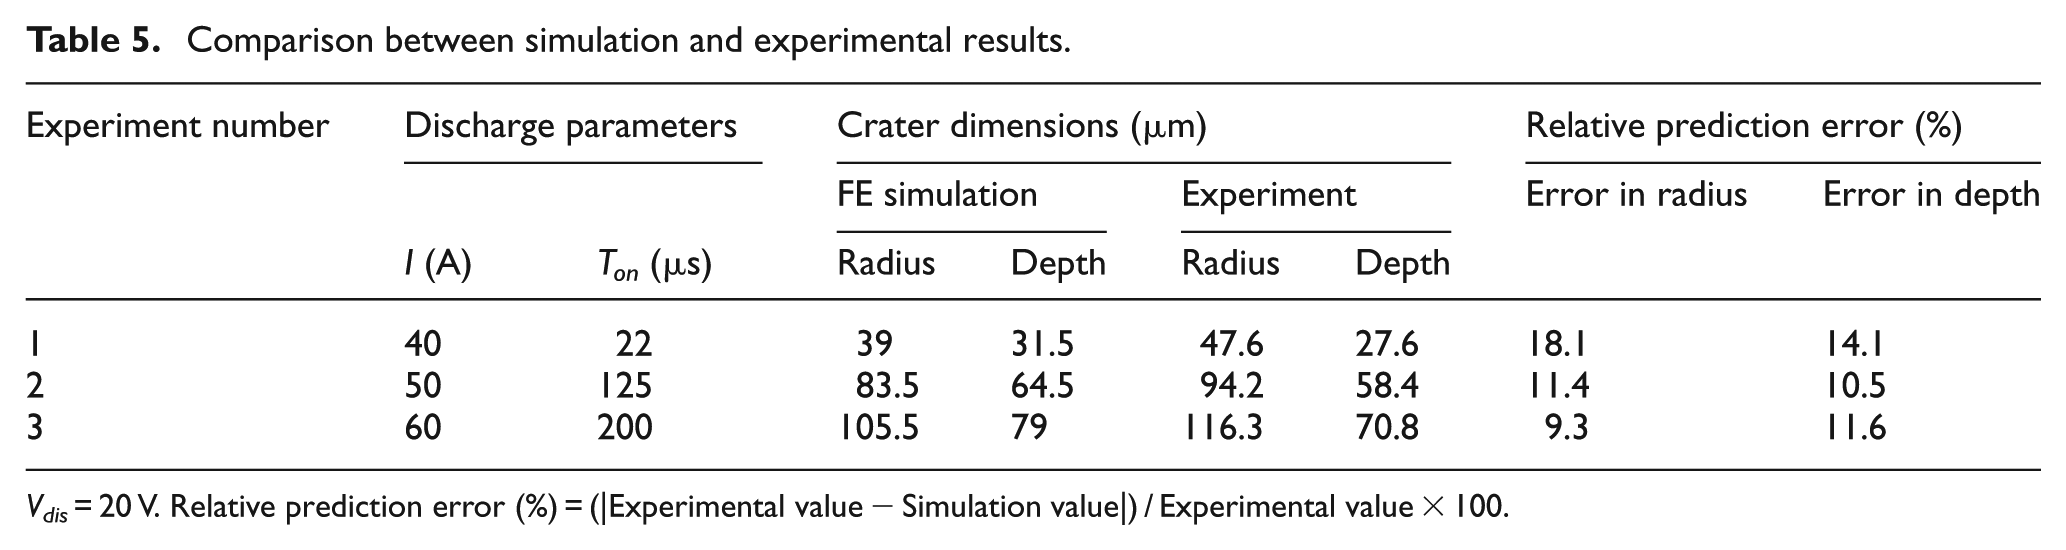
Vdis = 20 V. Relative prediction error (%) = (|Experimental value − Simulation value|) / Experimental value × 100.
Effects of modeling assumptions on the accuracy of results and comparison with other approaches
Here, it would be instructive to compare the effect of constant and variable thermo-physical properties of workpiece material and also the inclusion and neglect of latent heat of melting on the accuracy and credibility of simulation results with respect to the experimental findings. For this purpose, while ignoring the role of latent heat of fusion (247 kJ/kg), the average values of thermal conductivity (Kave : 39.2 W/m K), specific heat (CPave : 700 J/kg K) and density (ρave : 7673 kg/m3) over the temperature range from solid to molten state of the AISI 304 steel (see Table 1) have been considered and applied for the FE simulations. Moreover, it has been decided to run the numerical analyses and obtain crater shape and dimensions (radius and depth) using the circular disk heat source model with expanding plasma channel radius9,11 as well as the point heat source model, 6 as the other two heat flux functions mostly used in previous researches, 7 and compare them with the results of this study.
Table 6 illustrates the different values of craters’ radii and depths obtained according to the discharge parameters set for the first verification experiment (Experiment 1, Table 5) along with the amounts of relative verification errors using the aforementioned approaches. First, it is clear that the consideration of variable material properties together with melting heat brings about significant improvement on the accuracy of simulated results. Using a constant set of material properties while excluding the latent heat of fusion will increase the simulation errors from 18.1% to 23.3% and 14.1% to 19.6% in predicting crater radius and depth, respectively. Second, it can be seen that applying either disk heat source model or point heat source to characterize the spark heat flux will also deteriorate the confirmation results (crater shape and size) compared to the Gaussian heat flux proposed in this study. Figure 12((a) and (b)) shows the schematic illustration of a cavity formed when disk and point heat sources were employed. The crater cavity formed due to the disk heat source presents a shallow flat bottom bowl appearance having a radius of almost three times larger than its depth while a semi-spherical cavity was obtained when applying the point heat source model. Neither of which can appropriately approximate the true figure of their experimental counterpart as shown in Figure 7. Hence, the selection of Gaussian distribution of heat flux can be justified here as it can better estimate the real form of crater (see Figures 7 and 11). Moreover, as can be seen from Table 6, when selecting the circular-type heat flux, the error values become 230.9% and 88.4% whereas being 28.2% and 121% for the case of point heat source in predicting crater radius and depth, respectively. These error values are by far larger than those yielded by the present model; therefore, the suitability and logics of our modeling assumptions can be assured.
Comparison of crater geometry obtained from different modeling approaches.
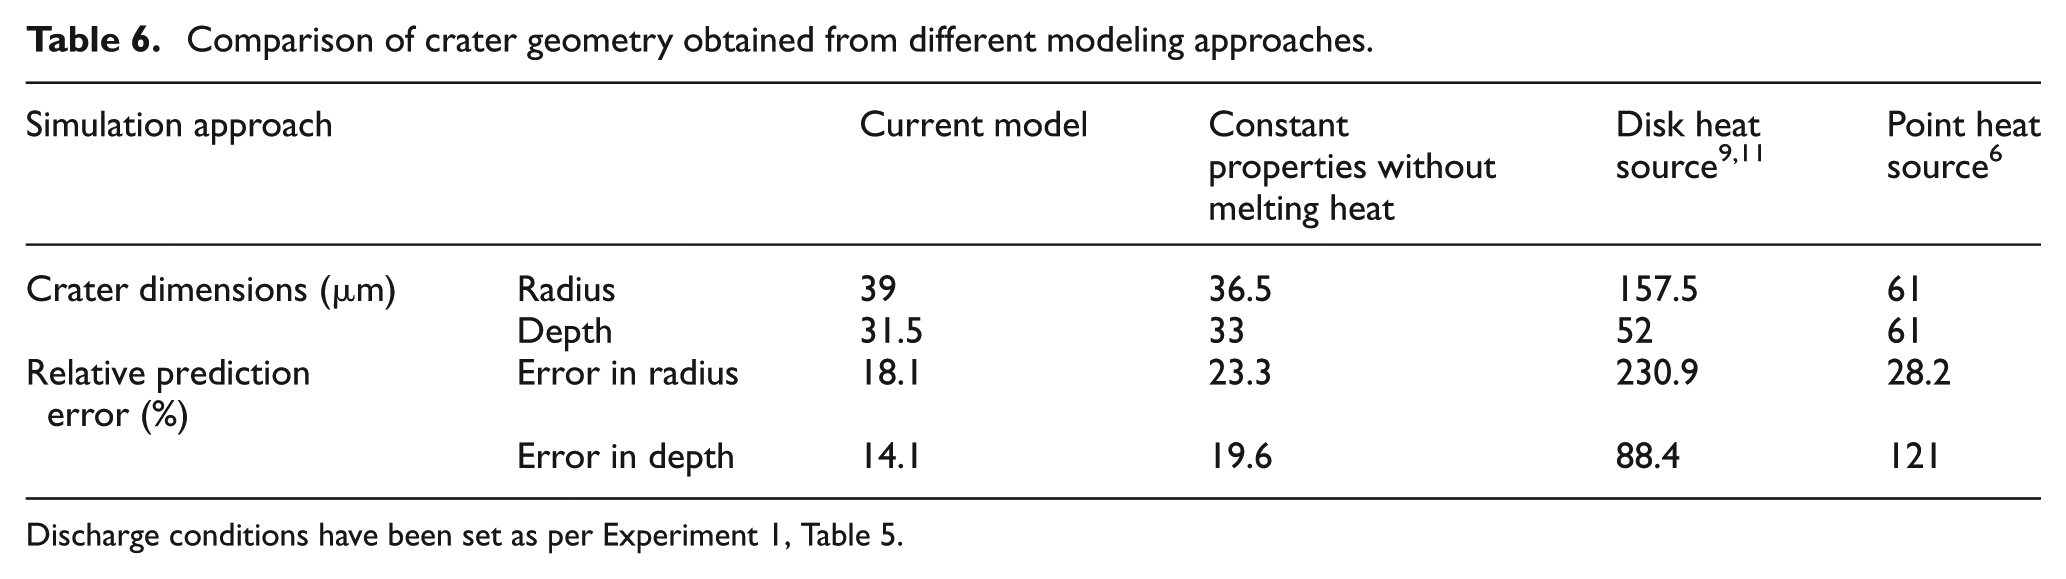
Discharge conditions have been set as per Experiment 1, Table 5.
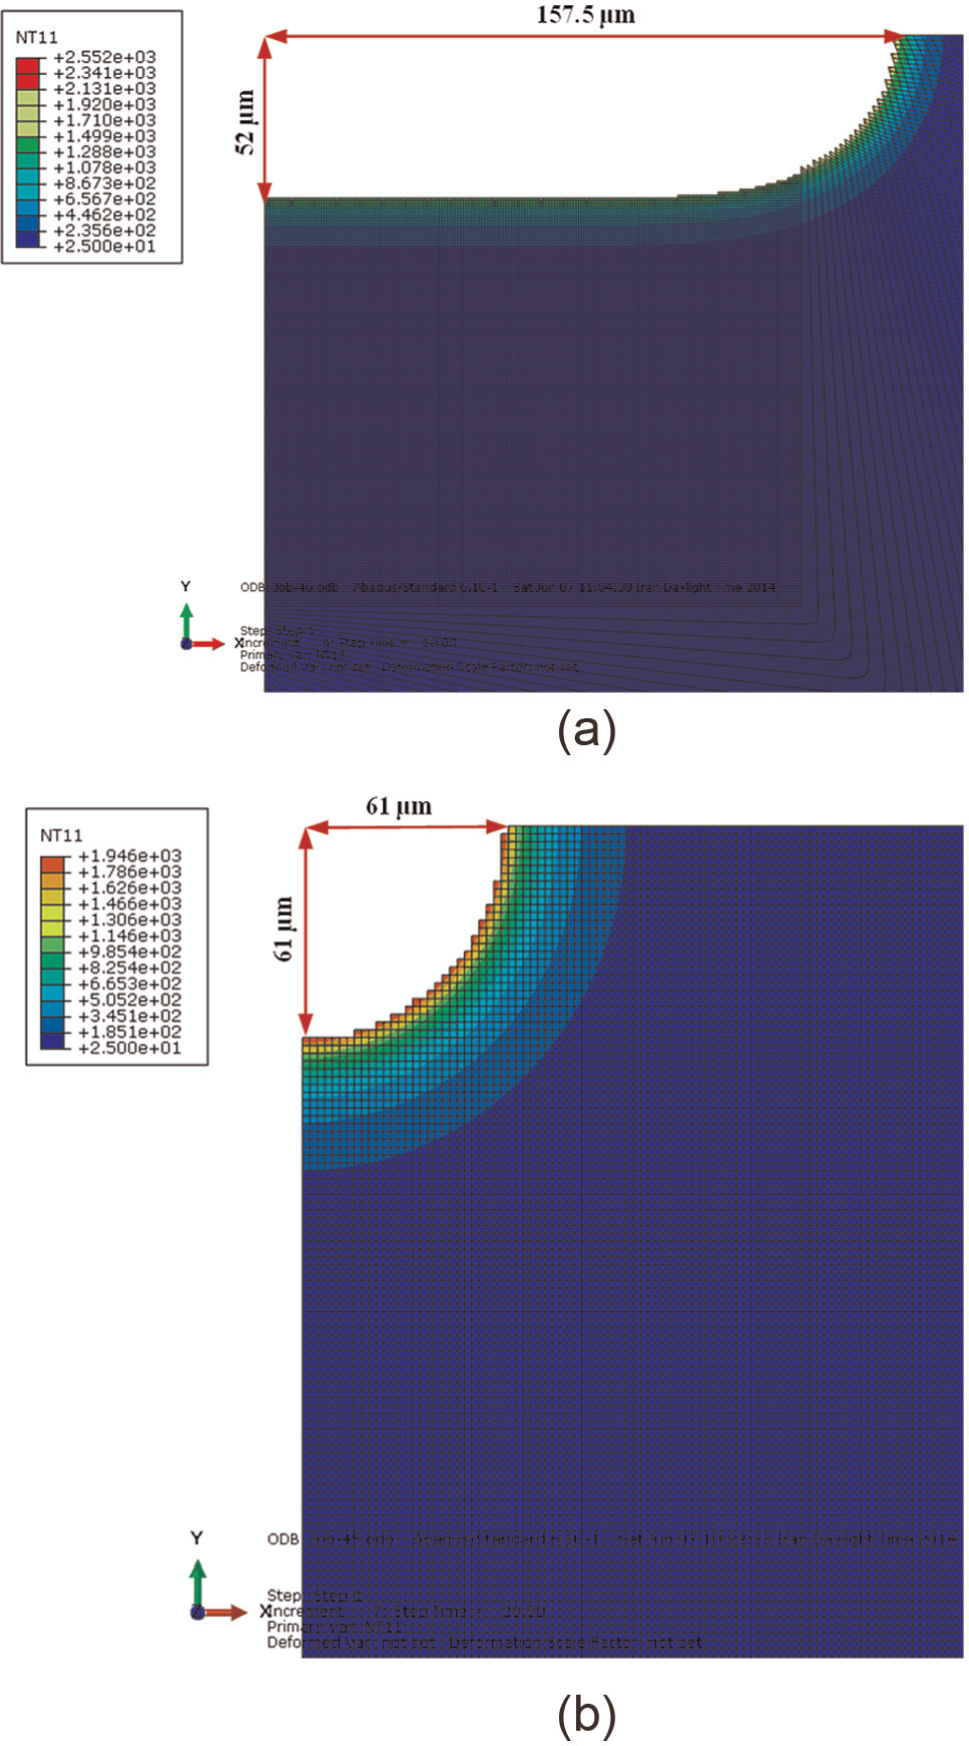
Crater cavity formation: (a) circular disk heat source model and (b) point heat source model (I = 40 A, Tdis = 20 µs and Vdis = 20 V).
It should be noted that these discrepancies in verification errors arise due to the simplistic forms of heat flux functions proposed for the disk and point heat source models which are far away from its more realistically complicated form derived and employed in our simulations, that is, the Gaussian distributed (equation (8)). For the disk heat source model9,11
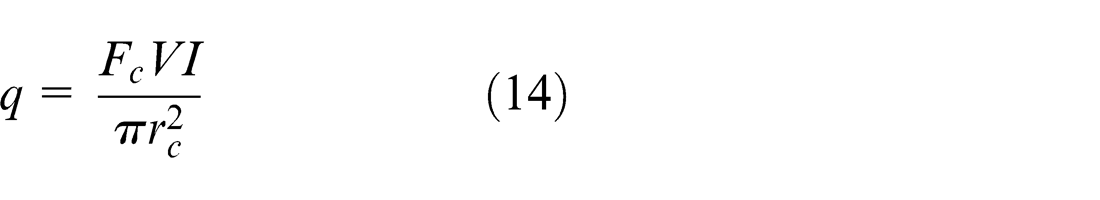
and for the point heat source model 6
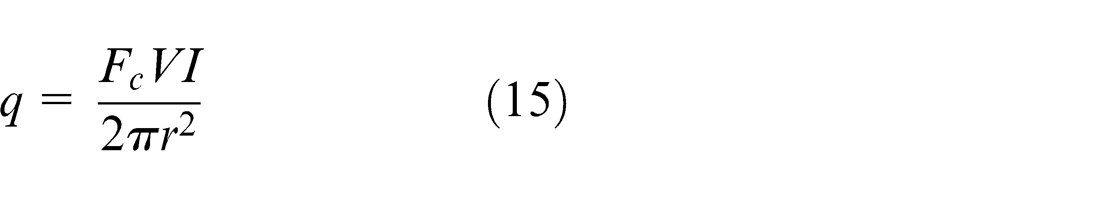
where q is the heat flux, V is the discharge voltage, I is the discharge current, Fc is the portion of discharge power entered to the cathode (workpiece), rc is the radius of plasma channel at the cathode surface and r is the radial distance from the origin. Furthermore, the relationship of plasma channel growth specifying the size and shape of discharge channel takes the form as rc = 0.788t 0.75, depending only on the pulse duration, while in this study a more comprehensive formula has been used (equation (2)) which takes into account the effects of both pulse time and discharge current, hence providing a more efficient platform leading to more accurate results.
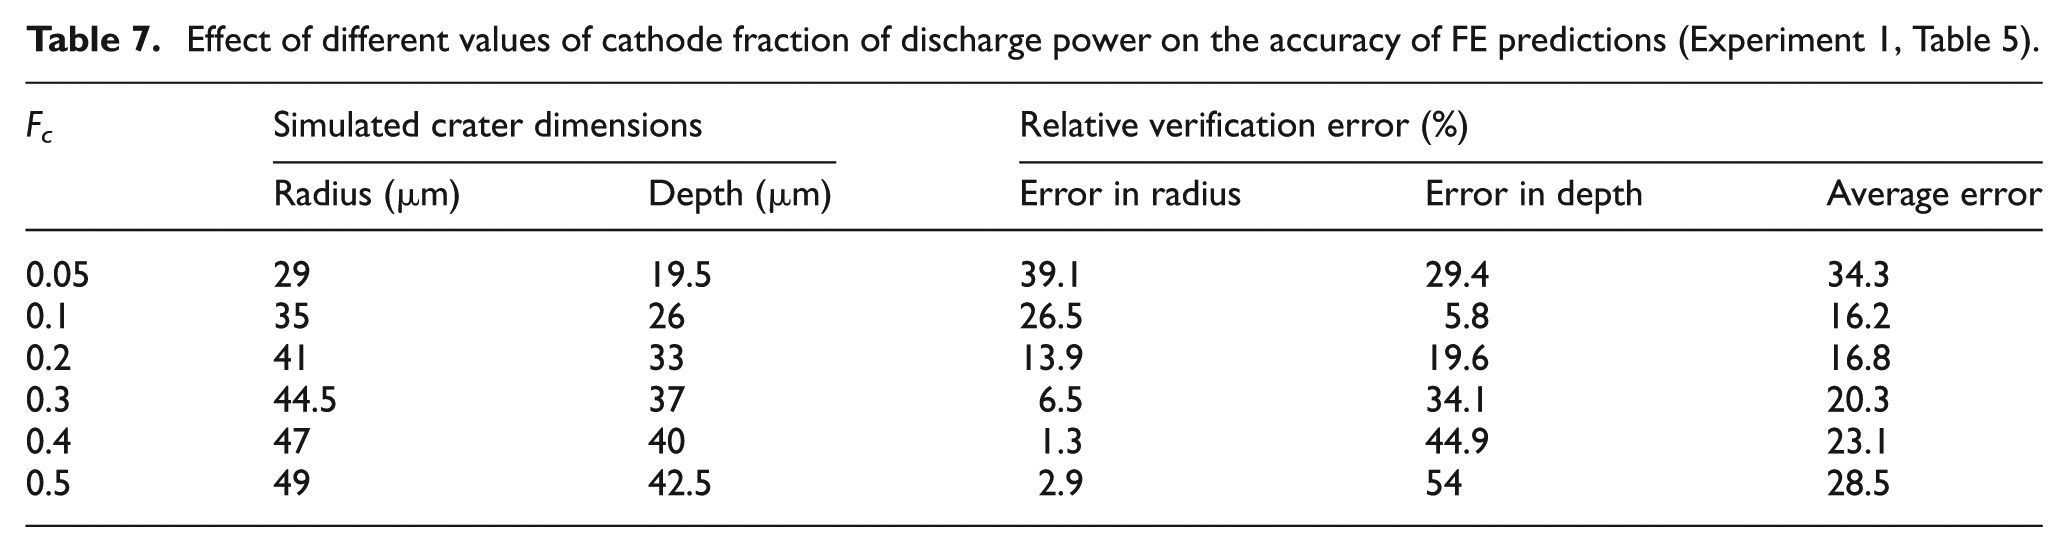
The last issue that needs farther investigation is the fraction of discharge energy entering the workpiece. A comparative analysis is needed to unveil the effect of different values of Fc on the predictive accuracy of our FE model. Table 7 lists the different values of crater dimensions obtained using various Fc s ranging from 0.05 to 0.5. As a general rule, the higher the Fc , the bigger would be the crater dimensions due to the higher amount of discharge power transferred to the cathode workpiece. Moreover, the values of radius errors present a decreasing trend by increasing the Fc from 0.05 to 0.4, whereas the depth errors show an ever-increasing style after the second simulation. In order to get a fair conception about the suitable numerical value assigned for this fraction, the arithmetic mean of the two verification errors can be considered as the decisive measure. Here, as can be seen, if the Fc is chosen a value between 0.1 and 0.2, the average error will get its lowest amount (almost 16%) compared to other cases. This is also in agreement with DiBitonto et al. 6 who recommended that the energy distribution factor should be about 18% for cathode to provide good correlation between theoretical and experimental results. As mentioned before, the same amount has been used in our model building and its validity confirmed here.
Effect of different values of cathode fraction of discharge power on the accuracy of FE predictions (Experiment 1, Table 5).
Parametric analysis
Having verified the FEM simulations, it is now imperative to perform a parametric analysis to investigate the effects of most dominant parameters modulating the discharge energy, that is, discharge current and discharge duration (spark on-time), on crater size (radius and depth). The results would be of paramount importance predicting the productivity (MRR) of EDM process as this characteristic is directly proportional to the size of crater volume. It also helps understand the quality of how a parameter affects the MRR while working under different machining conditions.
Effect of discharge current on crater dimensions
Figure 13(a) illustrates the effect of discharge current on crater radius and depth while keeping the other parameters constant (Tdis = 100 µs and Vdis = 40 V). As is clear, both the radius and depth get larger values varying from 51.5 to 89 µm and 42.5 to 79 µm, respectively. This is due to the higher levels of discharge energies released during sparking when discharge current increases from 10 to 50 A. However, it is remarkable to note that the ratio of the developed crater depth to radius (d/r) increases from 0.83 to 0.89. It implies that the crater depth grows at a higher rate than that of crater radius indicating that the melting border advances into the workpiece as a result of high discharge current to avoid re-solidification of molten material. In other words, the material ejection efficiency increases progressively by increasing discharge current with more material removed instead of deposited over the work surface. Hence, thinner recast layer can be expected while increasing discharge current. 44
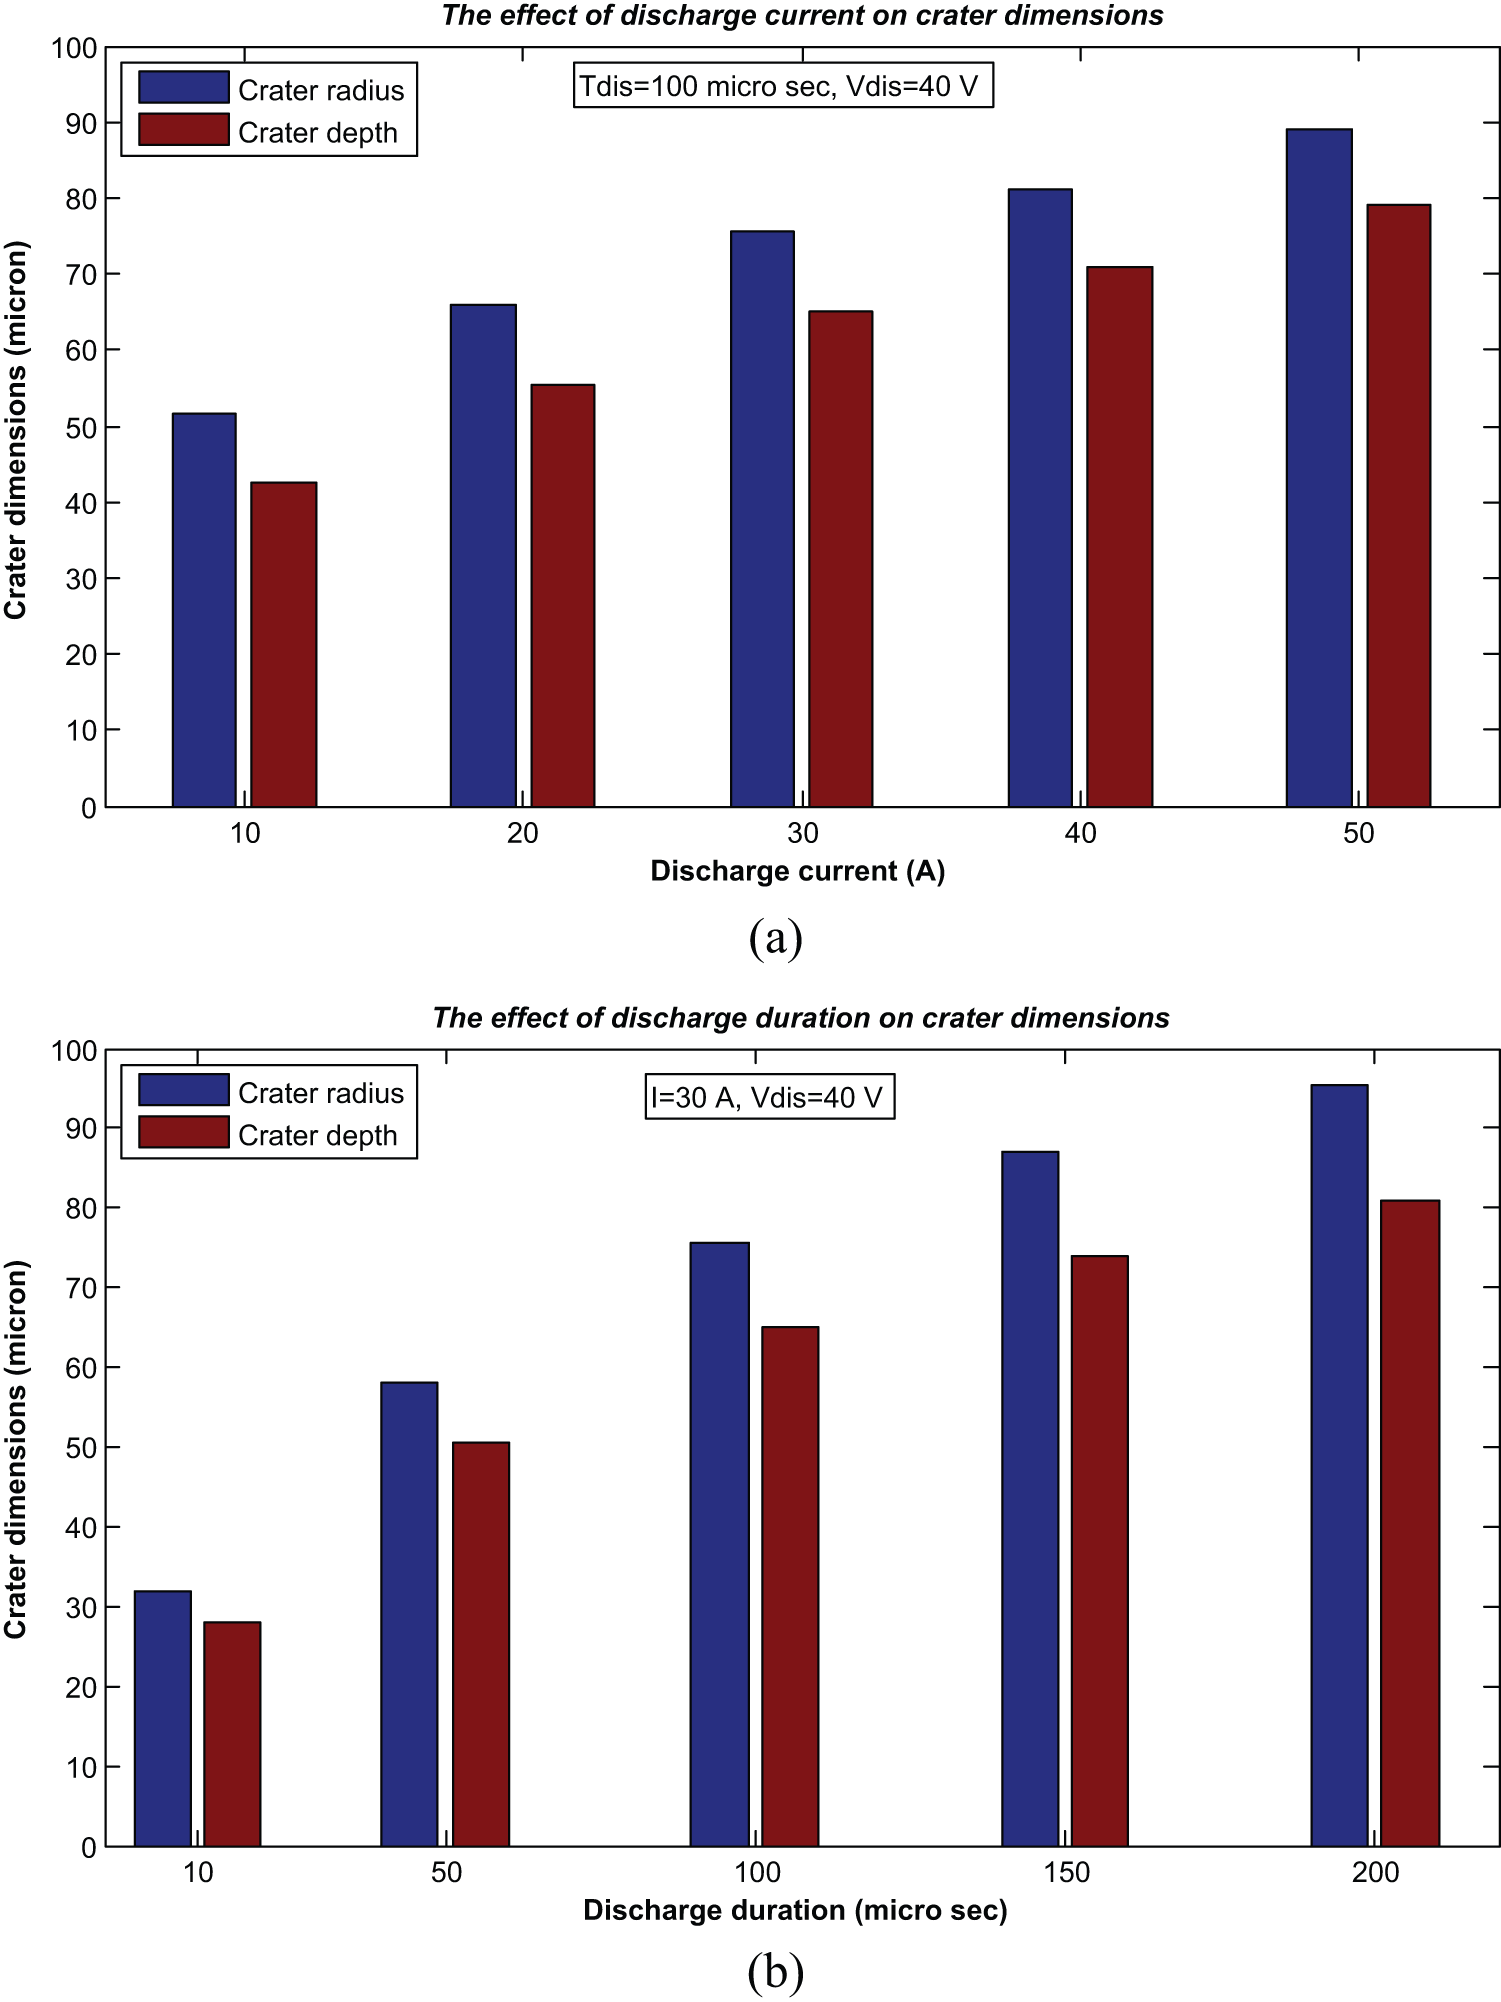
Effects of discharge parameters on crater dimensions: (a) discharge current and (b) discharge duration.
Effect of discharge duration on crater dimensions
The effect of discharge duration on crater dimensions (radius and depth) at a steady level of discharge current (30 A) and voltage (40 V) has been shown in Figure 13(b). Similar to the effect of discharge current, the crater size increases by providing larger discharge energies resulted from longer discharge times. Nonetheless, unlike the discharge current, the quotient between crater depth and radius (d/r) decreases from 0.88 at Tdis = 10 µs to 0.84 at Tdis = 200 µs. It conveys that the crater depth increases at a lower rate than the crater radius does, that is, the melting front recedes while discharge duration increases which means more melted material gets re-solidified and spread over the work surface instead of removed effectively. This phenomenon can best be ascribed to the drop of density of discharge energy at the spot of sparking due to the expansion of plasma canal radius at prolonged pulse durations, thereby lowering the plasma flushing efficiency and hence MRR. 43
Based on the outcomes of the above analyses, it can generally be concluded that the sparks having higher discharge currents along with shorter discharge durations are more favorable in terms of the amount of the material removed from the workpiece. Higher discharge currents accompanied with shorter pulse durations provide more effective sparks possessing greater electrical discharge density, and hence impulsive force leading to more material ejected instead of re-solidified over the crater surface. This result, solely obtained by the simulation and parametric analysis of the size of single-spark crater cavity, is indeed in agreement with the results obtained by other researchers who conducted experimental works on the real state multi-spark EDM process. 45
Model extension to real state multi-discharge EDM
The ideally theoretical material removal or erosion rate due to the cumulative effects of single-spark discharges, MRRSim (mm3/min), considered in a series of consecutive pulses during the continuous operation of EDM process, can be computed as
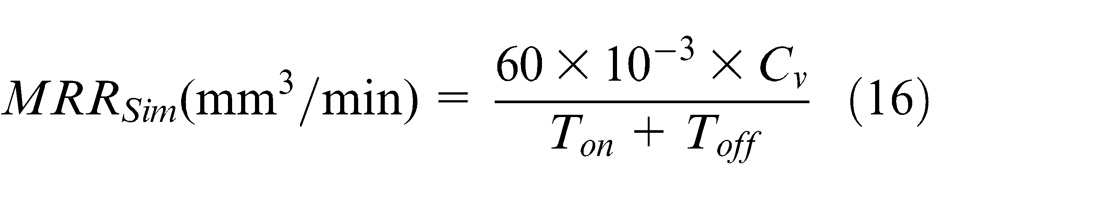
where
To examine the generalization capabilities of our single-spark model to the real state EDM process in which series of successive discharges take place during machining, a comparative study has been made here. The experimental and theoretical values of MRRs have been adopted from DiBitonto et al., 6 which is regarded as one of the pioneering research works on EDM containing benchmark data quite often referred in EDM literature. In addition, the numerically simulated MRRs (MRRSim ) have been calculated as per equation (16) through the development of a program written in FORTRAN to carry out the required calculations estimating the crater cavity based on the outputs of FEM software under the same discharge conditions.
Table 8 lists the amounts of MRRs obtained using the three different aforementioned approaches in ascending order of discharge energies, whereas Figure 14 shows these MRR values against discharge energies.
Comparison of MRR between experimental, theoretical and the present FEM model.
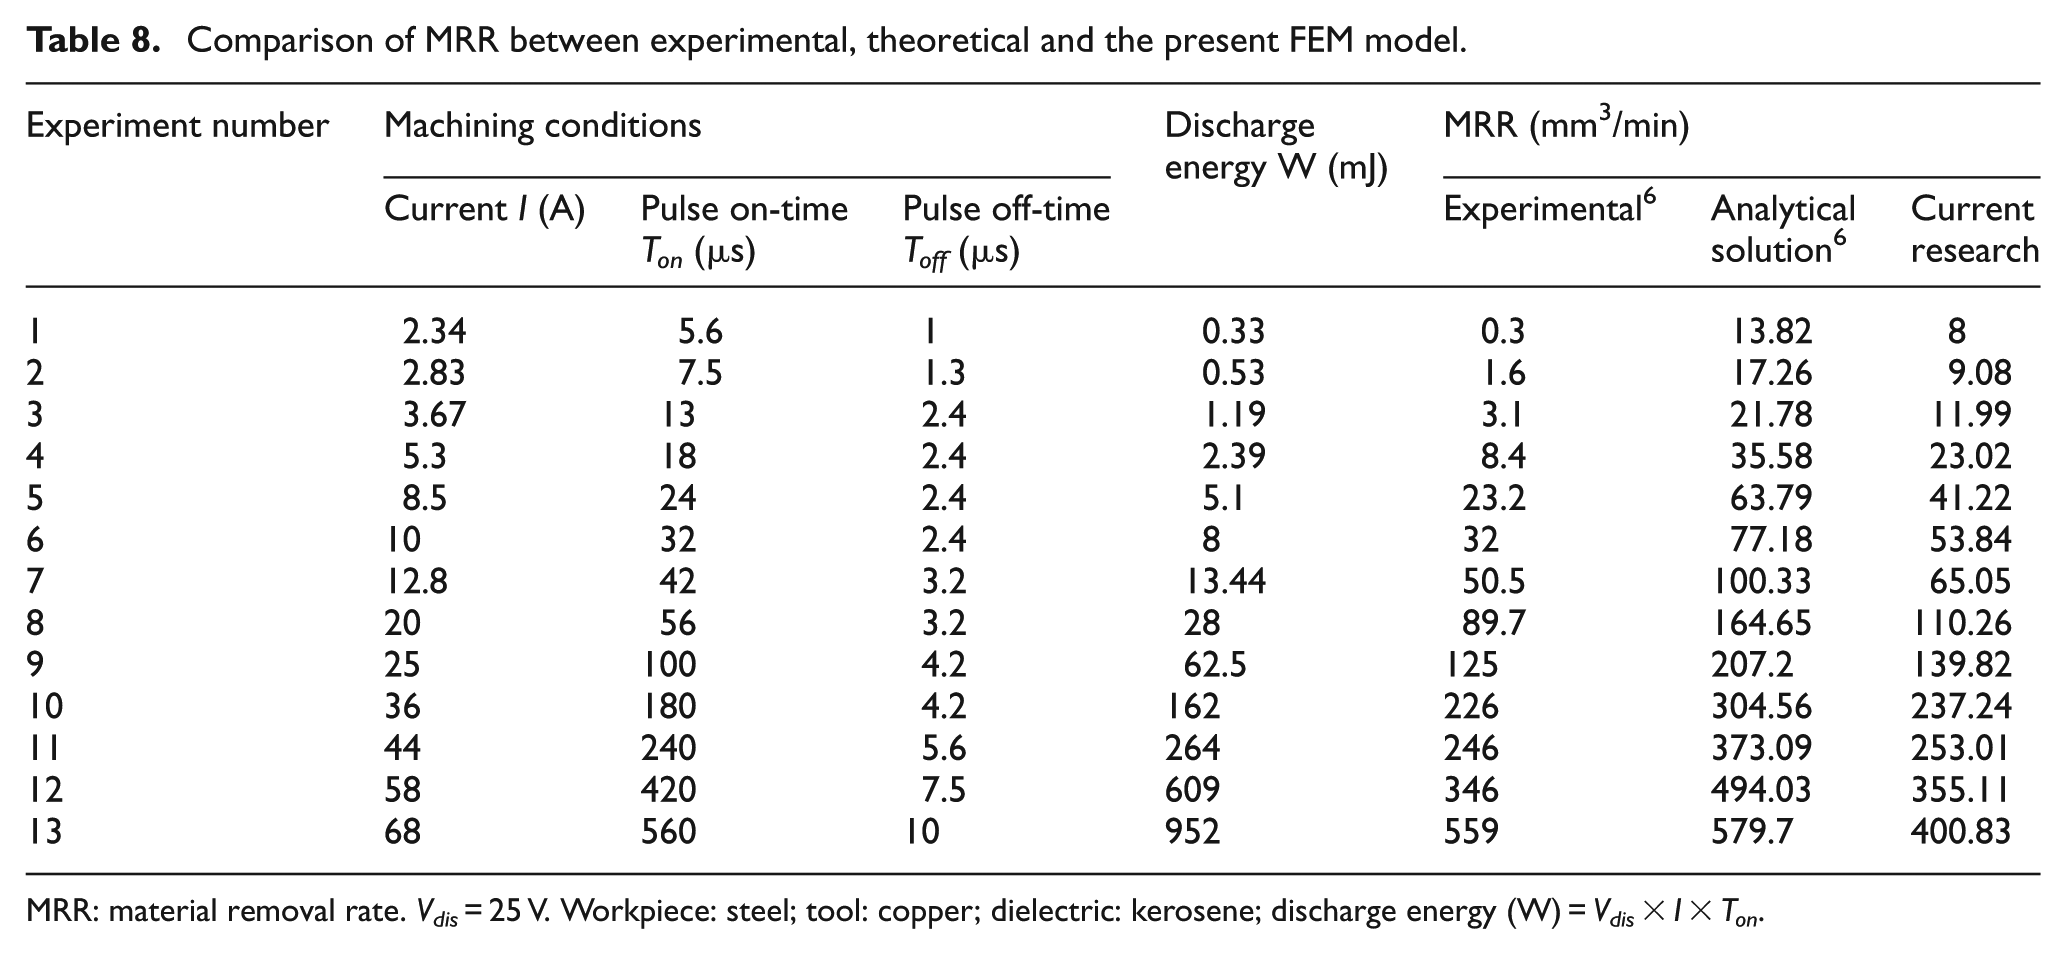
MRR: material removal rate.
Vdis = 25 V. Workpiece: steel; tool: copper; dielectric: kerosene; discharge energy (W) = Vdis × I × Ton .
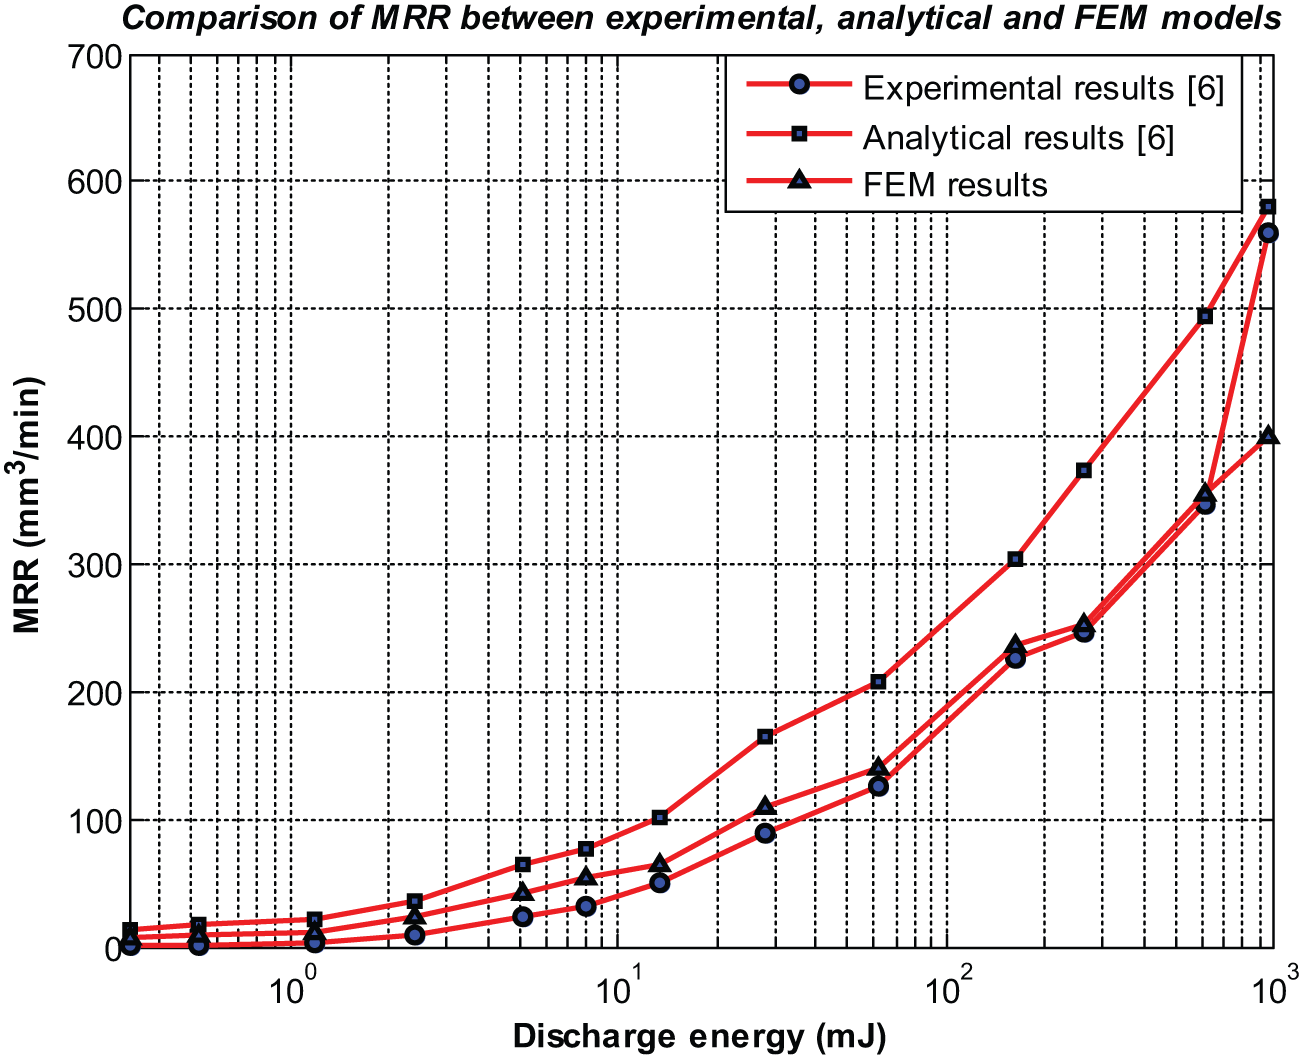
Comparison of MRR for cathode erosion among experimental, analytical and FEM models’ results.
As can be observed, the current numerical model exhibits the same behavior as that offered by either experimental or theoretical one following the same trend of variations. It is interesting to note that the current numerical model presents a much closer margin than the analytical approach with respect to the experimental data except for the last point where a large deviation can be seen. This is because of the fact that in this position, the discharge energy has exceeded 670 mJ, and hence, the relation introduced for plasma channel expansion (equation (2)) is no longer valid. Therefore, it can generally be confirmed that the current FE model is more suitable and accurate than the theoretical model in predicting the MRR under different levels of discharge energies. It should be noted that the theoretical results 6 have been obtained based on the analytical solution of equation (1) assuming a point heat source model, which results in hemispherical crater cavity. Besides, all the material properties (thermal conductivity, specific heat and density) have been supposed to be constant over the whole temperature range involved, and that the inclusion of latent heat of fusion has also been neglected, while in this research their roles have all been considered to make the numerical model as comprehensive and reliable as possible.
On the other hand, it has been shown that the volume of the material removed as a result of single discharge experiment is less than that simulated by FEM due to the formation of recast layer but still higher than the one attributed to its equivalent counterpart as an isolated single pulse within a series of on-going discharge pulses occurring under the real conditions of EDM process. 28 The discrepancy between gap environment in single-spark and multiple discharge cases, and boundary conditions which give rise to different temperature distributions and hence different MRRs can be mentioned as the key reasons for this disparity in removal amounts which needs further research. Moreover, various kinds of pulses such as normal, short, open and arc can take place during EDM leading to no or different amount of material removal, whereas their effects cannot be incorporated into the numerical simulation. These are the main causes responsible for the errors between the MRRs obtained by our simulations and the real experimental values.
Conclusion
In this research, attempts have been made to develop a more comprehensive and detailed physics-based electro-thermal simulation, experimentally validate and parametrically analyze the effects of discharge parameters on the characteristics of single-spark erosion which could, in turn, manifest the true process mechanism of EDM. To those ends, several more realistic assumptions such as the Gaussian distribution of heat flux within plasma channel, spark radius equation based on discharge current and duration, the latent heat of fusion, temperature-dependent material properties, convection heat transfer between workpiece and dielectric and the percentage of discharge energy transferred to the workpiece have all been applied to make the simulation strategy as complete and accurate as possible.
In brief, the following can be mentioned as the main findings of this research:
Due to the temporal growth of plasma channel radius and the subsequent decrease in electrical discharge density, the peak temperature of workpiece, at the center of plasma channel, decreases with the passage of discharge time.
The volume of melted and evaporated material increases by going more into the discharge time as more heat penetrates into the bulk material.
The developed FEM model presents much better predictive accuracy compared with previous models based on disk or point heat sources. It has a maximum verification error of 18.1% and 14.1%, whereas the disk heat source possesses 230.9% and 88.4%, and the point heat source 28.2% and 121% in estimating crater radius and depth, respectively.
The inclusion of variable materials properties and latent heat of melting has a significant effect on the accuracy of simulation results. It reduces the verification errors from 23.3% to 18.1% and 19.6% to 14.1% in predicting crater radius and depth, respectively.
Parametric analyses indicate that the molten depth advances as the discharge current increases while it recedes as the discharge duration increases. The first implies that steadily deeper crater cavities are created by progressive increase in discharge current while the latter implies the formation of more re-solidified materials on the crater surface.
When extending the results of single-spark model to predict the MRR of real state multi-spark EDM, a closer proximity with experimental results than those of analytical solution can be observed. This is undoubtedly due to the inclusion of more realistic assumptions being in line with the real-life EDM considered in this study.
Footnotes
Declaration of conflicting interests
The authors declare that there is no conflict of interest.
Funding
This research received no specific grant from any funding agency in the public, commercial or not-for-profit sectors.