
Abstract
The demand for miniaturized components is on the rise, especially from the biomedical and aerospace industry. As a result, there is a strong research potential towards the micro-manufacturing of biomedical and aerospace components. Titanium-based alloys are known for their biocompatibility and high strength-to-weight ratio, making them most suitable for such applications. In this research, flank wear progression, surface roughness and side burrs, the basic performance parameters of a typical micromachining operation, are presented and analysed through analysis of variance in order to determine the key process parameters. It was found that micromachining can be classified into two categories: micromachining with undeformed chip thickness below the tool edge radius and micromachining keeping the undeformed chip thickness above the tool edge radius. The results showed that when machining with undeformed chip thickness above edge radius, the feedrate remains the most significant parameter affecting tool wear (41% contribution ratio), surface roughness (83%) and burr width (80%). This result places this type of machining closer to macro-machining where feed contribution was found to be 69%, 92% and 75% as against micromachining below edge radius, where contributions stood at 17%, 53% and 52% on tool wear, surface roughness and burr width, respectively. The results underscored the importance of considering the tool edge radius in micromachining.
Introduction
Micromachining can be classified as the machining process that can be used to manufacture miniaturized features and components. The demand for high-accuracy miniaturized components has shown a rising trend in various industries, such as aerospace, biomedical, electronics, environmental, communications and automotive. A recent interest has been reported towards the micromachining of Ni-Ti-based shape memory alloys, where effective machining parameters lie in a very narrow window. 1 This miniaturization was expected to provide microsystems that would enhance health care, quality of life and economic growth in such applications as micro-channels for lab-on-chips, shape memory alloy ‘stents’, fluidic graphite channels for fuel cell applications, sub-miniature actuators and sensors, and medical devices. 2 However, most traditional manufacturing processes are unable to create micro-features with required dimensional accuracy. 3 A milling process may be classified as micro-milling if the milling cutter has a diameter less than 1 mm. 4
Mechanical micromachining commands a strong impact due to its versatility in terms of work materials, component interfaces and functional shapes. 2 Previous researchers have used tungsten carbide (WC) end mills to mill out walls with a minimum thickness of 18 mm and an aspect ratio of 1:24, while with mono-crystalline diamond tools 8-mm walls with an aspect ratio of 1:13 were machined. 5 Mechanical micromachining also offers the advantage of a higher material removal rate without requiring expensive and specialized setups. In addition, micro-mechanical machining is suitable for manufacturing individual components rather than just batch production as in the case of electric discharge machining (EDM). Mechanical micromachining is also better suited for manufacturing three-dimensional (3D) free-form surfaces.
Several critical issues have been identified that differentiate micro-manufacturing from its macro counterpart. These issues limit the direct application of theories developed for the macro-machining in the micro-domain through simple dimensional analysis. One such issue in micro-milling is accurately setting up the work coordinate system on the machine due to spindle thermal stability issues. 6 For modelling, Merchant’s sharp edge theorem, for example, cannot be applied on micromachining operations due to edge radius effects. Another major difference between macro- and micromachining is described as the increase in the workpiece material’s shear flow stress with decrease in undeformed chip thickness. 7 This phenomenon is commonly referred to as the size effect in machining. In addition, the edge radius effects lead to high negative rake angles and elasto-plastic effects. 2 Other issues associated with micromachining include the inherent fragility of cutting tools and the effects of noise factors such as vibrations, variations in temperature, pressure, humidity and other environmental variables. Micro-tool dimensions such as edge radius, rake angle and clearance angle are also difficult to reproduce for tools having identical specifications due to difficulty in controlling dimensional tolerances. Furthermore, the material removal length scale is in the order of microns or less. 8 As a result, the workpiece material cannot be assumed homogenous due to the presence of different phases and grain sizes that the tool is likely to encounter, since the micro-tool at a particular instance may be engaged in cutting a grain having a particular phase, while at the next instance another grain having a different crystal structure and orientation. The variation in mechanical properties of these phases (hardness, fracture toughness, yield strength) would likely cause changes in cutting forces and lead to tool vibrations and chatter. Added to these issues are the effects of material strain hardening, subsurface plastic deformation and material separation. These uncertainties tend to influence the capability and repeatability of the micro-milling process.
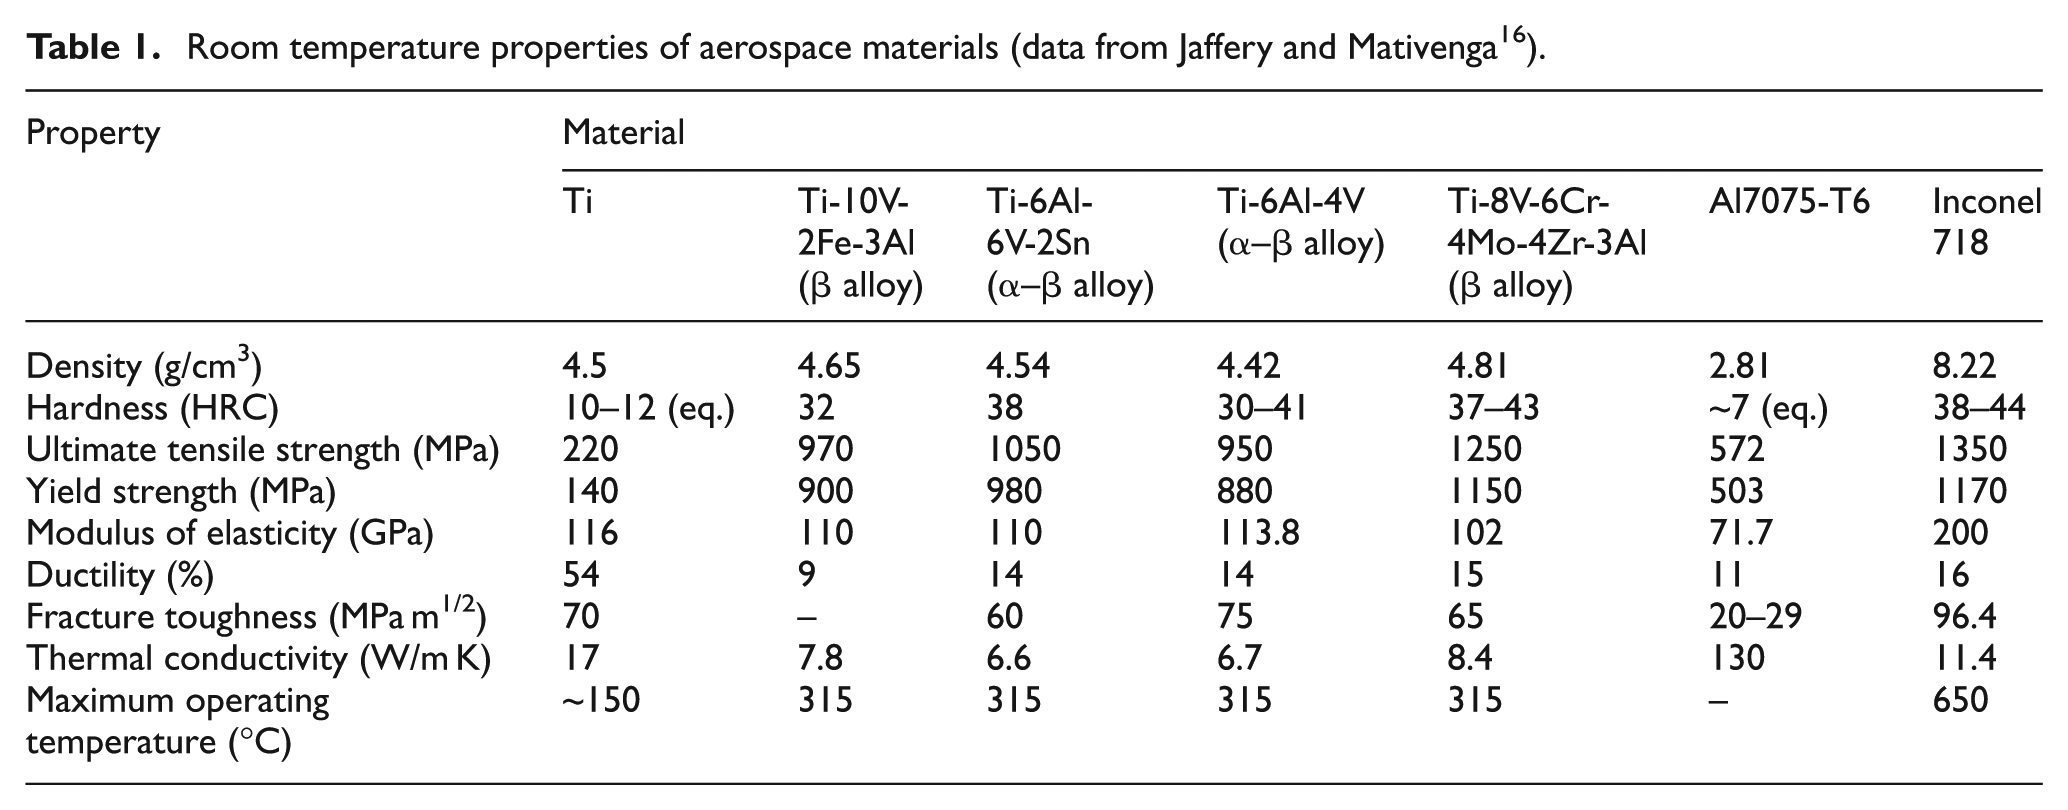
Most commercial titanium alloys are α–β alloys, including the Ti-6Al-4V alloy that accounts for 45%−60% of the total practical usage of titanium. 9 The α phase contains hexagonal close packed (HCP) arrangement while the more ductile β phase consists of body-centred cubic (BCC) crystallographic arrangement. The change in grain structure from α to β structure also causes changes in mechanical properties, chip formation and tool wear mechanism. 10 Micromachining of such materials is thus a more complicated science than simple scaling down of tool–workpiece dimensions, as the micro-tool transits between α and β grains that leads to more complicated tool dynamics and wear mechanisms that are essentially different from conventional/macro-machining. Very little research on mechanical micromachining of titanium alloys has been reported as compared with other materials. There is therefore a strong need to investigate the micro-machinability of titanium alloys considering their wide usage in biomedical and aerospace applications.11,12 Cutting tests with tool coatings showed promising results in both macro- and micro-milling that suggest further research into the development of tool coatings.11,13–15 The mechanical properties of Ti-6Al-4V alloy, the workpiece material used in this research, in comparison with other aerospace alloys are summarized in Table 1 (adapted from Jaffery and Mativenga 16 ). While pure titanium may not exhibit impressive engineering properties, it can be alloyed with elements such as aluminium, vanadium, molybdenum and niobium to produce alloys suitable for aerospace (Ti-6Al-4V) as well as for biomedical applications (Ti-13Nb-13Zr). 17 Ironically, the superior mechanical properties of titanium alloys in addition to their low thermal conductivity (refer to Table 1) and chemical affinity with tool materials render them difficult to machine. As a normal practice, the machining of these alloys is carried out under wet conditions, in order to offset the thermal issues associated with the low thermal conductivity. However, green machining without the use of any cutting fluids is gaining attention of researchers due to environmental and health concerns as well as the fact that coolants and lubricants used for machining represents 16%−20% of the manufacturing costs.18,19
Room temperature properties of aerospace materials (data from Jaffery and Mativenga 16 ).
Minimum chip thickness
The minimum chip thickness (tc), also known as the minimum thickness of cut, can be defined as the minimum undeformed thickness of chip that can be removed stably from a work surface for a given cutting edge radius. 20 It has been reported earlier that surface finish is related to the formation of shear bands in chip and cutting below the minimum chip thickness causes rubbing between the tool and the workpiece, affecting surface quality. 21
Based on the rake angle of cutting tools, no chip was reported to have formed at negative rake angles of 85° while they were shown to have formed at 75° negative rake angle. 22 Minimum chip thickness can also been defined as a measure of extreme accuracy attainable for a given set of parameters. Features having dimensions below this threshold values cannot be produced by the process. Previous researchers have suggested that taking into account the minimum chip thickness while selecting suitable machining parameters can help reduce the surface roughness, subsurface damage and tool wear while reducing burr formation. 8 Since the minimum chip thickness is directly related to the tool edge radius, 23 advances in tool manufacturing that lead towards sharper tool edges and less fragility can reduce minimum chip thickness. As a result, the maximum accuracy available from the process would also improve. Typically, the values for minimum chip thickness range from 5% to 43% of the tool edge radius. 8 The variation in these values can be attributed to the elastic/plastic behaviour of the different workpiece materials as well as tool rigidity. Another research defined the value of the minimum chip thickness at 29.3% of the tool edge radius. 24 Mian et al. 25 reported the minimum chip thickness in the case for micromachining Ti-6Al-4V alloy to be in the range of 19%−27.5% of the tool edge radius.
For the case of micro-milling, the feedrate is directly related to minimum chip thickness. The chip thickness is traditionally assumed to vary according to the relationship

where t is the instantaneous uncut chip thickness and tmax is the maximum uncut chip thickness (Figure 1). From the understanding of the concept of minimum chip thickness, it is evident that a chip will not form when tmax is less than tc leading to material accumulation. A chip only forms when the size of the material accumulated exceeds the minimum chip thickness.
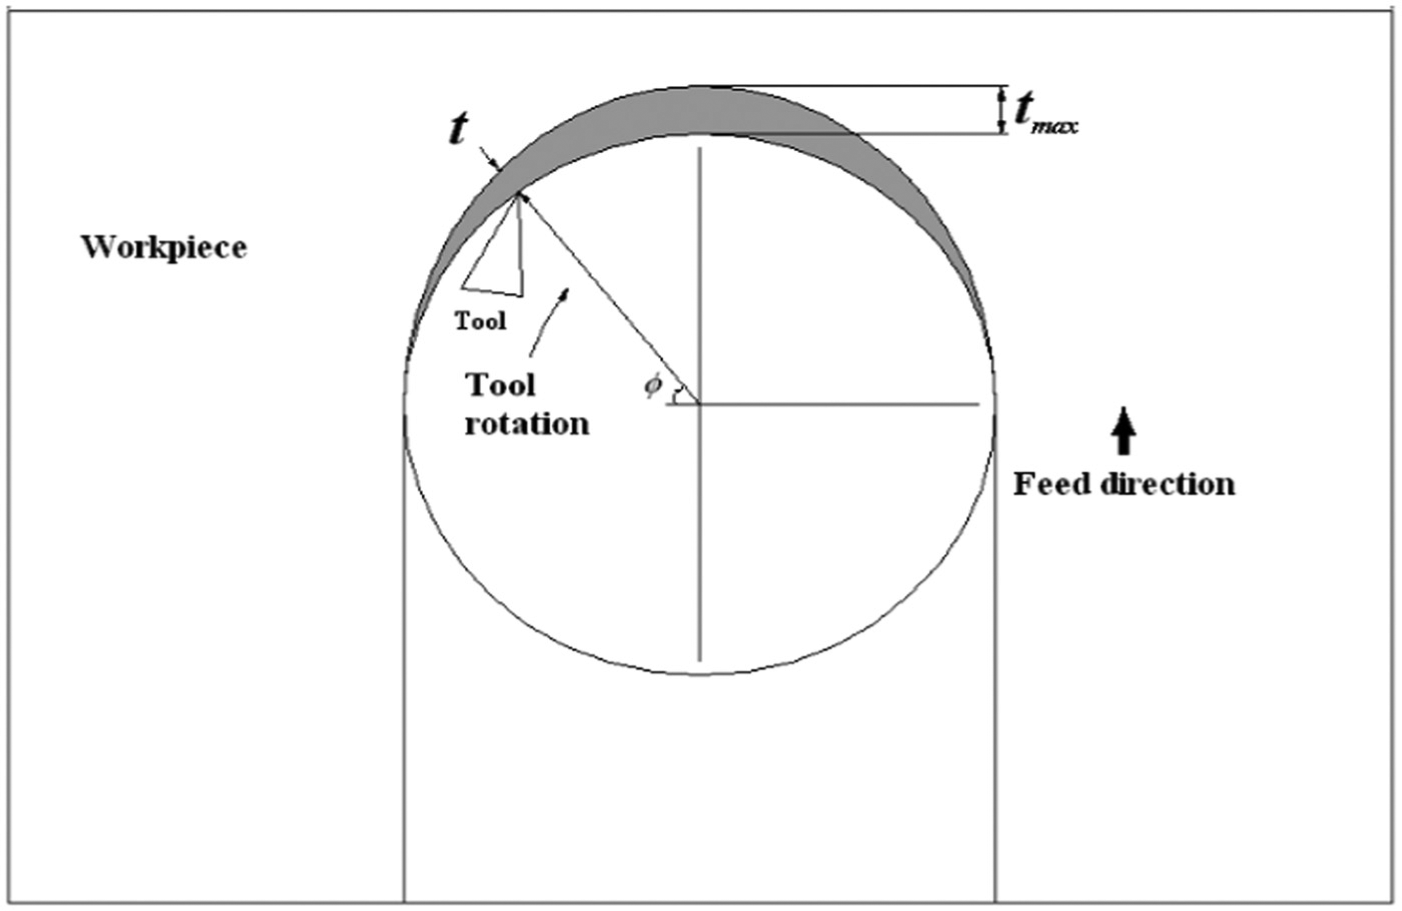
Schematic of the milling process (adapted from Kim et al. 3 ).
Figure 2 illustrates the various tool–workpiece interactions typically encountered in micromachining. When the depth of cut is lower than the minimum chip thickness, no chip is formed and either rubbing or burnishing takes place 3 (Figure 2(a) and (b)). Once the depth of cut reaches the minimum chip thickness, still being below the tool edge radius, cutting commences but with a negative effective rake angle (Figure 2(c)). When the depth of cut exceeds the cutting edge radius of the tool, the actual rake angle of the tool becomes effective (Figure 2(d)). Tool sharpness was reported to have a strong influence on the machined surface integrity in terms of its surface roughness, microhardness, residual stress and the dislocation density. 26 Since tool sharpness is directly related to the minimum chip thickness, its determination is crucial in controlling product quality.
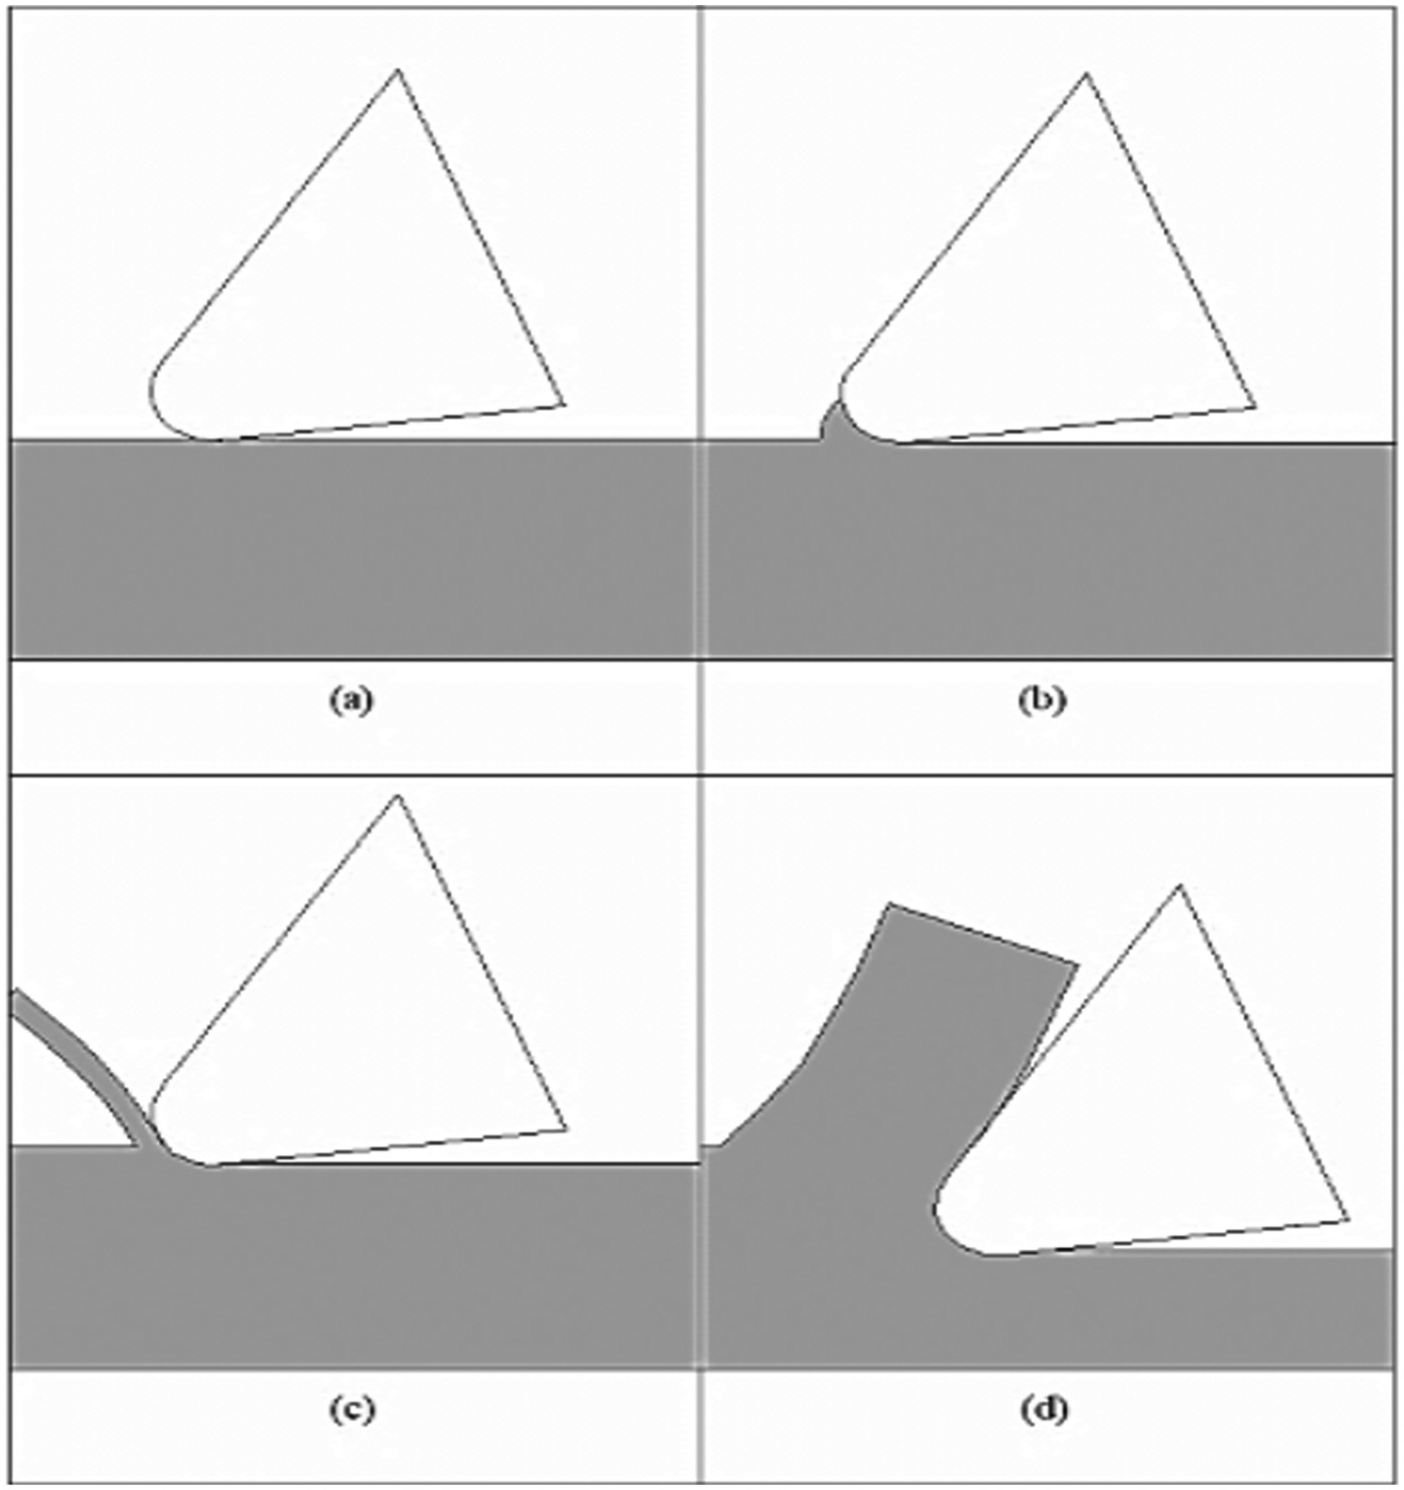
Mechanisms of tool–workpiece interactions for various depths of cut (a) rubbing, (b) burnishing, (c) ploughing (cutting with a negative effective rake angle) and (d) cutting with a positive rake angle (adapted from Kim et al. 3 ).
For any industrial process, determination of the effects of input parameters on productivity is of paramount importance. While considerable research is being carried out in the micromachining of ferrous alloys, relatively little work has been reported on the micromachining of titanium-based alloys. An earlier research project evaluated critical parameters or key process variables (KPVs) in the micromachining of hardened tool steel. 27 Another researcher used similar methodology to evaluate optimal machining parameters for stress concentration in micro drilling. 28 It was found that the feedrate was the most influential followed by holding length, cutting speed and cutting fluid, respectively, for stress concentration. It was further reported that stress concentration factor adversely affects the hole quality.
Research motivation
Mechanical micromachining of difficult-to-cut materials, titanium-based alloys being among those, is recognized as a major challenge in the field of manufacturing. 29 As a science, micromachining of titanium alloys was considered to be in its rudimentary stage. 30 While micromachining has been well recognized as an important area of research with increasing emphasis on miniaturization of functional components, micromachining of titanium alloys, especially mechanical micromachining, has not been investigated to the extent as that of other materials such as steel and aluminum. 31 This study therefore aims to quantify the effects of machining parameters, namely, feedrate, cutting speed and the depth of cut on tool life and surface integrity. In this context, the feedrates were selected so as to analyse these effect in both ploughing and shear cutting modes and compared with macro-milling. It aims to distinguish the classification of micromachining with reference to classical macro-machining, with special emphasis on titanium-based alloys. In this way, it seeks to enable further research in the light of the identification of dominant process parameters and characterization of performance parameters in the case of micro-milling of Ti-6Al-4V alloy.
Experimental details
Unified experiments were planned so as to eliminate inconsistencies reported earlier that may arise with varying tool and workpiece material as pointed out through an earlier research. 32 The tests were conducted on Ti-6Al-4V alloy (as MSRR 8636) supplied by Rolls-Royce plc, UK. Figure 3 shows microstructure of the titanium alloy used for this research. The microstructure before machining shows a typical α–β structure found in this alloy. The average hardness determined through microhardness tests conducted on the workpiece was 392.4 GPa (40 HRC) with a standard deviation of 17.6 GPa.
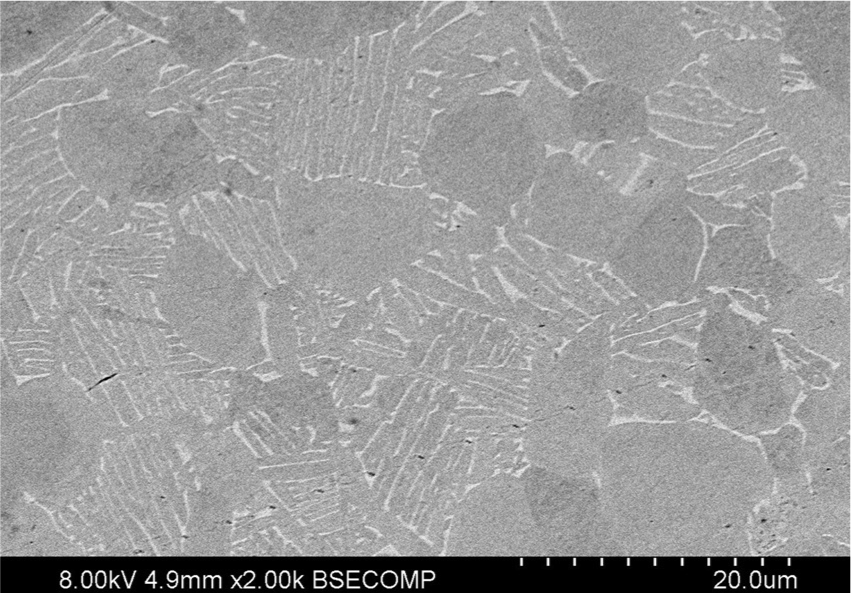
SEM micrograph of the Ti-6Al-4V alloy showing α grains and α–β eutectic grains.
Design of experiments was carried out to enable statistical analysis using Taguchi’s robust design of experiments approach. Experiments based on L4 arrays were designed and conducted. Two independent runs for each set were done using a fresh tool, to check repeatability of results. This design of experiments reduced the number of test runs required to half, as compared with a full-factorial experiment, considerably saving on the resources required. In a related research, the same methodology was used to correlate and contrast micro-milling carried out with undeformed chip thickness kept below edge radius, with micromachining keeping undeformed carried out above edge radius. 4 These were also compared with conventional macro-milling. The analysis of variance (ANOVA) results showed that in terms of surface roughness, burr width and tool wear, micro-milling carried out keeping the undeformed chip thickness above the tool edge radius was more analogous to macro-milling than micro-milling with undeformed chip thickness less than the tool edge radius. Figure 4 shows a typical unused and a worn tool showing flank wear. The maximum flank wear value was used for analysis as it is more critical in the case of titanium-based heat-resistant alloys due to localized heat-affected zone. Since the wear land merges at the interface of the side and bottom flank interface, with the maximum value at the interface edge, the maximum flank wear had the same measured value whether looking at the bottom flank or the side flank.
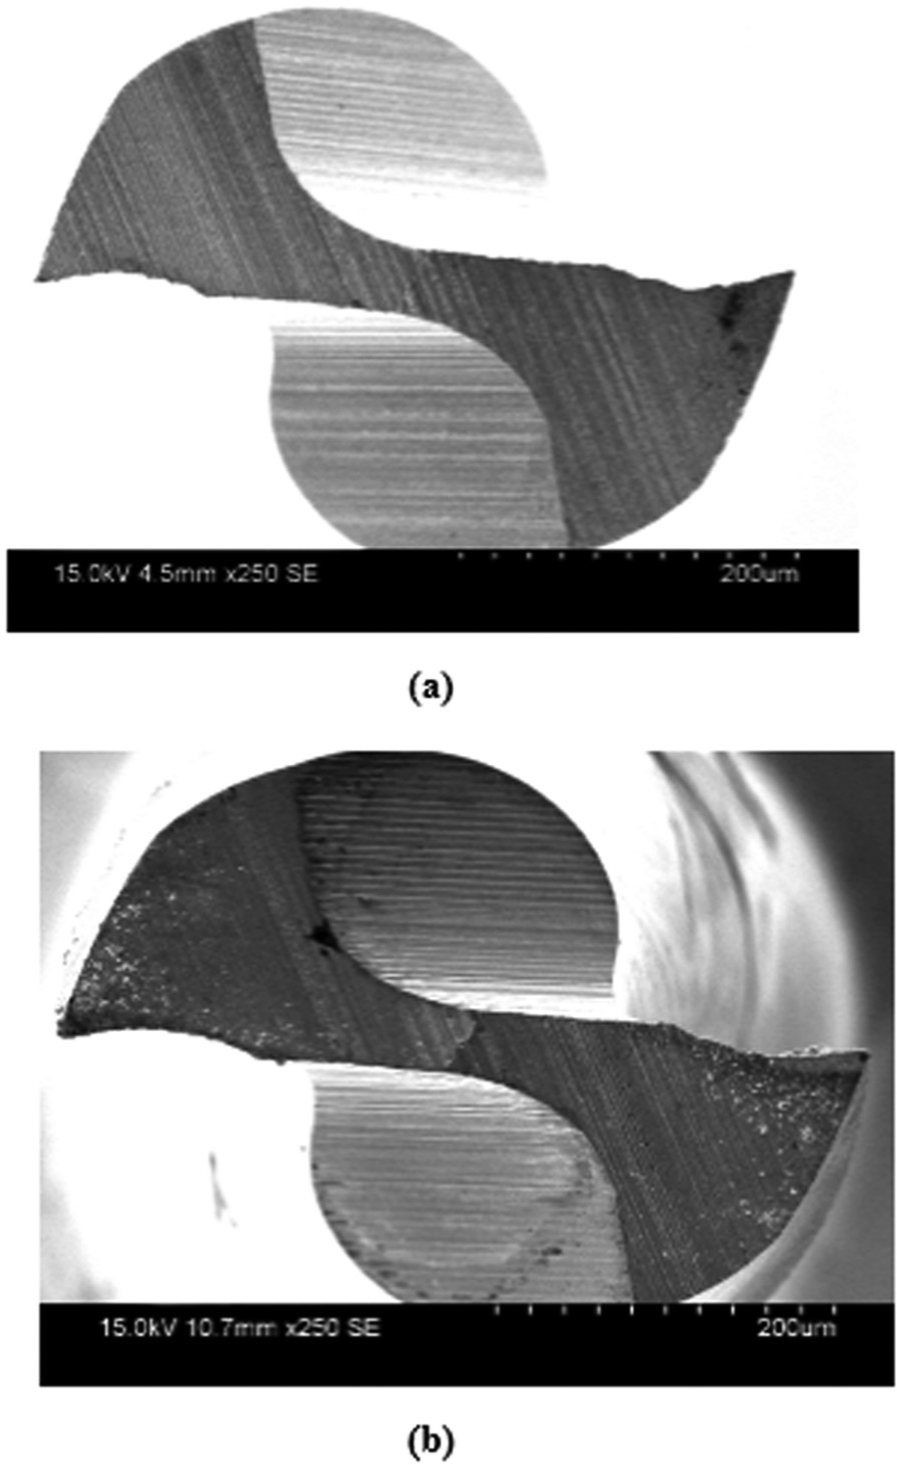
A typical micro-tool as seen under a scanning electron microscope: (a) new tool and (b) worn tool showing flank wear.
For comparison with macro-milling operations, a set of macro-milling experiments was similarly conducted based on the Taguchi’s L4 orthogonal array. All micro-milling experiments were conducted on a Mikron® 400 vertical milling machine using an HSK E40 high-speed spindle with a tool-collet system runout calibrated at 1 µm. The macro-milling experiments were conducted on a Takisawa vertical milling centre. The tools used in the micromachining experiments were 500 µm diameter DIXI-7240 uncoated carbide tools. The average grain size of the tools as reported by the manufacturers was 0.2–0.5 µm. The cutting edge radii of the tools were measured at different locations of each tool. These locations were the side cutting edges for the two flutes, measured from the top view of the tool, and bottom cutting edge from the top view of the tool, using a scanning electron microscope (SEM) (Figure 4). The average value of the tool edge radius was found to be 1 µm with a standard deviation of 0.11 µm. The macro-milling tests used TPMN160308-H13A throwaway inserts manufactured by Sandvik. These inserts were mounted on a 32-mm-diameter end-mill tool holder. Down-milling experiments were conducted for macro-milling, producing 4-mm slots. All experiments, macro- as well as micro-milling tests, were conducted dry in order to understand the tool–workpiece interactions, without the effects of variations that arise with coolants from different suppliers and their degradation with usage. Moreover, dry cutting also enabled investigation into the worst-case scenario in terms of cooling/lubrication/wear conditions, besides conforming to the green machining scenario.
The machining parameters for the Taguchi’s L4 orthogonal array were finalized based on the value of minimum chip thickness determined in a previous research. 4 Figure 5 shows the value for minimum chip thickness obtained therein. The average value was found to be 0.2–0.4 µm, which lies in a range between 20% and 40% of the average tool edge radius (1 µm), as shown in Figure 5.
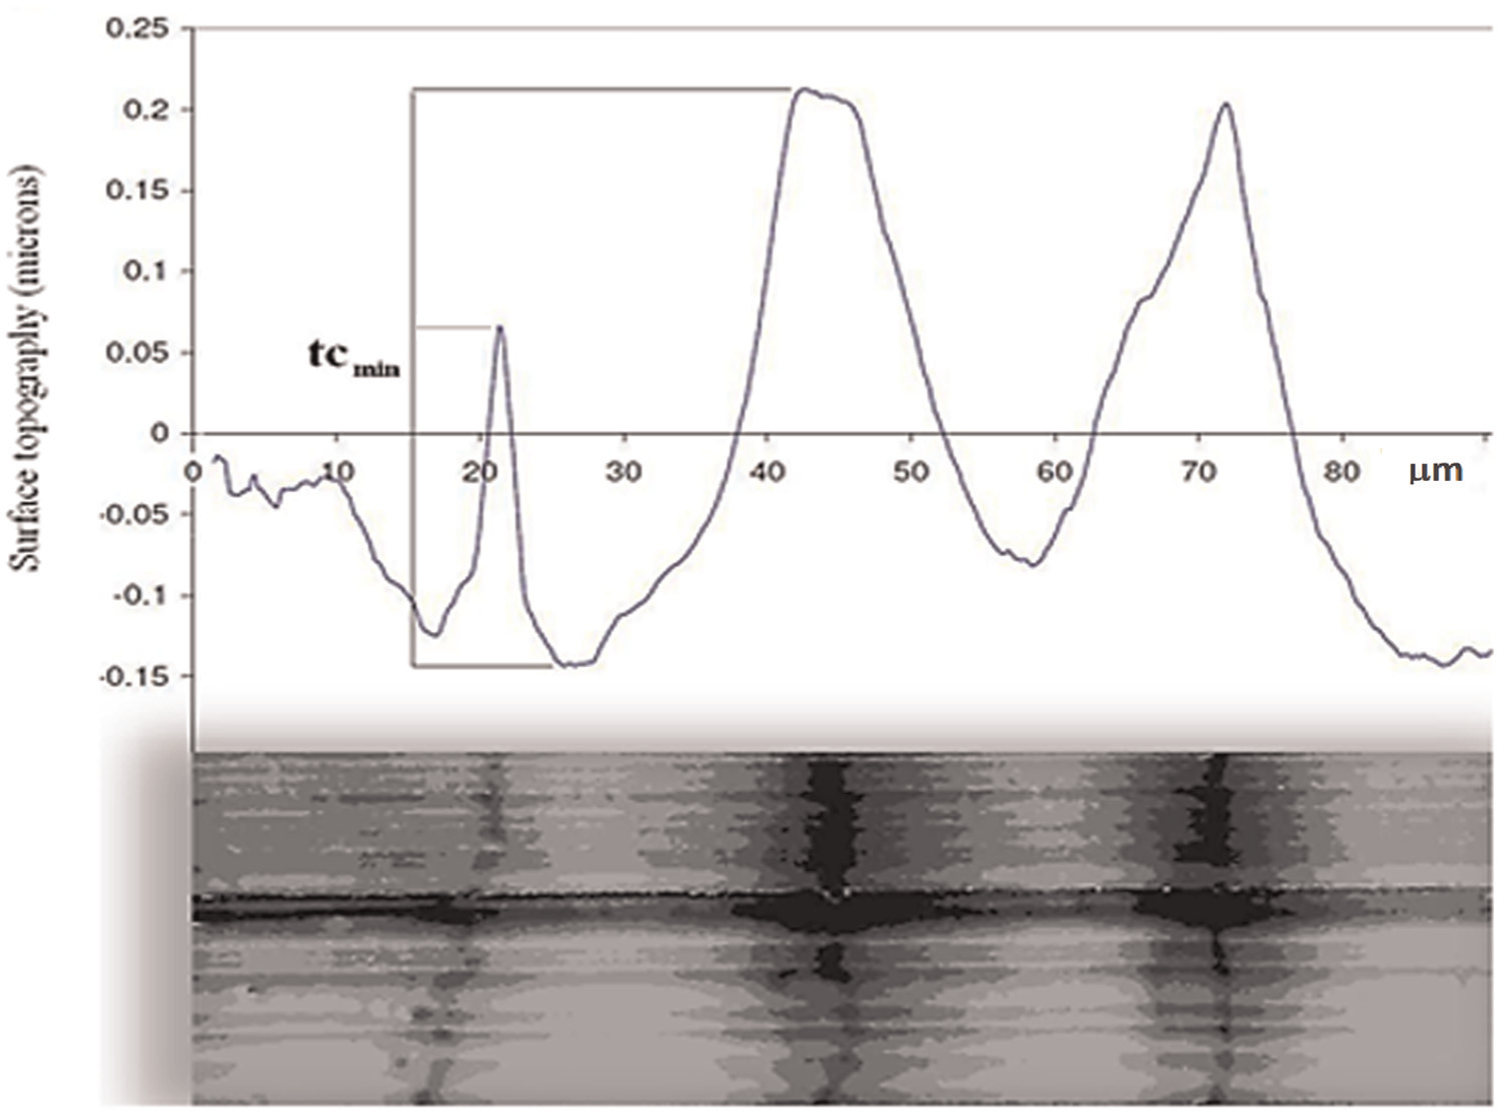
Value for minimum chip thickness obtained from the surface profile. 4
Experiments based on L4 arrays
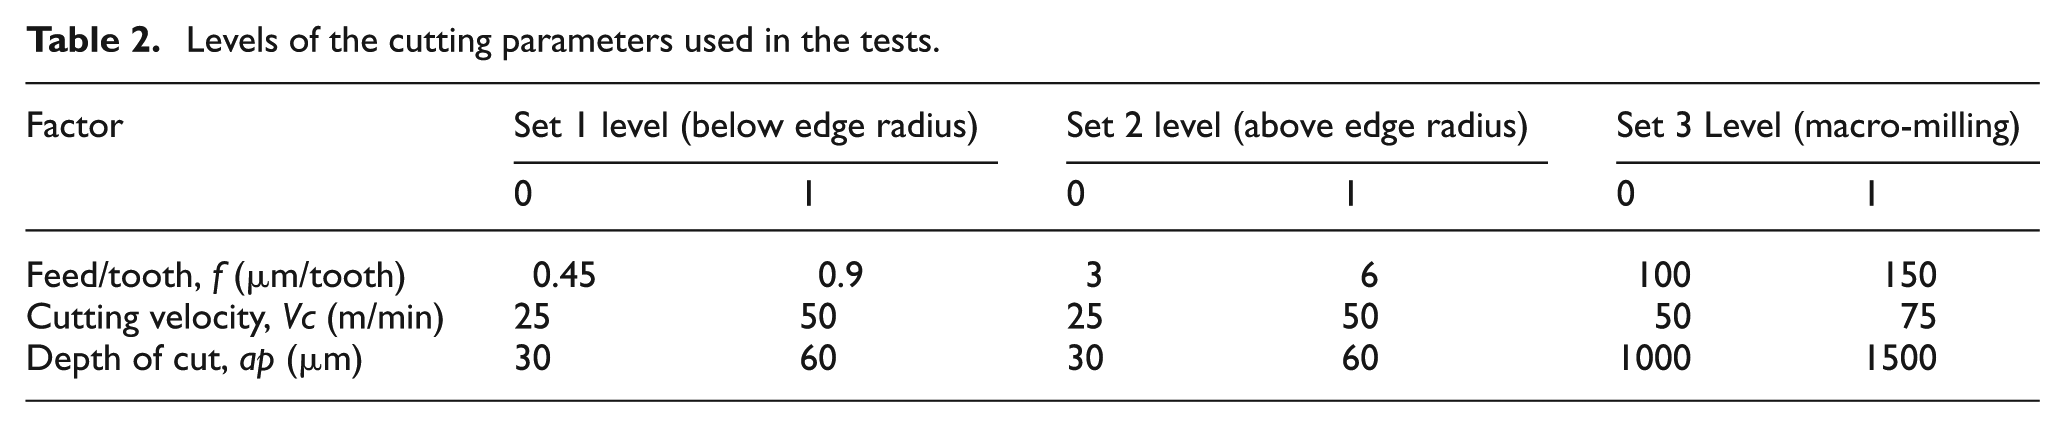
Table 2 defines the levels of the cutting parameters used in the experimental plan for the three sets of experiments described above. The feed speed and spindle rotations per minute can be determined using the following equations


Levels of the cutting parameters used in the tests.
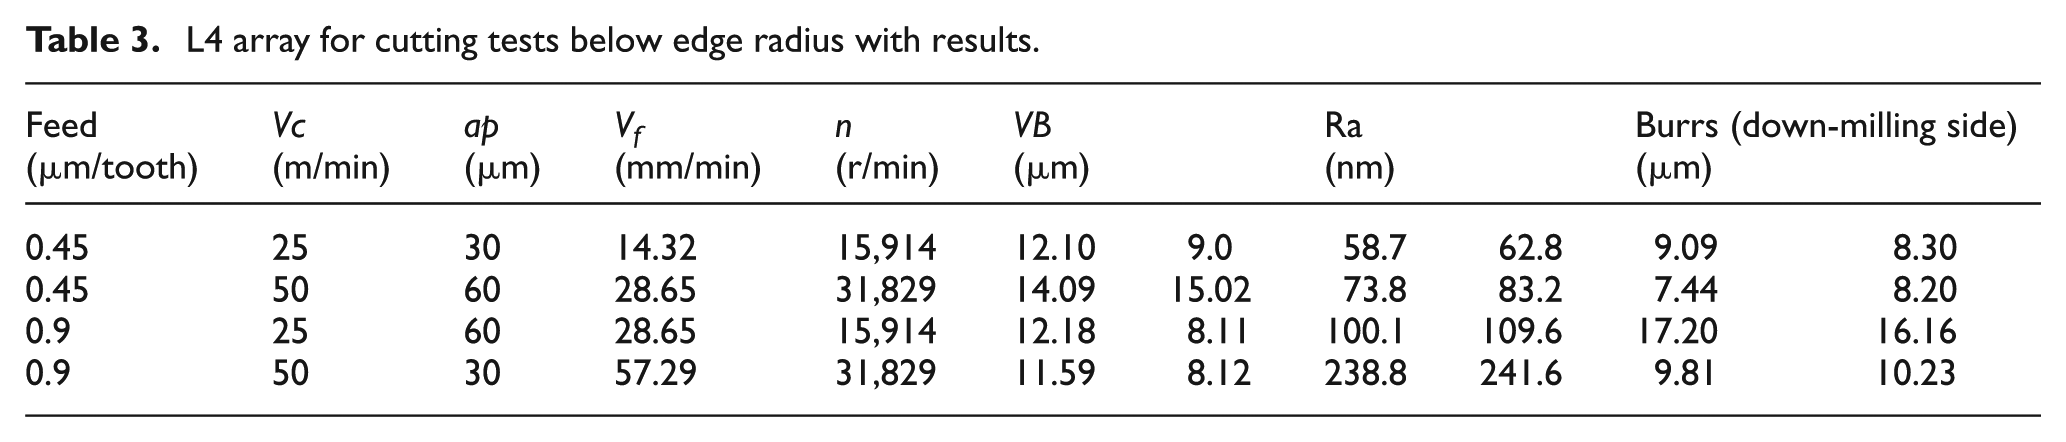
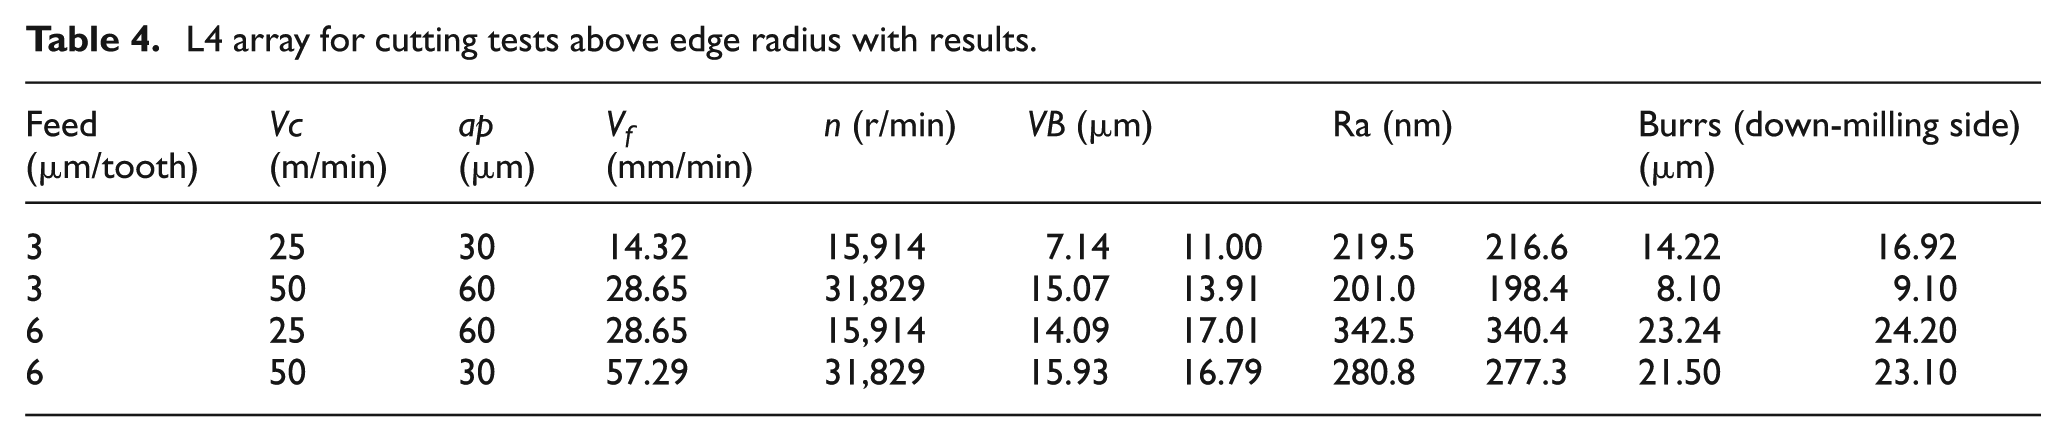
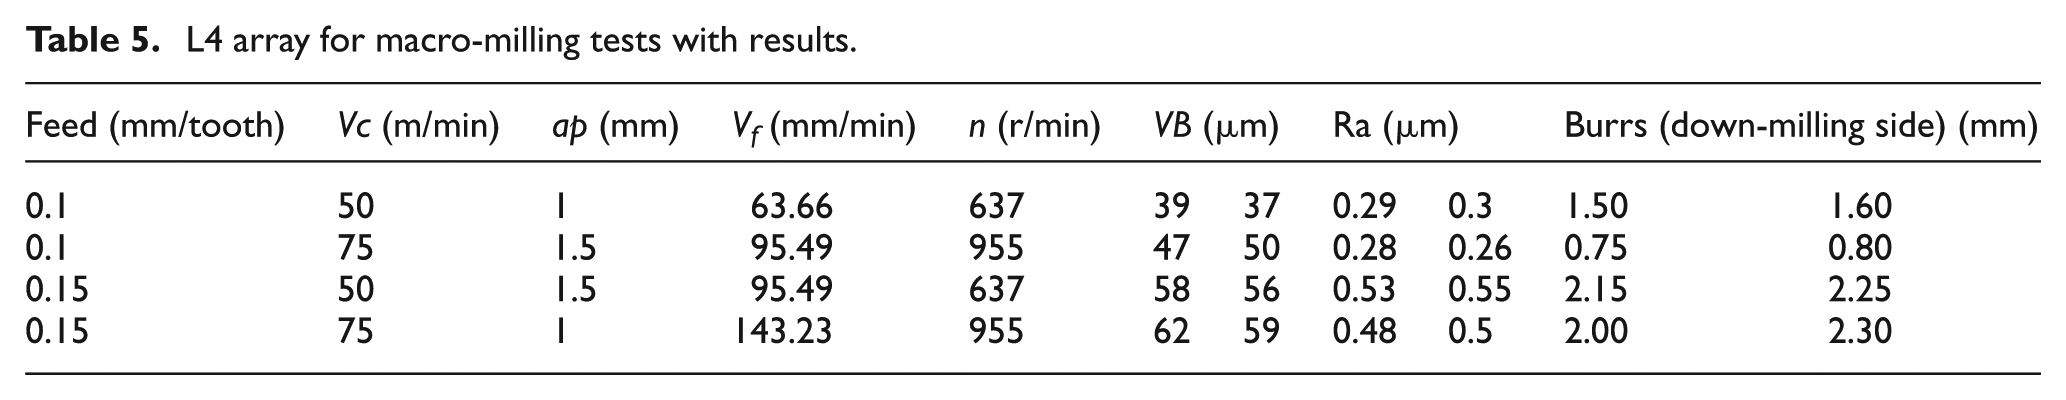
The actual values of feed speed and revolutions per minute are listed in Tables 3–5.
L4 array for cutting tests below edge radius with results.
L4 array for cutting tests above edge radius with results.
L4 array for macro-milling tests with results.
Results
The experimental results were obtained in the form of tool flank wear, the surface roughness of the milling slots and burr width. These results are presented in the form of L4 arrays in Tables 3–5. The tool flank wear was determined by examining the used tools under the SEM. The surface of the micro-slots was examined using WYKO® NT-1100 white light interferometer while the surface roughness for macro-milling tests was measured using a stylus-type Talysurf® surface profilometer.
While it is difficult to measure the curled 3D burr shape, especially in the micro-domain, the extent of burr formation can be quantified in terms of burr width as well as burr height, both being relevant from assembly point of view. 33 Out of the two, burr width can be measured easily in both macro- and micro-domains. The side burrs on the micro-milled slots were quantified by obtaining the burr width using SEM. Since the size of down-milling burrs came out to be greater than those for up-milling, down-milling burrs were considered more critical as they represent the worst-case scenario. The values for down-milling burrs were therefore used in the analysis.
Discussion
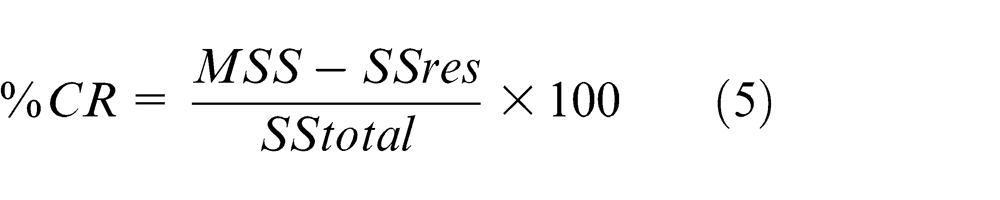
After design of experiments, the results obtained were statistically analysed using ANOVA. ANOVA was employed to break down the total variability of the results into components of variance and assess their significance. 34 This was performed by calculating the sum of squares (SS) for each parameter using the following equation

where n is the number of observation. A high value of variance (F-ratio) for a given factor indicates its high influence on the outcome. The percentage contribution or contribution ratio (% CR) can be determined by the equation
A p-value below 5% (0.05) shows that the process variable has a significant relationship with the measured outcome.
Tool flank wear analysis
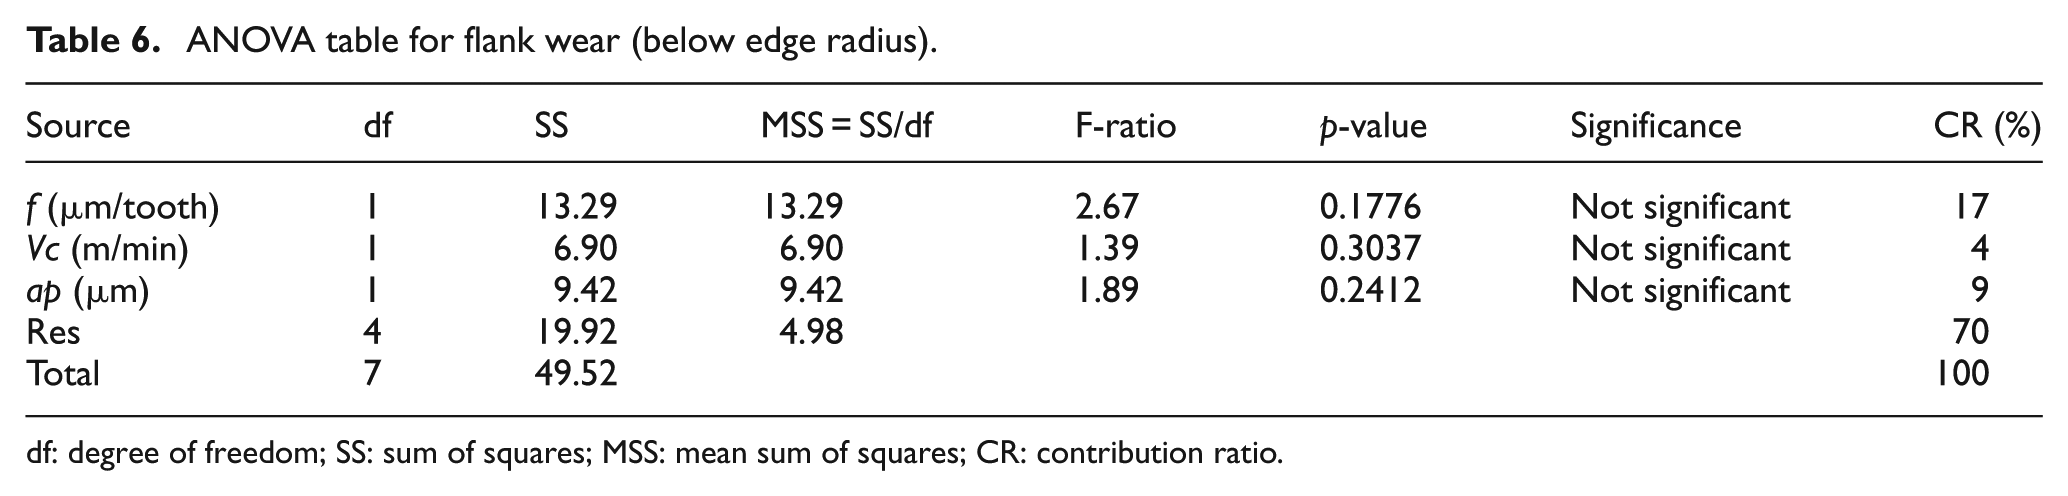
Flank wear is considered to be the most important gauge of tool life that also affects surface finish and product quality. This is because the tool flank interacts directly with the newly formed workpiece surface. Tool flank wear thus acquires greater importance in the micromachining domain due to the paramount importance of surface finish in micro-components. In order to evaluate the effects of machining parameters on the tool flank wear, ANOVA was also carried out for flank wear using the same methodology used in the case for surface roughness. Tables 6–8 present these results.
ANOVA table for flank wear (below edge radius).
df: degree of freedom; SS: sum of squares; MSS: mean sum of squares; CR: contribution ratio.
ANOVA table for flank wear (above edge radius).
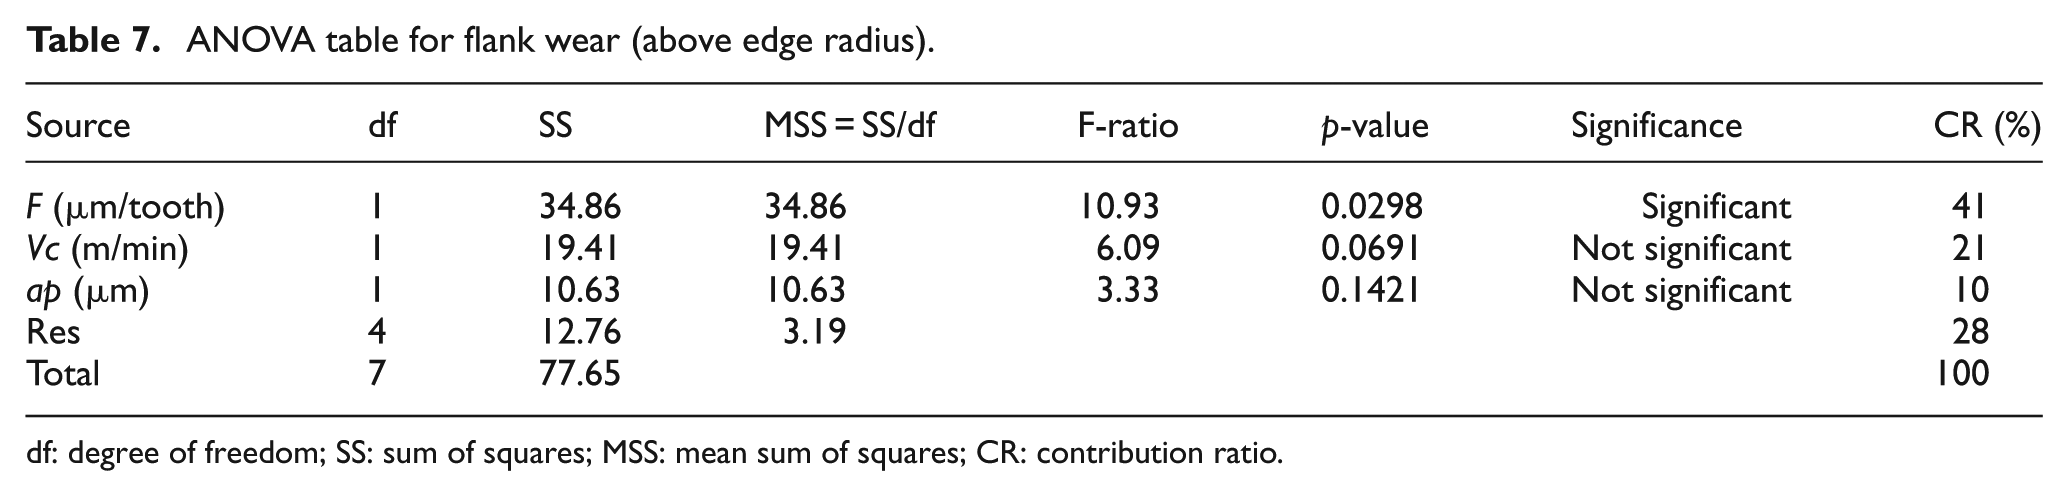
df: degree of freedom; SS: sum of squares; MSS: mean sum of squares; CR: contribution ratio.
ANOVA table for flank wear (macro-milling).
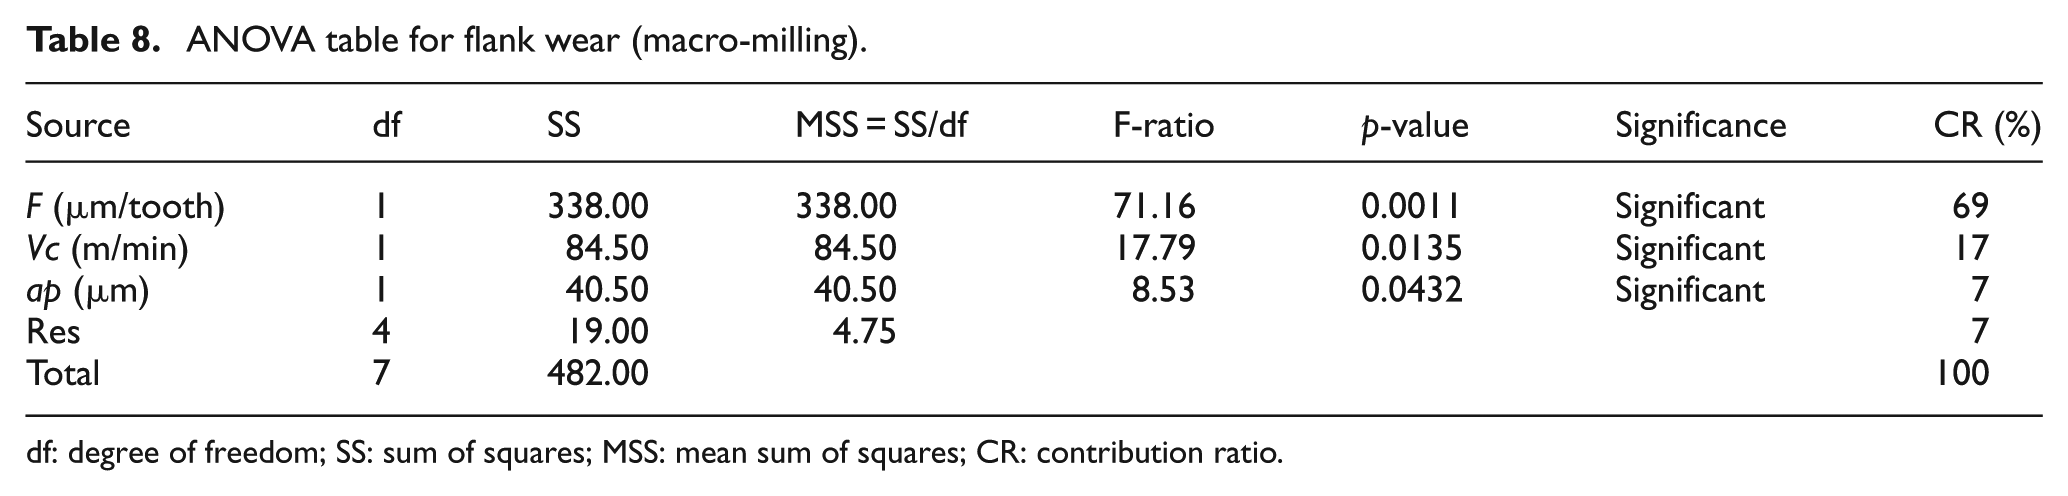
df: degree of freedom; SS: sum of squares; MSS: mean sum of squares; CR: contribution ratio.
Unlike in the case for macro-milling, the contribution of random variables on tool wear for micro-milling is significantly higher. Micro-milling below the tool edge radius appears more prone to residual effects than micro-milling above edge radius. This can be attributed to the fact that the fragile micro-tools are more prone to uncontrollable changes in environment or noise factors especially when operating below edge radius when minimum chip thickness and elastic recovery effects become dominant. In this scenario, the effects that may form a significant part of the residual spectrum tend to dominate. As a result, tool wear remains highly stochastic and unpredictable when operating under these conditions. At feeds above the tool edge radius, tool wear is more deterministic and predictable, much closer to macro-machining.
Figure 6 shows flank wear progression for the micro-tools operated under various cutting parameters. It is interesting to note here that a tool showing a higher tool life may not be the best performing tool as the material removed by that may be less than another tool with shorter life but higher material removal rate. While the tool operating at f = 0.45 µm/tooth, Vc = 25 m/min and ap = 30 µm shows the longest tool life, in terms of the length of cut produced by the tool for a given value of flank wear, the tools operating at f = 0.9 µm/tooth, Vc = 25 m/min and ap = 60 µm and f = 6 µm/tooth, Vc = 25 m/min and ap = 60 µm show a higher material removal rate. Besides these parameters, product quality in terms of surface finish and burrs are also important parameters when considering tool performance.
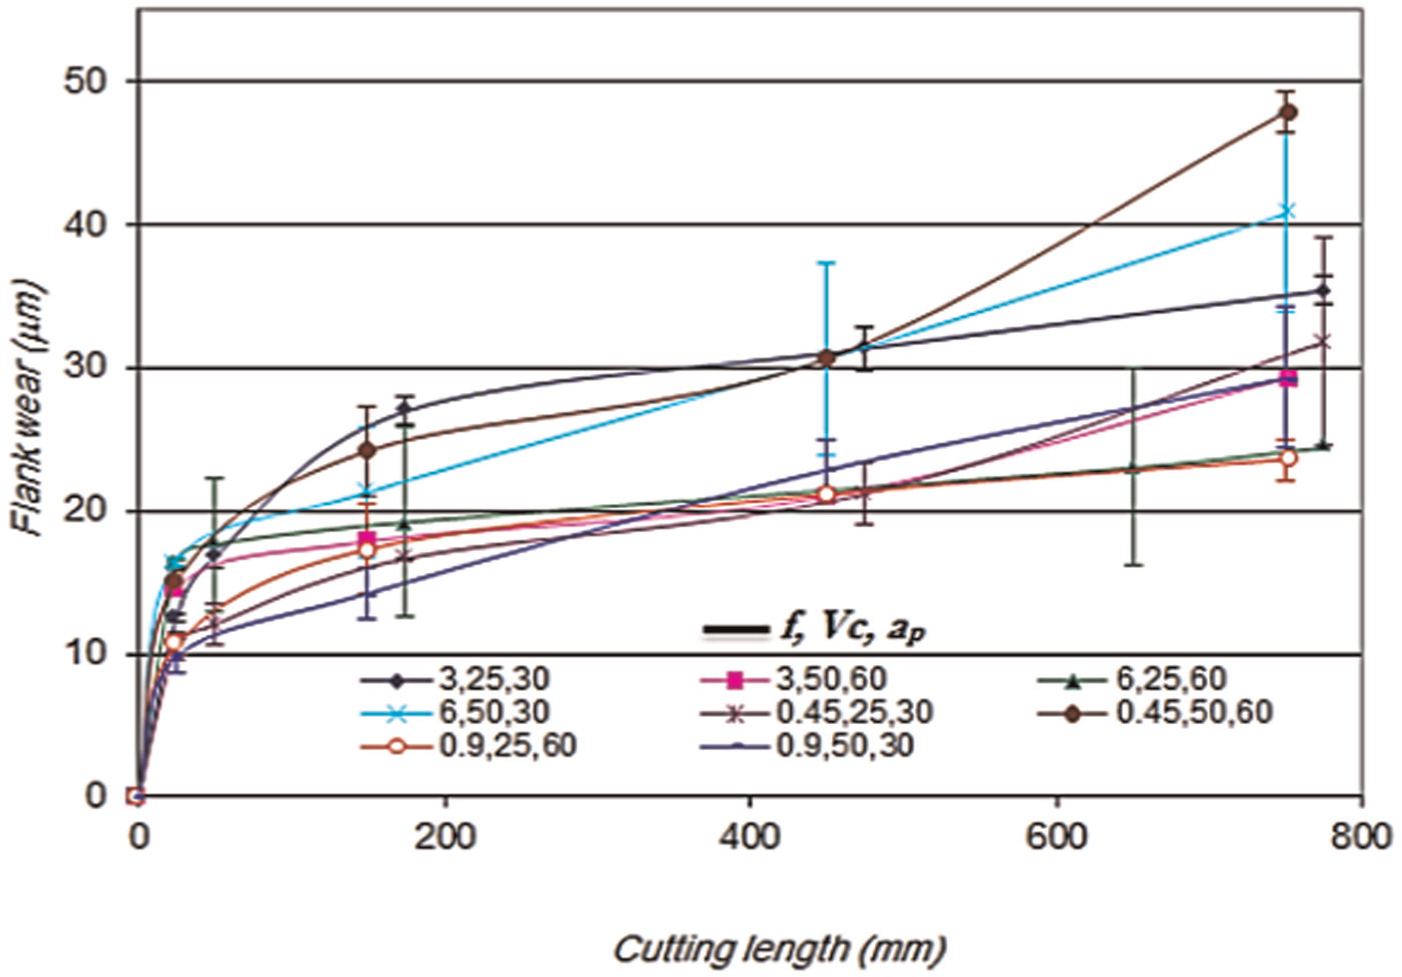
Flank wear progression of micro-tools at various cutting parameters.
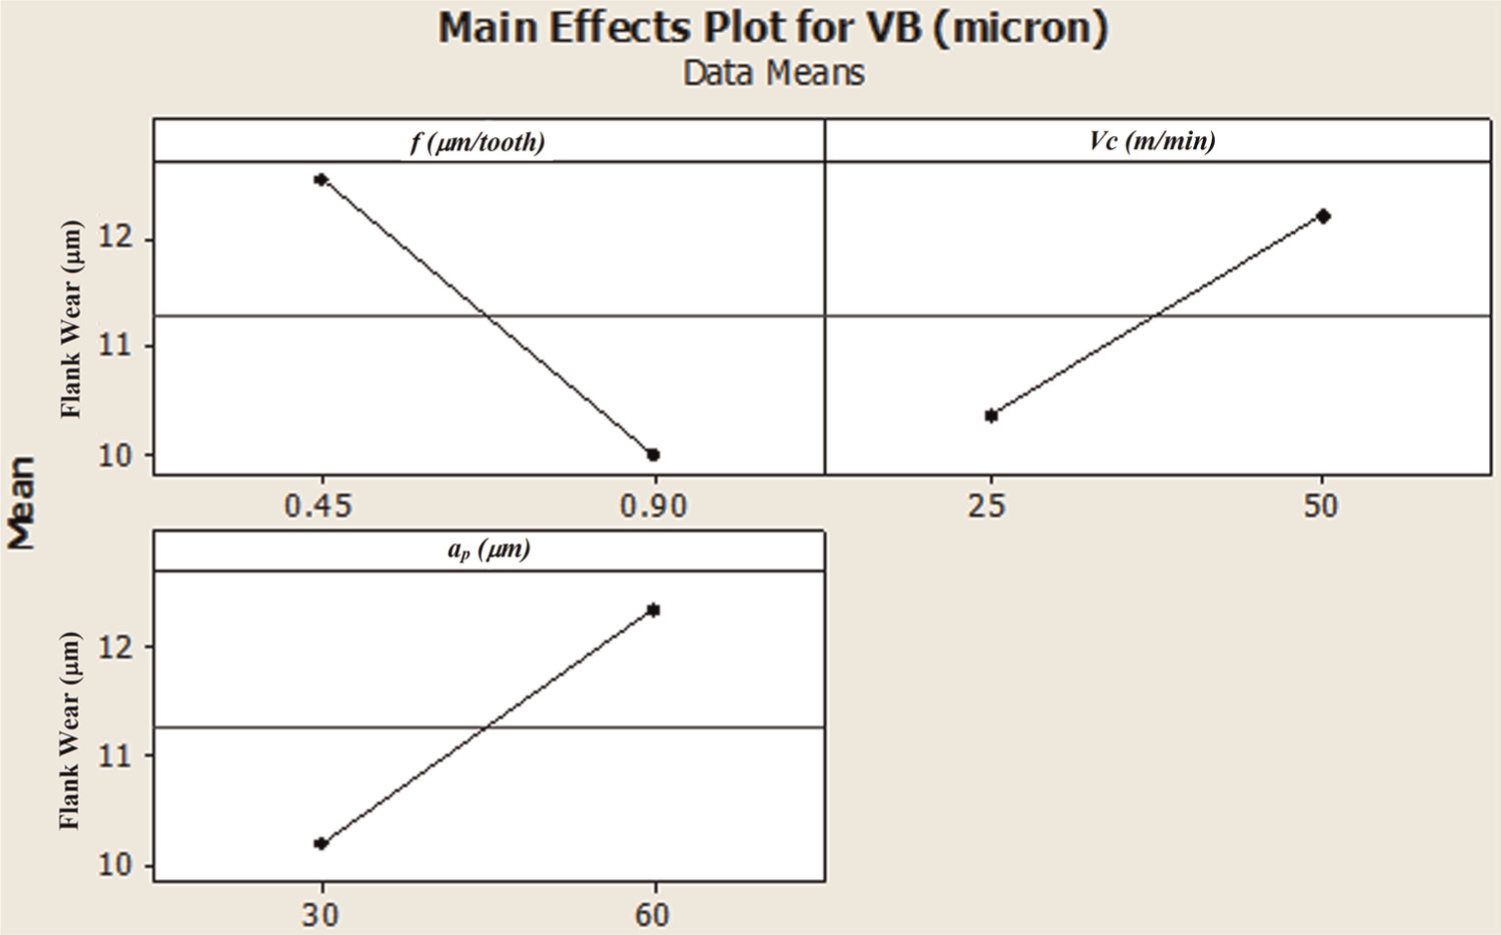
The main effect plots for tool flank wear were generated using Minitab® software. Similar to the CRs, the main effect plots also show that micro-milling carried out above edge radius using the micro-tools gives values that are intermediate between macro-milling and micro-milling performed below edge radius. It is interesting to note that tool wear, quantified by the value of flank wear, VB, decreases as the feedrate was changed from close to the minimum chip thickness (0.45 µm/tooth) to a value close to the average tool edge radius (0.9 µm/tooth), as shown in Figures 7–9. This can be attributed to the elastic recovery effects that are more intense when the tool is cutting at a feedrate close to the minimum chip thickness of the workpiece material.
Main effect plots for flank wear with respect to machining parameters (below edge radius).
Main effect plots for flank wear with respect to machining parameters (above edge radius).
Main effect plots for flank wear with respect to machining parameters (macro-milling).
The results also show that tool life would decrease with an increase in all the investigated parameters in micro-milling above the tool edge radius as well as macro-milling. An earlier research reported that as the cutting speed increases, the tool life decreases very sharply as was found during conventional turning experiments with Ti-6Al-4V alloy. 35
Surface finish analysis
Owing to the higher surface area-to-volume ratio for miniaturized products, the monitoring and control of surface finish requires greater attention in micromachining. 33 Furthermore, when dealing with titanium-based alloys that have vast applications as biomedical and aerospace micro-components, the requirements for surface finish become more stringent. For the micro-milling experiments, ANOVA technique was applied for surface finish analysis and compared with the macro-milling results. Tables 9–11 present ANOVA for surface roughness obtained at different processing conditions.
ANOVA table for surface finish (below edge radius).
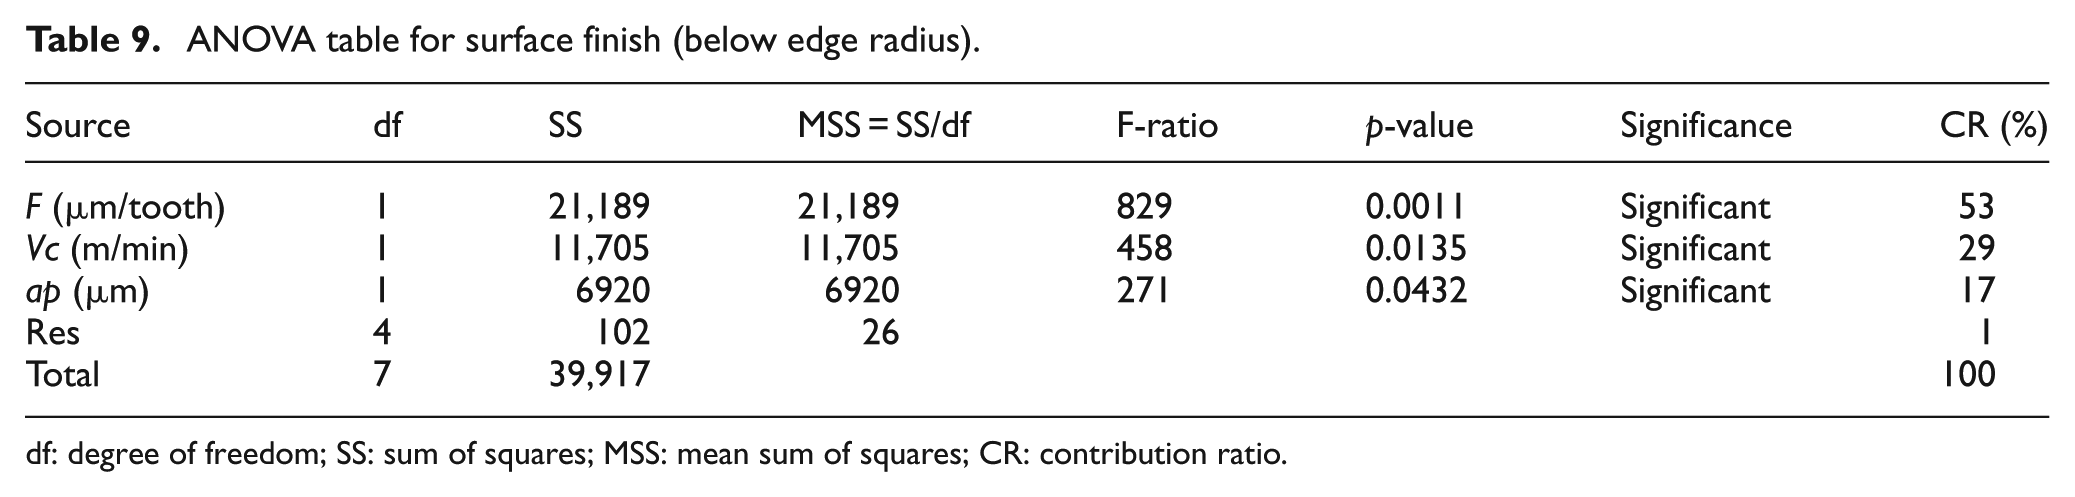
df: degree of freedom; SS: sum of squares; MSS: mean sum of squares; CR: contribution ratio.
ANOVA table for surface finish (above edge radius).
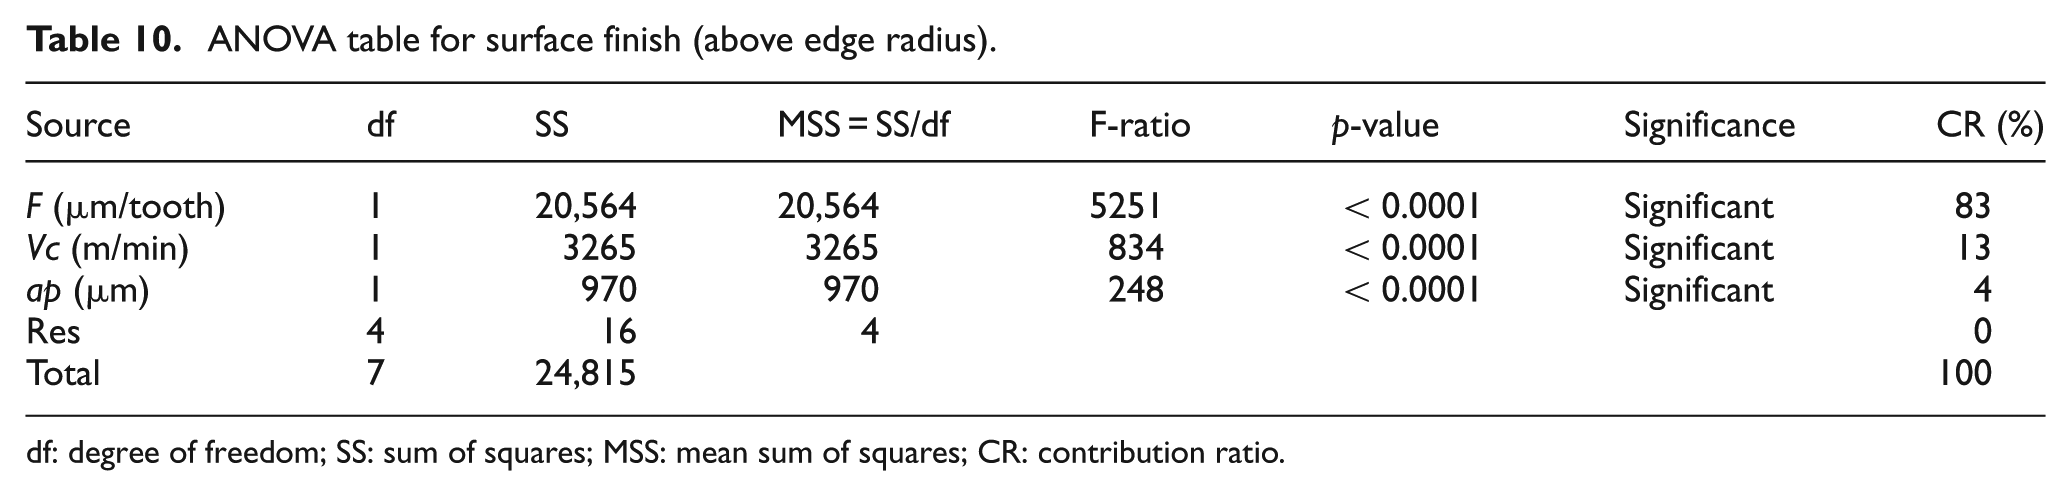
df: degree of freedom; SS: sum of squares; MSS: mean sum of squares; CR: contribution ratio.
ANOVA table for surface finish (macro-milling).
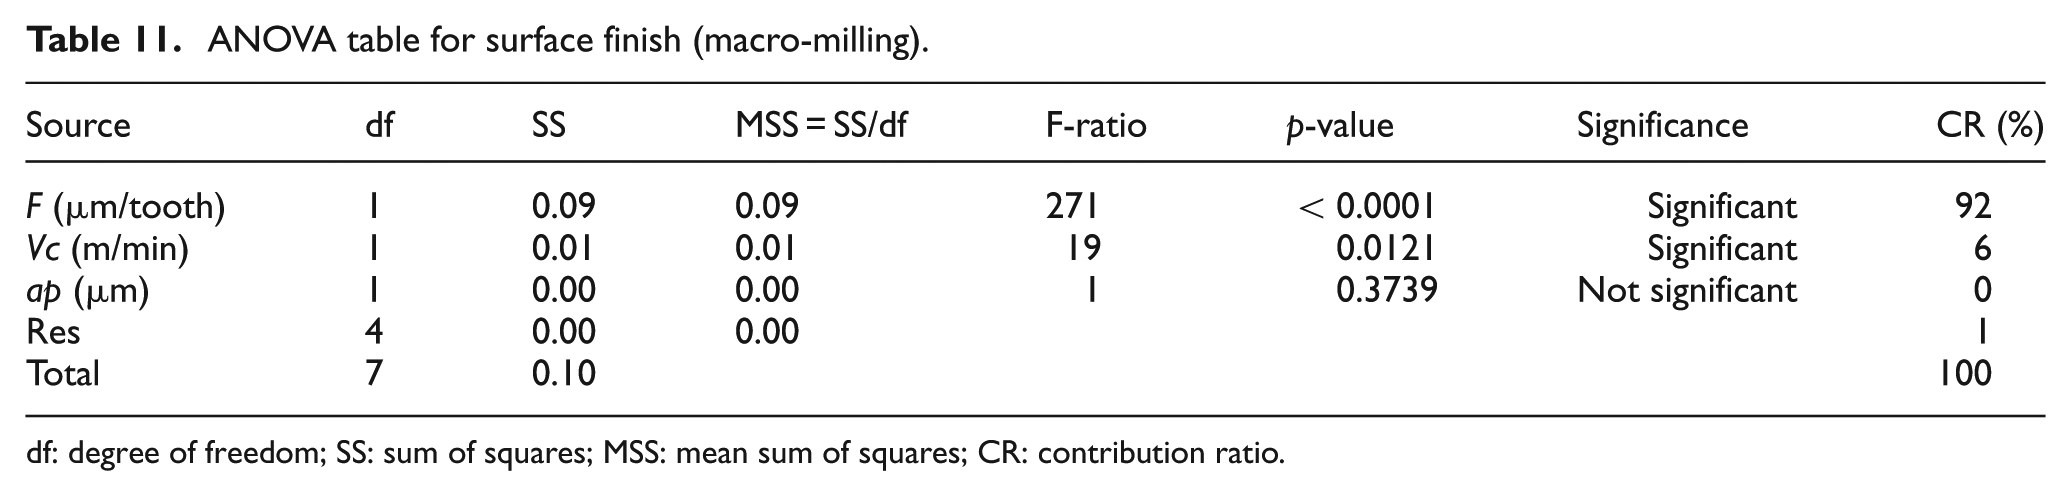
df: degree of freedom; SS: sum of squares; MSS: mean sum of squares; CR: contribution ratio.
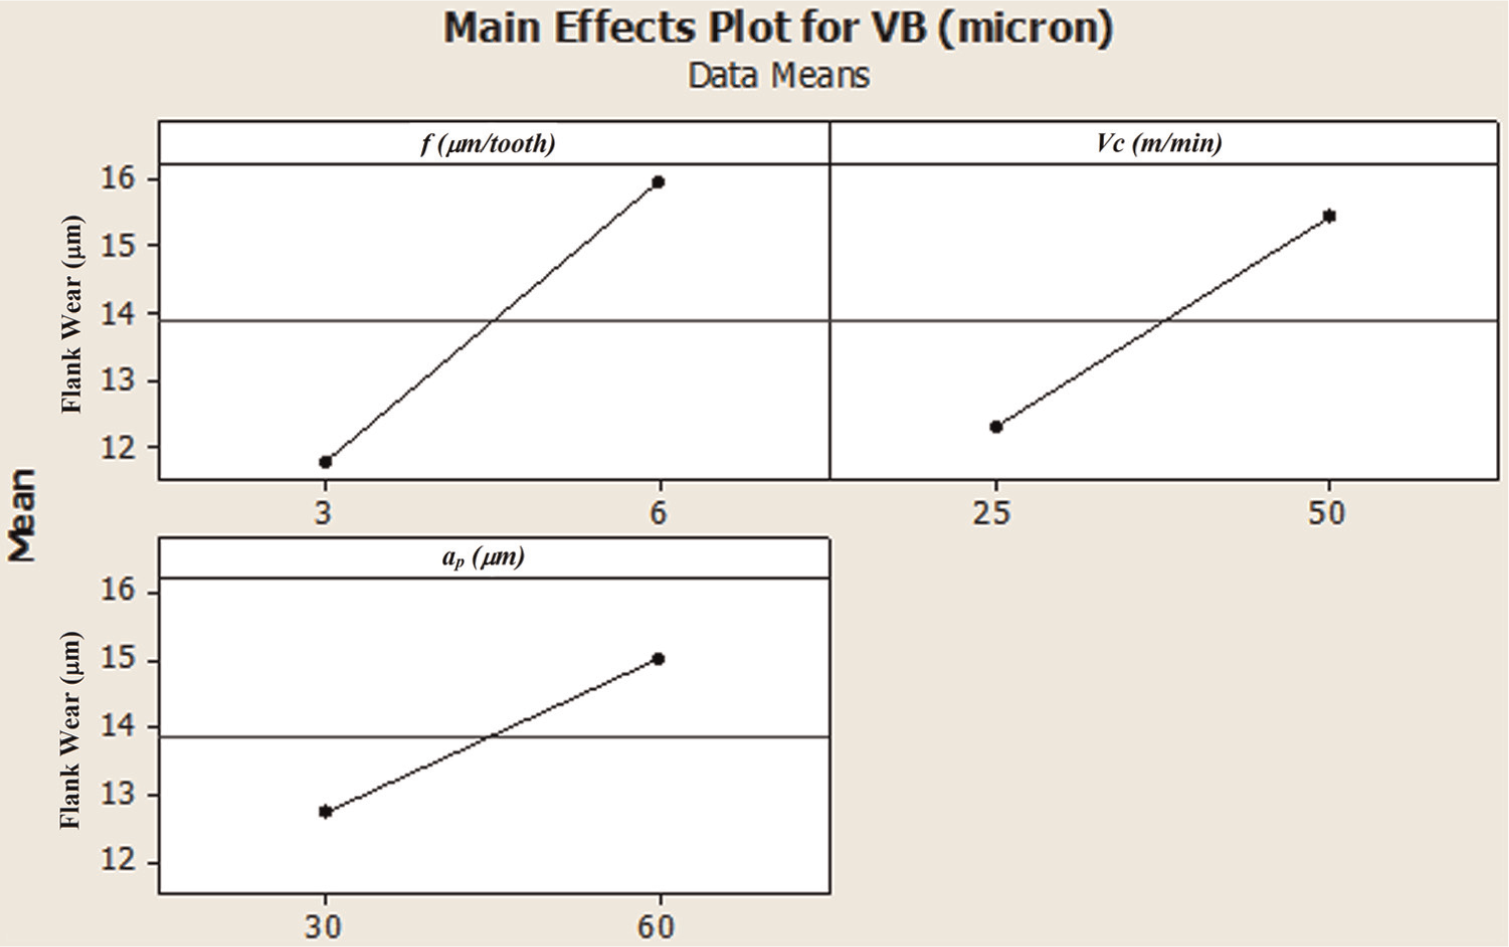
Overall, lower surface roughness was obtained when machining at feeds below the tool edge radius. The transition from cutting depth above the tool edge radius to cutting depth below the tool edge radius reduces the dominance of the feedrate on tool performance. However, the feedrate still remains the most dominant contributing parameter. This observation is in conformance with a recent finding. 36 It was reported that below the feedrate of 0.5 µm/tooth, the surface roughness improves with higher feedrate. Thus, the feedrates around 0.45–0.5 µm/tooth were considered suitable for minimum surface roughness. A similar research undertaking in micro-milling of Inconel 718 alloy showed that below edge radius, the effects of the feedrate and cutting speed were significant as compared with axial depth of cut. 37 However, some variation in CR exists between values reported from Inconel 718 and Ti-6Al-4V. This could be attributed to the difference in materials, their properties, grain size and microstructure. Apart from the feedrate, the contribution of the depth of cut (ap) also becomes significant when feed is set at values below the tool edge radius. The ANOVA tables for surface finish of micro-milling thus reveal a marked departure from macro-milling principles for the feedrates below edge radius.
Figure 10 shows the variation in surface roughness across the length of the slot generated. It is interesting to note that surface roughness variation is not a random effect as the stability of the curves shown here depends on the machining conditions while the error bars show that there is good repeatability of results. Based on this information, more predictable conditions should be selected for applications where surface quality is a critical product design parameter. From this figure, a slot machined at (f = 0.9, Vc = 50, ap = 30) appears less predictable as compared with (f = 0.45, Vc = 50, ap = 30) despite both conditions similar average values for surface roughness.
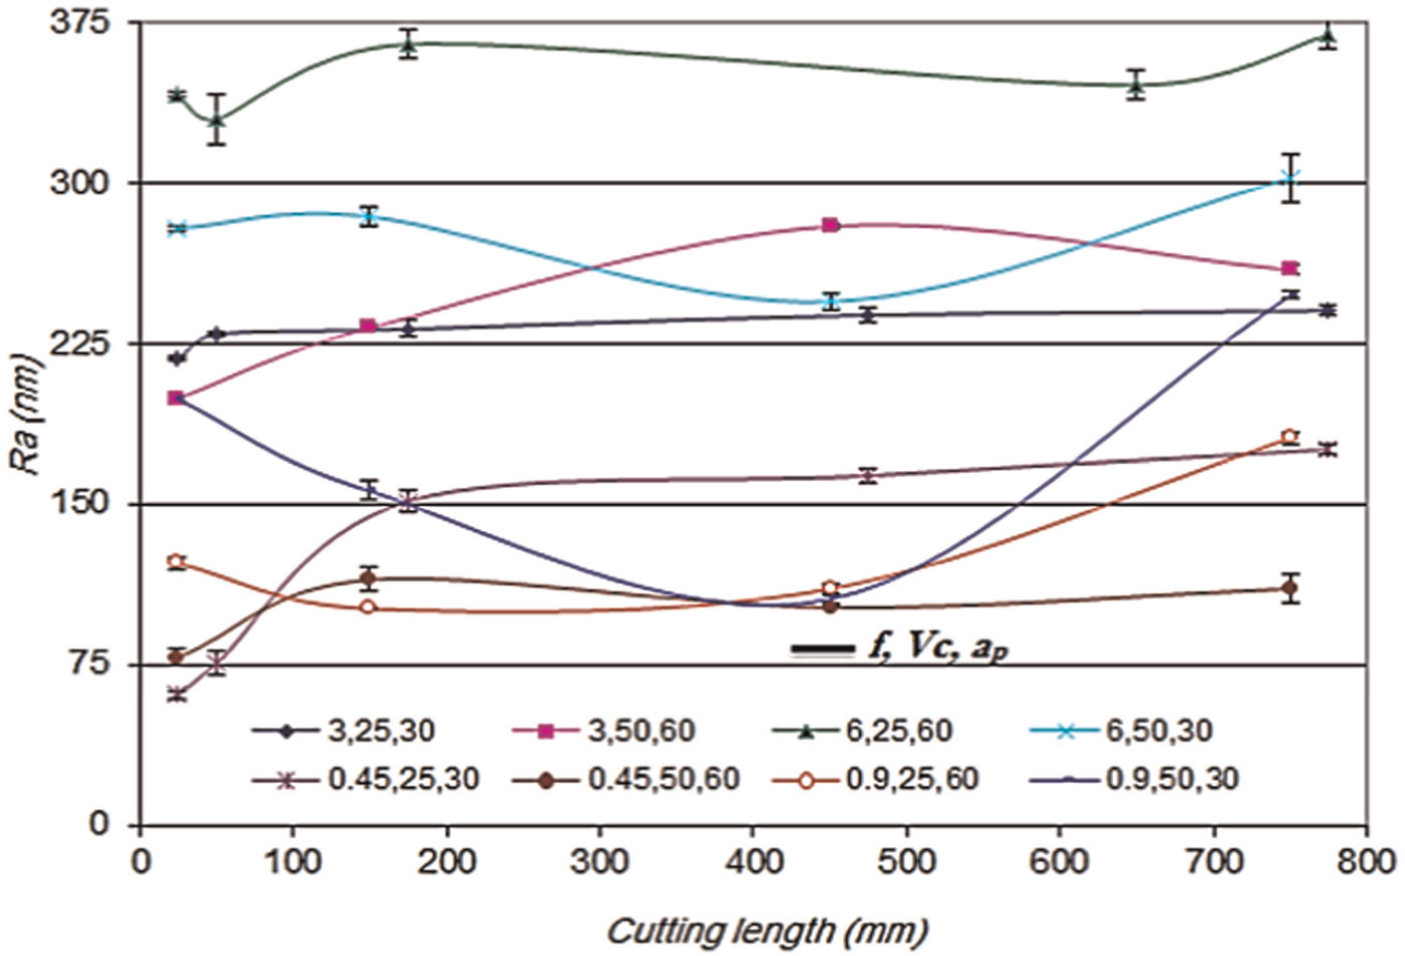
Ra progression of micro-tools at various cutting parameters.
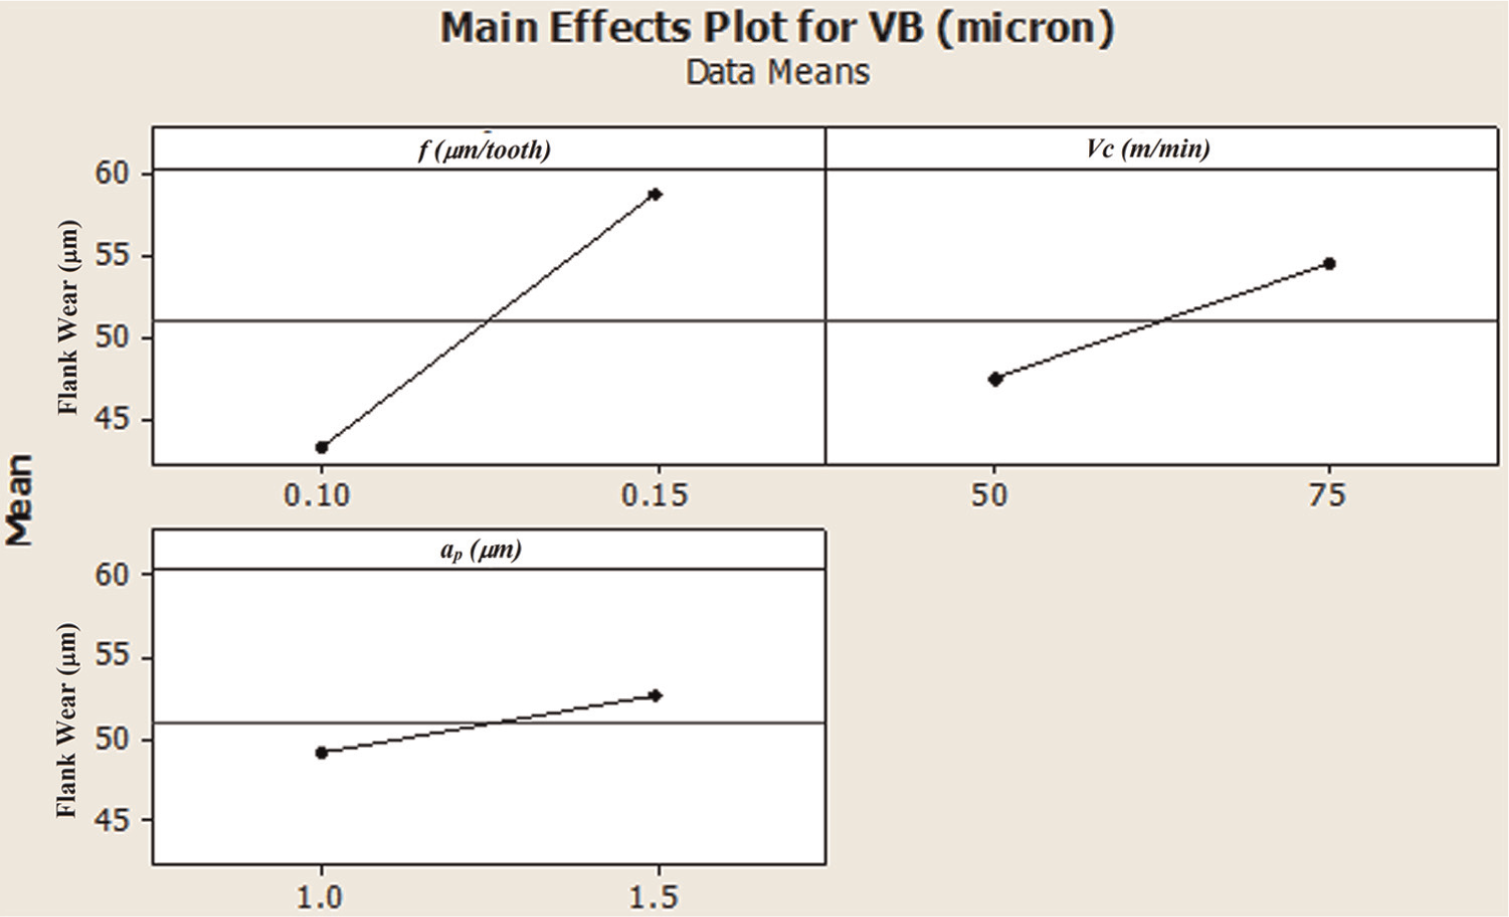
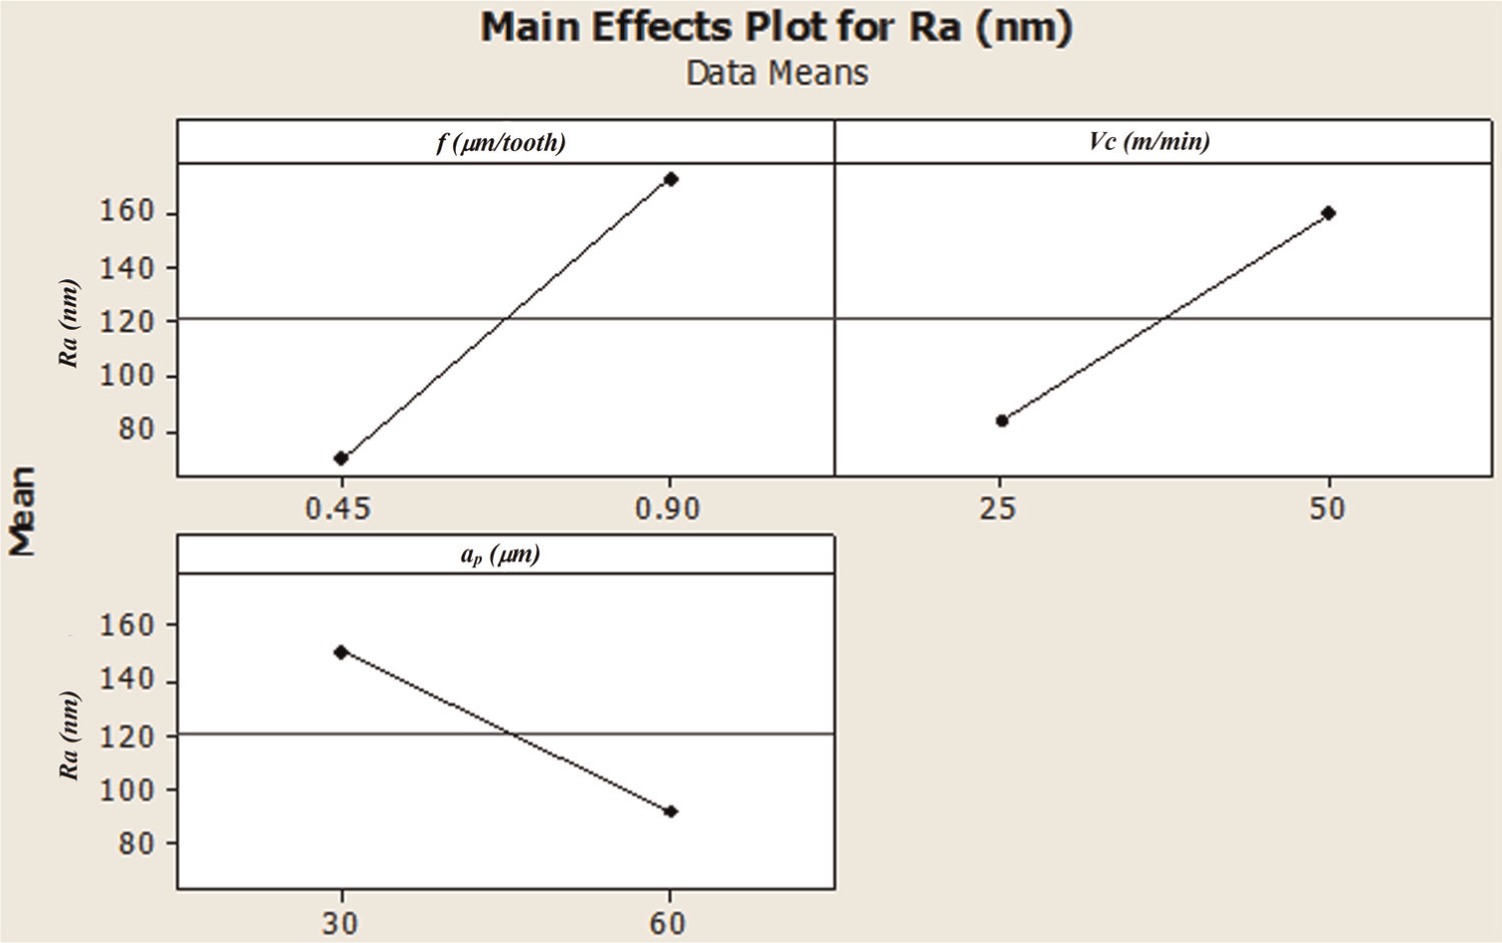
In order to assess the effects of the machining parameters on the surface finish, the main effect plots were also constructed for statistical analysis (Figures 11–13). Similar to the CRs, these plots also show that micro-milling carried out above edge radius gives intermediate values between macro and micro-milling performed below edge radius As compared with the flank wear graphs shown earlier, the flank wear is increased when machining is performed close to the minimum chip thickness. From Figures 11–13, it was also noted that the surface finish shows improvement at around 50% of the tool edge radius as compared with that obtained when machining close to the tool edge radius. This finding can be ascribed to the effects of burnishing which takes place at low feedrate.
Main effect plots for Ra with respect to machining parameters (below edge radius).
Main effect plots for Ra with respect to machining parameters (above edge radius).
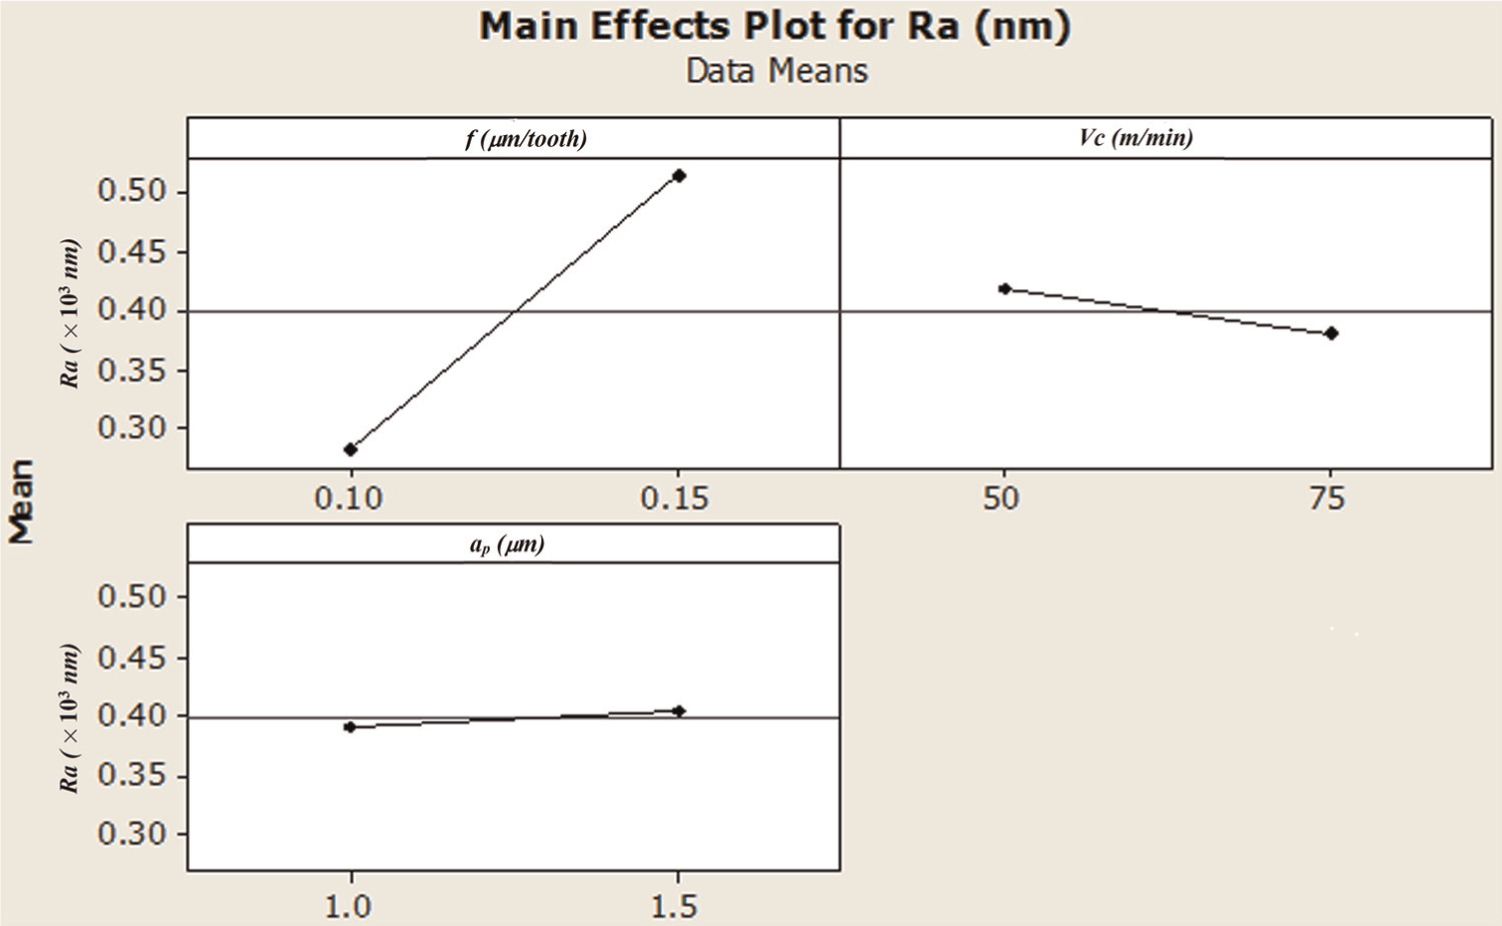
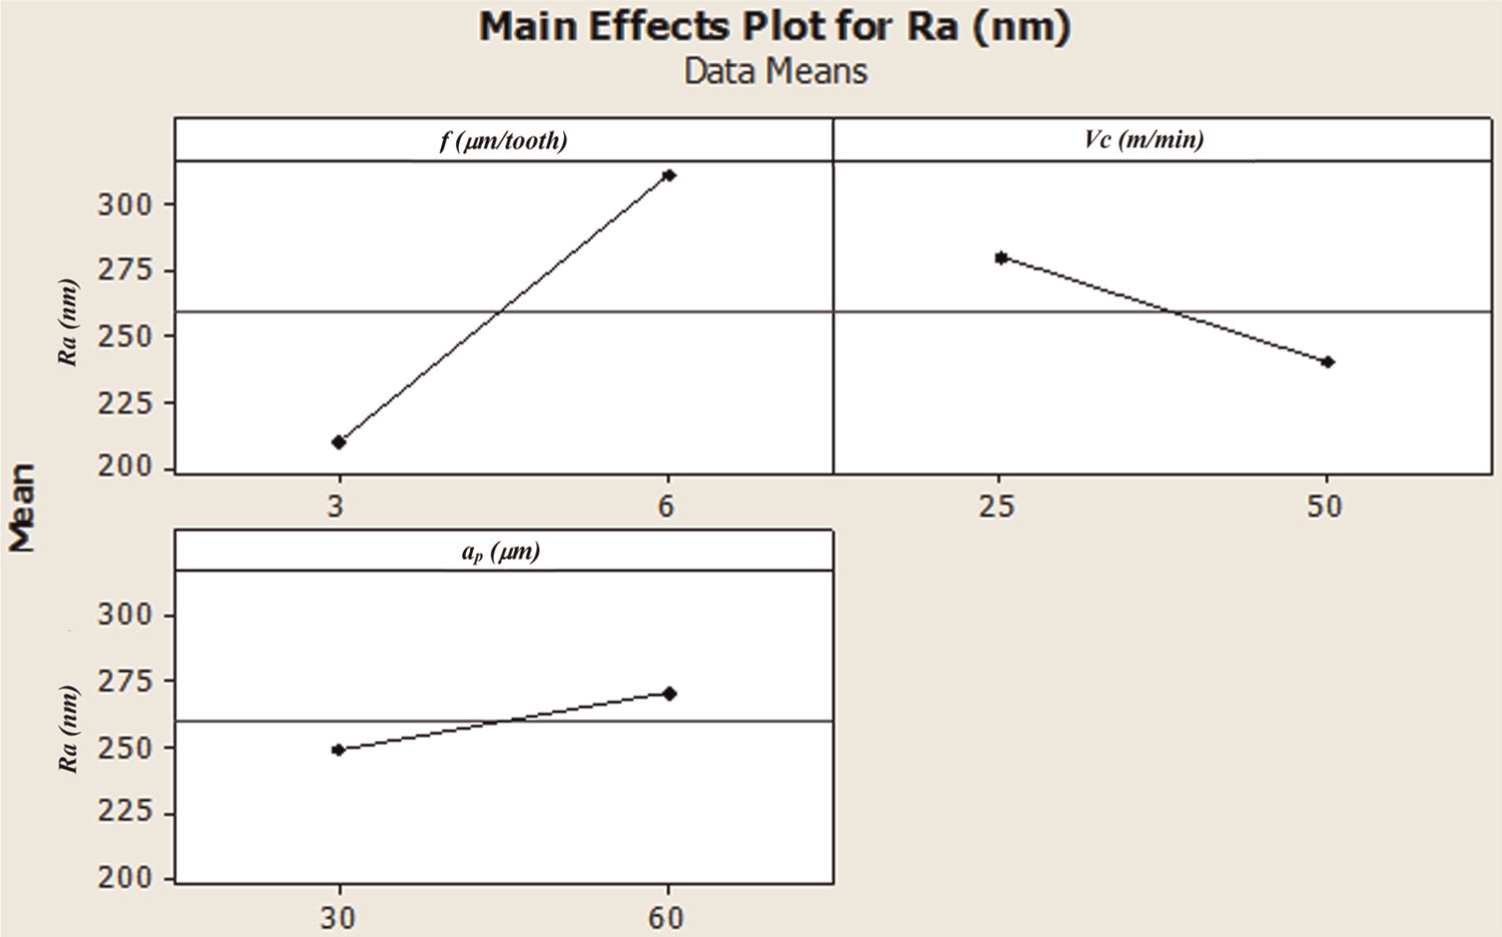
Main effect plots for Ra with respect to machining parameters (macro-milling).
The results shown in Figure 13 are in conformance with the findings reported earlier, wherein surface roughness (Ra) during macro-milling of Ti-10V-2Fe-3Al showed an increasing trend with an increase in the feedrate (feed per tooth), while it decreased with cutting speed in the range shown in this figure. 38 It was also reported that improvement in surface roughness (reduced Ra) along with an increase in surface residual stress improved fatigue life performance. Furthermore, it was recommended that in the case for macro-turning of Ti-6Al-4V alloy, better surface finish can be achieved with higher cutting speeds albeit at the cost of tool life. 35
Burr formation analysis
Micro-components are inherently fragile as well as difficult to handle manually. This makes post-processing of these products, especially burr removal, extremely difficult. Since de-burring requires post-processing of parts, which may not be possible in many cases for micro-components, suppression of burr development in micromachining commands special research interest. 2 Furthermore, the de-burring processes can distort the workpiece, change its dimensions as well as important mechanical properties such as elastic limit, surface finish, residual stresses, corrosion resistance, fatigue strength and electrical resistivity. 39 ANOVA was also carried out using the values of burr width as the outcome to identify the KPVs involved with the magnitude of burr formation. Since burr size tends to be greater on the down-milling side of a milling slot (as evident in Figure 14), only down-milling burrs were considered in this analysis to account for the worst-case scenario. Tables 12–14 present the ANOVA with CRs of each machining parameters. Figure 15 shows the variation in surface roughness of the micro-slots against cutting time and the length of cut. ANOVA for burr formation also reveals a similar trend as the machining parameters are varied from the ‘below edge radius’ region to ‘above edge radius’. The CRs in the latter case tend to be more towards the macro-machining domain.
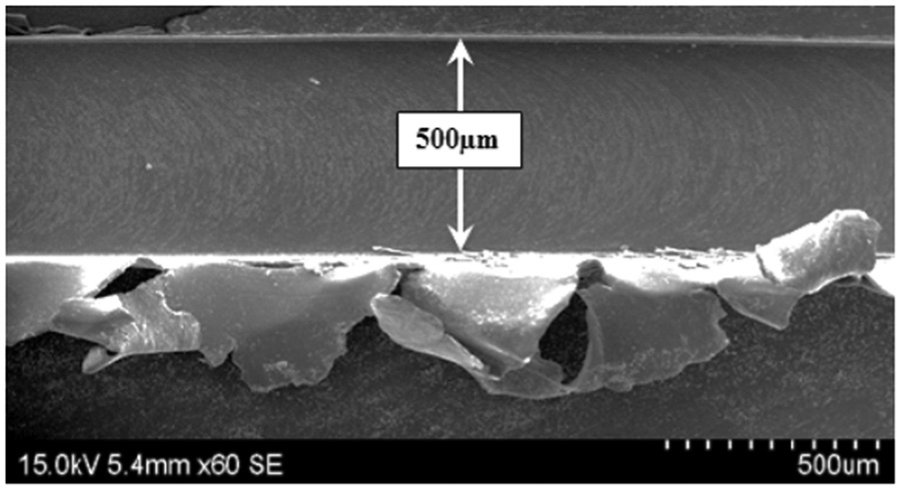
Burr formation during macro-milling.
ANOVA table for burr width (below edge radius).
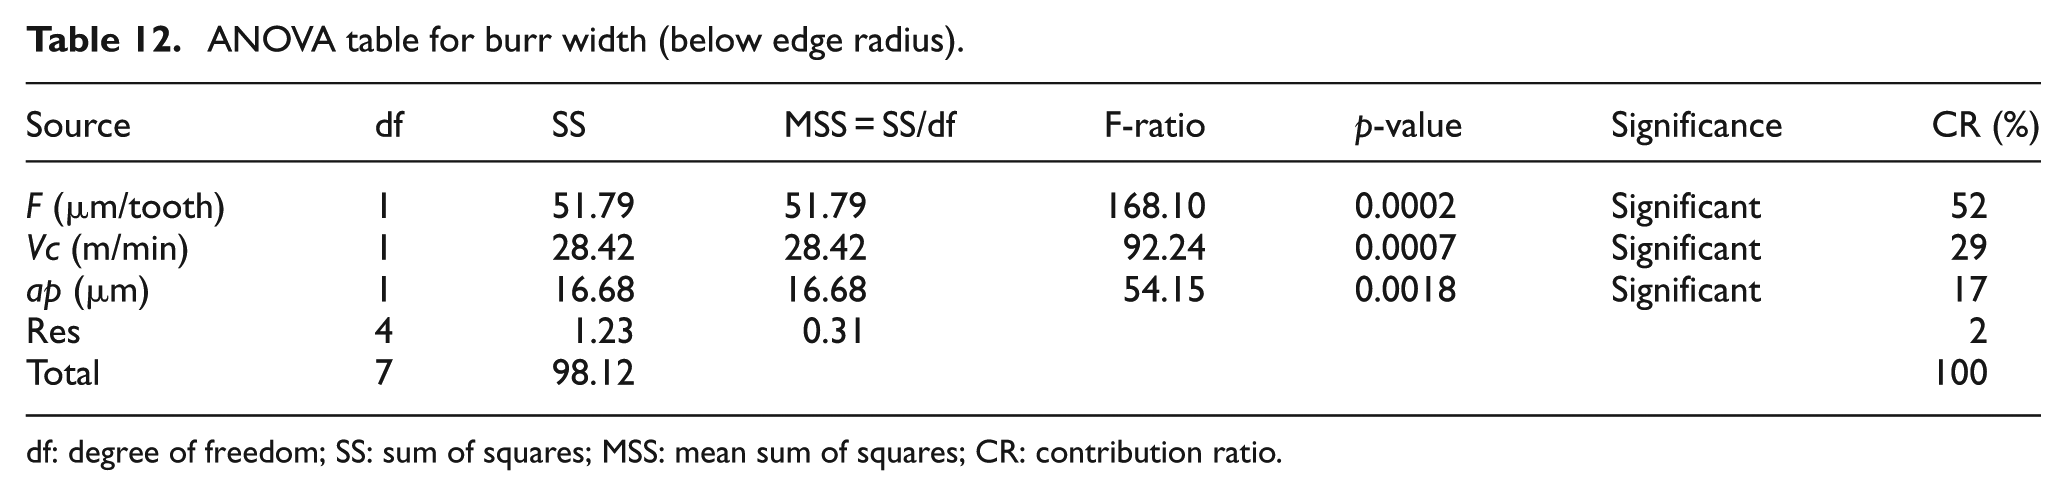
df: degree of freedom; SS: sum of squares; MSS: mean sum of squares; CR: contribution ratio.
ANOVA table for burr width (above edge radius).
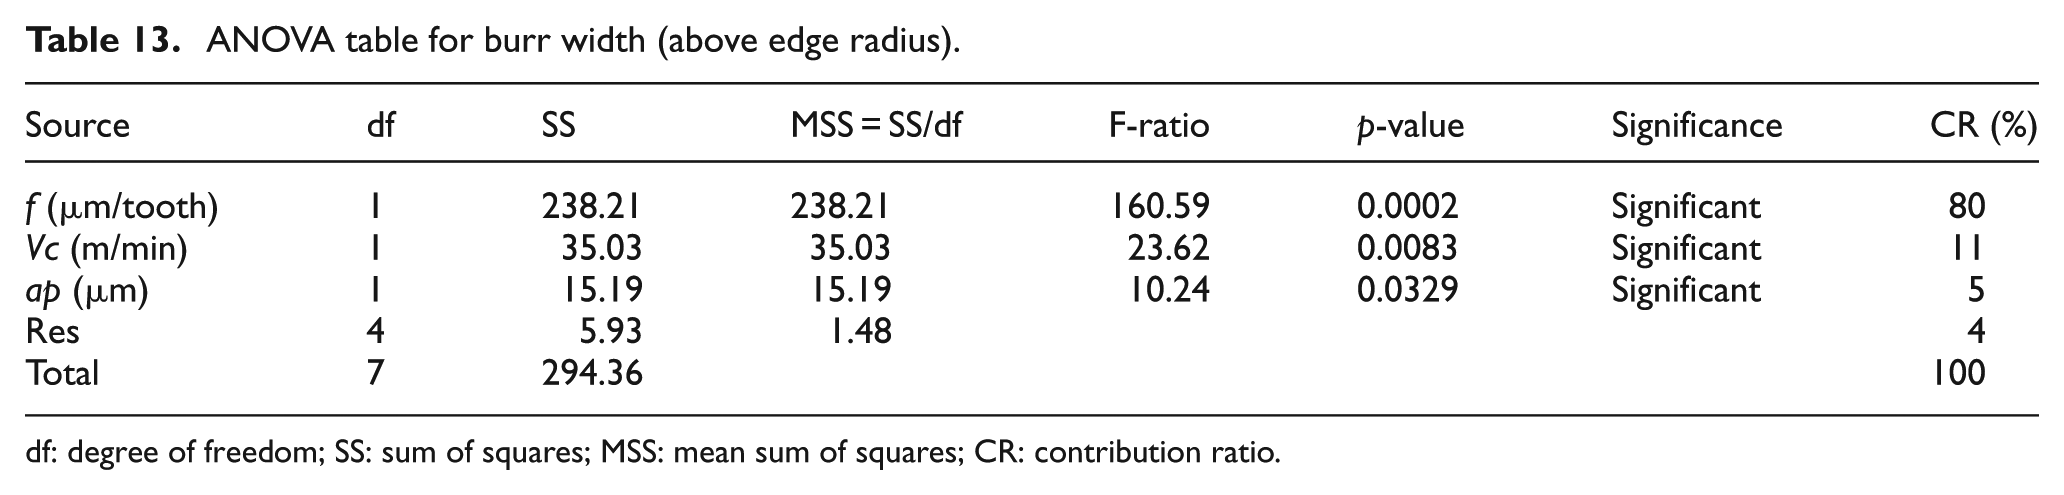
df: degree of freedom; SS: sum of squares; MSS: mean sum of squares; CR: contribution ratio.
ANOVA table for burr width (macro-milling).
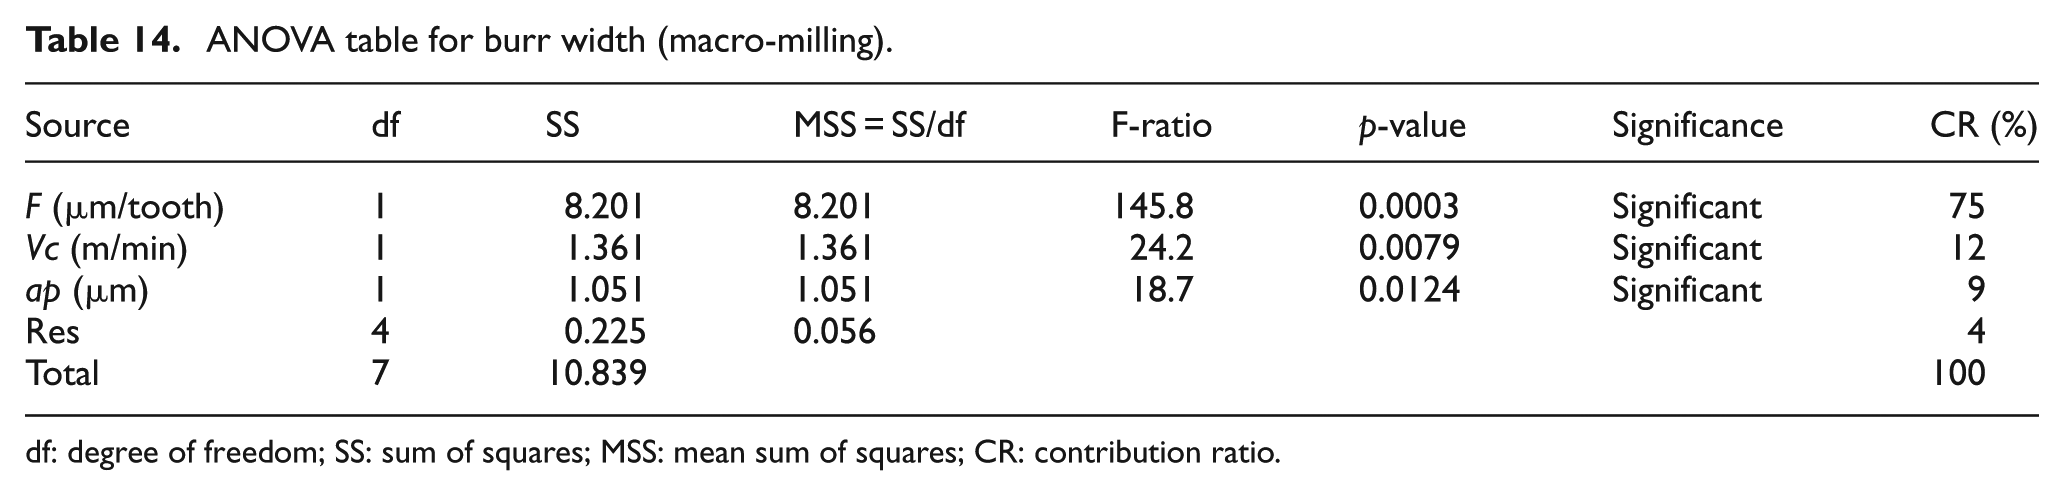
df: degree of freedom; SS: sum of squares; MSS: mean sum of squares; CR: contribution ratio.
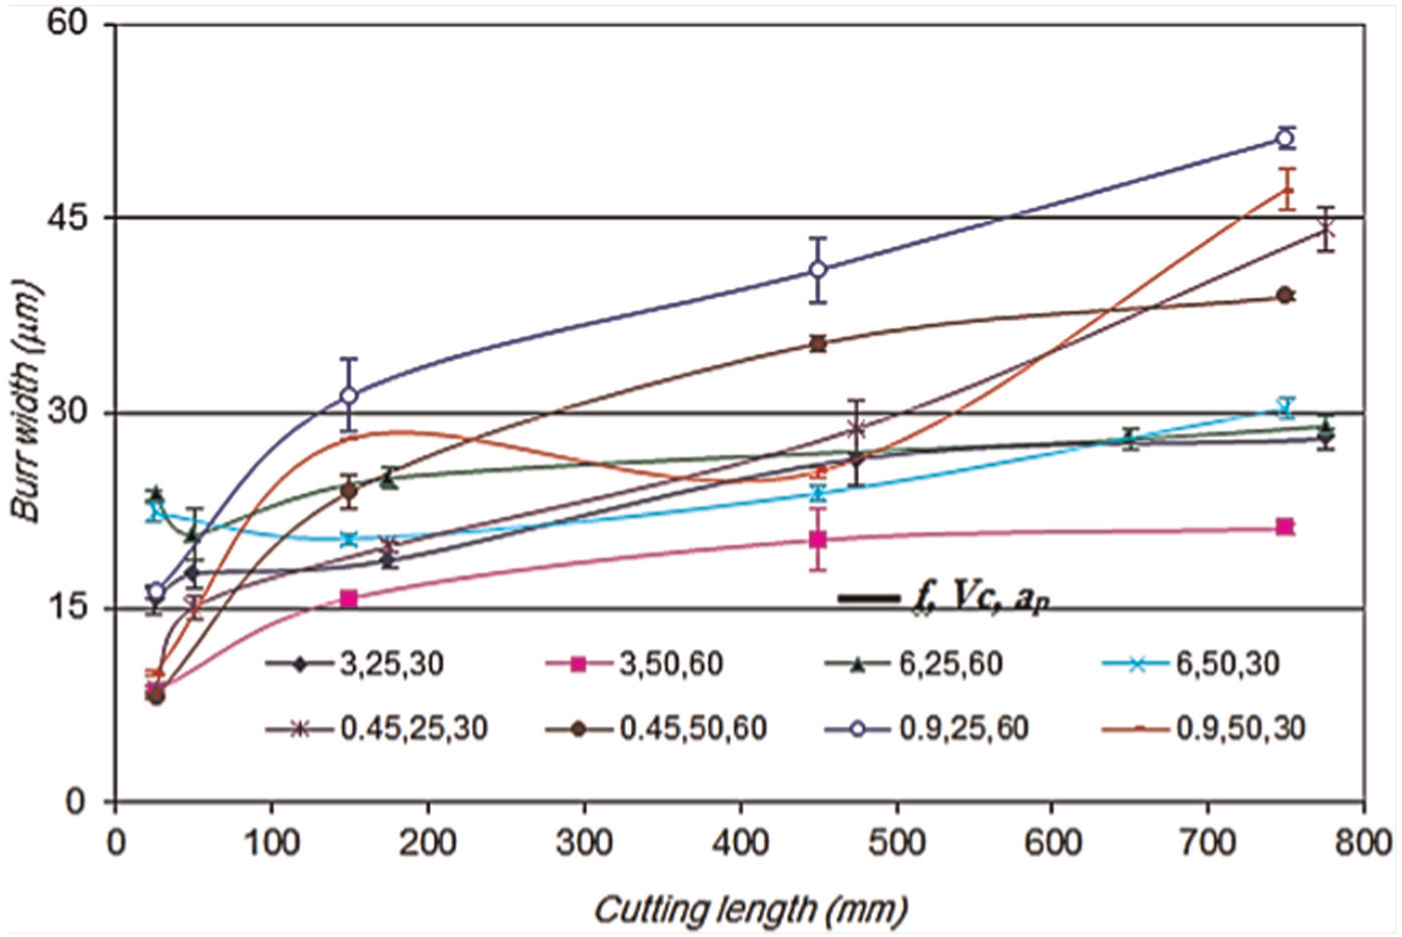
Trend showing variation in burr width on the down-milling side of the slots.
Machining below the tool edge radius did not show any significant advantage over machining above the tool edge radius as was the case when considering surface finish. ANOVA for burr formation also reveals a similar trend as the machining parameters as one traverses from the below edge radius region to above edge radius. The CRs in the latter case tend to be more towards the macro-machining domain. It can therefore be concluded that the laws of metal cutting developed for the macro-domain fail to satisfy the micromachining domain when cutting is carried out below edge radius. At even lower feedrates, the contribution of axial depth of cut was reported to become even more significant than the other contributing factors. The CRs for micro-milling below edge radius are also in conformance with an earlier research which conducted similar analysis on Inconel 718 alloys. 37
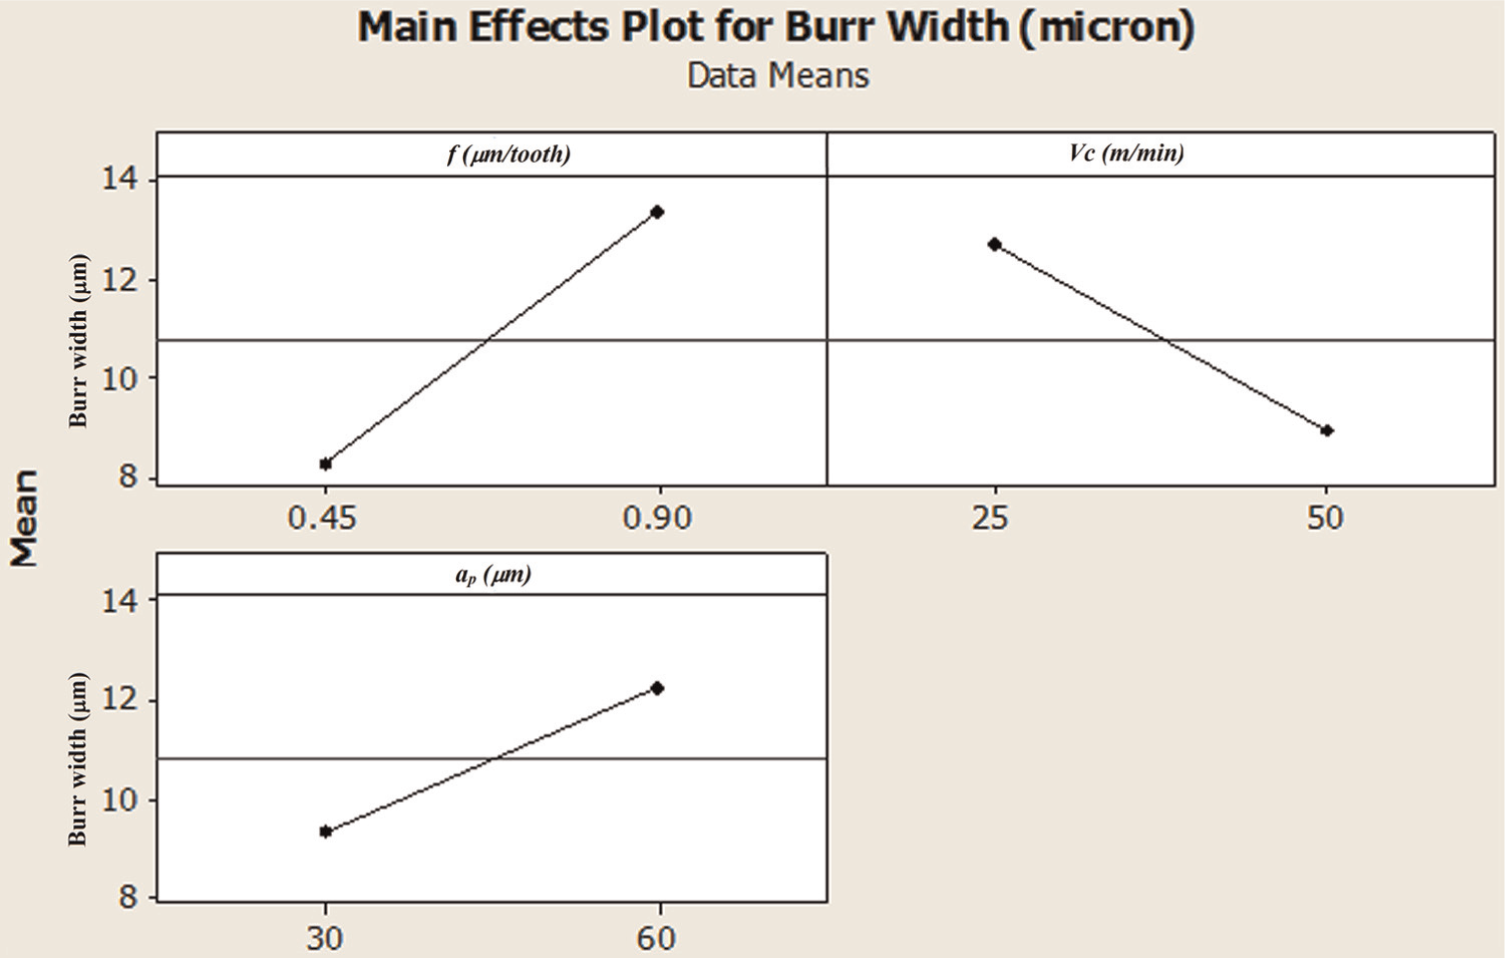
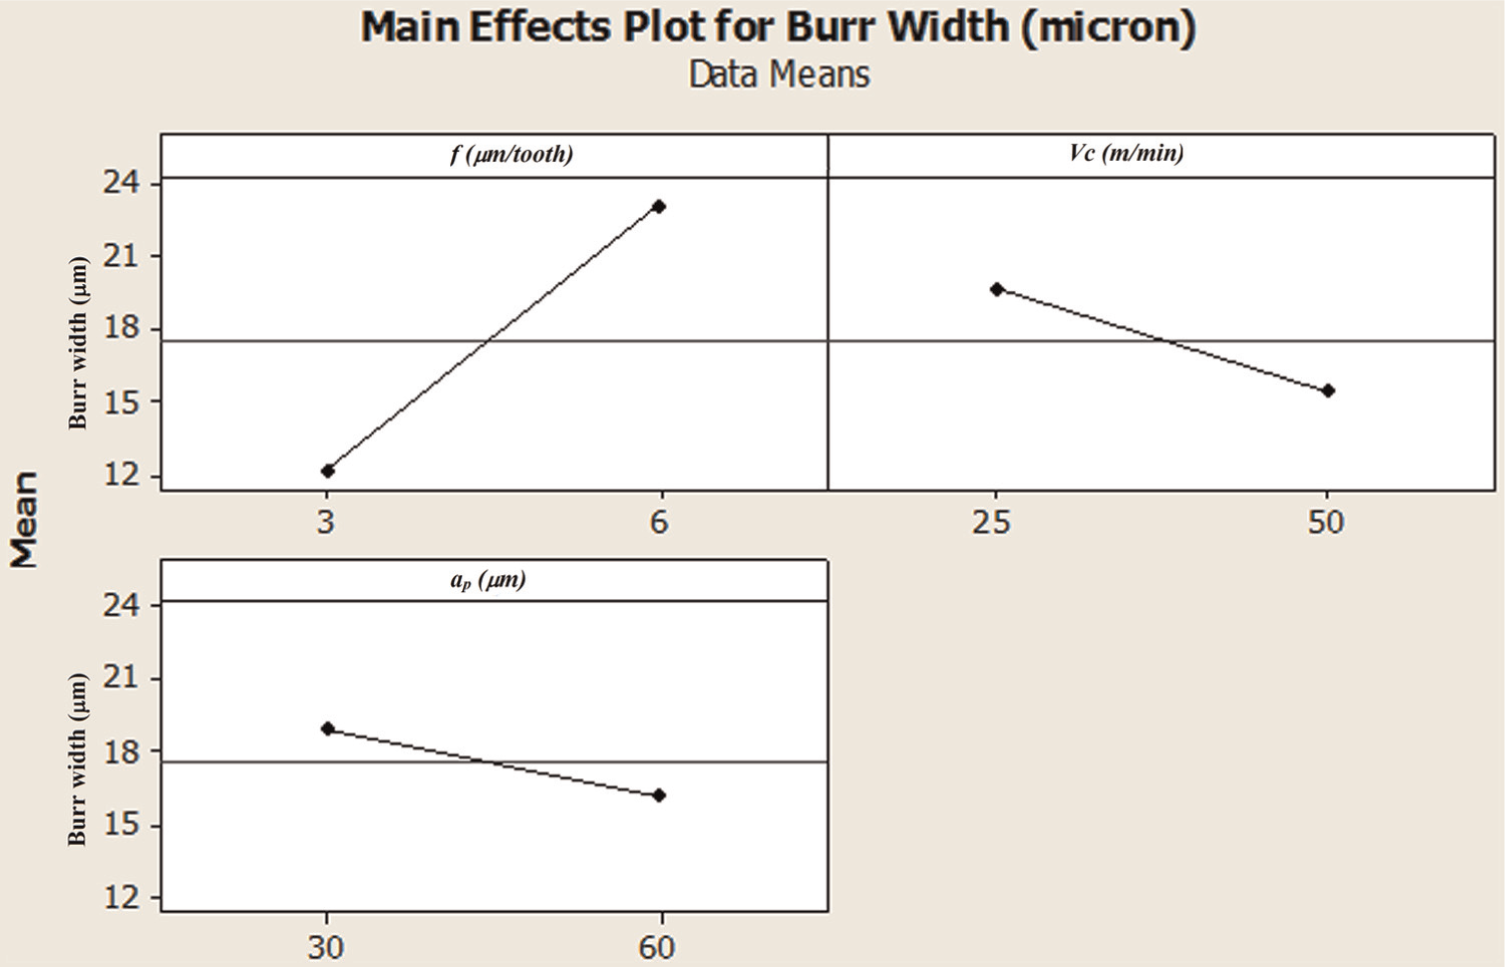
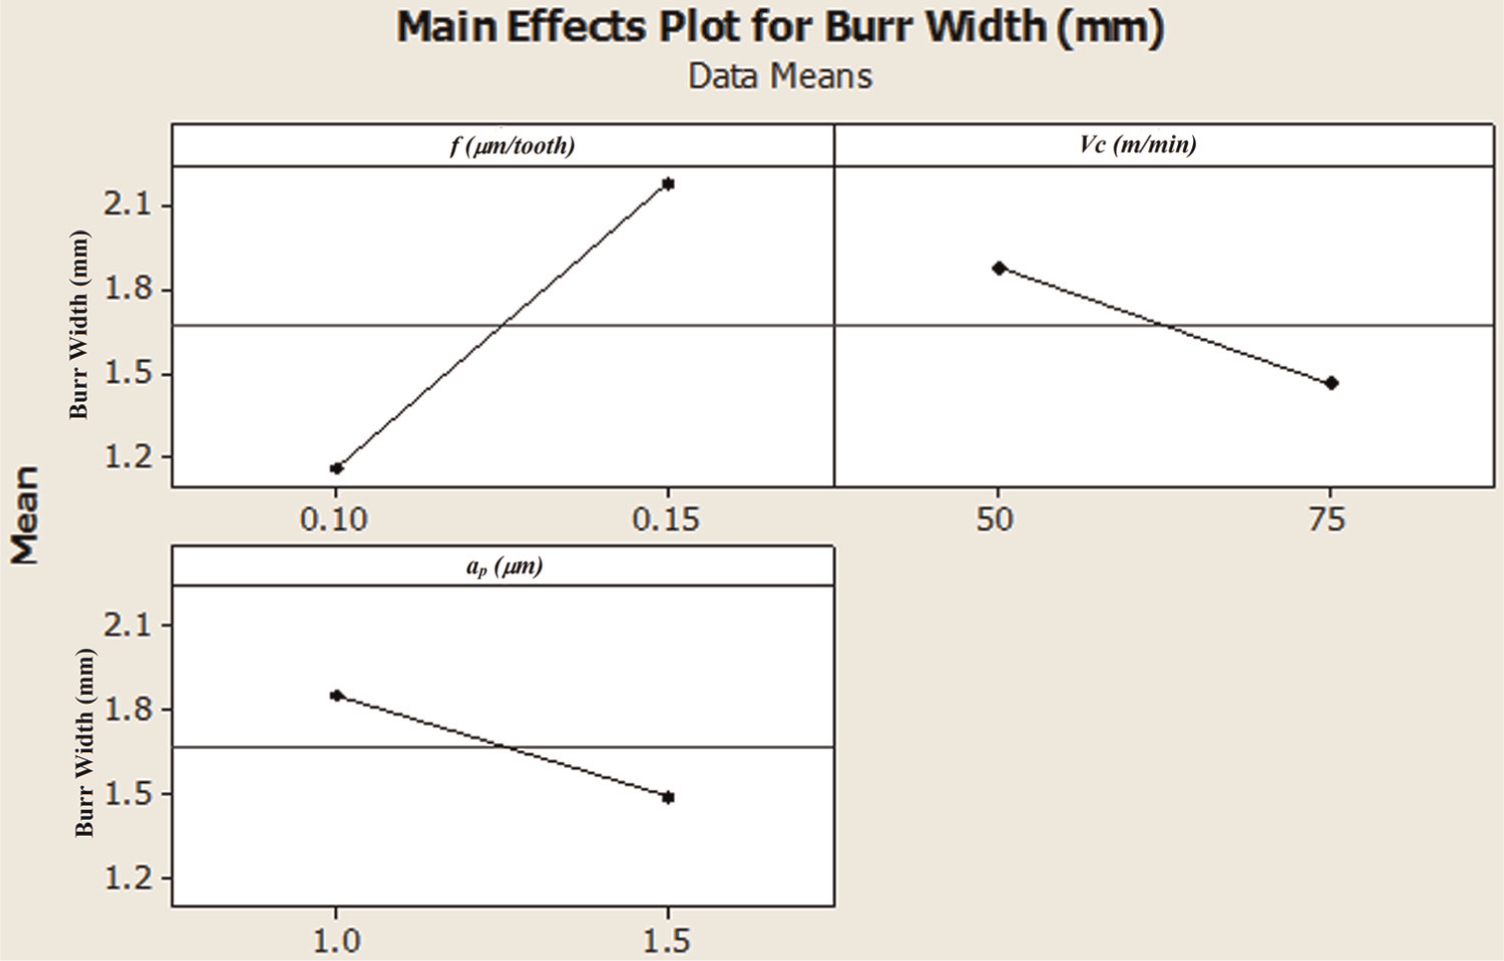
The main effect plots (Figures 16–18) for burr width at the down-milling sides also conform to the general trends shown by the main effect plots for surface finish and flank wear. As evident from these figures, burr size increases with increase in the feedrate and axial depth of cut. On the other hand, the intensity of burr formation reduces with higher cutting velocity for all the scenarios considered (micro-milling below edge radius, micro-milling above edge radius as well as macro-milling). This phenomenon also explains the reason for an increase in the size of burrs formed at the down-milling side. Since the localized cutting edge velocity at the down-milling side would always remain less than the cutting velocity on the up-milling side, larger burrs tend to form on the down-milling side. Similar observations have been reported by previous researchers investigating burr formation in micro-milling.40,41 Alternatively, the higher intensity of burr formation on the down-milling side was explained in terms of the frictional forces of the tool rubbing against the burr and getting caught in a flute of the mill. 42
Main effect plots for burr width with respect to machining parameters (below edge radius).
Main effect plots for burr width with respect to machining parameters (above edge radius).
Main effect plots for burr width with respect to machining parameters (macro-milling).
Conclusion
Identification of KPVs is important for enhancing productivity as well as product quality, ultimately leading to reduced production costs. The influence of the feedrate, depth of cut and cutting velocity differs in the micromachining domains (below and above the tool edge radius) and is also in contrast to macro scale machining. The high residual effects in evaluation of tool wear compared to assessing surface roughness suggest that for micromachining of titanium alloys, surface roughness process maps may be useful while wear maps will be affected more by process uncertainties. In this research, KPVs (feed/tooth, cutting velocity and depth of cut) were varied, and their effect on tool flank wear, surface finish, and burr formation during micromachining was analysed in detail. ANOVA was employed to study the main effect of the processing parameters on the output. Based on the results, the micromachining process has been categorized as follows:
Machining with an undeformed chip thickness below the tool edge radius;
Machining with an undeformed chip thickness above the tool edge radius.
This classification provides a new definition for the micromachining process and places great emphasis on reporting the tool cutting edge radius, which is as important as reporting the tool rake angle in the case of macro-milling.
Tool flank wear analysis revealed that high productivity in terms of material removal rate is not directly linked with high tool life, in terms of machining duration. Also, selection of appropriated operating parameters is a key to enhancing productivity as well as quality, as shown in surface finish as well as burr formation analysis. Tool wear response to process parameters in micromachining below the tool edge radius was insignificant, with 70% of the contribution coming from residual effects. Only the feedrate contributed significantly towards tool wear at 41% when micromachining above the tool edge radius, which brings it close to the macro-machining domain where feed contributed 69% towards tool wear. Unlike the case for tool wear, process parameters remained significant in their contributions towards surface finish and burr size for both categories of micromachining. Machining with the feedrate below the tool edge radius, particularly at around 50% of the tool edge radius, gave the advantage of better surface quality in terms of surface roughness; however, no such advantage was observed in burr size outcome.
Footnotes
Appendix 1
Declaration of conflicting interests
The authors declare that there is no conflict of interest.
Funding
The authors would like to acknowledge the support offered by the Engineering and Physical Sciences Research Council (EPSRC) UK under the ELMACT grant DT/E010512/1 and wish to thank Rolls-Royce plc, UK, for providing the workpiece material.