
Abstract
A new theoretical model of plastic behavior of circular metal tubes during the contraction process as a metal forming and energy absorber processes is presented in this study. Some theoretical relations are developed to predict the axial load versus the axial displacement of the contraction process, based on the theoretical model. Some quasi-static experiments were performed on circular aluminum and brazen tubes to validate the theoretical analysis. In this research, effects of tube radius, contraction ratio, tube wall thickness and angle of conical die on energy absorption characteristics of circular tubes under axial quasi-static loading are investigated by the experimental and theoretical methods. Results show that there is an admissible agreement between the theoretical results and experimental measurements. Experimental results show that there is a steady force during the end zone of the process which is an important factor in viewpoint of the energy absorption. Also, the steady force increases by increment of die semi-angle, tube radius, friction coefficient and the contraction ratio.
Keywords
Introduction
Nowadays, tubes with different cross sections are widely used in various industries; so, some published works have investigated forming process of tubes. Abdullah et al. 1 used indentation forming process for internal forming and sizing of thick-walled tubes, working in high internal pressures. They pressed a mandrel with a diameter slightly larger than that of the tube and moved inside the tube to create an internal profile. Seyedkashi et al. 2 developed a new method for optimization of the warm tube hydroforming process using the simulated annealing algorithm with a novel adaptive annealing schedule. They obtained optimal pressure loading paths for AA6061 aluminum alloy tubes with different wall thicknesses and corner fillets. Chebbah et al. 3 studied on optimization of tube hydroforming parameters to reduce defects that may occur at the end of the forming process such as necking and wrinkling. A specific methodology was proposed based on the coupling between an inverse finite-element model for the rapid simulation of the tube hydroforming process and a response surface method based on diffuse approximation.
The purpose of an energy absorber system is to absorb kinetic energy due to impact and convert it into irreversible plastic deformation, and so, dissipate it in some other form of energy through different modes of deformation. Numerous materials and structural components have been investigated and used as an energy absorber due to their good performance and suitability. 4 Energy-absorbing materials are important in many applications; therefore, their energy absorption capacity through different deformation modes has been extensively studied over the last decades, particularly in the form of tubular systems. 5 Thin-walled tubular structures as the effective energy-absorbing devices are widely employed in various transportation systems as light energy absorbers due to their high strength-to-weight ratio.
Various researchers studied the energy absorption of thin-walled tubes by some different methods of deformation including axial crushing, 6 lateral compression, 7 axial splitting, 8 tube expansion, 9 lateral indentation 10 and tube inversion. 11 Alavi Nia and Haddad Hamedani 12 investigated energy absorption capacity of the thin-walled structures with different geometries under axial quasi-static loading experimentally and numerically, and they compared characteristics of energy absorption by each section shape. Niknejad and Tavassolimanesh 13 introduced a new theoretical model of plastic deformation during the inversion process on the capped-end frusta and predicted the instantaneous axial load and absorbed energy by the structure against the axial displacement during the process. Ochelski and Gotowicki 14 investigated the energy absorption capability of carbon–epoxy and glass–epoxy composite tubes. Also, they studied influence of the fiber reinforcement type, type of structure, orientation of fibers in a layer and stacking sequence of layers on the energy absorption capability by the pipe and truncated cone-shaped elements. Salehghaffari et al. 15 introduced two methods consist of fitting of a rigid steel ring on top of circular tubes and cutting some wide grooves from the outer surface of thick-walled circular tubes to improve the sensitivity of the tubes to external parameters like loading uniformity and direction, crushing stability, crush force efficiency and collapse modes of circular metal tubes while subjected to axial compression. Gupta and Venkatesh 16 described an experimental study on aluminum cylindrical shells to present influence of the diameter to thickness ratio on their collapse mode and energy absorption capacity, subjected to impact loading. Luo et al. 17 studied the deformation process, energy-absorbing characteristics and mechanical parameters of the inverted tube by means of finite-element simulation and experimental tests under axial compression. Niknejad et al. 18 presented quasi-static crushing performance of empty and polyurethane foam–filled E-glass/vinylester composite tubes with different geometrical characteristics under quasi-static lateral compression between two rigid plates.
This study introduces a new approach to absorb undesirable kinetic energy upon axial loading and dissipate it in some other form of energy such as plastic deformation and viscous energy, which is called tube contraction. In this method, the circular metal tube is subjected to a contraction operation along a conically shaped die. The contraction or nosing operation often is employed in reducing the end diameter of cylindrical components at the die throat during a forming operation. Tang et al. 19 performed the finite-element method on rigid-plastic materials in the analysis of cold nosing of aluminum tubular preforms with uniform wall thickness and compared numerical results with experiments. Two approximate solutions to calculate the radius of nose tip and the wall thickness after the nosing process in a shell were derived by Kobayashi. 20 Manabe and Nishimura 21 performed some experimental tests into the nosing of thin-walled aluminum tubes to elucidate the characteristics or features of nosing process by a circular curved die by comparing the results with those for a conical die, and their results confirmed that the maximum nosing ratio improves with the use of circular curved die. Fatnassi et al. 22 presented a theoretical investigation of the onset of nonaxisymmetric buckling during the nosing operation of circular tubes. They studied the effect of die shape, material characteristics and the tube dimensions upon the buckling formation, numerically and showed that the critical nosing ratio increases as the die semi-angle. Huang et al. 23 used the rigid-plastic and elasto-plastic finite-element methods to develop a computer program to simulate cold-nosing process, and they showed the results in load–displacement curves, thickness distributions, elongations, strain distributions and die-pressure distributions. Zhu 24 simulated the shell nosing process by finite-element method and showed that this method can be suggested as a fitting approach for solving the process of shell nosing as an efficient method in determination of optimal preforms during the nosing process. Reid and Harrigan 25 showed some details of the measured quasi-static and dynamic internal inversion and nosing force variations by using detailed finite-element models. Lu 26 developed an approximate theory to calculate preform shape, nosing ratio and loading rate in the tube nosing process by spherical die, and he verified theoretical results with the corresponding results of a finite-element analysis. Alves et al. 27 and Gouveia et al. 28 performed some analyses on expansion and reduction processes of thin-walled tubes with circular cross section using conical dies by experimental, numerical and theoretical methods. Then, Alves and Martins 29 investigated influences of major process parameters on formability limits of the expansion and reduction processes of thin-walled poly(vinyl chloride) (PVC) tubes using a die and proposed an innovative extension of the flow formulation that is capable of modeling cold plastic deformation of pressure-sensitive polymers under a nonassociated flow rule.
In this study, a new theoretical deformation model is introduced, and the absorbed energy and instantaneous axial force of empty metal tubes with circular cross section are studied during the tube contraction process, based on the theoretical analysis and experiments. Furthermore, the effects of contraction ratio, die semi-angle, tube diameter and tube wall thickness on the absorbed energy by the structure during the contraction process are investigated via the theoretical and experimental methods.
Theory
In tube contraction process by a conical die, kinetic energy due to the axial loading can convert to plastic deformation energies such as bending, friction and contraction. In this article, a new theoretical model of plastic deformation of the circular metal tubes is introduced as shown in Figure 1, and through implementation of the energy method, some theoretical relations for determination of the instantaneous axial load versus the axial displacement during the tube contraction process are derived.
New analytical model of plastic deformation of a circular metal tube during the contraction process.
According to the mechanical behavior and plastic deformations of the tubes and to predict contribution of each energy absorption mechanism during the process, the contraction process is divided to five different stages:
Stage 1: first bending and contraction;
Stage 2: second contraction;
Stage 3: third contraction;
Stage 4: second bending;
Stage 5: third bending.
By assumption of the rigid perfectly plastic material, the total absorbed energy during the contraction process is calculated as

where ε is strain component and σ 0 denotes flow stress of tube material. The flow stress of material is estimated as follows 30

In the above equation, σy, σu and n are yield stress, ultimate stress and work hardening exponent of tube material, respectively. V is initial volume of deformed part of tube material and is obtained as

In the above equation, RO and t 0 are outer radius and initial wall thickness of tubes, respectively; and Δ indicates axial displacement during the contraction process. During the theoretical analysis, it is assumed that length of the tube remains constant.
First stage
According to Figure 2(a), at commence of this stage and at the entrance of the tube into the conical punch, the plastic deformation is started and the tube begins to deform; so, first bending and contraction occur, concurrently. Therefore, strain component of the circumferential contraction is obtained as

(a) First bending radius and (b) second bending radius of the tube during the plastic deformation.
where α is semi-angle of conical part of die. Also, strain component of the bending process during the first stage of plastic deformation is calculated as

where R 1 is first bending radius of the tube and t 1 is instantaneous thickness through the first stage.
The tube wall thickness is thickened in the contraction process; so, based on the material volume constancy assumption, the thickness in an arbitrary deformed site is related with the initial wall thickness, t 0, by the following relation 26

In the above equation, ti refers to instantaneous wall thickness and Ri indicates instantaneous average radius during every stage. Therefore, thickness variation of the tube wall during the first stage is calculated by

Also, during the first stage, there exists another type of energy absorber mechanism that is called friction energy. To consider the effect of friction, the equilibrium equation in the radial direction results in 31

where q is the normal contact pressure and σθ is the stress component in circumferential direction. Substituting σr = q and using dFr = σr dA, where Fr is radial force, the fiction energy through the first stage is obtained as

In equation (9), Coulomb friction is assumed to be operative at the outer perimeter of the tube and die interface, with a friction coefficient of µ. Also, during derivation of the above equation, the circumferential stress was substituted by the flow stress (σθ ≈ σ 0).
Using the friction energy and substituting the strain components and volume of deformed part of the tube from equations (3) to (5) into equation (1), the total absorbed energy by the plastic deformation during the first stage of the contraction process is calculated by
According to the principle of energy conservation, summation of the internal dissipated energies by different deformation mechanisms during the contraction process on the circular tube is equal to the applied work of axial force on the tube. Therefore, the axial load of the first stage of the contraction process is calculated as
where
Based on the minimum principle in plasticity, the material is inclined to sustain the minimum axial load. Therefore, the following additional equation is obtained

So, the bending radius of the first stage is calculated as the following
The above equation is the first relation that estimates first bending radius of circular metal tubes during the contraction process by the theoretical method.
Second stage
After the first stage, as it seems in Figure 1, the tube tip moves on the internal surface of conical part of die and the tube contraction is continued until the outer radius of the tube reaches to the radius of the cylindrical part of die (Rd ). In the second stage, all the absorbed energy mechanisms of the first stage exist. The strain energy due to the circumferential contraction of the second stage is calculated by

In the second stage, the absorbed energy due to the first bending process is obtained as

Also, the absorbed energy due to the friction is calculated as

According to equation (6), the instantaneous wall thickness during the second stage is derived as

Thus, axial load of circular tubes during the second stage is obtained as
where the axial displacement during the second stage varies as the following relation

Third stage
In the following process, the tube contraction follows until it reaches to a new radius which is smaller than the radius of the cylindrical part of die. All the absorbed energy mechanisms of the first and second stages exist in the third stage. The strain energy due to the circumferential contraction of the third stage is similar to the corresponding value of the first and second stages. The contraction energy through the stage is obtained as follows

Therefore, the axial load during the third stage is calculated as
In the above equation, the axial displacement changes as

Through the third stage, the tube wall thickness varies similar to the thickness variation in the second stage

At the end point of third contraction, based on the minimum principle in plasticity, more contraction of tube needs more energy than the tube wall bending; so, second bending occurs at the leading edge of deformed tube and the tube wall bends outward. The required energy to contract the tube from the end point of conical surface of die to the protruded radius is equal to
Also, required energy to bend the tube wall as much as the semi-angle of conical part of die (angle α) with the bending radius, R 1 is calculated as
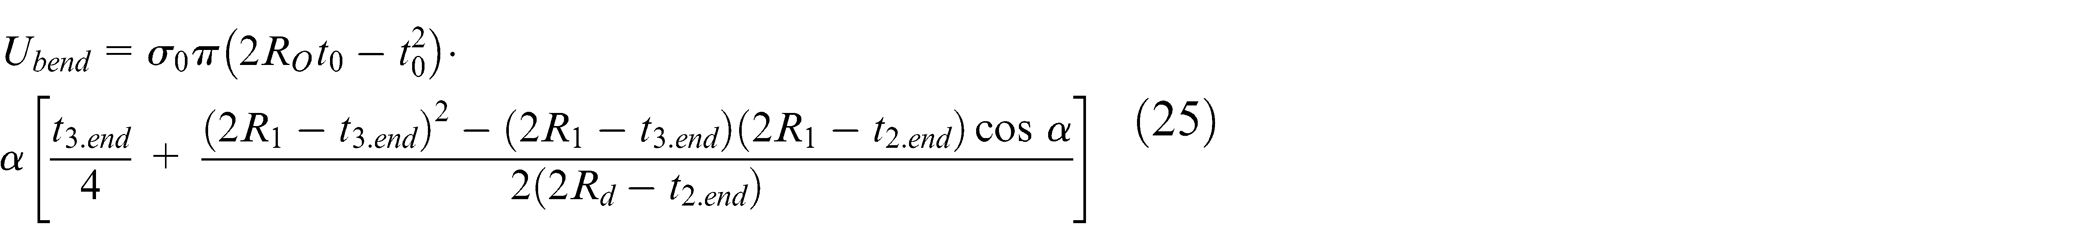
By equating equations (24) and (25), the following relation is obtained to predict the protruded radius, R
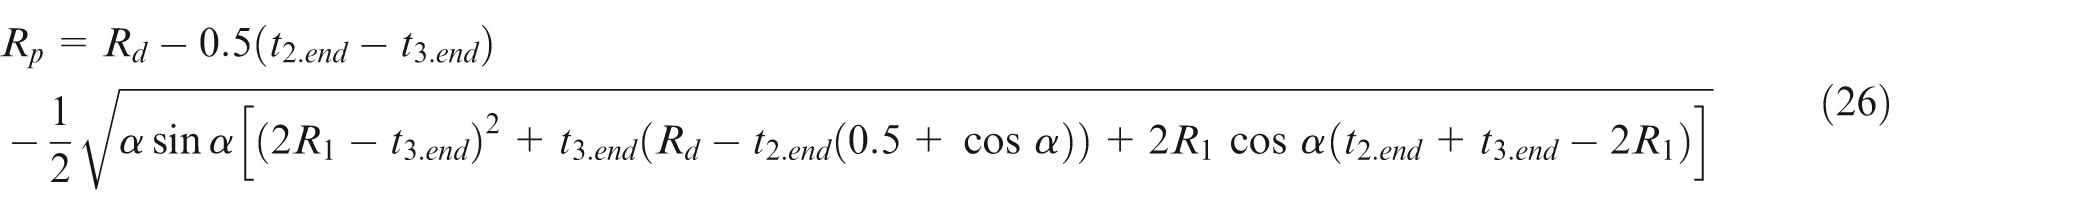
When the outer radius of the tube tip reaches to the mentioned radius in equation (26), the third stage of the contraction process ends and the second bending of the tube begins.
Fourth stage
In the present stage, the tube tip bends with the central angle of α which is equal to semi-angle of conical die, as shown in Figure 1. All the absorbed energies during the third stage also occur during the fourth stage. Furthermore, there are two other mechanisms of energy dissipation: second bending and fourth contraction. The circumferential component of the strain during the fourth contraction is equal to

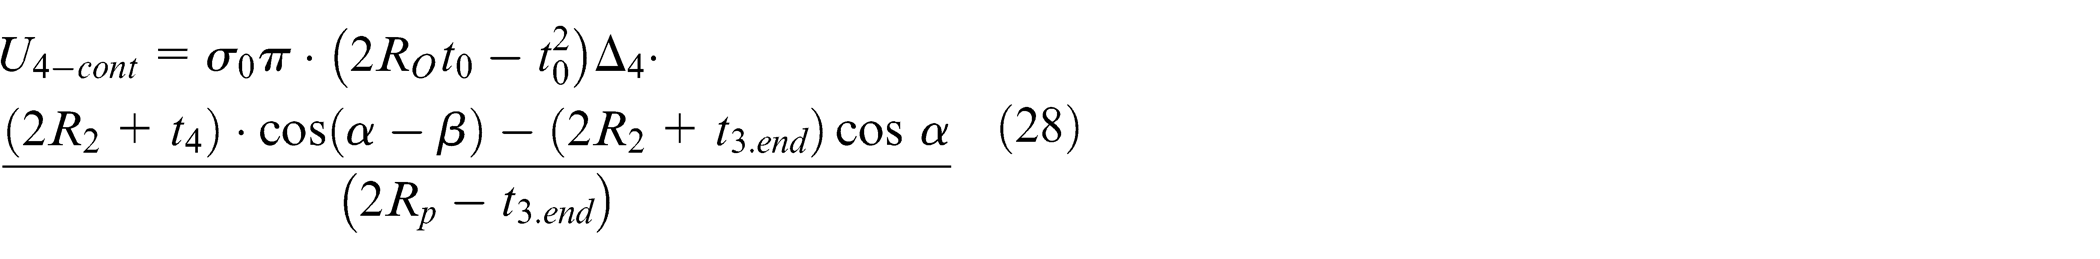
where β varies from 0 to its maximum value (α). Therefore, the absorbed energy due to the fourth contraction is calculated as
Also, the absorbed energy due to the second bending is obtained as following relation

During the stage, the tube wall thickness varies according to the following relation

Total absorbed energy of the fourth stage consists of summation of the absorbed energies at the end of the third stage and the obtained terms in equations (28) and (29). Consequently, the following relation is derived to predict the axial load versus the axial displacement during the fourth stage of the analytical deformation model

where

and

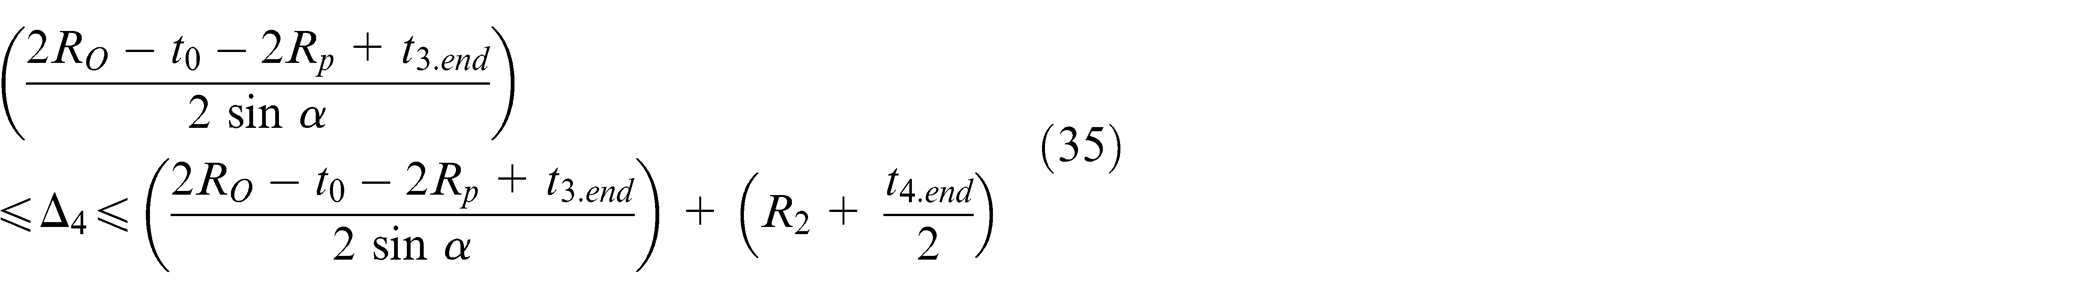
In equation (31), β is substituted by the following relation

Also, variation of the axial displacement during the stage is
Fifth stage
According to Figure 2(b), at the end point of the fourth stage, the circumferential expansion of the tube begins and the tube tip bends outward.
During the fifth stage, in addition to the total absorbed energy at the end of the fourth stage, plastic deformation of the tube absorbs two other types of energies: bending and expansion energies. In the fifth stage, bending of the tube is continued until the tube tip reaches to the interior lateral surface of the cylindrical part of die. Strain component of the circumferential expansion is calculated as

During the stage, γ increases from 0 to π/2.
During the fifth stage, the absorbed energy by the expansion deformation in the circular tube is obtained as following
Also, the strain component due to the third bending is calculated as

So, during the fifth stage, the strain energy due to the third bending is

The tube wall thickness during the fifth stage varies as

Therefore, the axial load of the fifth stage of the tube contraction is derived as
where
In equation (41), γ is substituted by the following relation

In the present stage, the axial displacement varies as
Based on the minimum principle in plasticity, differentiating the maximum value of axial load at the end of fifth stage yields

During the derivation of equation (45), third and higher exponents of thickness were neglected. The above equation results in bending radius of the tube through the fourth and fifth stages.
Experimental observations show that when the tube tip reaches to the lateral surface of cylindrical part of die, the axial load remains constant called steady force. Therefore, by substituting the maximum value of Δ5 in equation (41), the axial steady load during the contraction process on the circular metal tubes using a conical die is derived as the following formula

During the contraction process on the circular metal tubes, the steady force has a direct relationship with energy absorption capacity by the structure, especially in long stroke processes. Therefore, the above equation is important for designing the energy absorption systems.
Experiment
Axial quasi-static loading was carried out on samples using DMG apparatus, model 7166 (Figure 3). This apparatus has two jaws: the upper one is stationary and the lower one is moveable. The sample of tube with die was set between two jaws vertically and compressed axially. The rate of loading was constant and equal to 20 mm/min. During the test, the axial load–displacement curve of each sample was sketched.
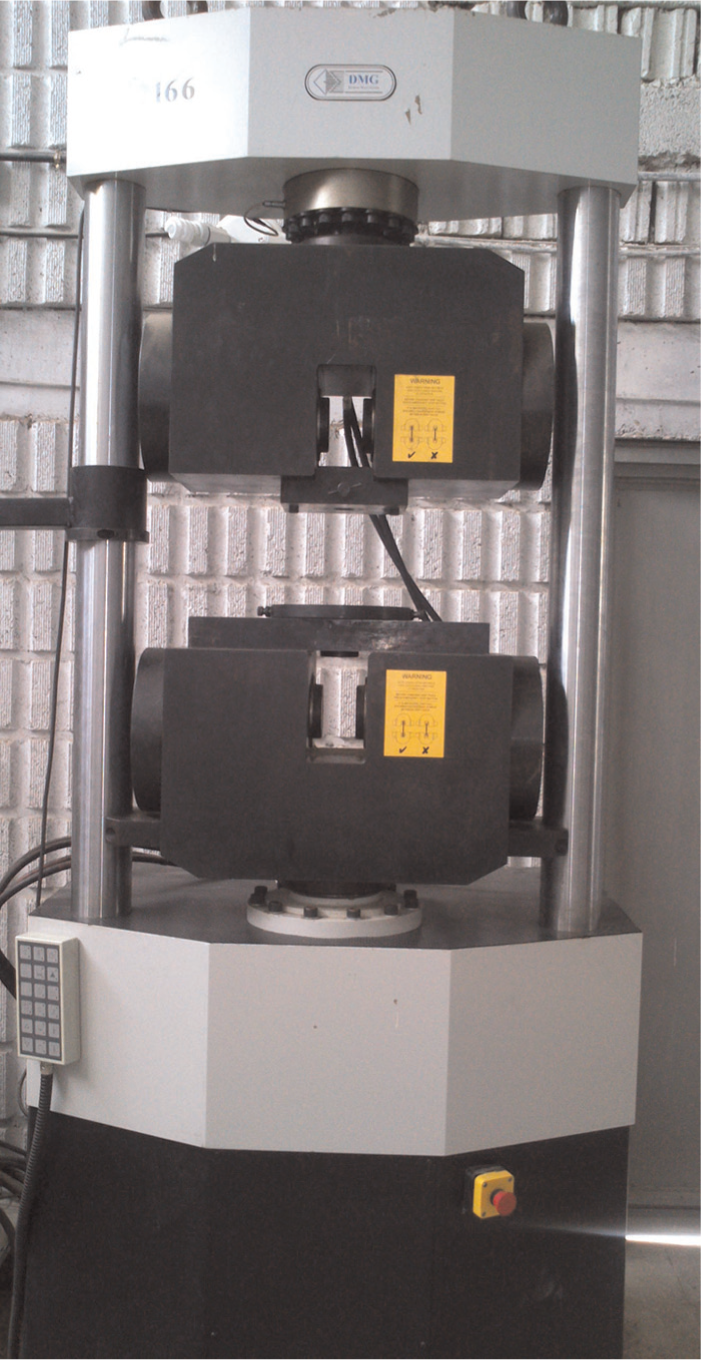
DMG 7166 apparatus.
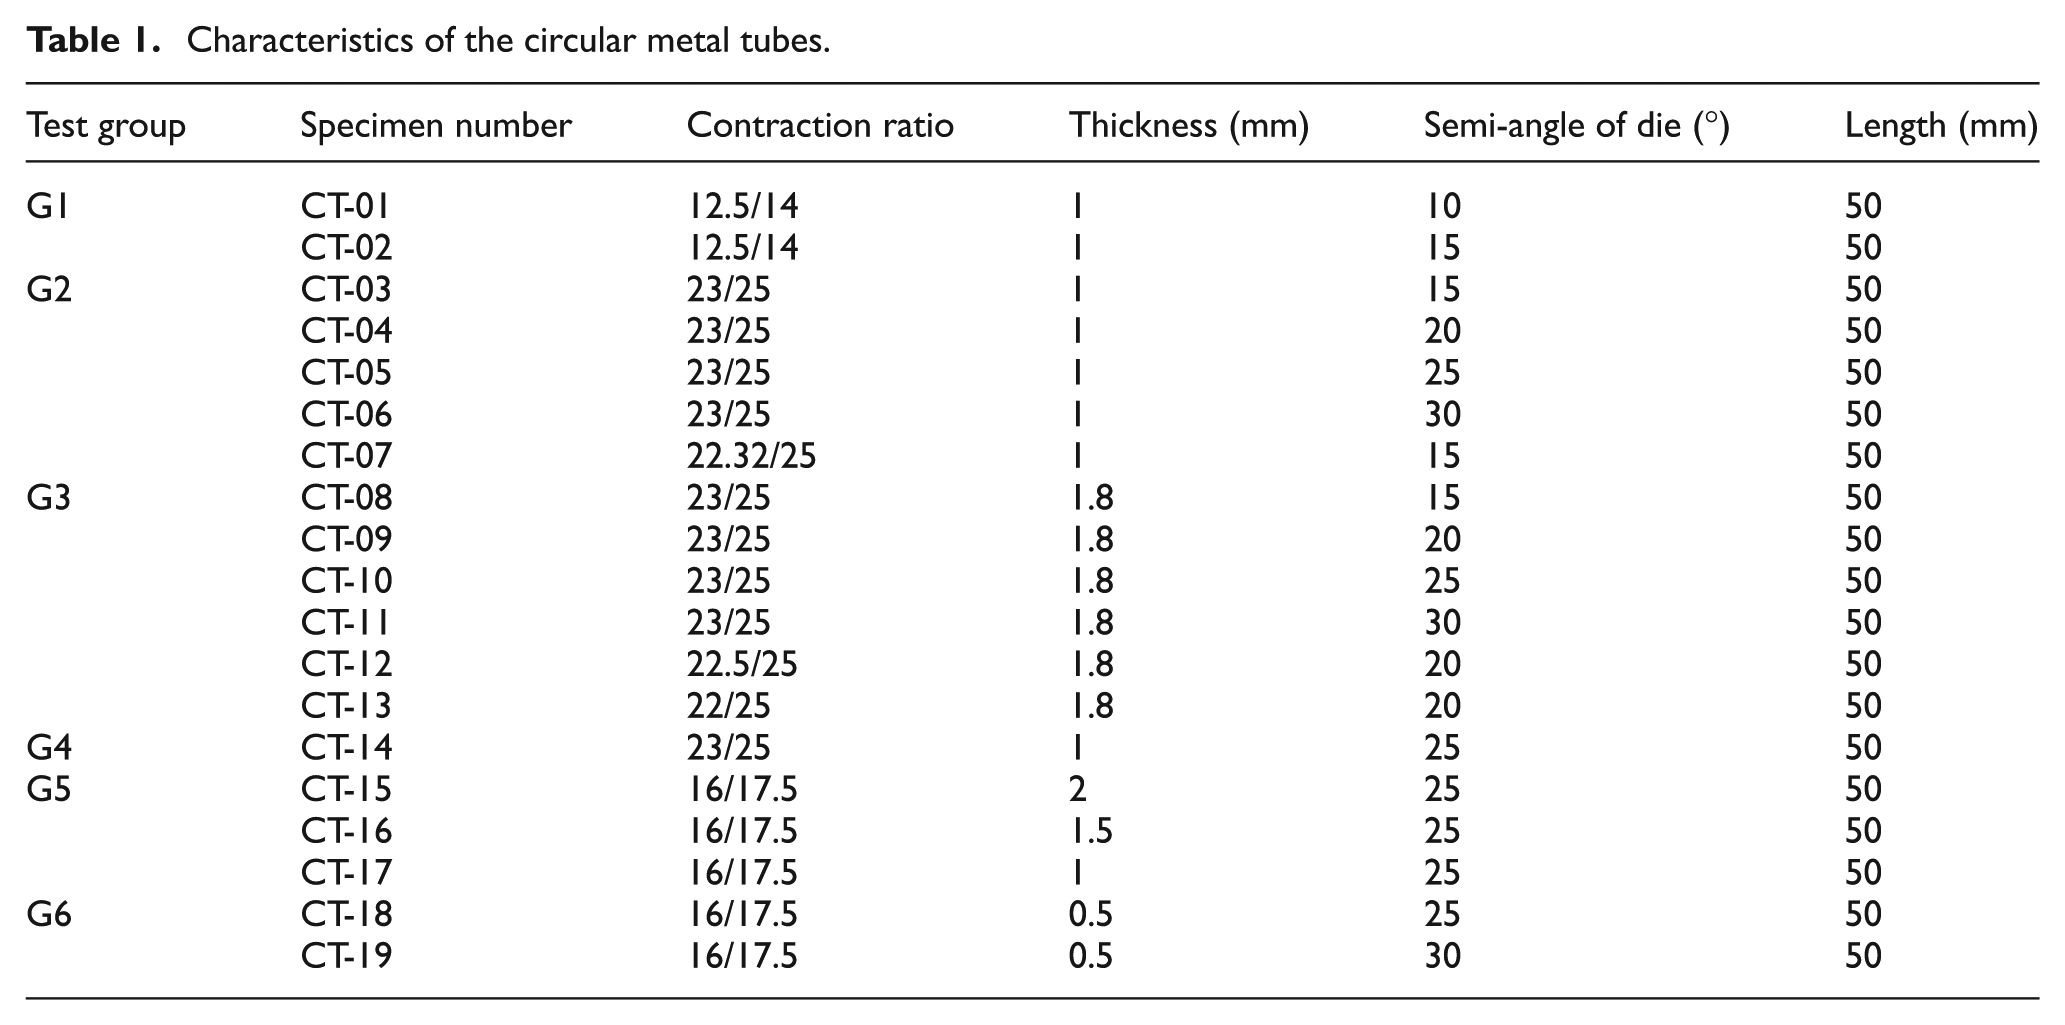
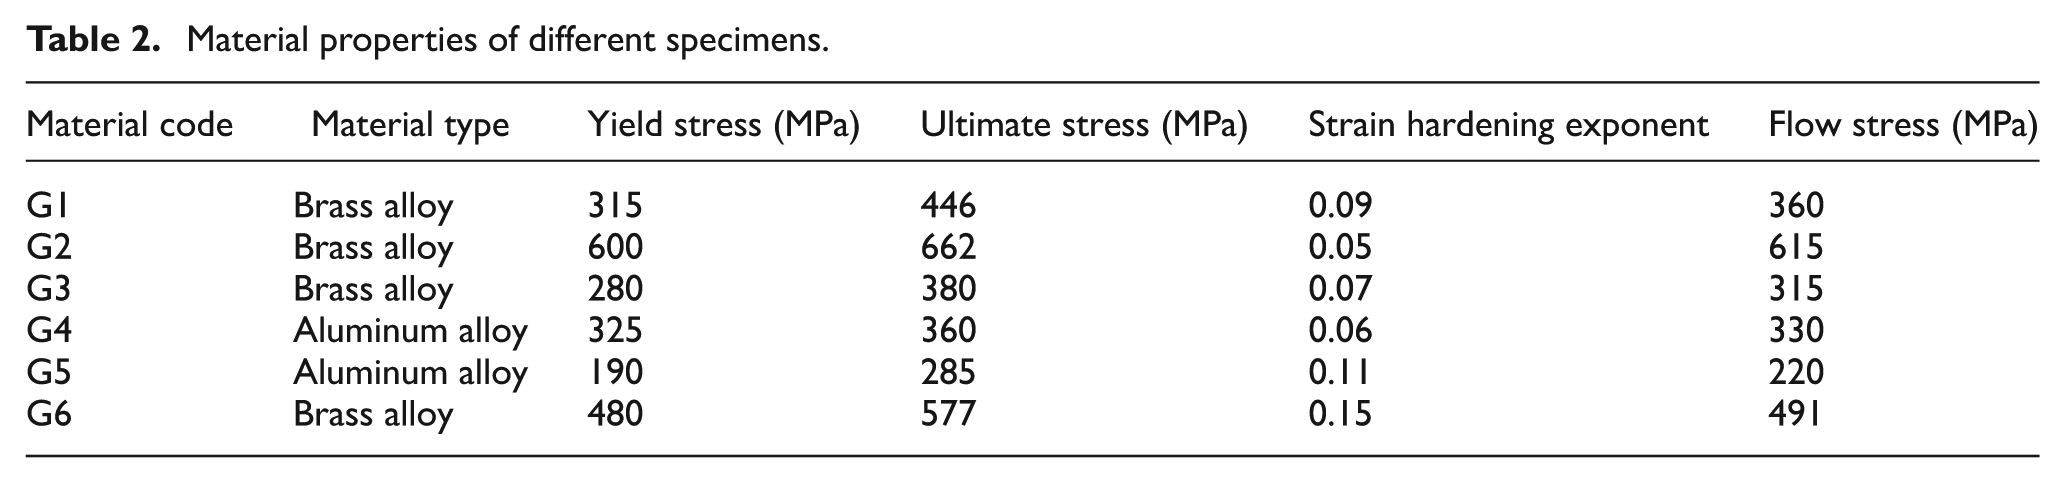
Six different material groups of specimens were prepared and tested to confirm repeatability of the experiments. Geometrical dimensions of the specimens are represented in Table 1. To determine material properties of the specimens, a standard tension test was done on the dumbbell-shaped specimen of each material based on ASTM E8M. Table 2 gives material characteristics of the tubes. Six types of internal conical die with different contraction ratios were used to perform the compression tests. Also, for some contraction ratios, several dies with different semi-angles were machined and prepared. All of the metallic tubes that were used in the present experiments were contracted uniformly, and no fracture, local buckling or wrinkling was observed in the tests. It may be considered that the tubes were contracted successfully and no undesirable failure of tubes occurred in the present range of tube and die parameters.
Characteristics of the circular metal tubes.
Material properties of different specimens.
Results and discussion
In this article, a new approach was introduced to dissipate unfavorable kinetic energies due to impact loading. In addition, to consider the process, a new plastic deformation model was proposed and considered in five stages. According to this model, some theoretical relations were derived to predict the instantaneous axial load during the tube contraction process by a conical–cylindrical die. Then, some axial compression tests were carried out on the brazen and aluminum circular tubes to verify the theoretical analyses.
Verification of the theory
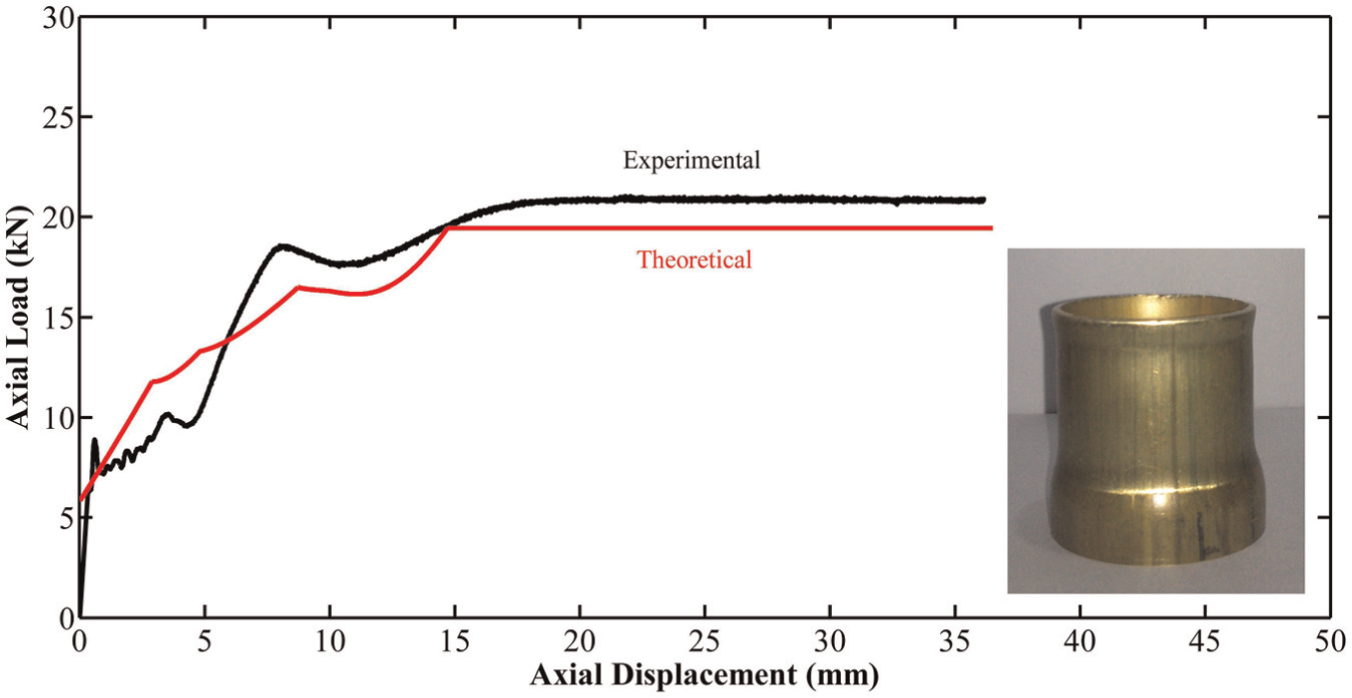
The analytical and experimental diagrams of the axial load versus the axial displacement of the brazen specimens CT-01 and CT-04 with different material characteristics and semi-angles of die equal to 10° and 20° are illustrated in Figure 4(a) and (b), respectively. As the theoretical curve shows, during the first stage, the axial load increases linearly from a minimum value. Then, the theoretical curve of the second stage increases nonlinearly. Through the third stage, the progression of the axial load is followed until the axial load reaches to the first relative maximum value. The nonlinear progress of the second and third stages of the theoretical curve is similar to the experimental curve, approximately. According to this figure, both of the experimental and theoretical axial load–displacement diagrams decrease during the fourth stage. Then, two curves decline to a relative minimum during the fifth stage. After the relative minimum, the contraction process is followed by increasing the curve slope until the axial load reaches to the steady force through a horizontal line. In this figure, comparison of the theoretical and corresponding experimental diagrams shows that variations of the instantaneous axial load that are predicted by the theoretical formulas are similar to the experimental results. Also, the comparison shows that in the final stage, the new theoretical analysis predicts the constant value of the final part of the contraction process with a good agreement.
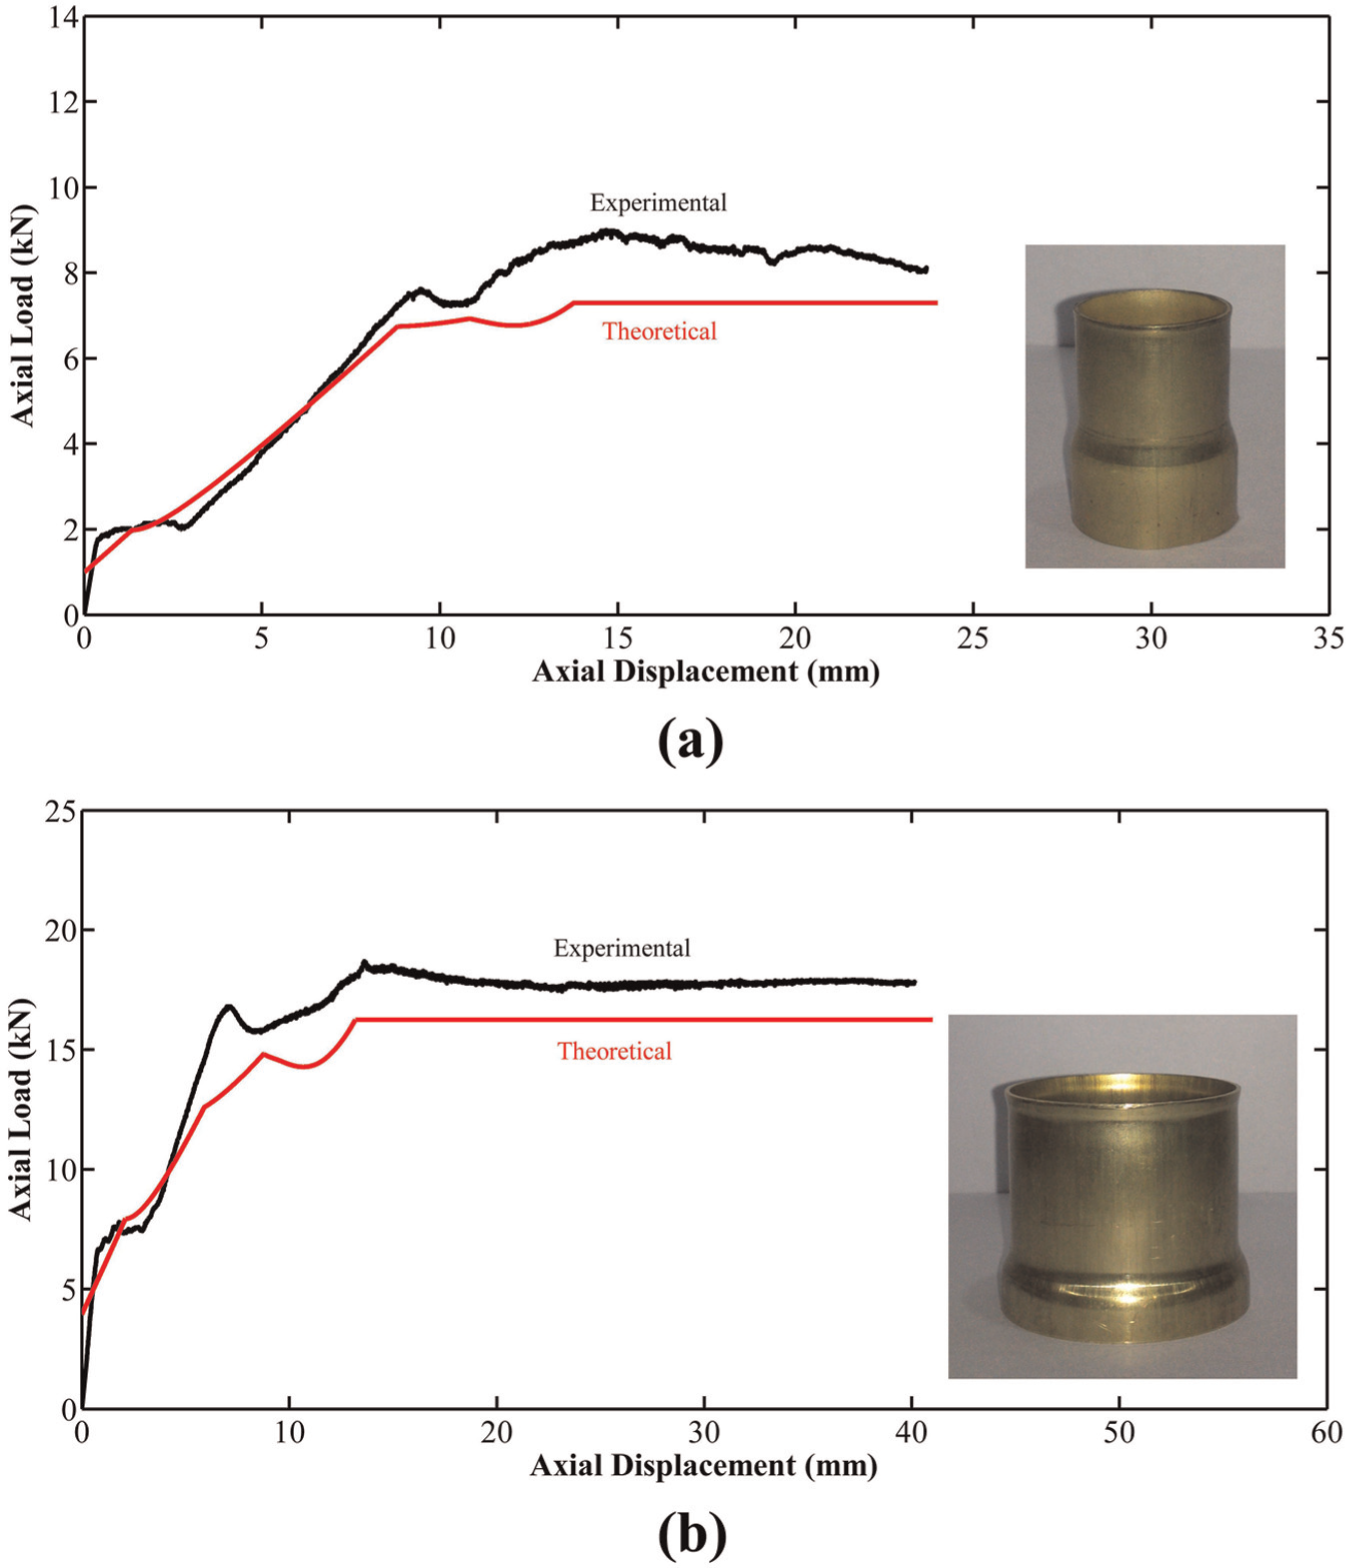
Experimental and theoretical diagrams of the axial load versus the axial displacement of (a) the specimen CT-01 and (b) the specimen CT-04.
Figure 5 shows the theoretical and experimental diagrams of the instantaneous axial force versus the axial displacement during the contraction process on the circular brazen tube CT-10 with the wall thickness of 1.8 mm and the contraction ratio of Rd /RO = 12.5/14. Also, for the better comparison, Figure 6(a) and (b) illustrates the axial load–displacement diagram of the theoretical predictions and compares with the corresponding experimental measurements, for the aluminum specimens CT-14 and CT-17, respectively. This figure shows that the present theory estimates the load–displacement diagram of the aluminum specimen as well as the brazen tubes. Therefore, a logical agreement between the experimental and theoretical curves results in the general form of the obtained mathematical relations is correct and that is compatible with the physical behavior of the circular metal tubes during the plastic deformation of the contraction process.
Experimental and theoretical diagrams of the axial load versus the axial displacement of the specimen CT-10.
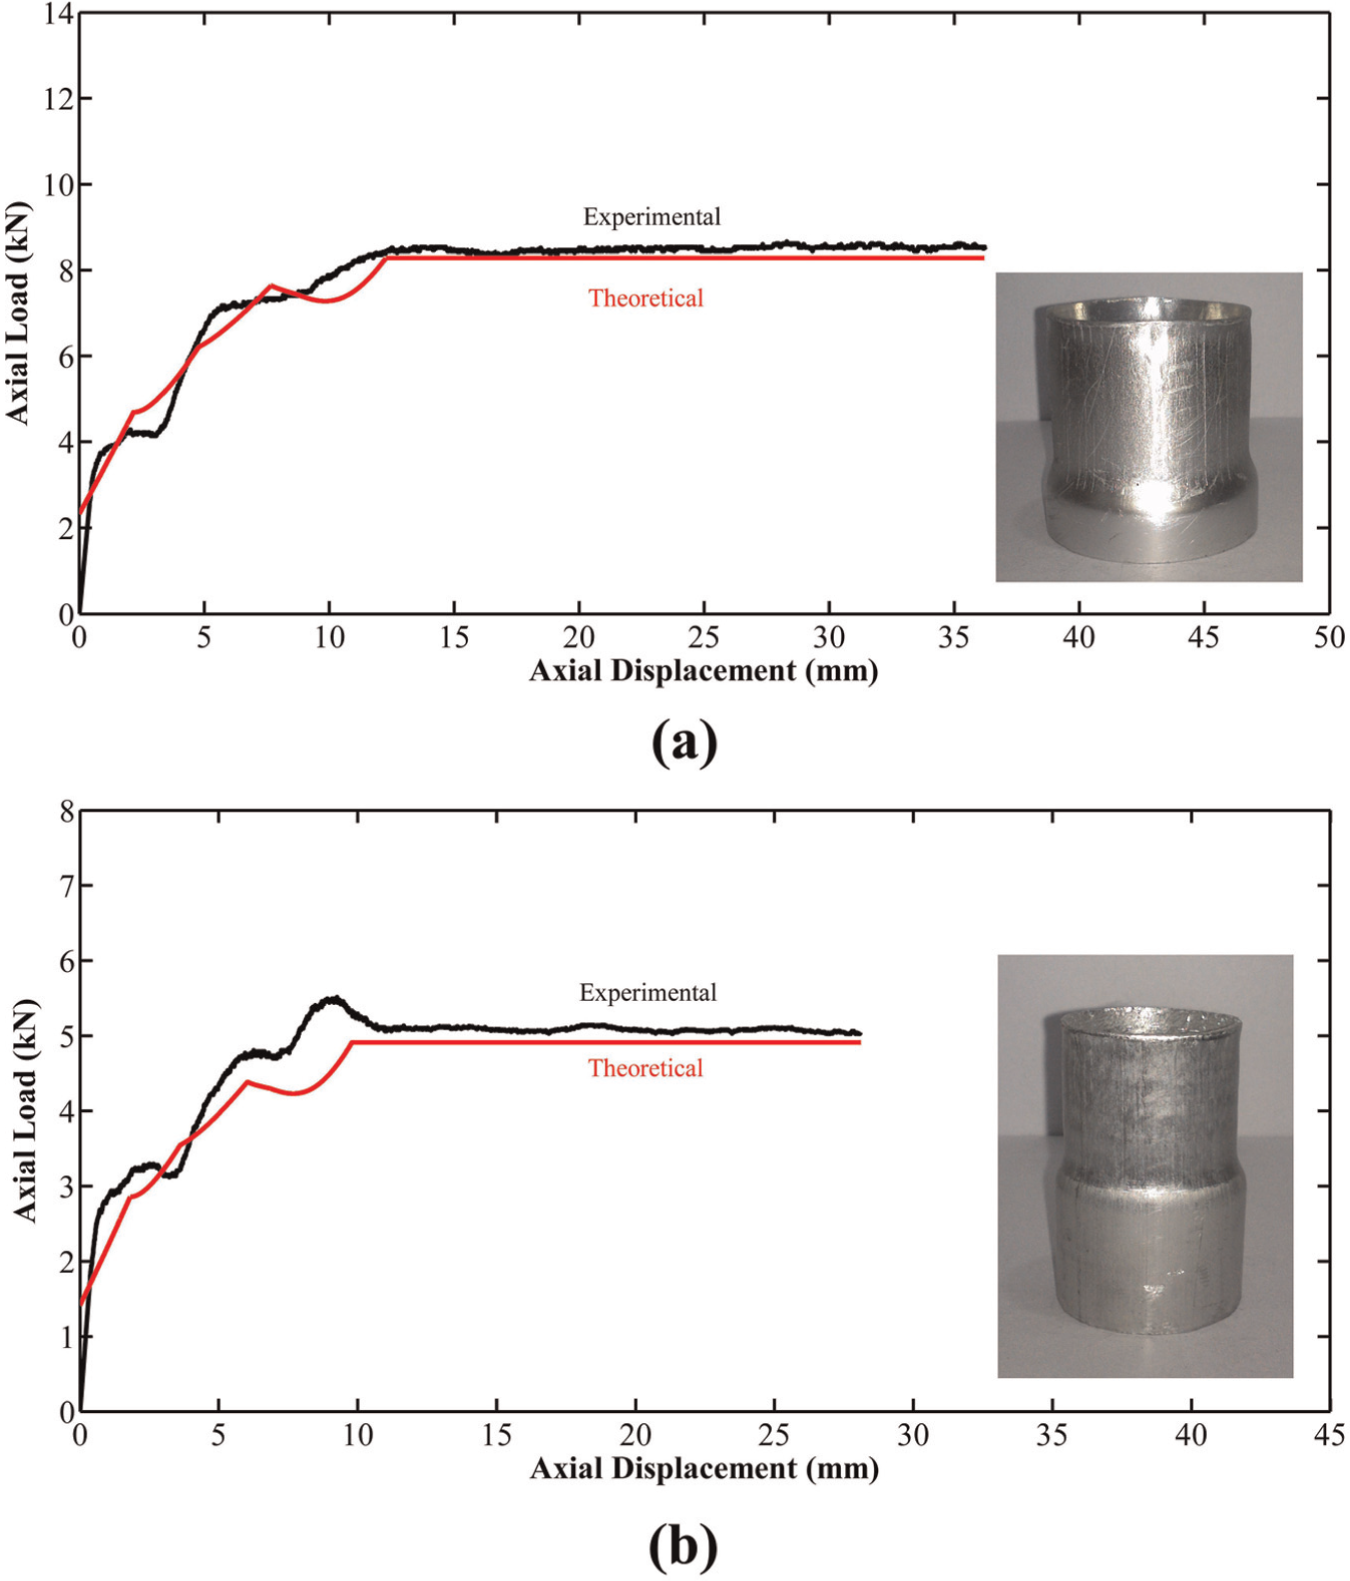
Experimental and theoretical diagrams of the axial load versus the axial displacement of (a) the specimen CT-14 and (b) the specimen CT-17.
In the present research work, a theoretical deformation model was introduced in five different stages to study contraction process of thin-walled tubes with circular cross section on a conical die. First stage consists of two different mechanisms of bending and circumferential contraction. Then, during both of the second and third stages of the theoretical model, circumferential contraction is added. In a part of tube wall that cooperates in the second stage, friction is another energy absorber mechanism, while no friction is considered in a part of tube wall that cooperates in the third stage. Therefore, when friction effects are neglected, second and third stages of the theoretical model become a unit stage. Also, fourth and fifth stages of the introduced theoretical model have the same mechanisms of bending and variations in tube cross section perimeter; so, by considering some simplifications, they can be considered as a unit stage. Generally, it means that five stages of the introduced deformation model can be represented in a simpler model with three different stages.
Verification of the steady force formula
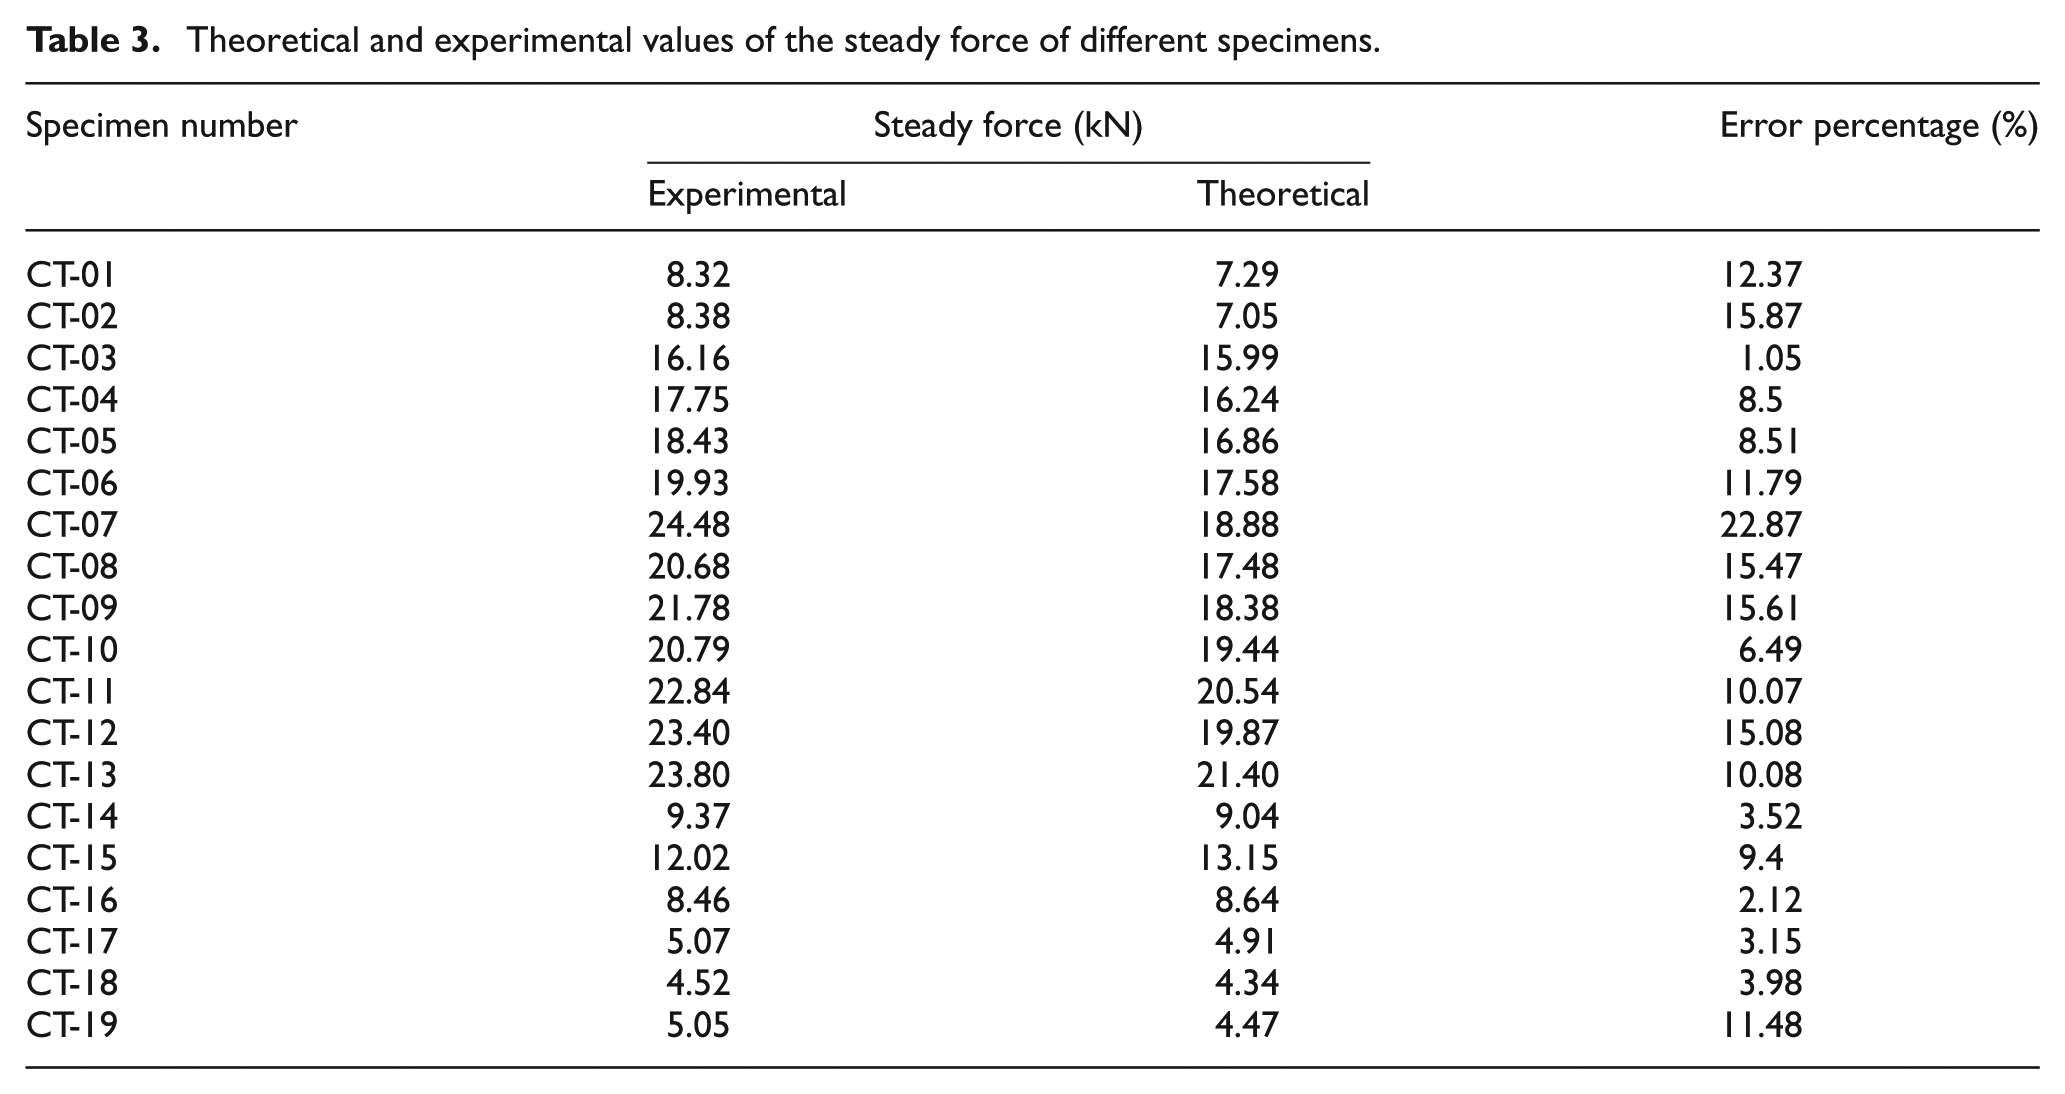
The load–displacement diagrams in Figures 4–6 show that there is an approximated steady force in the final part of the experimental curve which is related directly to the energy absorption capacity by the structure. In viewpoint of energy absorption capability by the contracted metal tubes, during a long stroke deformation, most share of the absorbed energy is dependent on the value of the steady force, and therefore, in design of a tube contraction mechanism as an energy absorber system, estimation of the steady force during the process has a key role. In the introduced theory, equation (46) calculates the steady force of the circular metal tubes during the contraction process. Table 3 compares the theoretical predictions and the experimental measurements of the steady force during the contraction process on different specimens. This table shows that error percentages of the estimated results of all the specimens are less than 23%, and it asserts validity of the theoretical equation (46) that predicts the steady force of the tube contraction process. A good correlation between the theoretical estimations and the experimental results proves precision of the theory, and it affirms verity of the new theoretical model of plastic deformation of the circular metal tubes during the contraction process under the axial loading.
Theoretical and experimental values of the steady force of different specimens.
Verification of the first bending radius formula
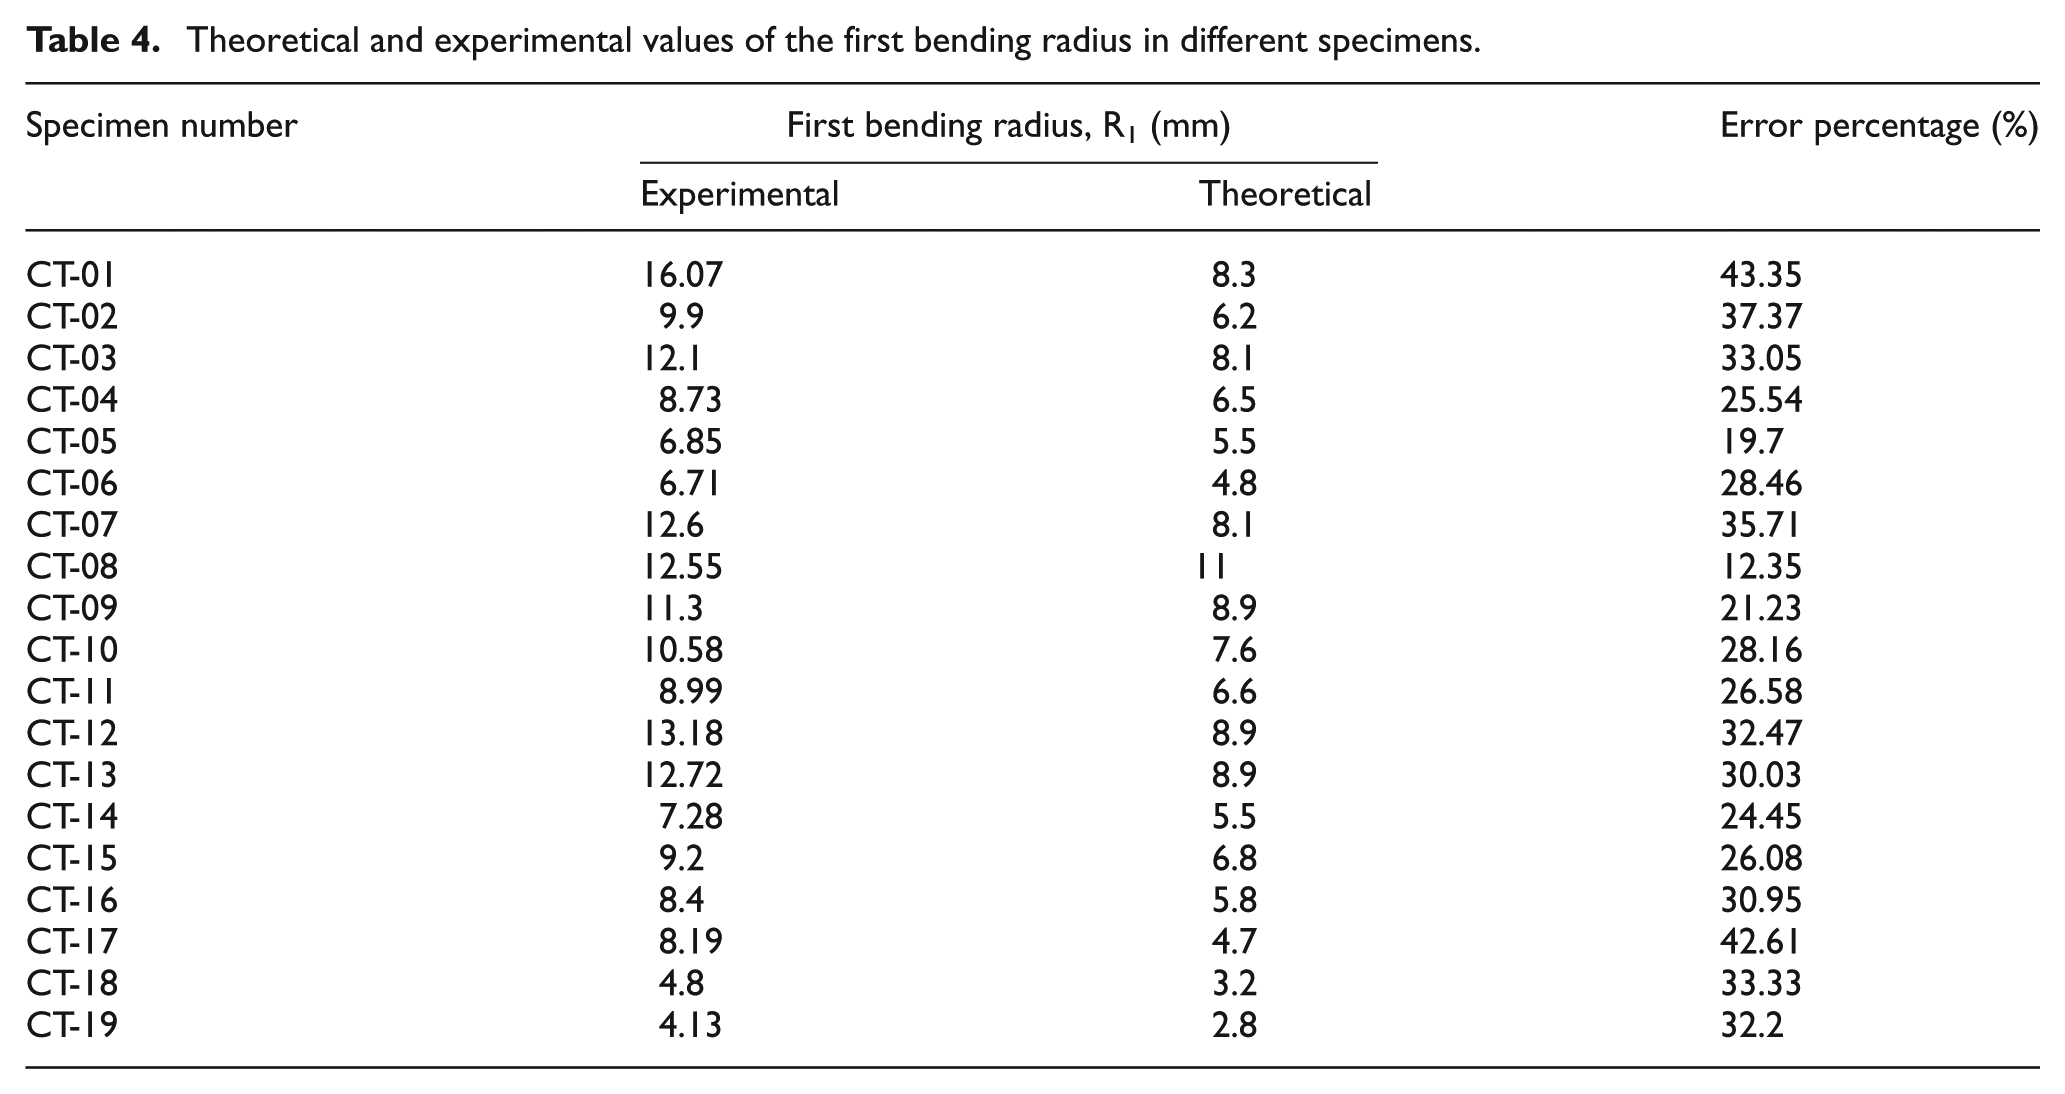
When the contraction process begins, a part of tube that is in contact with the internal surface of conical die is bent with the curl radius of R 1 which is called first bending radius. To predict the first bending radius of the tube, the new theoretical equation (13) was introduced according to the present analytical model. The equation shows that the first bending radius has a direct relationship with wall thickness and outer radius of the tube and a reverse relationship with semi-angle of die and friction coefficient. Therefore, it can be concluded that by increasing the tube wall thickness, the first bending radius increases. Based on the theoretical equation (13), a schematic diagram of the first bending radius versus the tube wall thickness for the conical dies with different semi-angles of α = 10°, 20°, 30° and 40° and similar outer radius of RO = 25 mm were sketched in Figure 7. According to this figure, increment of the tube wall thickness results in increment of the curl radius, and the bending radius decreases by increasing the die angle. The theoretical predictions and the experimental measurements of the first bending radius of the tested specimens are shown in Table 4. Comparison of the results shows that in most cases, the theoretical equation (13) estimates the first bending radius with a reasonable agreement. The experimental measurements show that the first bending occurs with small radii; therefore, a limited difference between the theoretical estimations and experiments results in a considerable error percentage.
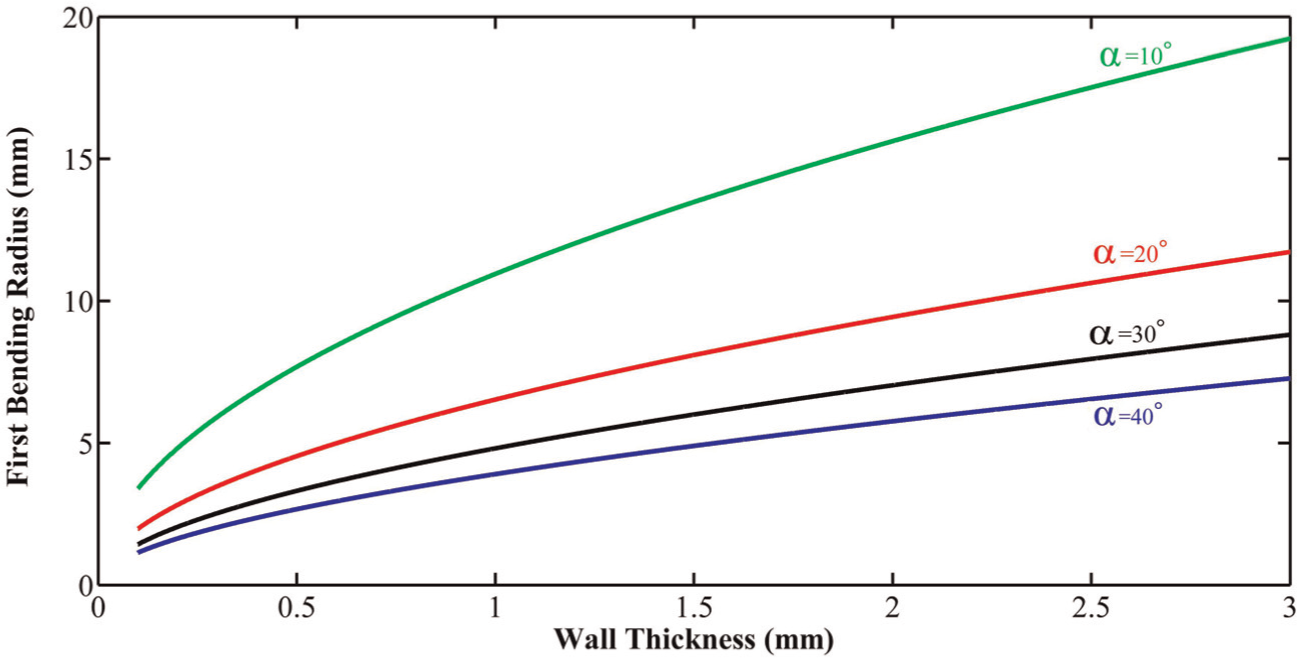
A schematic theoretical diagram of the first bending radius versus the tube wall thickness for different die angles of α = 10°, 20°, 30° and 40°.
Theoretical and experimental values of the first bending radius in different specimens.
For better conclusion, Figure 8 compares the theoretical and experimental diagrams of the first bending radius versus the semi-angle of die of the specimens CT-03, -04, -05 and -06 with the same tube characteristics and contraction ratio, but with different die semi-angles of 15°, 20°, 25° and 30°, respectively. A good correlation between the results asserts verity of the present theory. Also, according to this figure, both the theory and the experiments show that the first bending radius decreases nonlinearly, when the die angle increases.
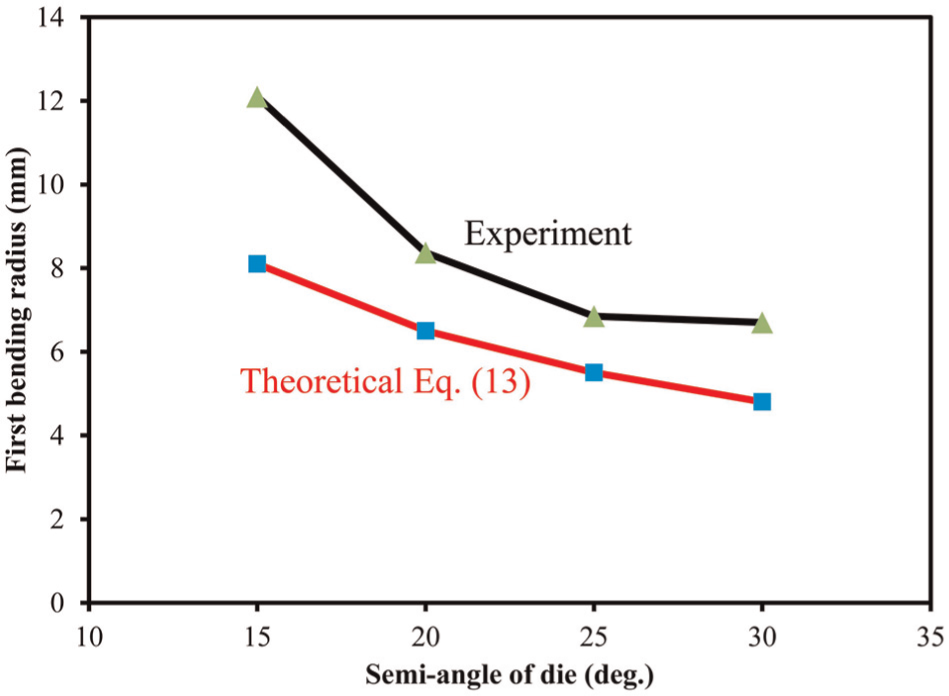
Experimental and theoretical diagrams of the first bending radius of the specimens CT-03, -04, -05 and -06 versus the semi-angle of die.
Verification of the protruded radius formula
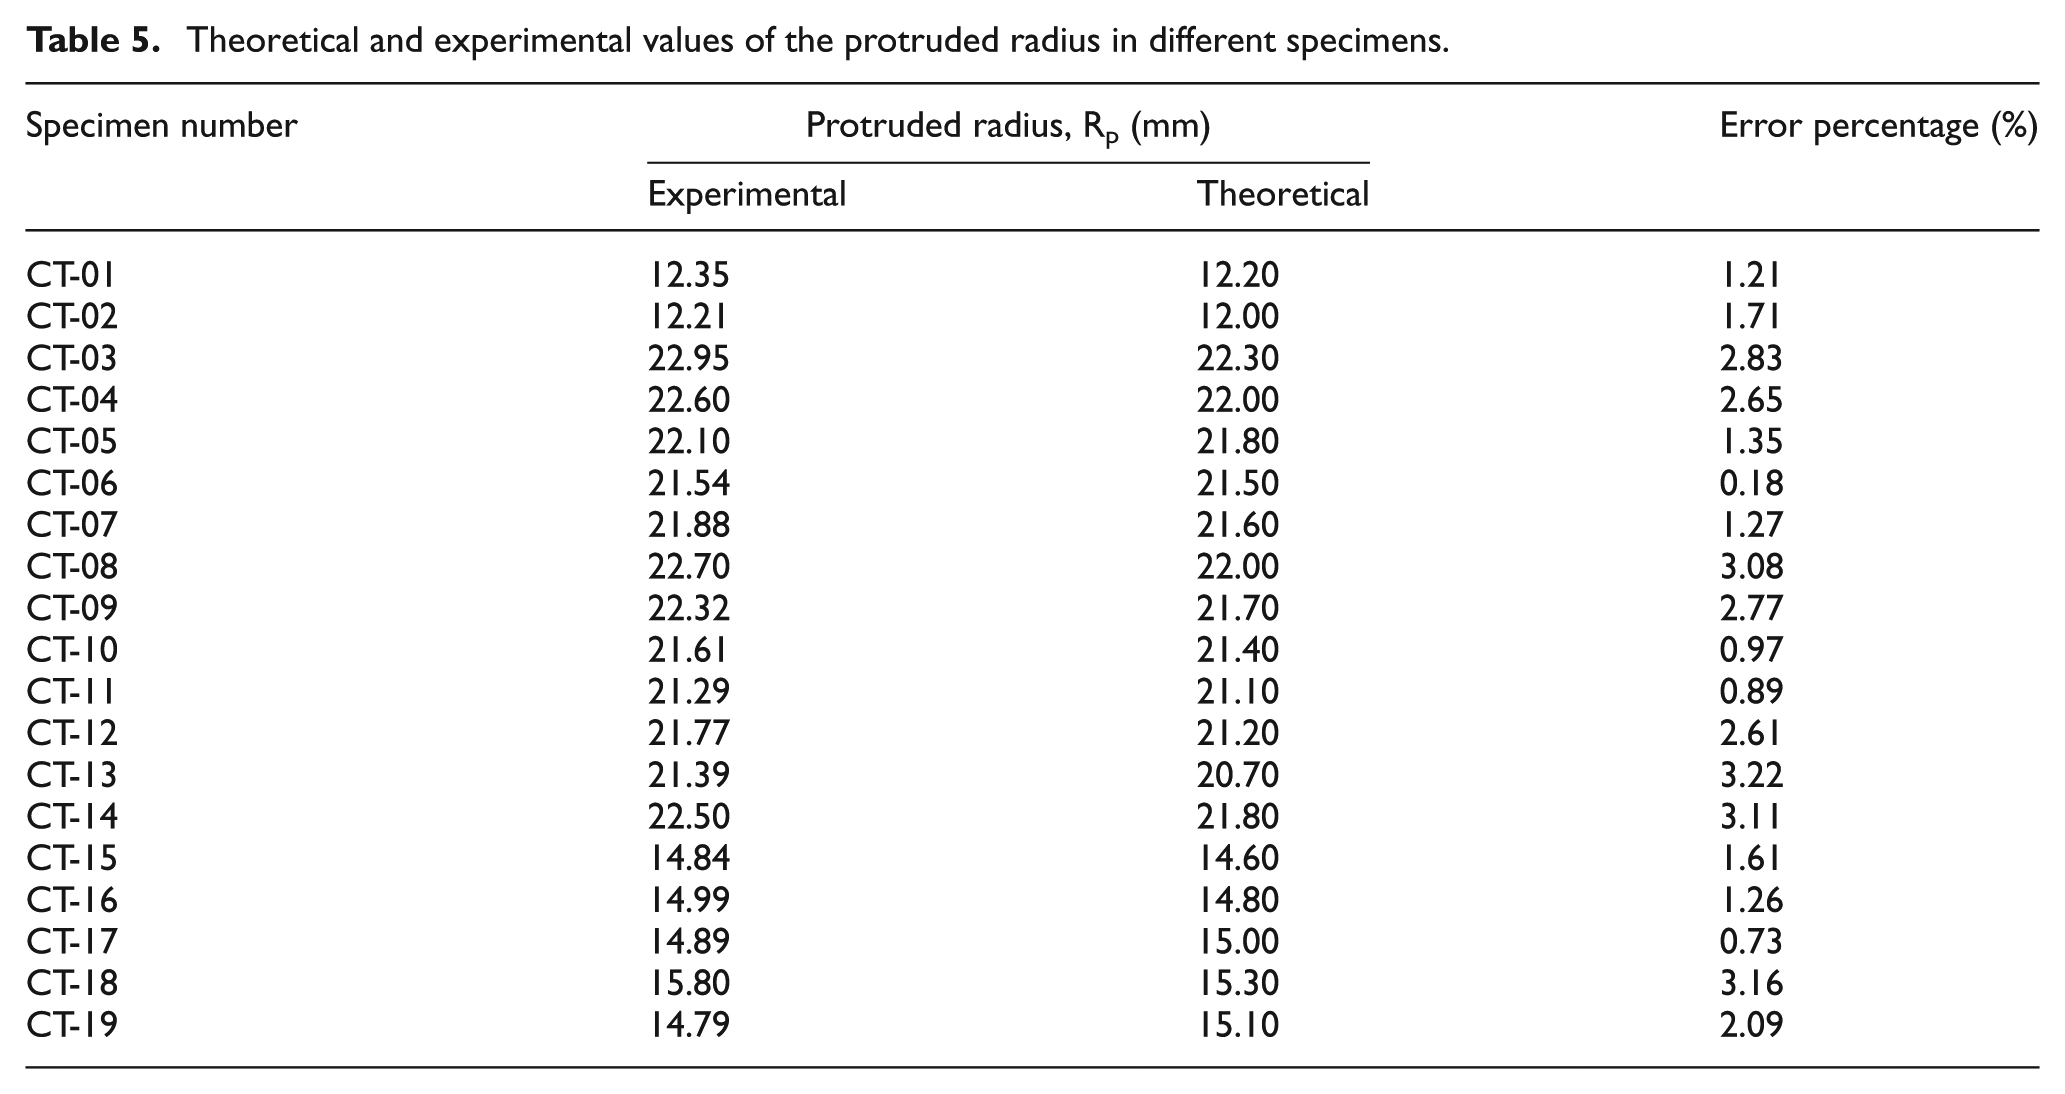
Figure 9(a) shows a sectioned view of the specimen CT-07 after the contraction process. The experimental measurements show that the protruded radius of the tube is smaller than the die radius in the cylindrical part. For the specimen CT-07 that was shown in Figure 9(a), the experimental measurements result in a protruded radius equal to 21.88 mm. Also, the theoretical equation (26) predicts the protruded radius equal to Rp = 21.6 mm, and it shows a very good correlation. Also, Figure 9(b) illustrates the specimen CT-12 and the conical die after the test. Comparison of Figures 1 and 9(b) affirms that the present theoretical model and actual plastic deformation of the circular tubes through the contraction process are analogous. Table 5 compares the predicted protruded radius by equation (26) with the corresponding experimental results of different specimens with different material types and geometries and different dies. According to this table, error percentages of the theoretical predictions against the experimental measurements for all the specimens are less than 3.3%.
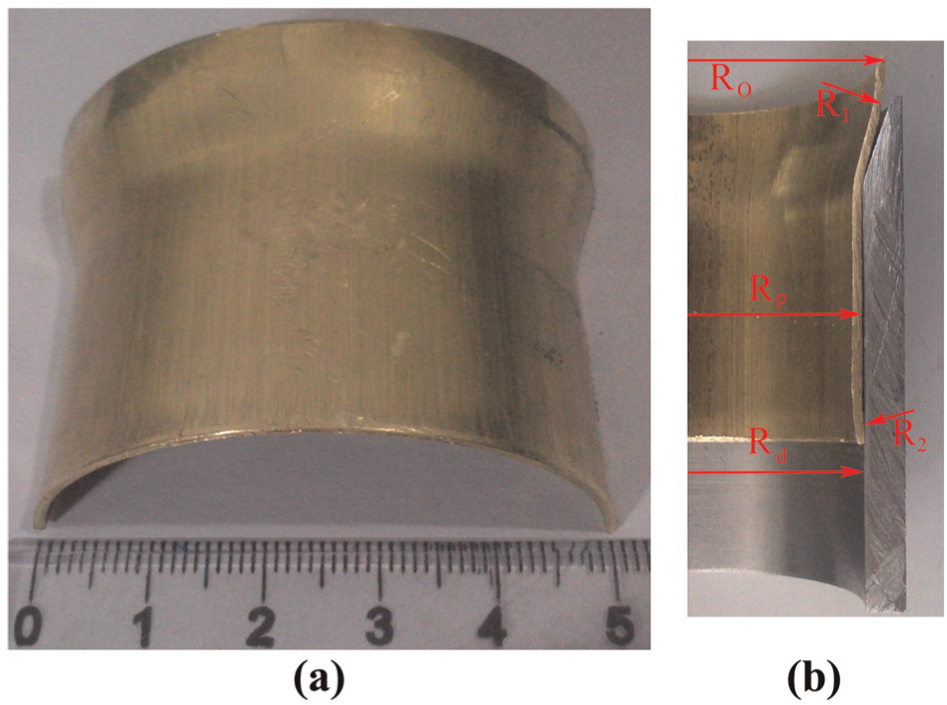
(a) The specimen CT-07 after the test and its protruded radius and (b) sectioned view of the brazen specimen CT-12 and the die after the contraction test.
Theoretical and experimental values of the protruded radius in different specimens.
Furthermore, the theoretical equation (26) shows that protruded radius of the tubes decreases by increasing the tube wall thickness, semi-angle of conical die and contraction ratio. A schematic diagram of the protruded radius versus the semi-angle of die is sketched in Figure 10(a), based on the theoretical equation (26), and it shows the decline of the protruded radius by increasing the semi-angle of die nonlinearly. Also, Figure 10(b) compares the theoretical and experimental results of the protruded radius versus the semi-angle of die for the brazen specimens CT-08, -09, -10 and -11. This figure shows that both the theoretical and the experimental values of the protruded radius decrease when the die angle increases. Also, an appropriate agreement between the theoretical and the experimental results is a proof of the theoretical analysis and the introduced deformation model.
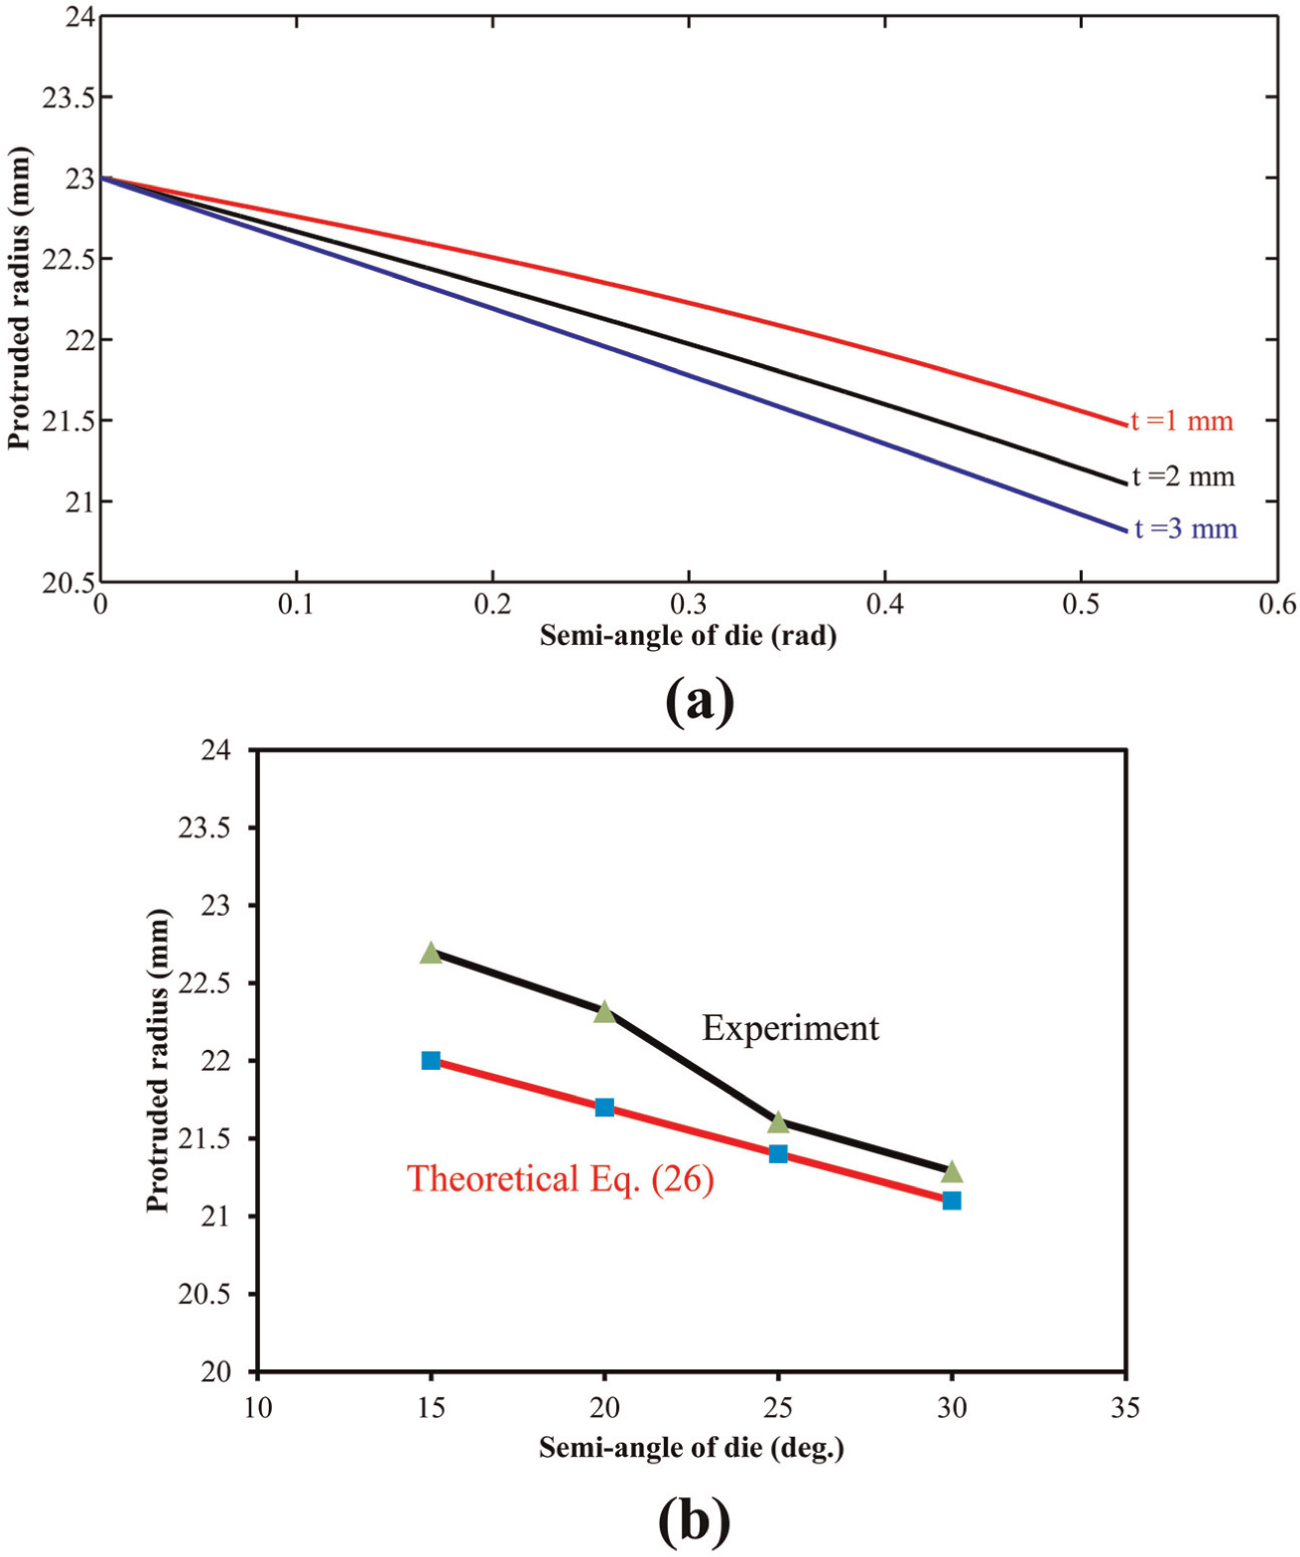
Diagrams of the protruded radius versus semi-angle of die: (a) a schematic theoretical diagram and (b) experimental and theoretical diagrams of the specimens CT-08, -09, -10 and -11.
Verification of the thickness variation formulas
Theoretical analysis of this article divides the axial contraction process on the circular metal tubes into five different stages, and in each stage, the instantaneous wall thickness was derived. Theoretical formulas show that the instantaneous wall thickness is dependent on semi-angle of conical die, contraction ratio and friction coefficient. To verify the theoretical analysis, theoretical thickness variations of the specimen CT-07 by some experimental measurements were sketched in Figure 11. This figure illustrates that the theoretical diagram and experimental measurements of the wall thickness of the brazen specimen CT-07 versus the axial displacement have the same behavior. An acceptable correlation between the theoretical predictions and the experimental measurements in Figure 11 declares precision of the presented formulas. Estimation of the wall thickness variations of the circular tubes during the contraction process is the main parameter in viewpoint of manufacturing.
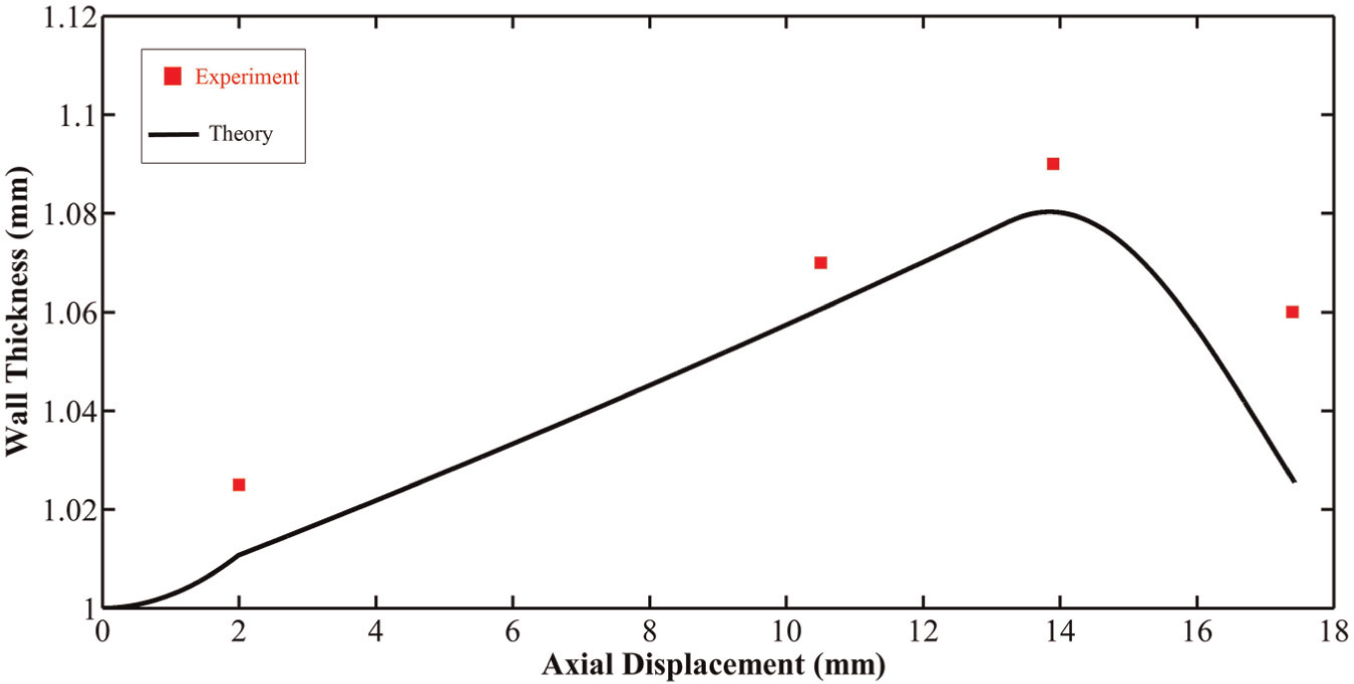
Comparison of the theoretical diagram of wall thickness variations of the specimen CT-07 versus the axial displacement and the experimental measurements.
Effects of tube radius
The theoretical equation (46) shows that the steady force of the contraction process on the metal tubes is a function of the material type, wall thickness and outer radius of the tube and geometrical dimensions of the die. Figure 12 denotes the experimental diagram of the axial load/flow stress versus the axial displacement of the brazen specimens CT-02 and -07 with the same wall thickness, contraction ratio and die angle but with different tube outer radii of 14 and 25 mm, respectively. The experimental results show that when the outer radius of the tube increases, the instantaneous axial load during the contraction process also increases. It is due to the material volume that cooperates in the plastic deformation process of the tubes with the larger diameters is more than the smaller one. Figure 13 compares the theoretical and experimental diagrams of the steady force/flow stress versus the tube outer radius of the specimens CT-02 and -07 during the process. This figure depicts a reasonable correlation between the experimental and theoretical results.
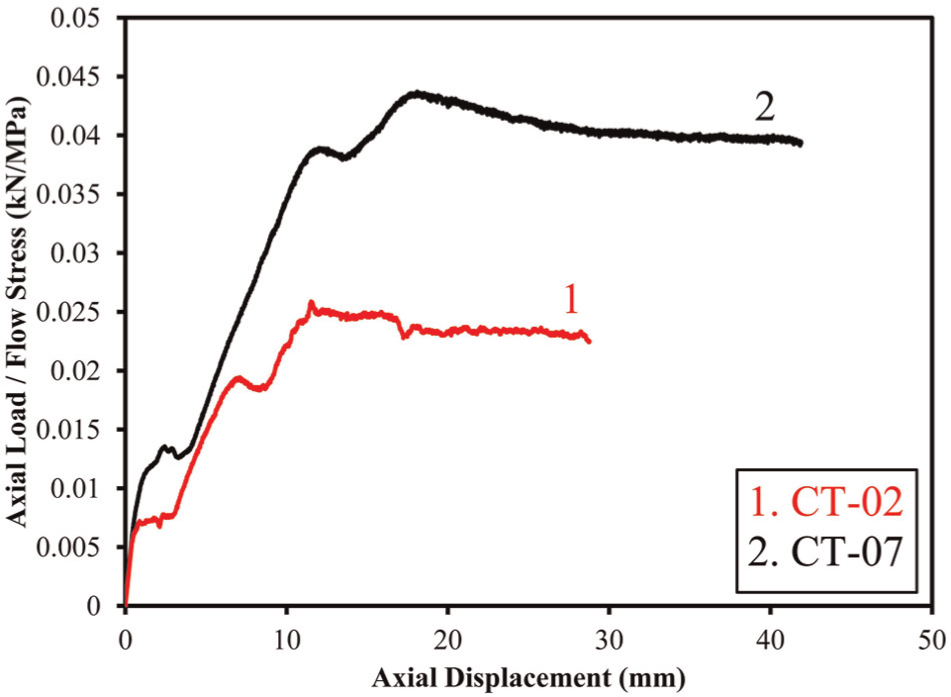
Experimental diagram of the axial load/flow stress versus the axial displacement of the brazen specimens CT-02 and -07 with different tube radii.
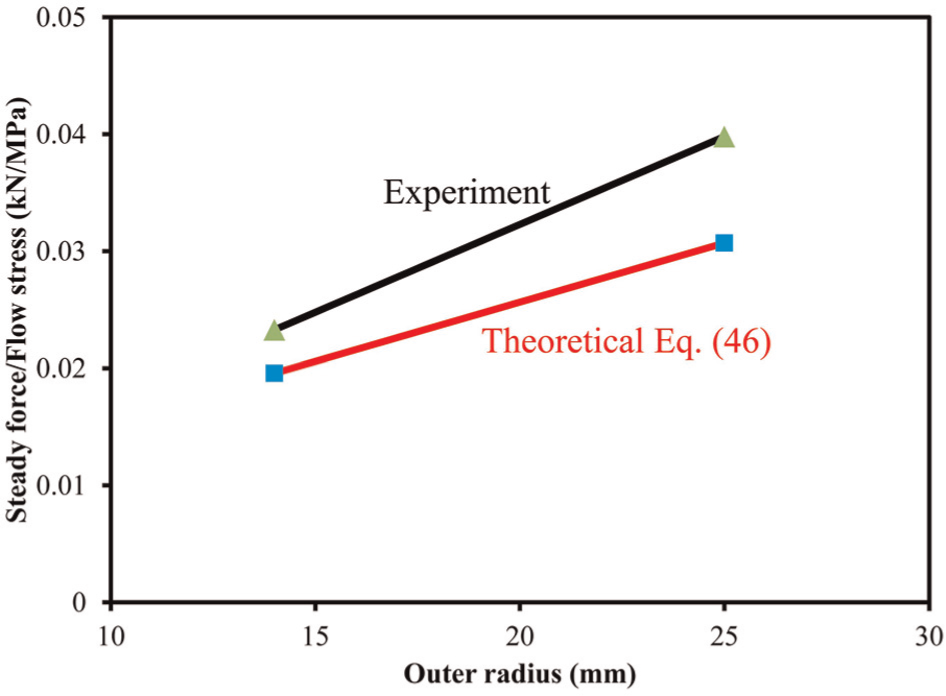
Experimental and theoretical diagrams of the steady force/flow stress versus the tube outer radius of the specimens CT-02 and -07.
Area under the load–displacement diagram results in the absorbed energy by the tubes. Diagrams of the absorbed energy per unit flow stress of the mentioned specimens versus the axial displacement are sketched in Figure 14(a). This figure shows that in conditions of the same wall thicknesses, contraction ratios and die angles, the absorbed energy by the structure increases by increment of the tube outer radius. In design of many structures, one of the most important parameters is absorbed energy per unit of the structure mass that is called specific absorbed energy (SAE). The SAE by the specimens versus the axial displacement is illustrated in Figure 14(b), and the comparison shows that the tube with the smaller diameter is a better energy absorber. According to Figure 14(a) and (b), it can be concluded that in the studied cases, selection of the tube with larger diameter is suitable to design an energy absorber system, if mass of the structure is not a main design parameter. But in an optimized design of the tubes based on the minimum mass, use of the tube with small diameter is a better choice. Note that for each material type and wall thickness, the optimum diameter of the circular metal tube must be determined.
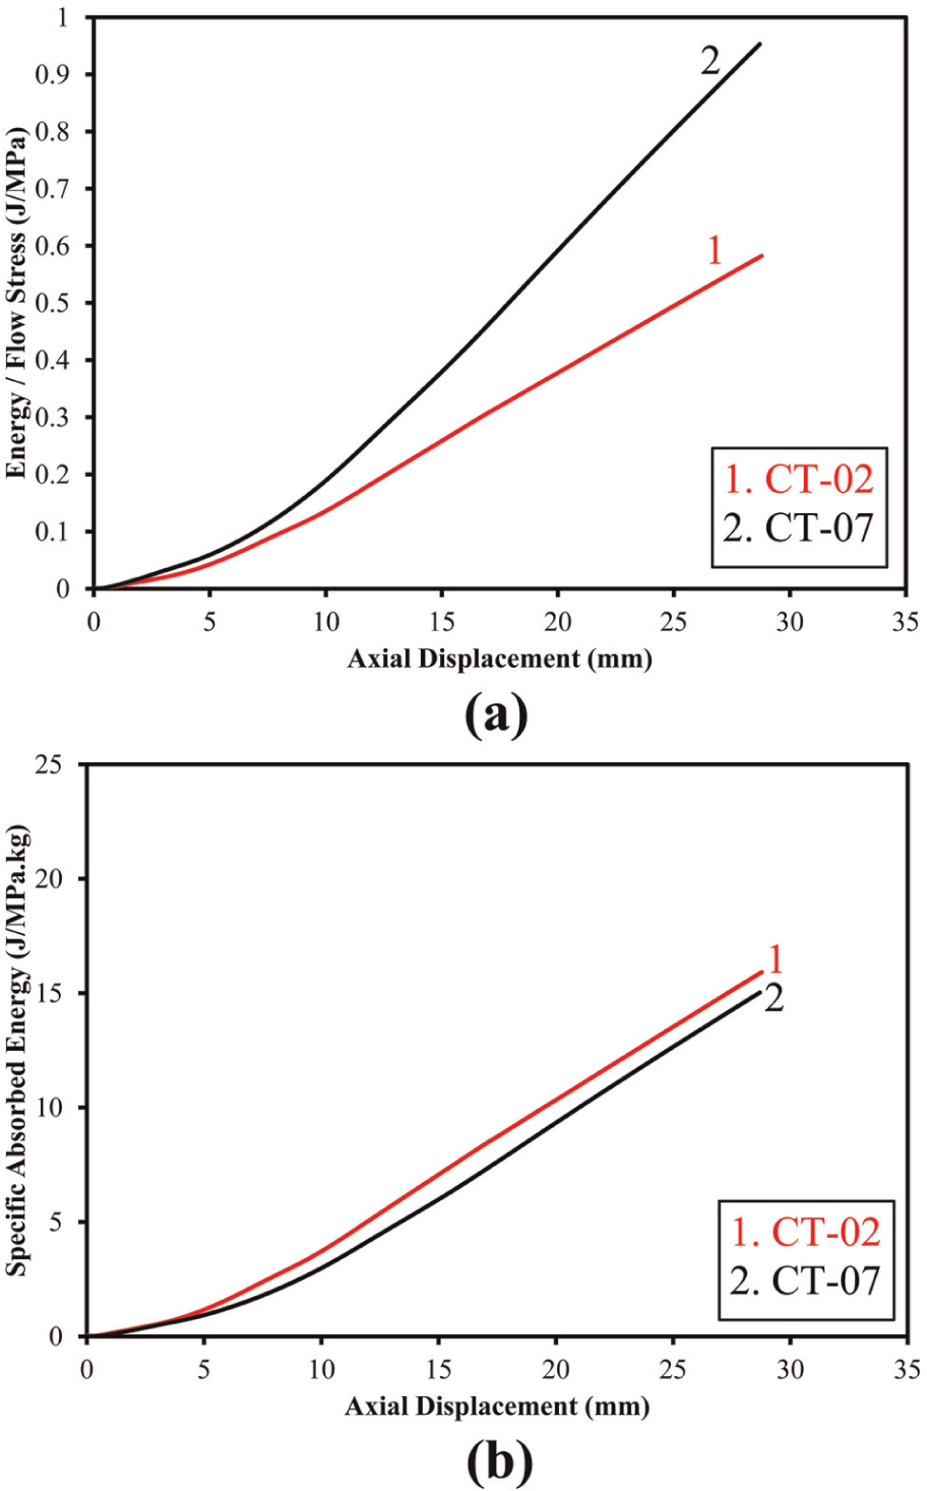
Experimental diagrams of the brazen tubes CT-02 and -07 with different tube outer radii: (a) absorbed energy/flow stress–axial displacement and (b) specific absorbed energy–axial displacement.
Effects of conical die angle
Figure 15 shows the experimental diagram of the instantaneous axial load versus the axial displacement of the specimens CT-03, -04, -05 and -06 with the same tube characteristics and contraction ratio but with different die semi-angles equal to 15°, 20, 25° and 30°, respectively. The experimental diagrams show that with increment of the die semi-angle, the axial force increases. By comparison of the curves, it is found that in the tubes with the same wall thickness, outer radius and material, a larger semi-angle of die leads to higher axial load. It is due to at a certain axial displacement for all the compared specimens, when the semi-angle of die increases, the created contraction and therefore the axial load increases too.
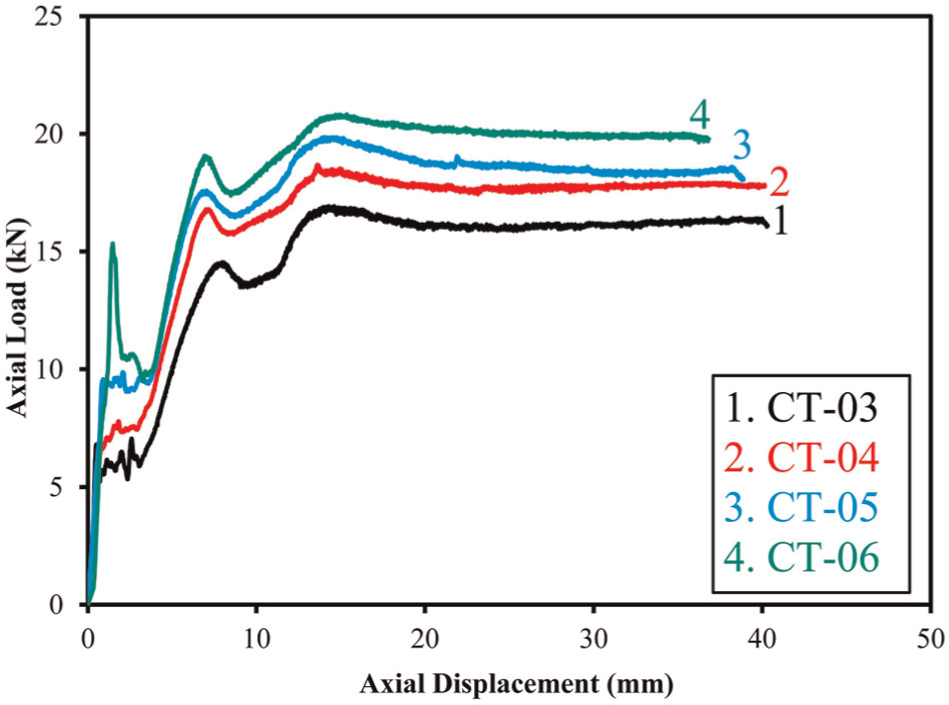
Experimental diagram of the axial load–displacement of the brazen specimens CT-03, -04, -05 and -06 with different die semi-angles.
Figure 16 illustrates the steady force of the brazen specimens CT-03, -04, -05 and -06 versus the semi-angle of die, based on the theoretical and experimental results. An admissible correlation asserts reasonable accuracy of the theoretical predictions. Figure 17 shows the SAE by the mentioned specimens versus the axial displacement. This figure indicates that by increasing the punch angle during the contraction process on the circular tubes, absorbed energy and SAE by the structure increase. However, increment of the semi-angle of die may lead to instability such as local buckling and wrinkling during the process.
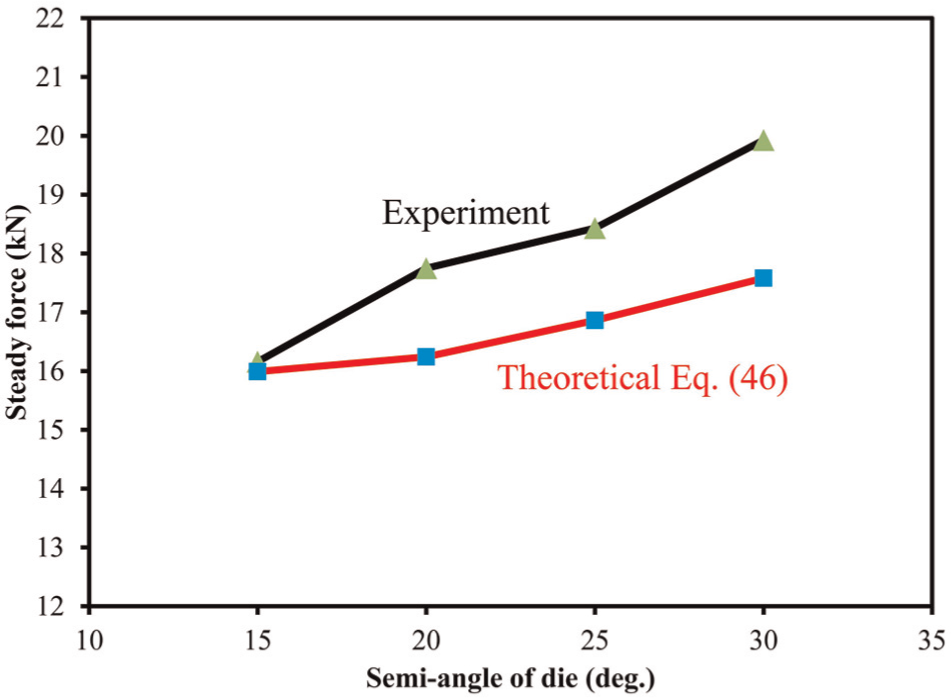
Experimental and theoretical diagrams of the steady force versus the semi-angle of die in the specimens CT-03, -04, -05 and -06.
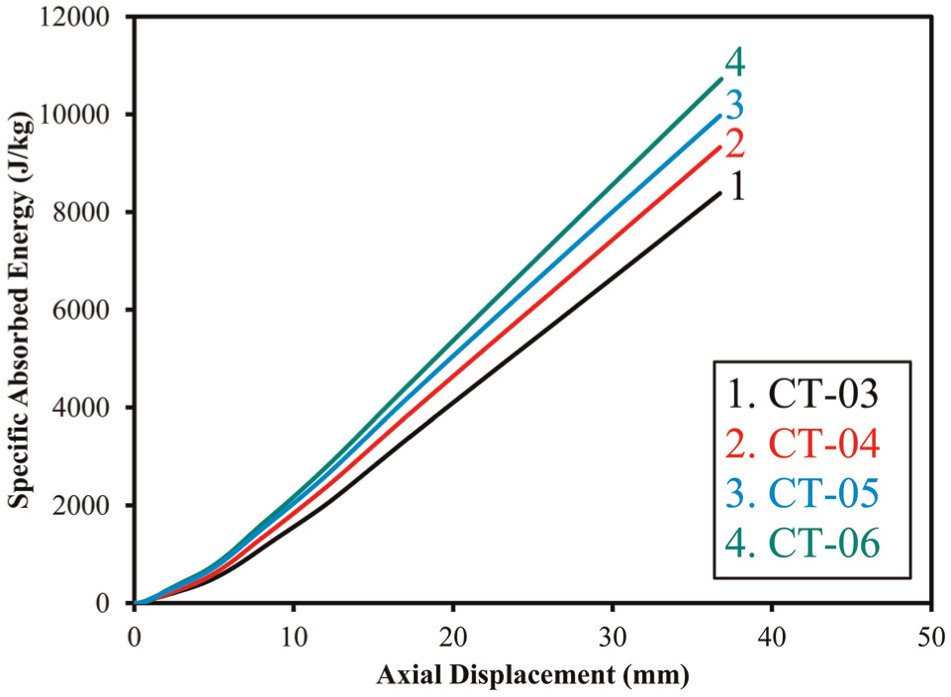
Experimental diagram of the specific absorbed energy versus the axial displacement of the tested specimens CT-03, -04, -05 and -06 on different dies.
Effects of contraction ratio
The introduced analytical relations show that the contraction ratio has significant effects on the tube contraction mechanism. To investigate the effects of the contraction ratio, some experimental tests were performed on the specimens CT-09, -12 and -13 with the same tube characteristics and die angle but with different contraction ratios. Figure 18 illustrates the experimental comparison of the axial load–displacement of the mentioned specimens. According to this figure, it is found that when the contraction ratio increases, the axial load of the specimens also increases. In addition, this figure shows that although the contraction ratios of the tested specimens are different, slopes of the different experimental curves during the second and the third stages are the same. Reviewing of the theoretical equations (18) and (21) that estimate this part of the graph shows that predictions by the present relation give the same slope of the second and third parts of the theoretical graph for the same specimens with different contraction ratios.
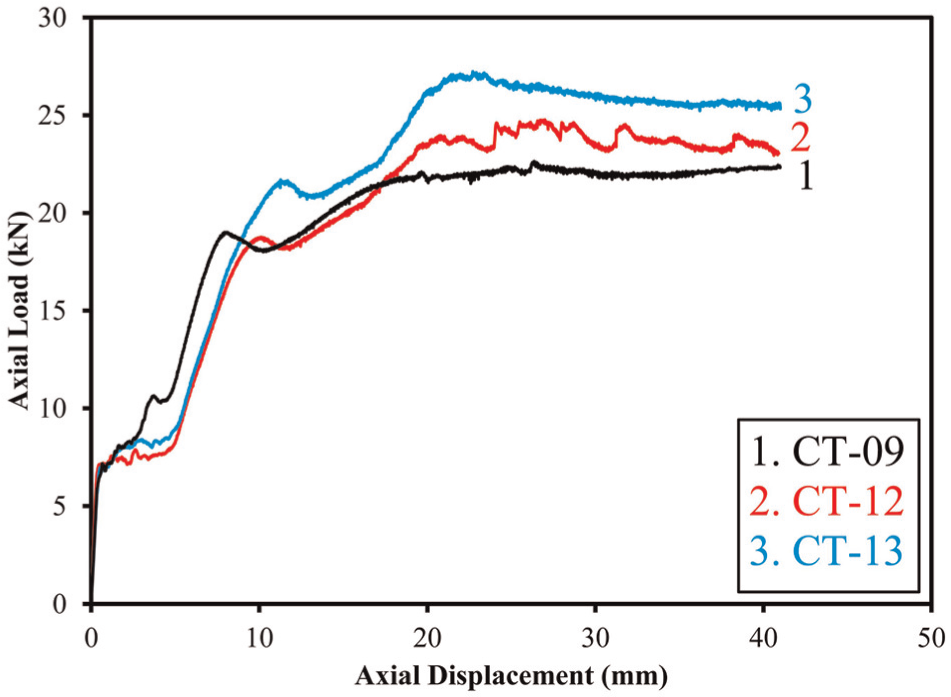
Experimental diagram of the axial load–displacement of the specimens CT-09, -12 and -13 with different contraction ratios.
Theoretical and experimental diagrams of the steady load versus the contraction ratio of the mentioned specimens are illustrated in Figure 19. This figure depicts that both the theoretical predictions and the experimental measurements show similar variations for the steady force versus the contraction ratio, and it proves verity of the present theory and the new theoretical deformation model. It is obvious that the contraction ratio of the circular tubes with certain geometrical and material characteristics has a critical value, and for the higher ratio, deformation mode of the tubes changes and the rupture probably occurs in the tube wall .
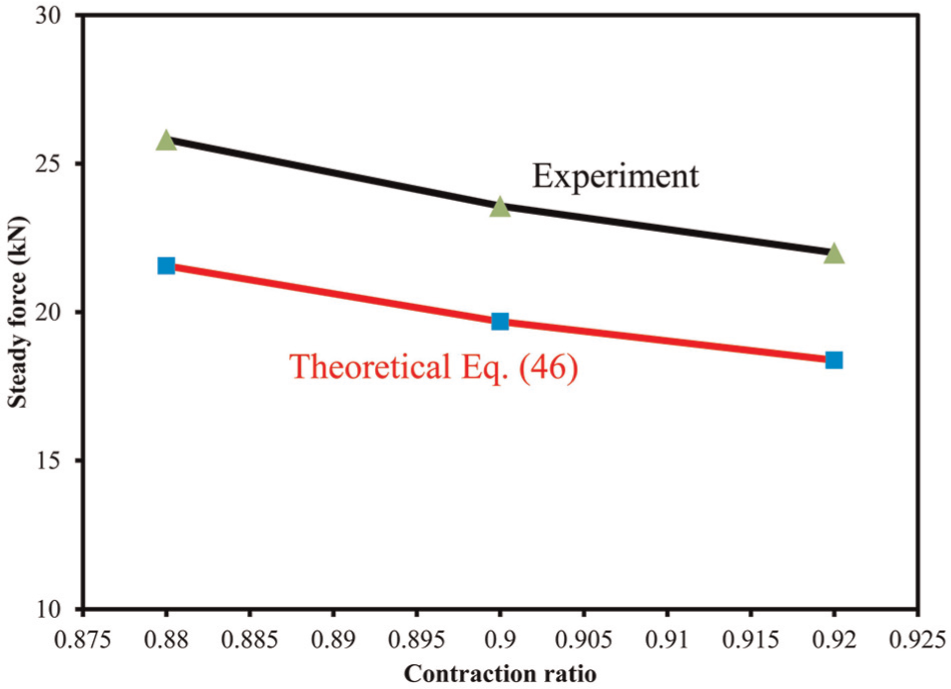
Experimental and theoretical diagrams of the steady force versus the contraction ratio of the specimens CT-09, -12 and -13.
Effects of tube wall thickness
Figure 20 illustrates experimental diagram of the instantaneous axial load versus the axial displacement of three similar specimens that were compressed by the same conical die. The tubes have the same material and geometrical dimension but with different wall thicknesses. This figure shows that when the tube wall thickness increases, the maximum axial force also increases. On the other hand, the absorbed energy by the specimens during the contraction process increases, when the wall thickness of the tubes increases. Figure 21 compares experimental measurements and theoretical predictions of the steady force of the specimens CT-15, -16 and -17 with three different wall thicknesses. This figure shows that both of the theoretical and experimental curves conclude that increment of the steady force is by increasing the wall thickness, and the reasonable correlation between the curves affirms the present theoretical analysis. Comparison of the SAE versus the axial displacement of the mentioned specimens is illustrated in Figure 22. This figure depicts that the SAE by the thicker tube is more than the thinner one, and therefore, the circular tubes with the thicker wall are better energy absorbers compared with the thin tubes.
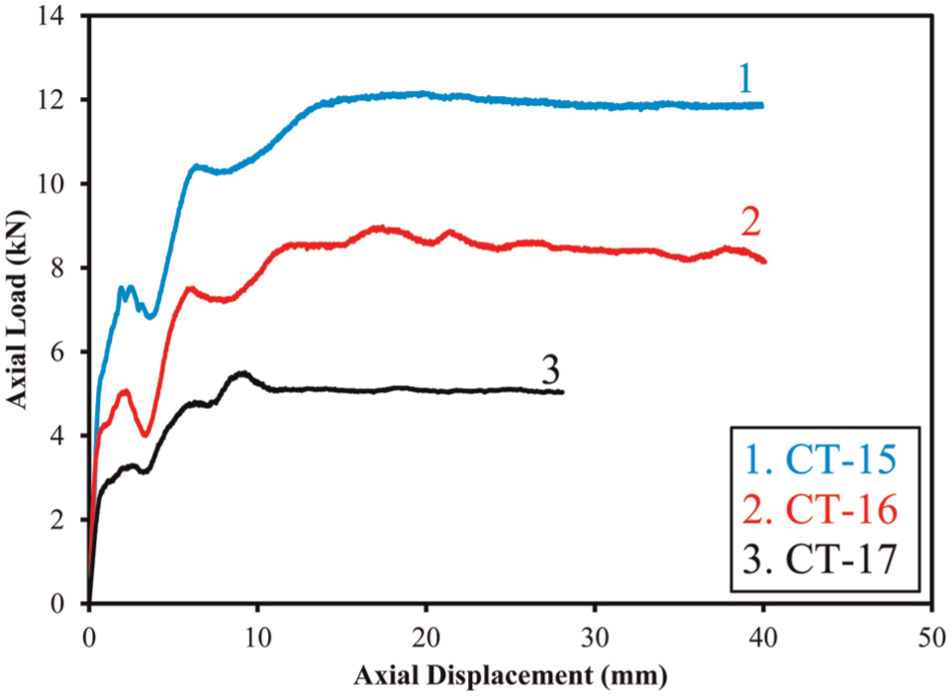
Experimental diagram of the axial load–displacement of the specimens CT-15, -16 and -17 with different wall thicknesses.
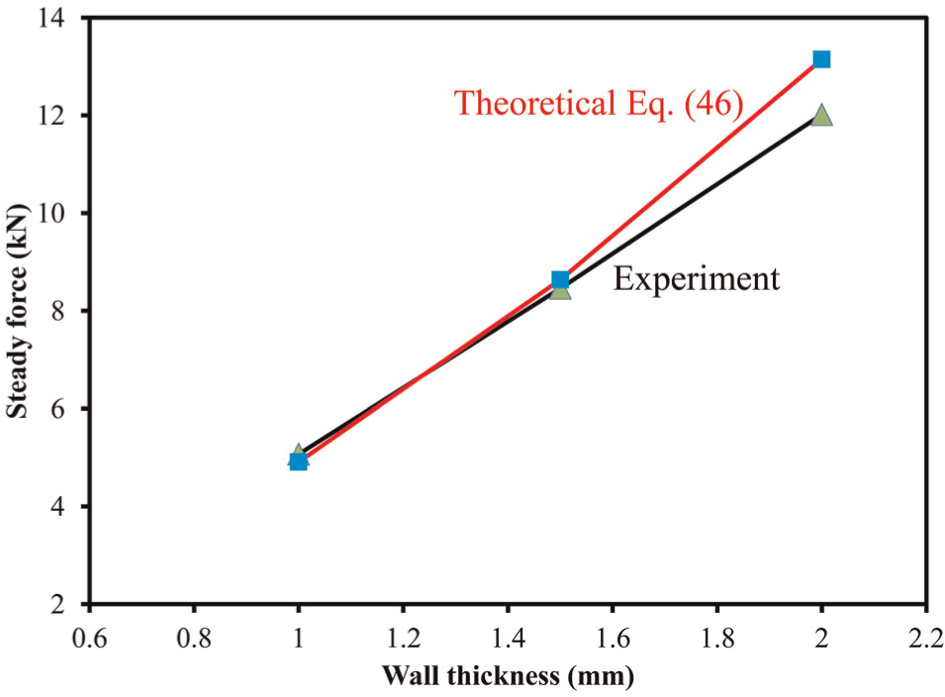
Experimental and theoretical diagrams of the steady force versus the wall thickness of the specimens CT-15, -16 and -17.
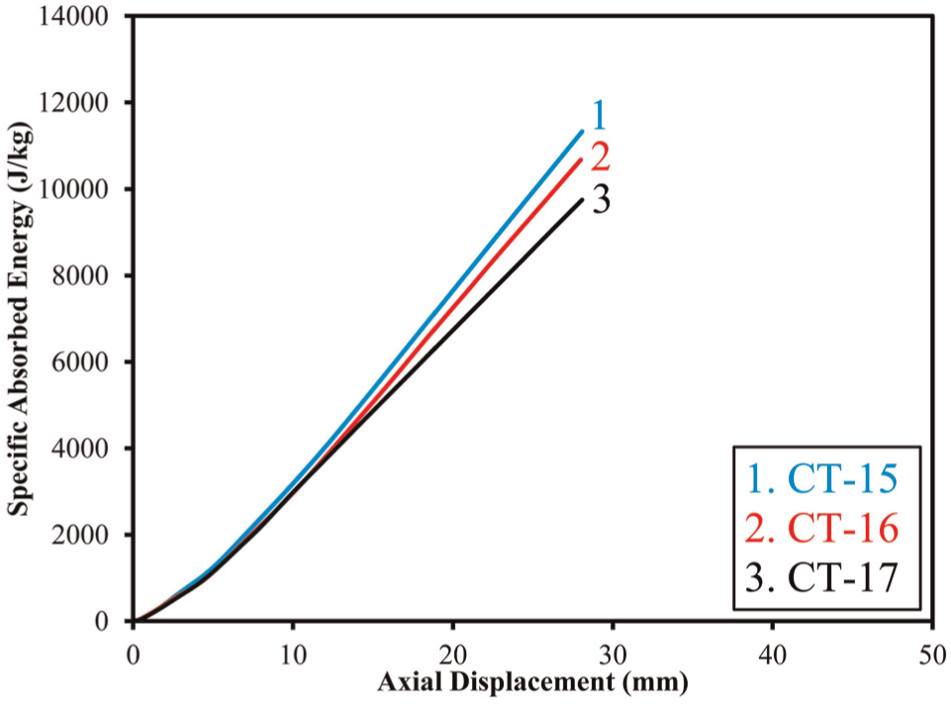
Experimental diagram of the specific absorbed energy versus the axial displacement of the tested specimens CT-15, -16 and -17 with different wall thicknesses.
Conclusion
This article introduced a new theoretical model of plastic deformation and some new theoretical relations were derived to estimate the instantaneous axial load of circular metal tubes during the contraction process under quasi-static axial loading. Some theoretical relations were obtained to predict the effective parameters on the process such as the steady force, first bending and protruded radii. Also, the effect of thickness variation of the tubes on the contraction process was investigated theoretically. Comparison of the theoretical and experimental results confirms that the present theory predicts the axial load–displacement diagram and some other parameters with an admissible correlation. The theoretical relations result in the axial load of the tube is a function of characteristics of the tubes, geometrical dimension of the rigid punch and friction coefficient. In addition, effects of tube radius, semi-angle of die, the contraction ratio and wall thickness variations on the axial load, energy absorption capability and the SAE by the specimens were studied.
Footnotes
Acknowledgements
The authors gratefully acknowledge Strength of Materials Laboratory in Yasouj University for the supports in preparing the specimens and dies.
Declaration of Conflicting Interests
The author(s) declared no potential conflicts of interest with respect to the research, authorship, and/or publication of this article.
Funding
The author(s) received no financial support for the research, authorship, and/or publication of this article.