
Abstract
In any welding process, the quality of joints is significantly affected by the bead geometry as well as the presence of welding defects. One promising approach is to utilize the features of the welding signals such as voltage, current and sound to monitor and predict the quality of the welded joints. In this work, for gas metal arc welding, a regression modeling has been proposed to predict two main weld quality measures, namely, welding defects and bead shape factor. The proposed approach is based on the features of welding electrical and sound signals. The weld quality characteristics are defined in terms of weld defects (discontinuity, lack of fusion and overlap) as well as weld shape factor. These measures are modeled using statistical parameters of weld sound and electrical signals. To develop the models, 13 statistical parameters of the signals have been employed. To gather the required data, a total of 57 experiments have been performed based on the optimal determinant method (D-optimal) of design of experiments approach. The curvilinear function has proved to have the best fit for the process under consideration. The proposed models are validated through further experiments. Comparisons between the experimental measurements and the predicted values indicate that the developed models are quite accurate in predicting the actual welding process in terms of the two main weld quality indices. The proposed approach may be used to adjust the input parameters in such a way that the desired bead geometry is obtained while the welding defects are minimized.
Keywords
Introduction
Gas metal arc welding (GMAW) is one of the most widely used joining processes in various industries. This is due to its low cost, high productivity and high potential for automation. Like any other welding process, the quality of the joint in GMAW is mainly determined by the weld bead geometry and the presence of various welding defects. These quality measures, in turn, are influenced by welding input parameters such as voltage, feed rate, welding speed and electrode-to-workpiece distance. In addition, in-process signals such as sound and electrical signals, which can be measured during the welding, may also be good indicators of the weld quality.1–3 These signals can be measured and monitored while the welding is still in progress. They would directly relate the input parameters setting to the weld quality indices, including bead shape and welding defects, and hence provide an opportunity to adjust the input parameters settings for an improved joint.4,5
There is an extensive body of research to relate sound and electrical signals to the welding output specifications, among which welding acoustic signals have been especially of great interest. Weld sound signals are also used by experience welders as a measure for online control. Arata et al. 6 showed that the welding arc sound is affected by input parameters such as welding power, welding speed, gas flow rate, type of shielding gas and wire extension. They notify that sound pressure is strongly synchronized with the extinction and ignition of arc. Wang et al. 7 find that acoustic signal of gas tungsten argon welding (GTAW) process of aluminum is greatly affected by welding parameters. They have studied the relation between welding power and sound based on Fourier transforms and recursive least squares method. Wang et al. 8 have used the features of welding sound signal to monitor the welding penetration. Cayo and Absi Alfaro 9 have concluded that the analysis of welding sound signal in time domain may be more perceptible in detecting defects, compared to frequency domain. Senthilkumar et al. 10 have reported a correlation study between the sound signal parameters and the tensile strength of the joints in friction stir welding process.
In welding process, the transference of molten mass to the workpiece may be in three different modes: short circuit, globular and spray. To determine the transference mode during the welding, Cayo and Absi Alfaro 11 have used some important statistical parameters of the sound pressure level spectrums such as mean value, variance, standard deviation and number of pulses per second. Poopat and Warinsiriruk 12 have shown that the transfer mode in welding process can be detected by welding sound signal. They have classified weld transfer mode according to the values of sound level and frequency of sound peaks.
Many studies have reported the correlations of characteristics of welding process signals with each other. Drouet and Nadeau 13 have showed that the emitted sound of weld arc is proportional to the arc electric power. Cudina et al. 14 have reported that the arc sound power can be calculated based on welding current. They considered the arc ignition and extinction as well as the arc ionization as two main sources of generating weld sound.
Stability of weld arc is a necessary condition to have an acceptable weldment. Grad et al. 15 have investigated the influence of the welding parameters settings on the weld acoustic signals and arc stability. They have reported that the weld process is more stable in higher frequencies of molten mass droplets. Roca et al. 16 proposed a stability criterion for welding process employing standard deviation of peak amplitude and time intervals between peaks.
The microstructure of welded joint is one of the most important factors affecting the overall quality and strength of the joint. In this regard, Grujicic et al.17,18 established the thermal–mechanical coupled model combined with the physical metallurgy concepts to predict the distribution of crystalline phases within the as-welded microstructure. The proposed procedure has been applied to the low carbon steel AISI 1005 and high-hardness armor-grade MIL A46100 martensitic steel. In an improved analysis, for GMAW process, a comprehensive multiphysics computational model has been proposed by Grujicic et al. 19 The developed model has been applied to the butt-welding of MIL A46100 in order to predict the microstructure evolution and the local properties of the fusion zone (FZ) and heat-affected zone (HAZ). The model is proficient to establish the relationships between the GMAW process parameters, workpiece material chemistry, temporal evolution and the spatial distribution of as-welded material microstructure and properties.
Most current studies on stability criteria, however, do not specifically address the quality of the weldment. In addition, there are no quantitative models to directly relate welding signal characteristics to the weld quality specifications. In fact, each of the welding signals (voltage, current and emitted sound) contains certain information about weld quality characteristics, which may not be shown by others. Therefore, these signals should be simultaneously considered in order to have an accurate representation of the welding process.
This article presents a modeling approach to relate the main GMAW output signals to some of their most important quality measures. A set of mathematical models, based on the statistical parameters of the above-mentioned signals, is derived to assess the quality of the welded joint. The outputs of the proposed models are then compared against experimental data to validate their performance for predicting weld defects and bead geometry. The influential in-process output signals are closed-loop voltage, current and emitted sound. To assess the quality of the welded joint, four of the most important weld characteristics are concurrently considered. They include bead shape factor (SF), lack of fusion (LF), overlap (OL) and discontinuity (DS).
Shape factor is the ratio of the height to the width of the weld bead (Figure 1). It is directly related to the weld bead geometry, one of the main quality measures in welding. 20 The geometry of the weldment has pronounced effects on the strength and quality of the welded joints. Depending on the specific application and the welding process, weld shape factor should be in a specific range as the out-of-the-range shape factor may be an indication of improper welding conditions and poor welded joints.
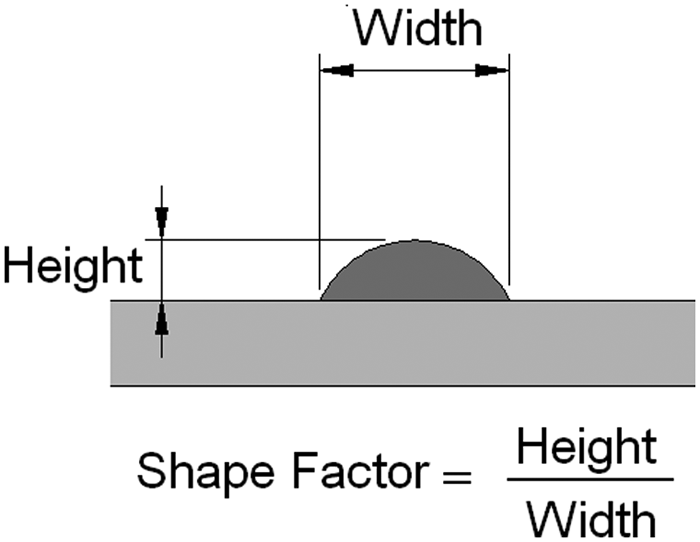
Weld bead geometry and shape factor.
LF, OL and DS are three of the most important visual weld defects affecting the quality of the welded joints. LF, also called cold lapping or cold shuts, occurs when there is no proper fusion between the filler and surfaces of the welded parts. This may happen when the welding pool is too large, welding speed is too slow and/or the weld (filler) metal is permitted to roll in front of the arc. Overlapping may take place when the filler metal does not spread enough on the base parts and, as a result, the angle between the base part and the weld bead is less than 90°. Insufficient heat in the welding pool or excessive deposition rate of filler are possible reasons for this defect. DS occurs when the weldment line is separated to the parts. Insufficient arc heat input and too small wire feed rate may be the cause of this flaw. 21 All these defects are visually detectable on the welded parts. Their occurrences, however, come with the changes to the sound and electrical signals during the process. Figure 2 schematically illustrates the shapes and the possible locations of these defects.
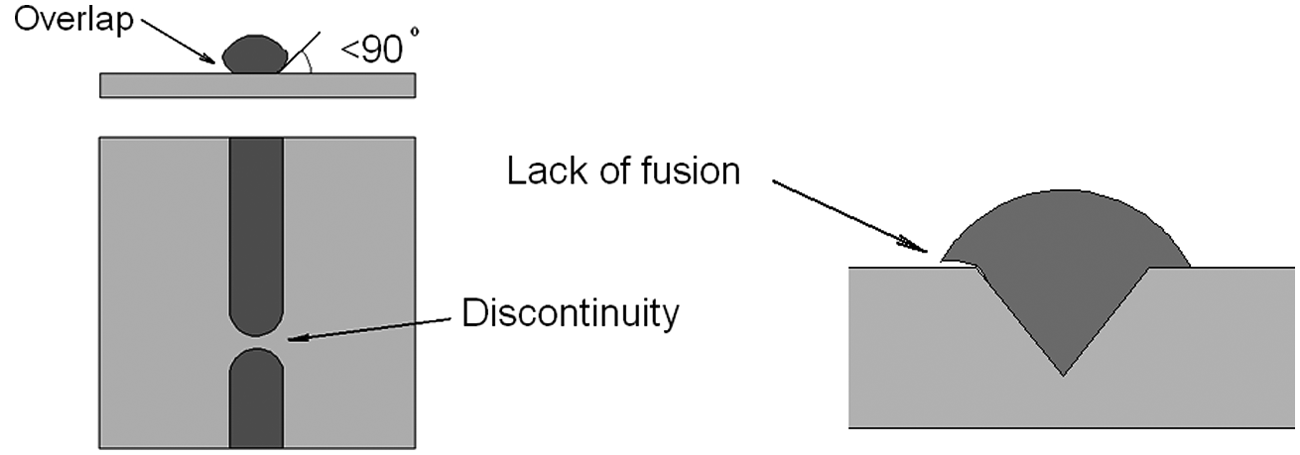
Schematic illustrations of three weld defects.
Design of experiments
Design of experiments (DOE) is a method that proposes a desired set of experiments to optimize or to investigate an under studying object.
22
In this work, D-optimal technique is implemented to design the experiments. The D-optimal design is a subset of all possible combinations of the factors. This method maximizes the determinant of
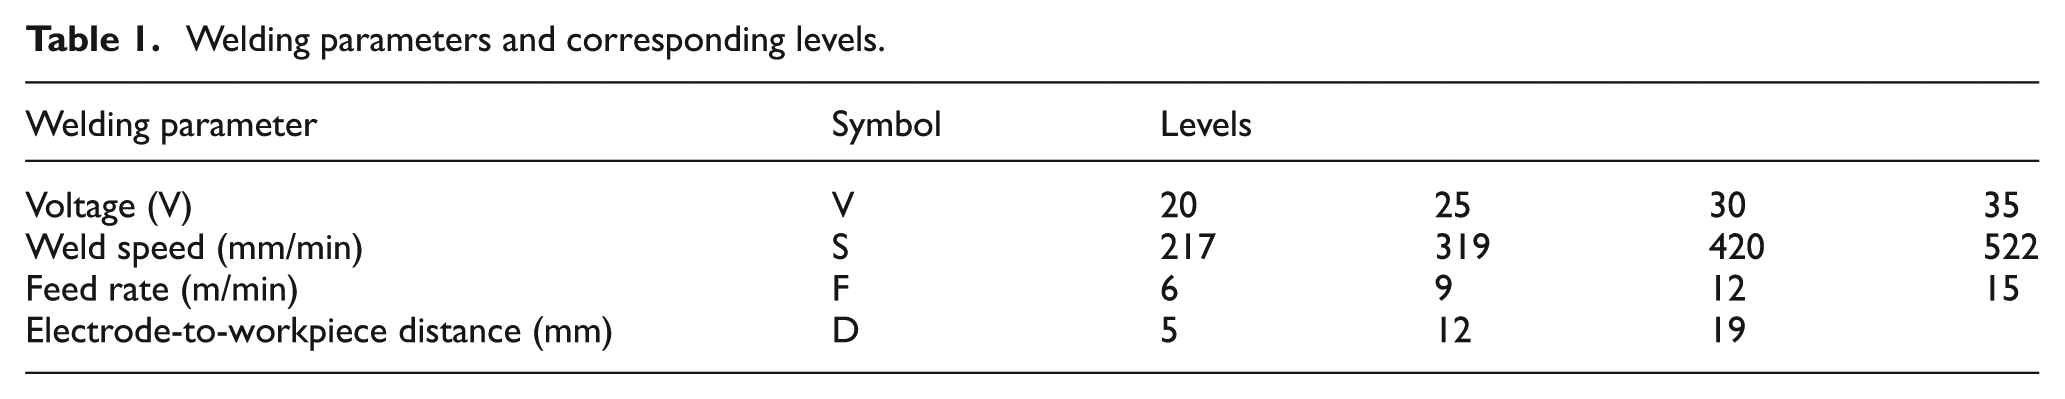
Welding parameters and corresponding levels.
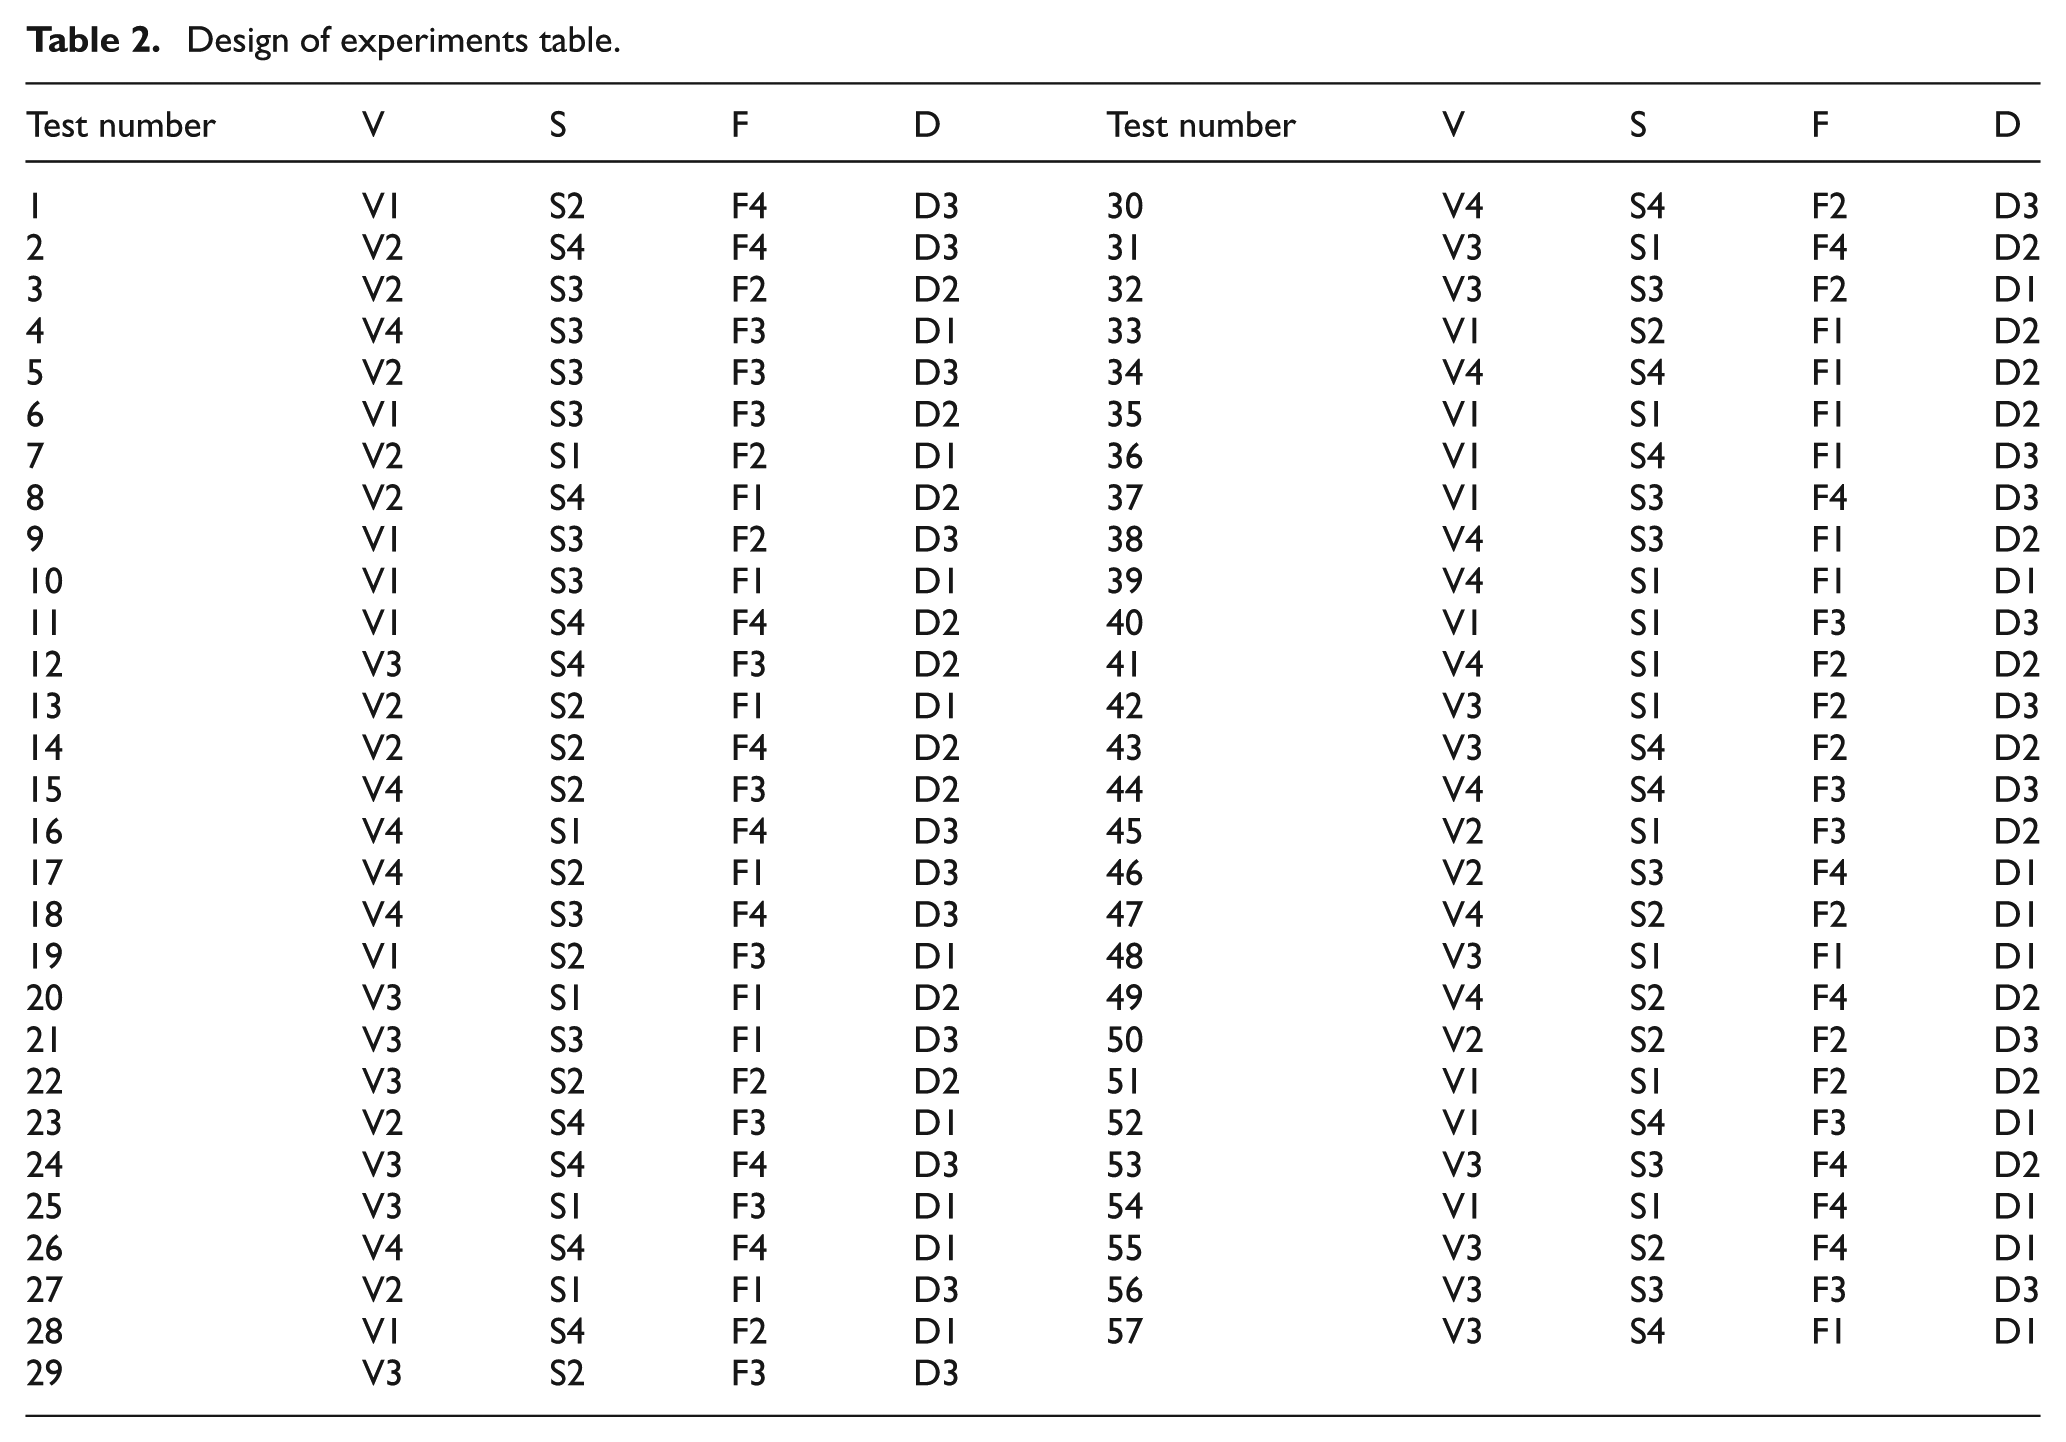
To establish the relationships between the characteristics of emitted weld signals and the quality of weldment, a set of 57 experiments were performed based on D-optimal design matrix. The experimental design matrix is shown in Table 2. The statistical parameters of the output signals of each test are used as the variables of regression models.
Design of experiments table.
Experimental apparatus and execution
The experimental setup used to perform welding tests and to record corresponding arc signals is illustrated in Figures 3 and 4. The test specimens were made of API 5LX42 plates with dimension of 150 mm × 50 mm × 5 mm. Experiments were conducted on Pars MIG-SP501 with constant static voltage. The consumable electrode wire was made of mild steel with 1 mm diameter. A mixture of 80% Ar and 20%
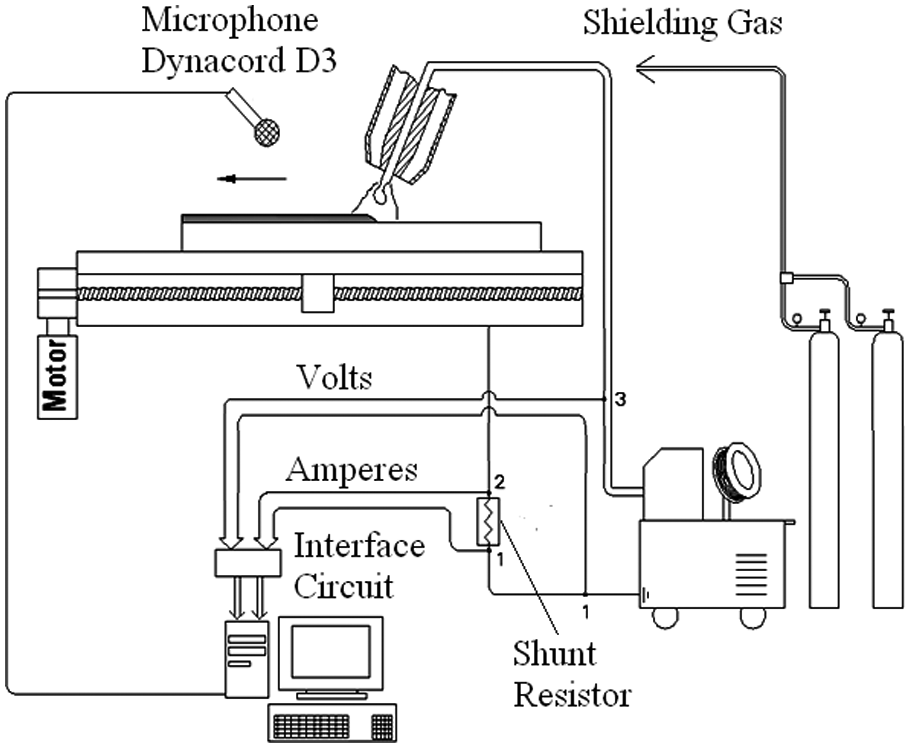
Schematic representation of the setup used in experiments.
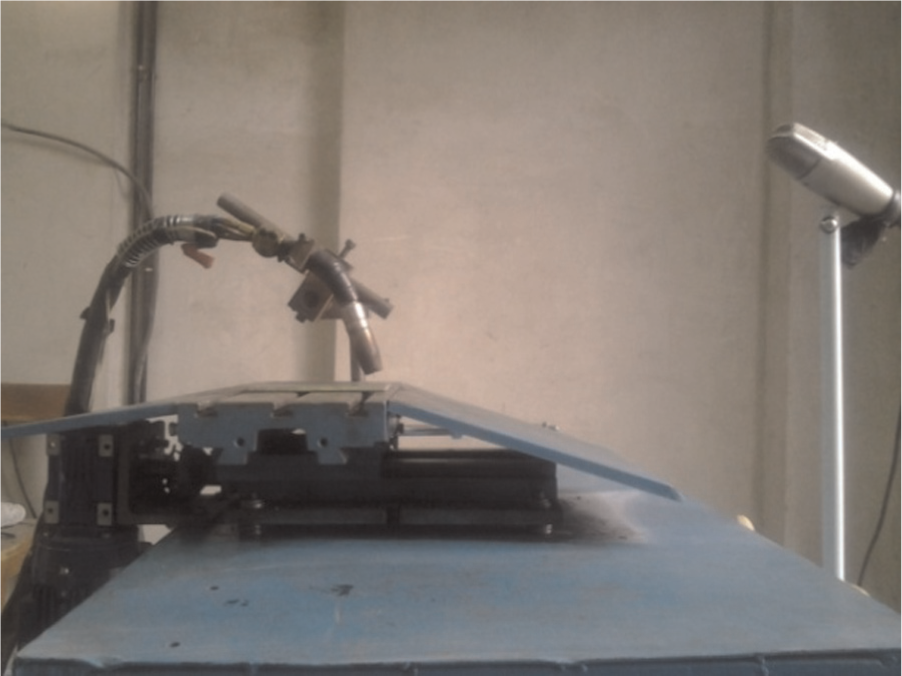
Welding torch and microphone.
To record the sound signals, a Dynacord C3 microphone was mounted on the welding table with constant distance of 30 cm from the torch. The sound signals were collected through a Taskam144 external sound card with a sampling frequency of 40 kHz. The two electrical signals (voltage and current) were collected using PCI Eagle 703S data acquisition card. LabViEW 7.0 was employed as the data accusation software.
Welding signals and their statistical characteristics (models inputs)
In this study, the welding quality measures are modeled using the statistical characteristics of signals generated during the process. As illustrated in Figure 5, for all signals in defect zone, the amplitude and the occurrence frequency of the peaks are completely different than those of faultless regions. These changes in signals patterns and shapes may be used to construct mathematical models to relate weldment quality characteristics to the welding signals.
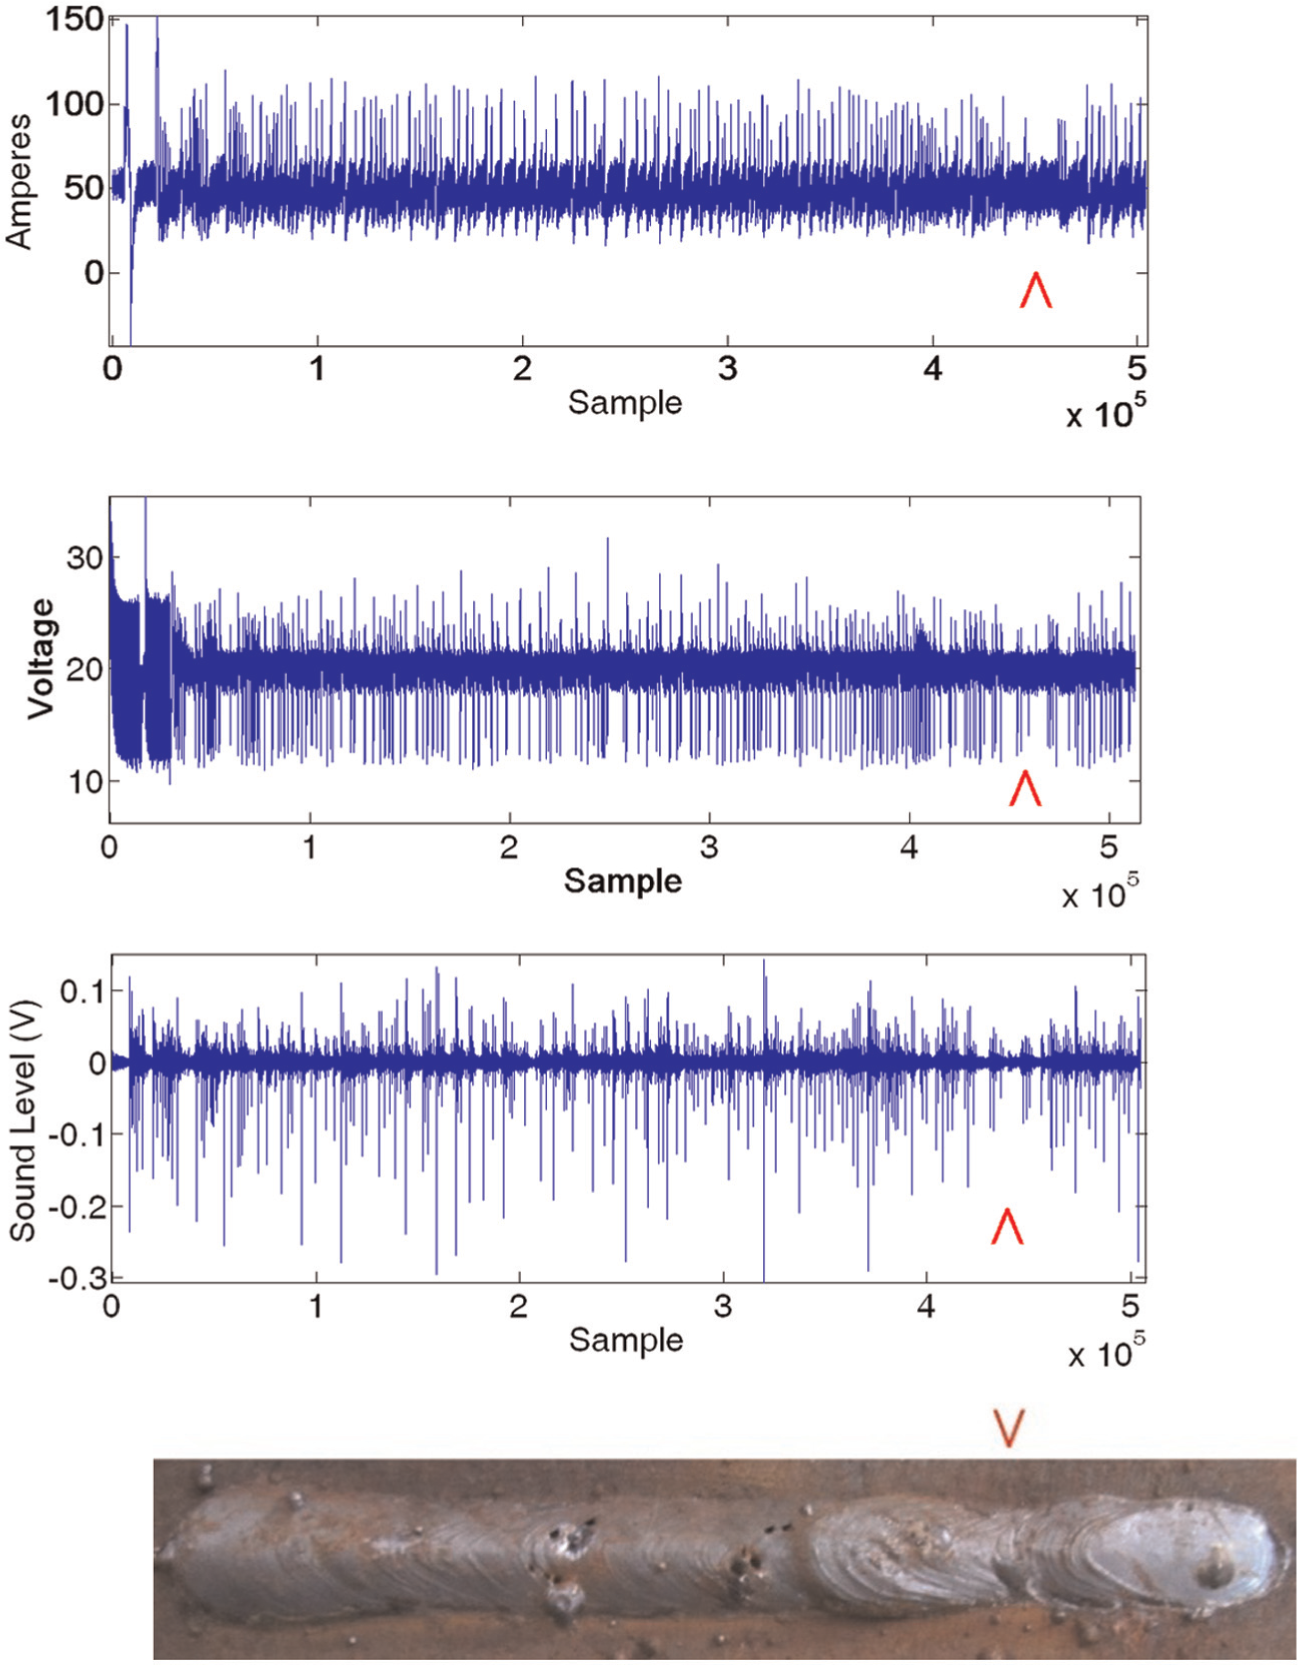
Effects of weld defects on the sound, voltage and current signals patterns.
However, it should be noted that different defects may produce somehow similar patterns on a given welding signal. By the same token, the shape of a given welding signal may not distinctively represent a specific defect. As a result, an individual output signal, by itself, may not conclusively represent a specific weld defect. In Figure 5, for instance, the DS defect has altered all three signals, some of which may be common to other defects. Therefore, to distinguish a specific defect by its signature on the output signals, all these signals should be analyzed simultaneously.
In this study, the welding quality measures are modeled using the statistical characteristics of the sound and electrical signals generated during the process. The behavior of any signal can be expressed by its statistical parameters in the time or frequency domain. Hence, to use the welding signals in mathematical modeling, their statistical parameters have been utilized. Table 3 lists the statistical parameters employed as the model variables in the regression analysis.
Statistical parameters of sound, voltage and current signals (input parameters of regression models).
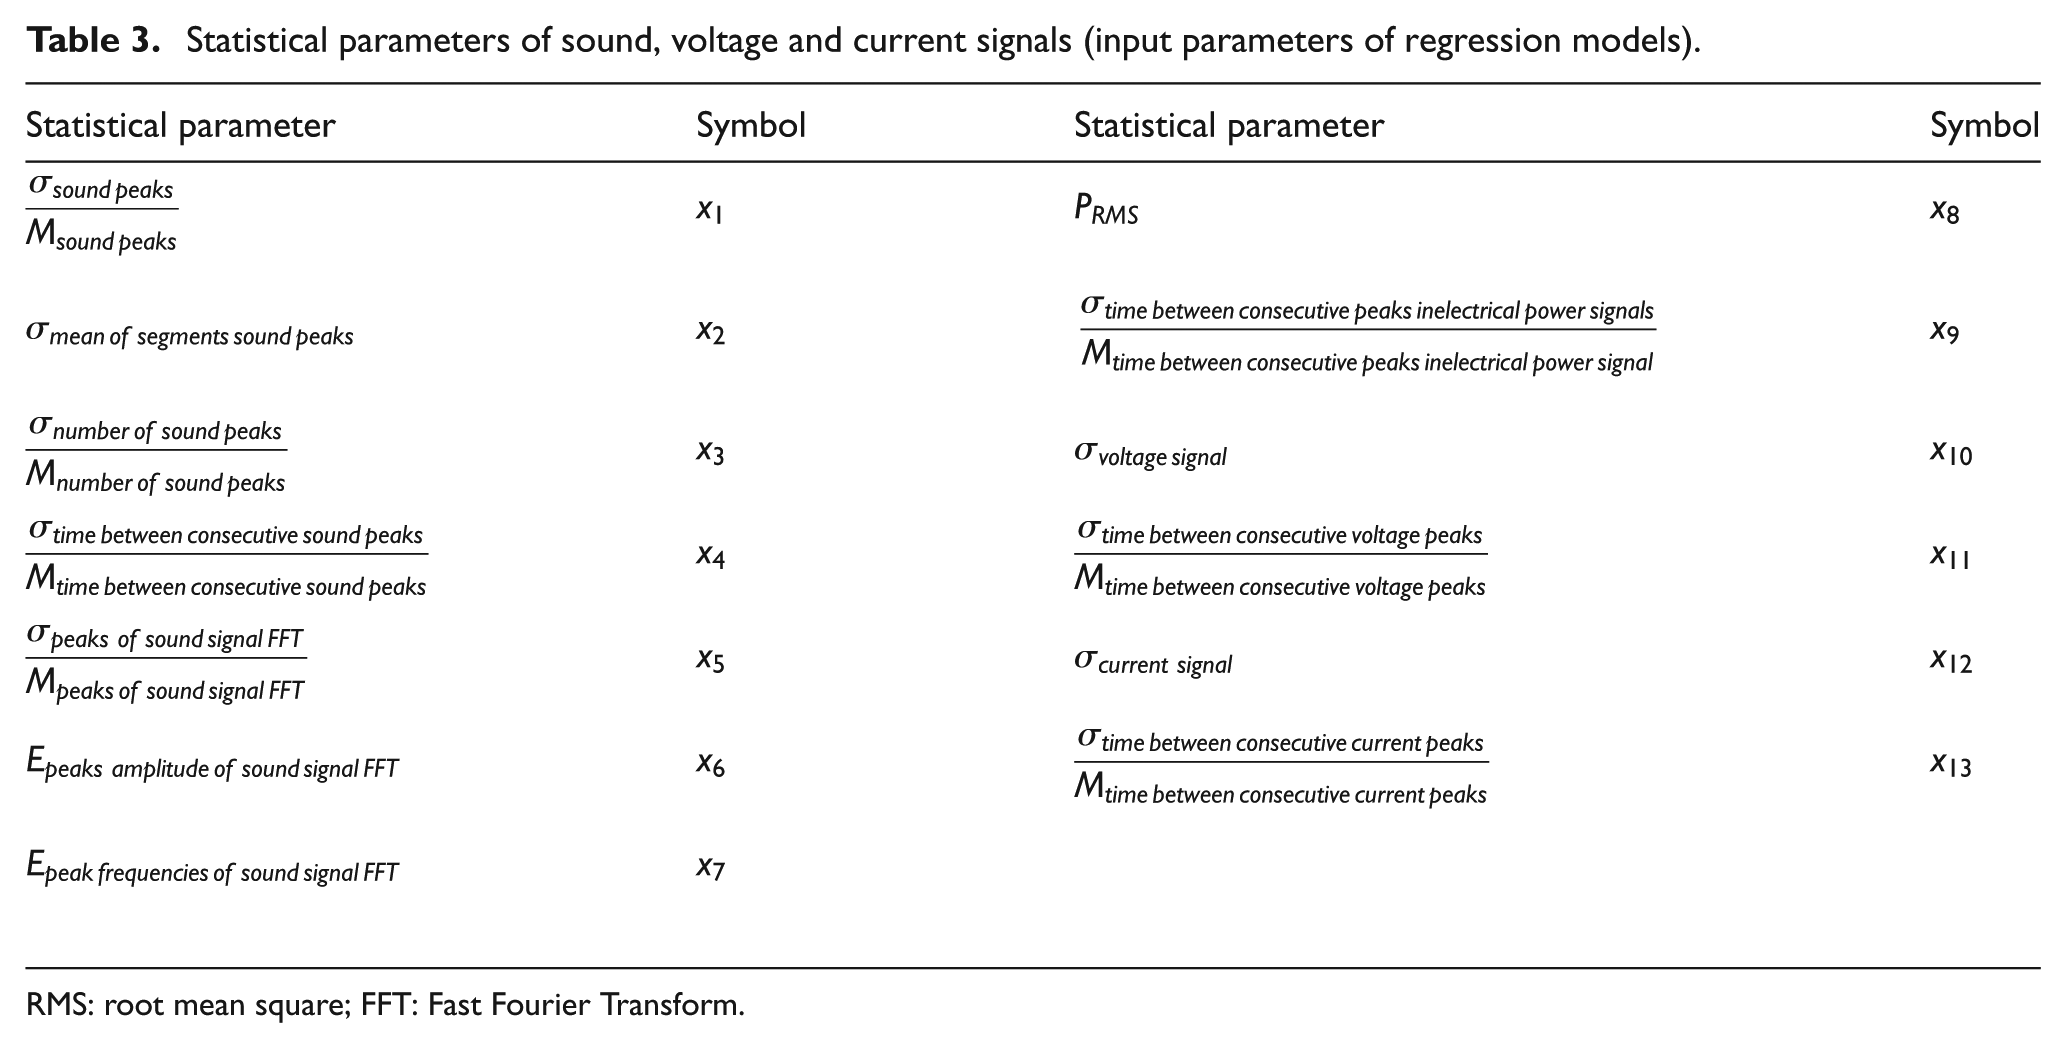
RMS: root mean square; FFT: Fast Fourier Transform.
The quality of the weldment is strongly related to the patterns of the weld signals, especially signal peaks. In this study and by experience, for current and voltage signals, peaks are those signal samples that are 1σ larger than mean amplitude. Similarly, for sound, only those samples that are 3σ larger than mean amplitude are considered to be peaks. Signal peaks are usually caused by arc ignitions and extinctions. With regard to this, the characteristics of signal shapes may be stated by mean values (M) and standard deviations (σ) of peaks amplitudes and the time between consecutive peaks. The statistical parameters used in model developments are therefore based on these measures.
A perfect weld usually has uniform peak amplitude in its sound signals. Sound peaks with larger than normal amplitudes may point to possible defects in the weldment. To account for this, parameters x
1 and x
3 are introduced. As a measure of weld sound uniformity,
Another important indicator of a good welding process is the consistency of the sound along the entire welding path. In other words, to have a stable welding, sound peaks should demonstrate a fairly constant pattern. The sound signal of welding is said to be consistent if its peaks occur within rather similar amplitudes and time intervals. To quantify these characteristics, parameters x
2 and x
4 have been employed. The weld path may be divided into several segments of equal sizes (10 segments for 8 cm of welding path in our case). Then, the average of peaks amplitudes is calculated for each segment. The amplitude consistency of the welding process can now be shown by x
2, which is the standard deviation of the peaks averages of all segments. The similarity of time intervals between consecutive peaks is another important indicator of welding consistency. Parameter
Fast Fourier transform (FFT) is a powerful technique in signal processing that can identify the dominant frequencies of given signal samples. As shown in Figure 6, for instance, dominant frequency band is less than 400 Hz. For x 5, x 6 and x 7, the FFT has been used as follows.
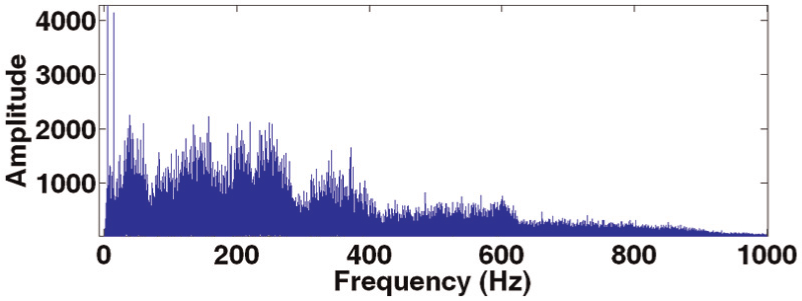
FFT of sound signal.
The x 5 is the ratio of standard deviation to the mean value of peaks in sound signal FFT. It determines the variations in sound signal FFT. In other words, the value of x 5 shows whether there is a dominant frequency band in the sound signal or not. If one approximates the sound signal FFT as a continuous curve, the coordinates of its center of area, defined by x 6 and x 7, are the mathematical estimated values for frequency and amplitude, respectively. Together, x 6 and x 7 reveal the approximate values of the dominant sound signal frequency and its intensity (Figure 7).
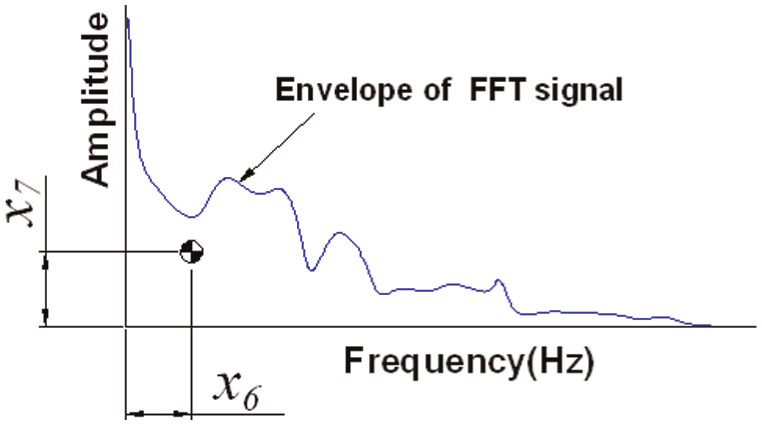
Center of area for FFT signal envelope.
To account for the power consumption,
In summary, the statistical parameters used for sound signals (x 1 to x 7) explain the pattern and amplitude of arc ignition and extinction. Likewise, the statistical parameters defined for electrical signals delineate the amount and the distribution of energy consumed during the welding process. Together, through regression modeling, they could provide comprehensive information about the quality of the process and the likelihood of presence of defects in the welded joints.
Model development
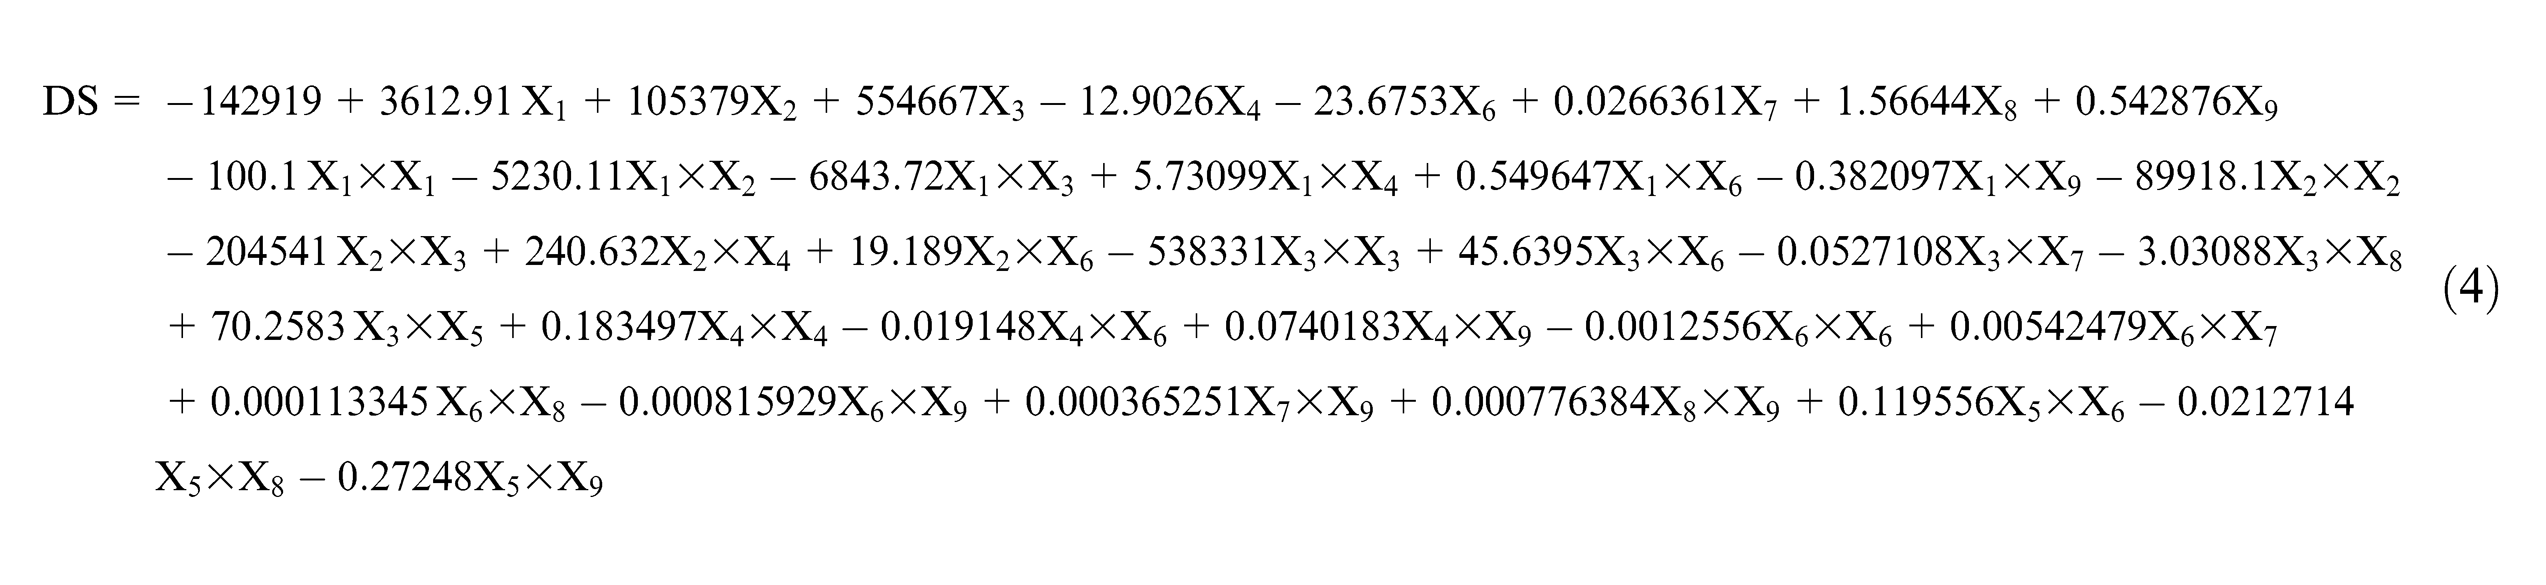
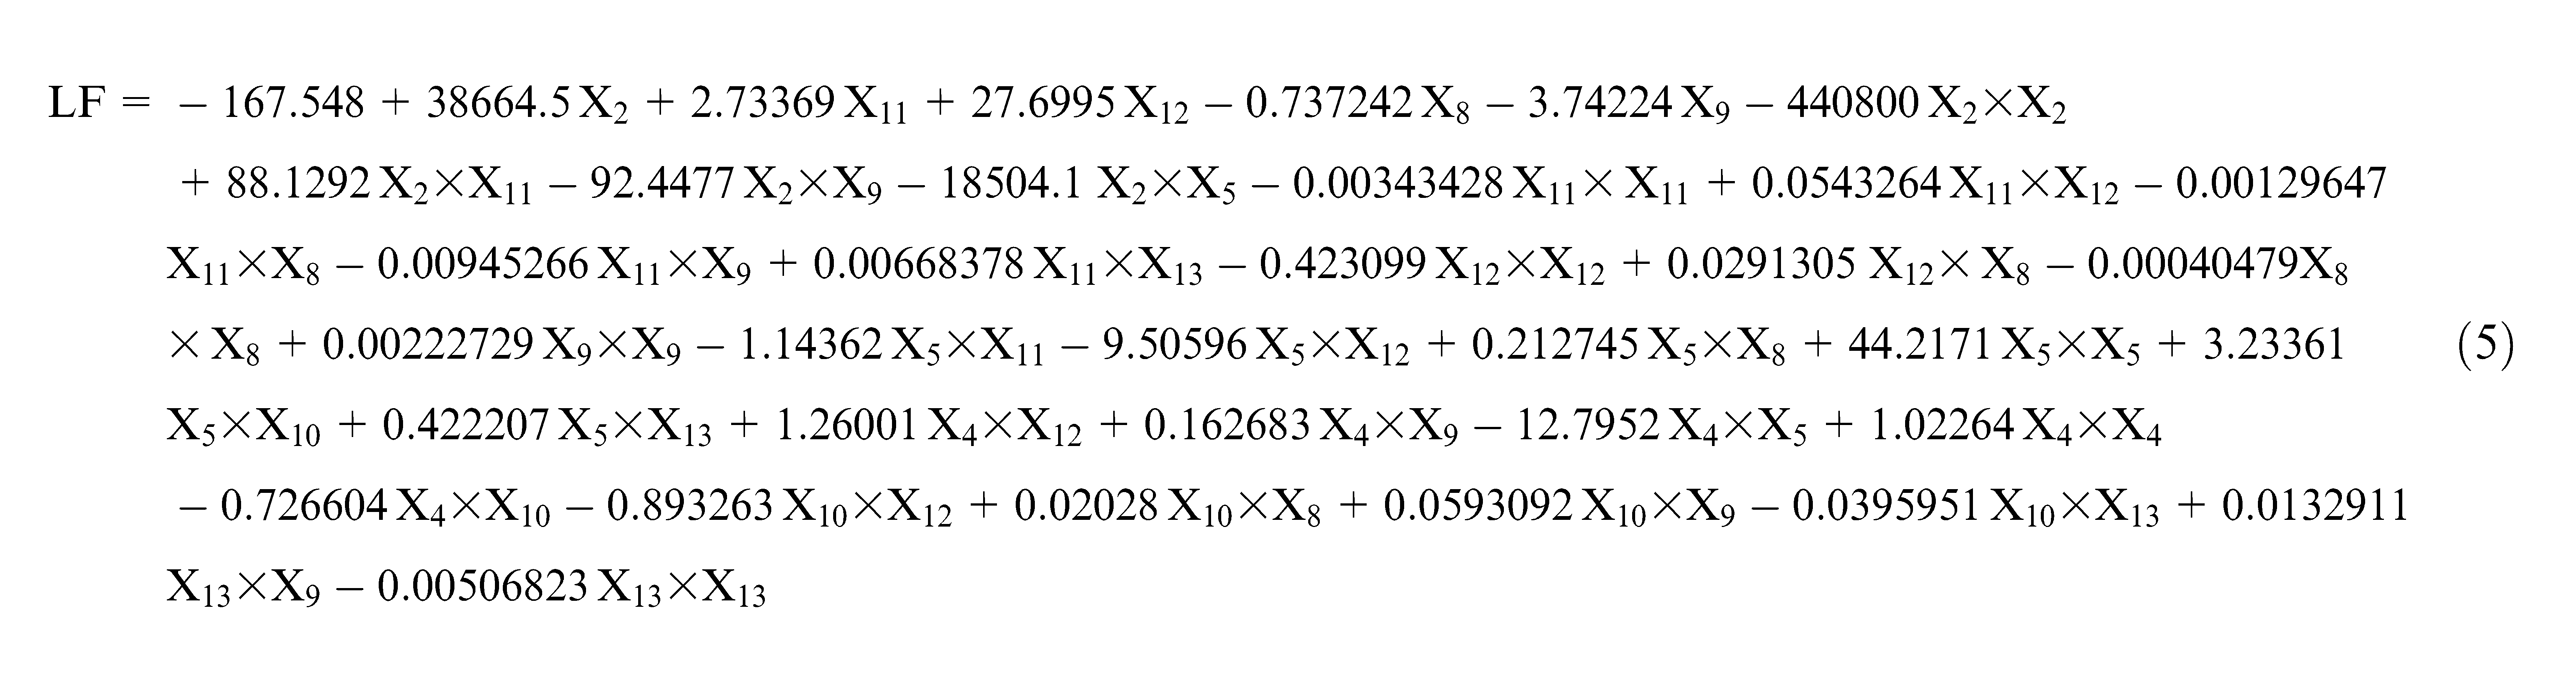
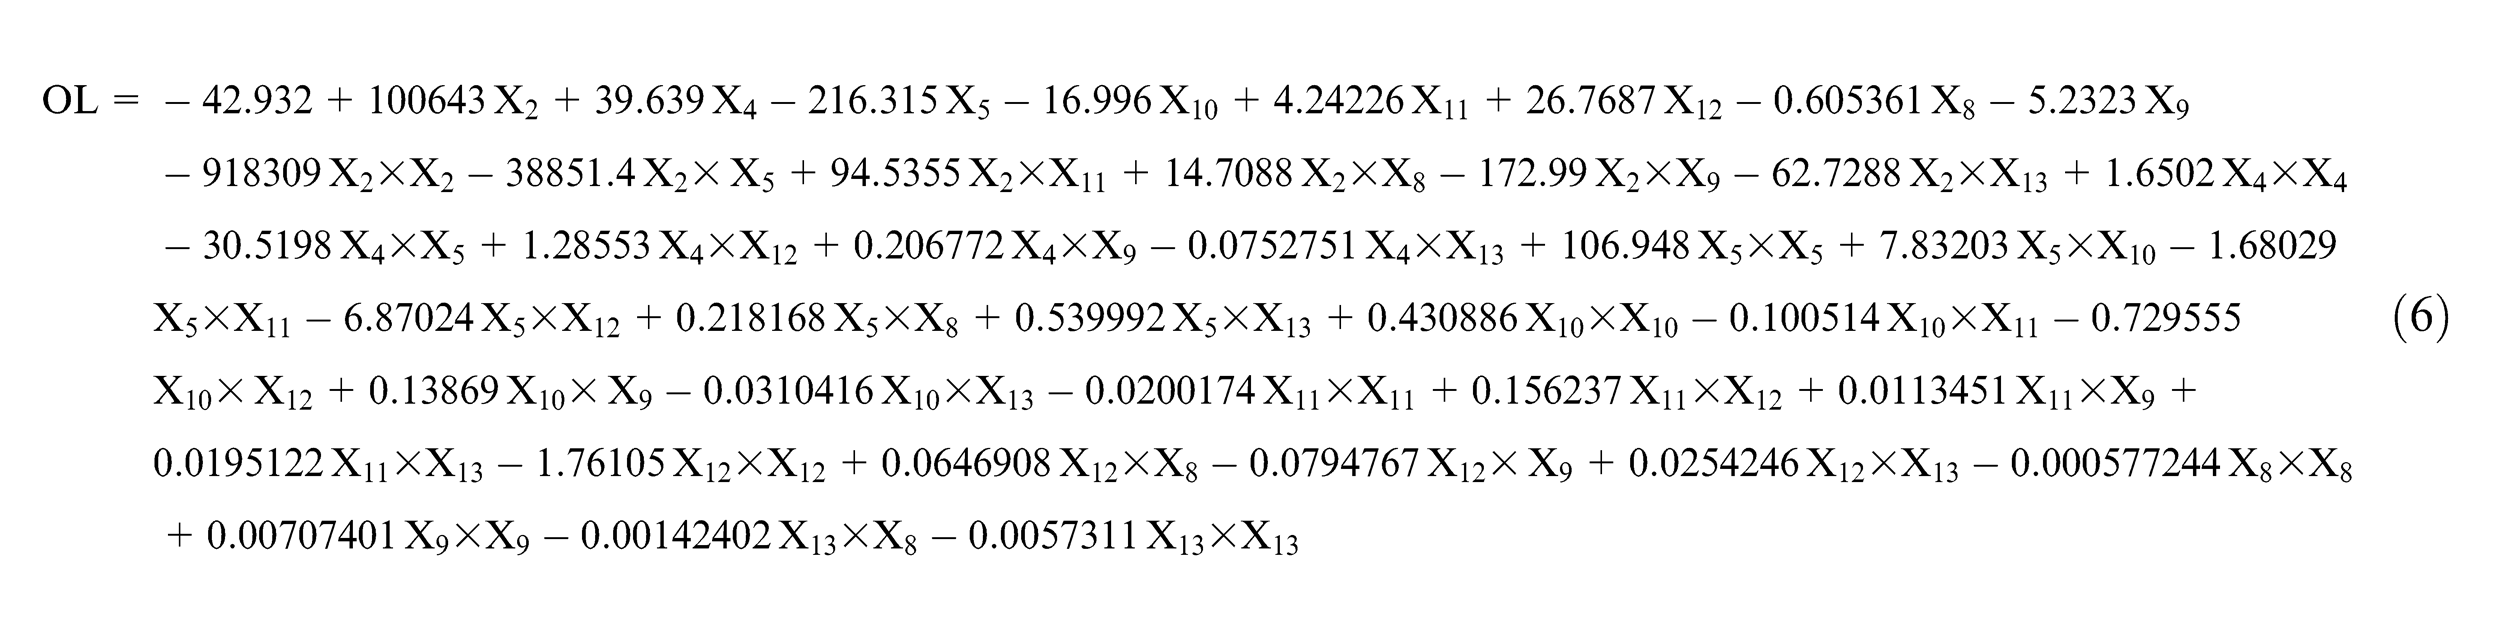
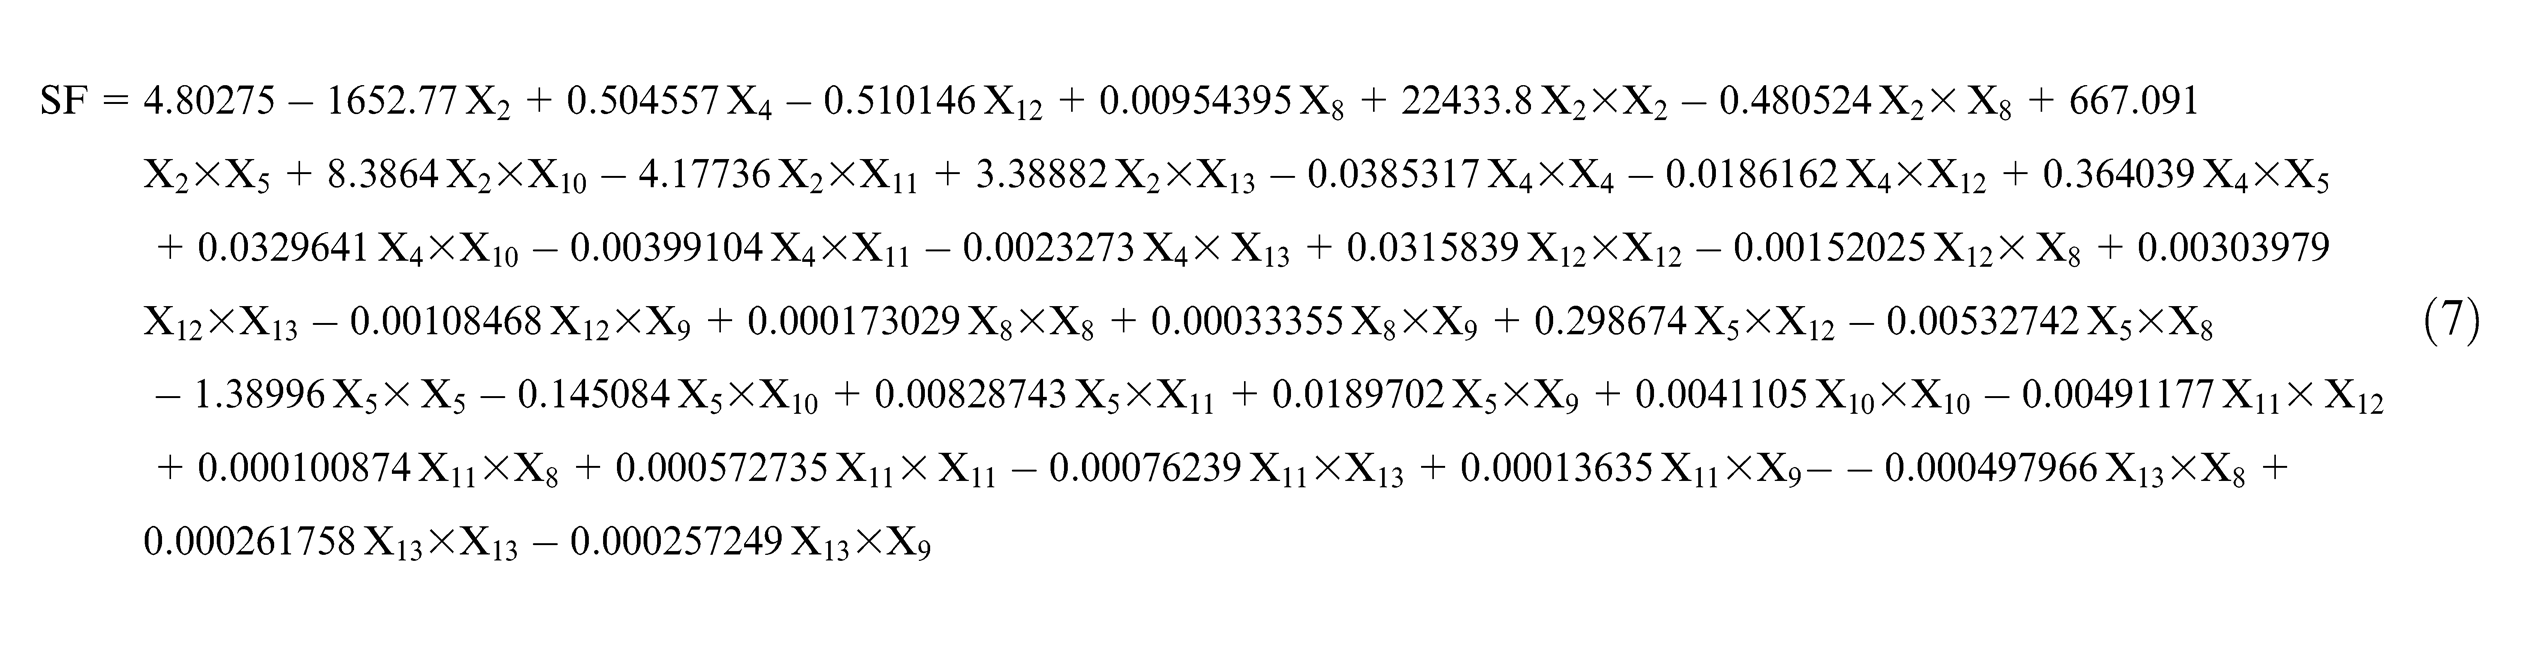
In this study, four output characteristics in GMAW process have been considered in process modeling. These parameters include the most prominent visual defects (DS, LF and OL) as well as the shape factor (the ratio of height to width of the weld bead). Together, they could be used to evaluate the quality of the welded joints. To develop the mathematical models, three regression functions—linear, curvilinear and logarithmic function—have been fitted to the values of the above-mentioned statistical parameters. Equations (1)–(3) show the general forms of the regression functions
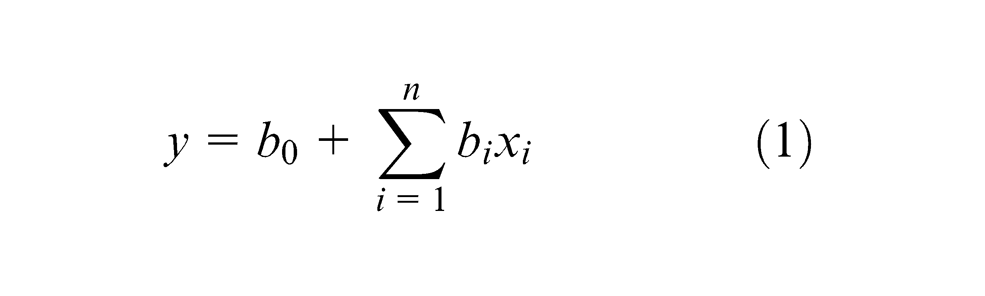
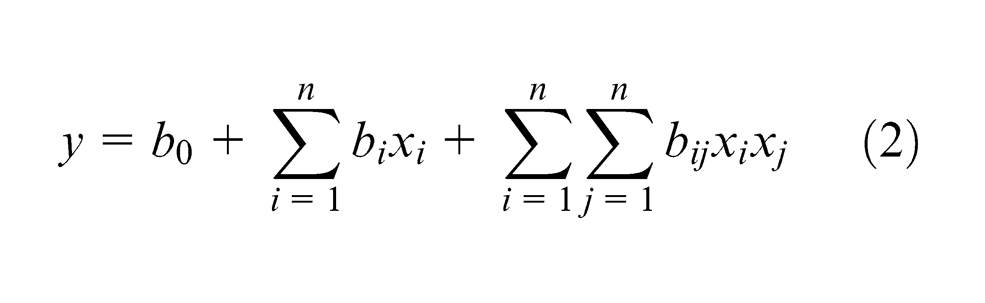
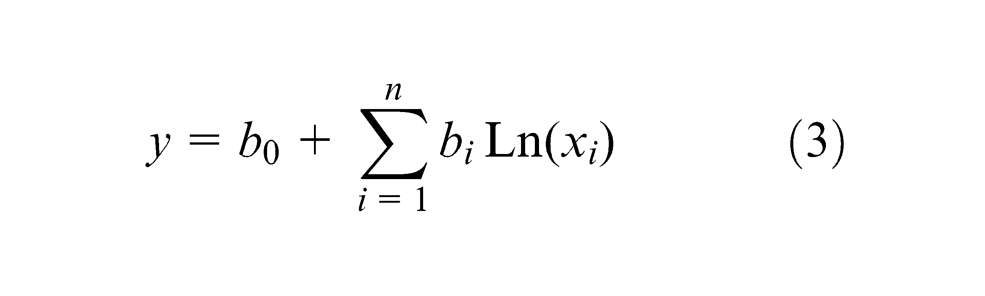
In the above formulas,
The adequacies of the proposed models are verified based on analysis of variance (ANOVA) results and normal probability plots of residuals. ANOVA determines the adequacy of regression models considering the coefficients of significance (P-value and F-value). The P-values, F-values and correlation factors of curvilinear models are listed in Table 4. As shown, the P-values of all model are less than the selected confidence level of 5% (α level = 0.05). Also, the F-ratios of the models are much higher than their corresponding standard critical values.
P-values and correlation coefficients for curvilinear models.
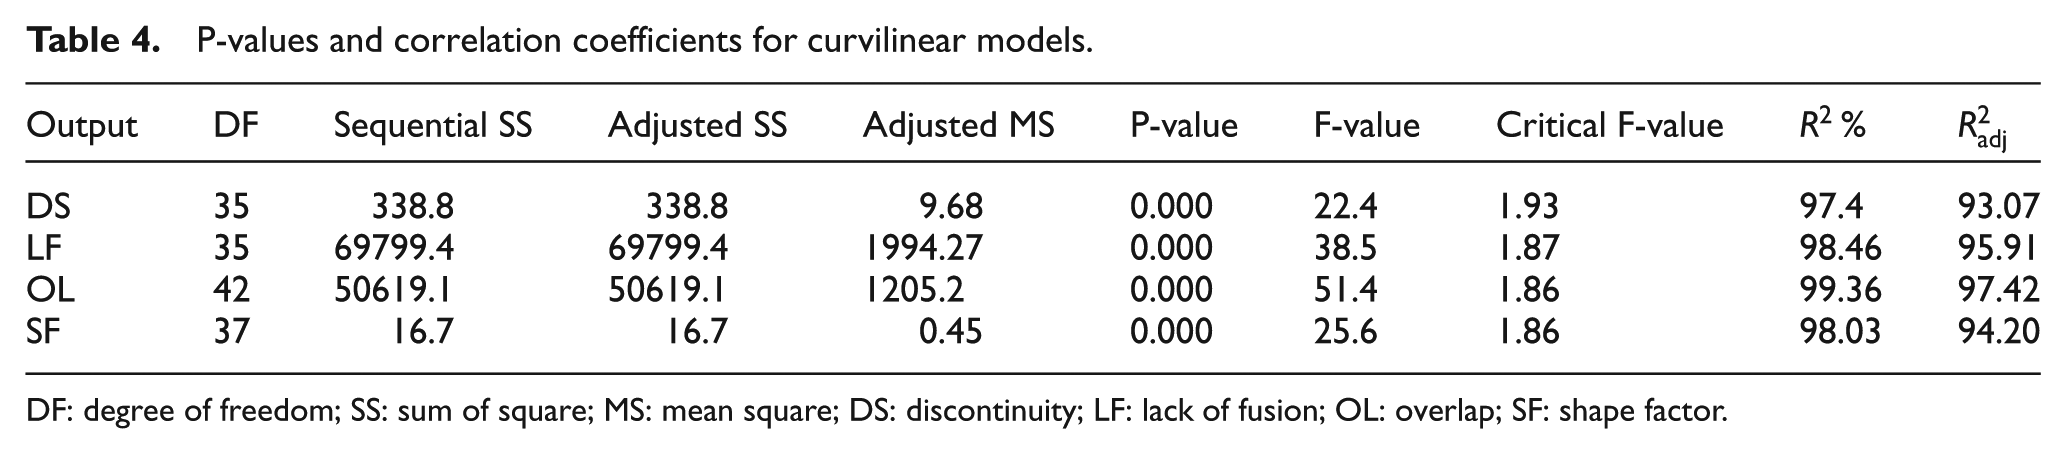
DF: degree of freedom; SS: sum of square; MS: mean square; DS: discontinuity; LF: lack of fusion; OL: overlap; SF: shape factor.
The adequacies of the derived models have also been investigated by checking the normal probability plot of residuals. For this check, if the residuals are normally distributed, the corresponding model is considered adequate. In this case, the plotted points in probability plot of residuals generally form an approximate straight line. As illustrated in Figure 8, the residuals of all models are spread around a straight line within the confidence band of 5%.
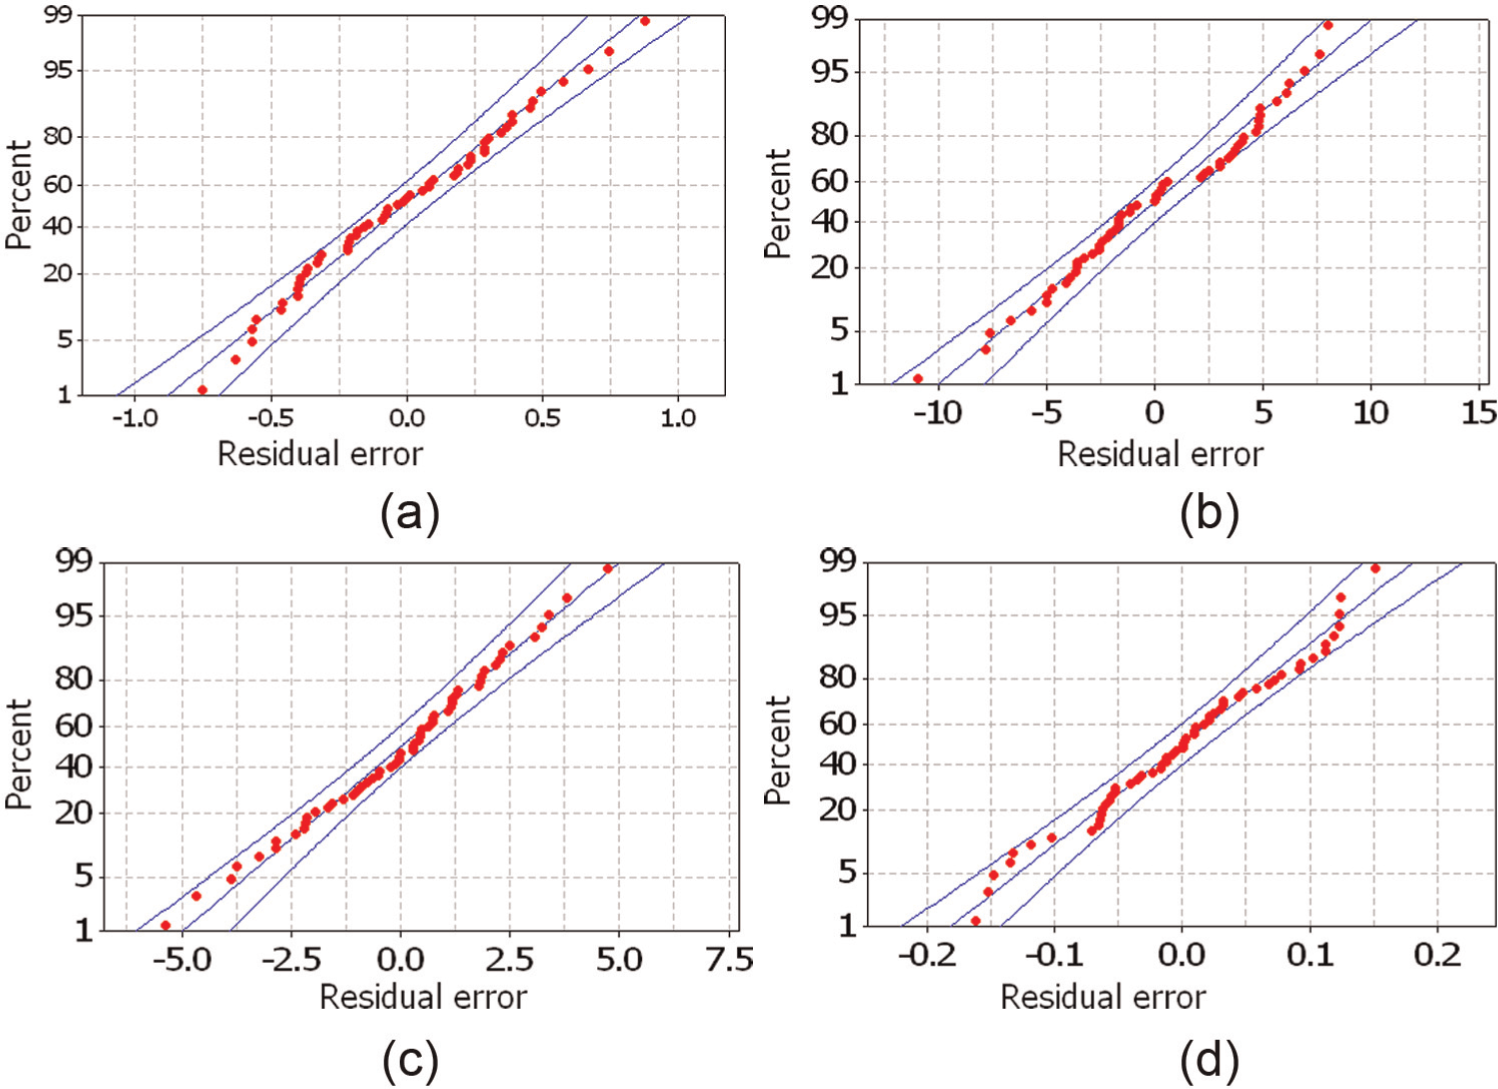
Normal probability plots of residuals for the proposed models: (a) discontinuity, (b) lack of fusion, (c) overlap and (d) shape factor.
Moreover, the fitness of the proposed models is investigated based on correlation factors,
The closeness of
Experimental validation of the developed models
To further investigate the accuracies of the proposed models in predicting process outputs, 10 more experiments (in addition to the 57 DOE experiments) have been carried out. In Table 5, the first four columns list the input parameter settings for validating tests, while in the last four columns, the measured process output values are shown.
Validating tests (inputs and outputs).
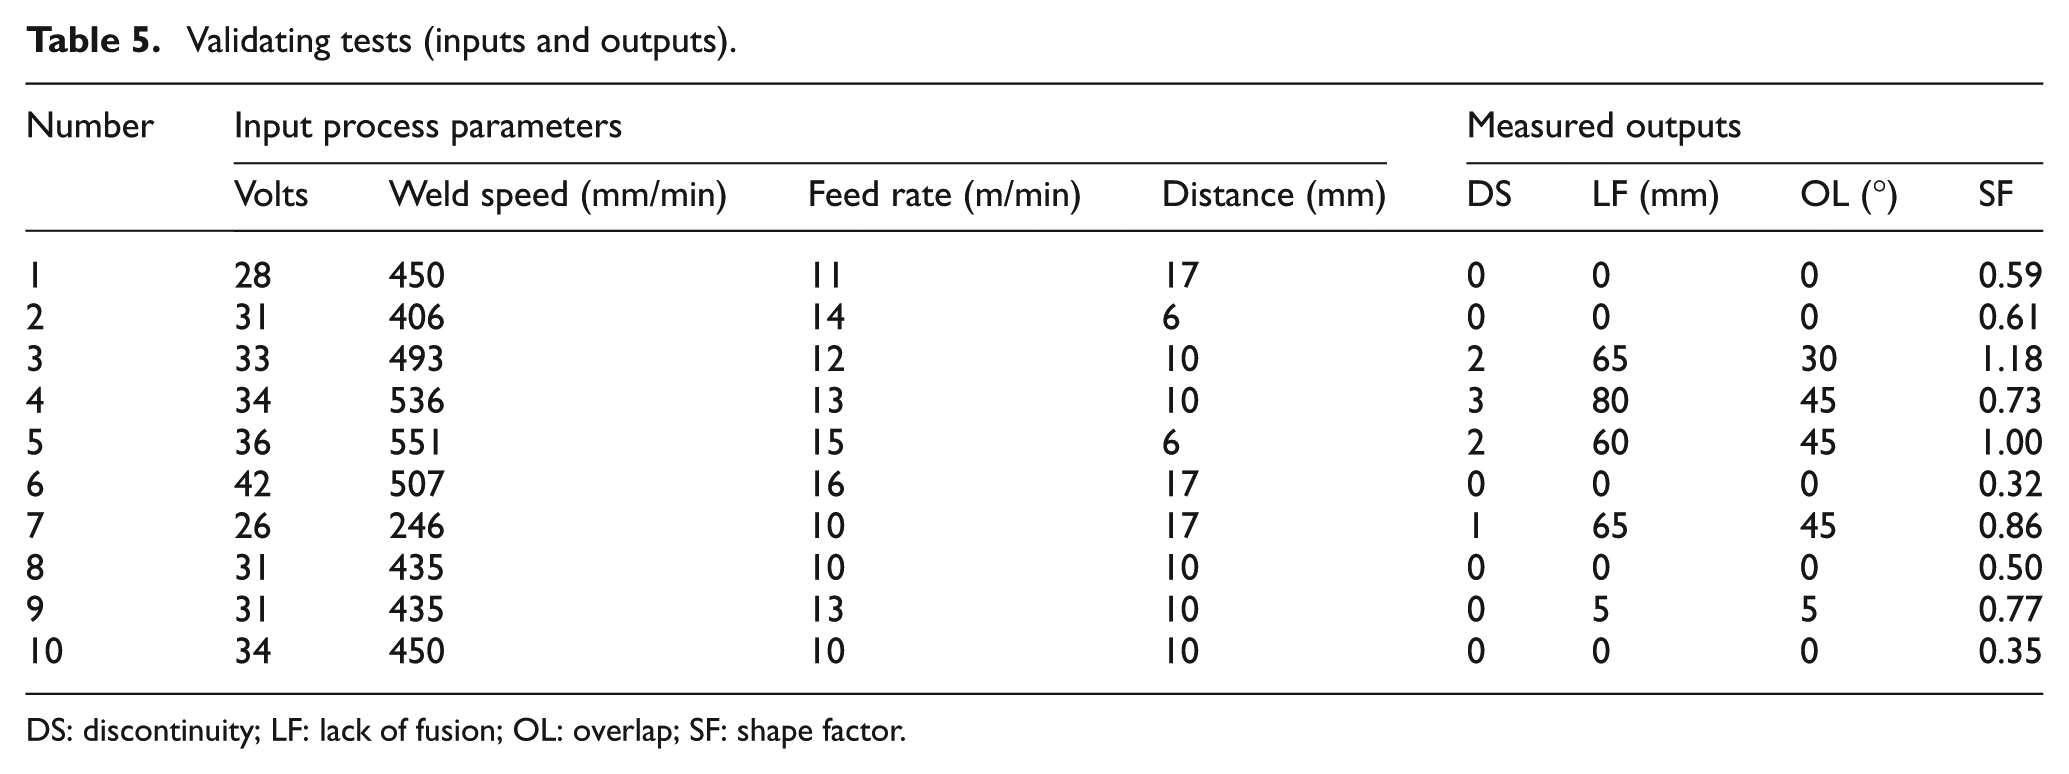
DS: discontinuity; LF: lack of fusion; OL: overlap; SF: shape factor.
The experimental results from validating tests are compared against those predicted by regression models. The comparison results are schematically illustrated in Figure 9. As shown, the predicted values closely follow the real measured data.
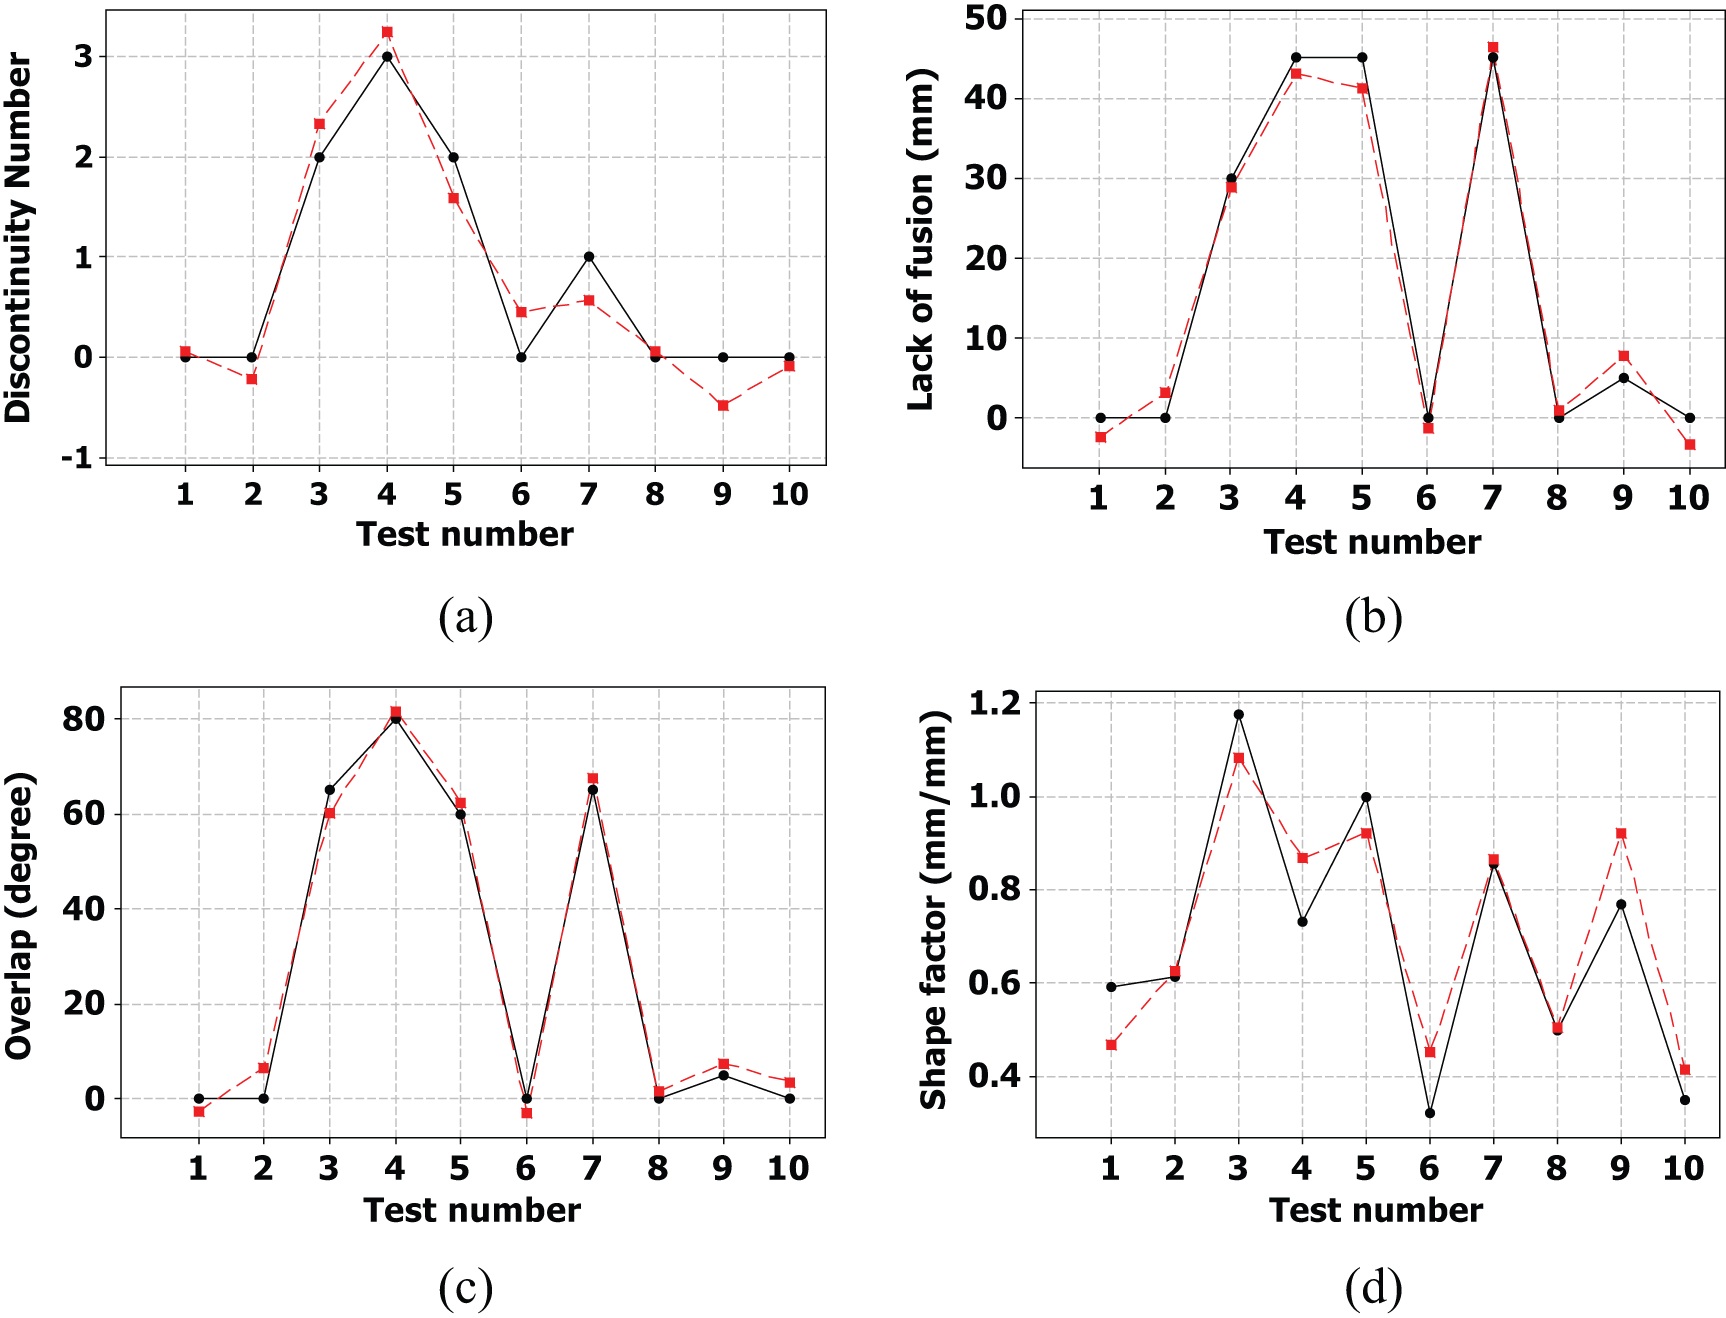
Measured and predicted values of weld quality parameters. (a) Discontinuity (b) Lack of fusion (c) Over lap (d) Shape factor.
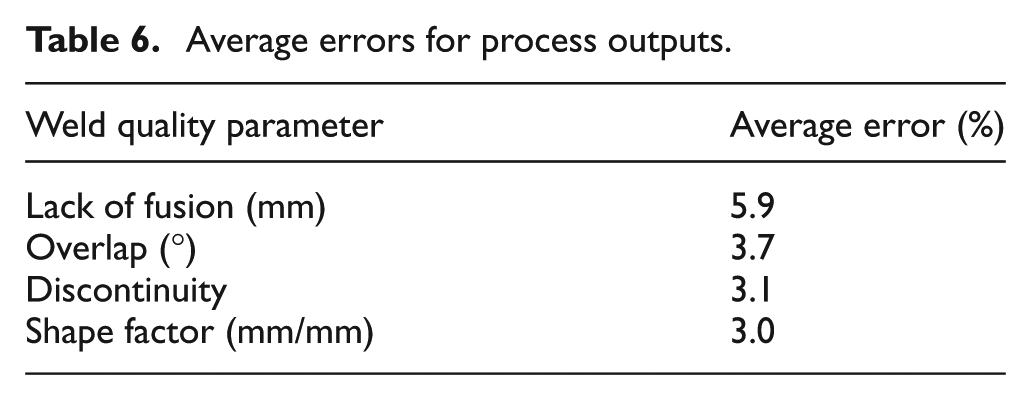
The average errors for the four output measures are given in Table 6. The maximum average error of 5.9% belongs to LF, while for the shape factor, there is only 3% difference between the predicted and the actual values. This proves that the proposed models are quiet effective and accurate in predicting the four main weld quality measures. The proposed model can be substituted as the actual GMAW process in future studies such as optimization of the process parameters and online control of process input parameters.
Average errors for process outputs.
Considering ANOVA tables of presented models verifies that the most affecting parameters for DS and OL models are related to the sound signals, which generally represent the characteristics of arc ignitions and extinctions. Likewise, the affecting parameters for LF and SF models are related to the electrical signals, which correspond to the amount and distribution of input heat to the welding pool.
Conclusion
In most welding processes, the quality of the joints may be measured on the basis of the welding defects and the geometrical characteristics of the weld bead. In the past, many studies have tried to relate the quality of the welded joint to the welding sound and electrical signals. Nevertheless, most current studies are qualitative and do not address this problem using quantitative models. Hence, the results are mostly based on the observations of the signal’s characteristics to determine the stability of the arc or to predict possible defects in the weldment.
In this study, an attempt is made to develop a set of mathematical models to establish the quantitative relations between the most prominent GMAW sound and electrical signals to the joint quality specifications. The weld process outputs considered here include SF and three types of weld defects: DS, LF and OL. These features may be assessed visually, and destructive and/or non-destructive tests have not been employed. The merit of this work is that the statistical values of online welding signals (sound, voltage and current) have been used to develop more accurate models. The approach presented in this research shows that the statistical parameters of sound, voltage and current signals may adequately represent the output characteristics of the GMAW process.
To collect experimental data needed for modeling, 57 welding tests were performed based on D-optimal design. For each specimen, sound, voltage and current signals were recorded during the welding. Then, 13 statistical parameters of these signals have been calculated and used in regression modeling. Based on ANOVA results and for 95% confidence interval, curvilinear function proved to be the best and the most fitted models for all four outputs. The proposed models were also verified using additional experiments. The comparisons between the actual and the predicted values reveal that the proposed models are quite accurate in predicting GMAW process outputs and the collective behaviors of these signals are highly correlated to the quality of the welded joint. In further studies, the proposed models may substitute the actual process. In this way, the need for performing additional time-consuming and costly experiments may be avoided.
It is worth mentioning that the four quality measures considered in this research may not be sufficient to conclusively describe the overall quality of the weldment. For instance, the changes to the microstructure of the weldment and HAZ may significantly affect the quality of the welded joints.17–19 Therefore, considering other quality measures, such as the microstructure of the weldment and in-depth defects, in process modeling could be interesting topics for future researches. Using welding signals to optimally determine process parameter settings and for online process control may be some other extensions to the present work.
Footnotes
Declaration of Conflicting Interests
The author(s) declared no potential conflicts of interest with respect to the research, authorship, and/or publication of this article.
Funding
The author(s) received no financial support for the research, authorship, and/or publication of this article.