
Abstract
In gas metal arc welding, like other welding techniques, the quality of welded joint may be described in terms of weld bead geometry and the presence of welding defects. In turn, the characteristics of welding signals, such as voltage, current and sound, may be used to predict and improve the quality of welded joint. In this work, two sets of adaptive neuro-fuzzy inference system have been used to predict and improve the weld quality characteristics. The required data for modeling were obtained from 57 experiments based on D-optimal design of experiments. The first set is developed to predict the possible welding defects (discontinuity, lack of fusion and overlap) and shape factor of the weld bead. These “predicting adaptive neuro-fuzzy inference system models” have been developed using 13 statistical parameters of the sound, voltage and current signals. The objective of the second set of models, called “improving adaptive neuro-fuzzy inference system models,” is to adjust the input welding parameters in such a way that the weld defects are minimized. These models simulate the experiences of professional human welders as the learning databases. Verification tests reveal that the proposed predicting adaptive neuro-fuzzy inference system models can accurately estimate the main weld quality indices in actual gas metal arc welding process. Moreover, experimental results for improving the adaptive neuro-fuzzy inference system models confirm that the defects of faulty weldment can be eliminated after applying the process parameters settings given by these models. The proposed adaptive neuro-fuzzy inference system models may pave the way in assisting the human welder to predict and enhance the weld quality characteristics.
Keywords
Introduction
The gas metal arc welding (GMAW) process is extensively used for mass production of a variety of metal parts. The experience of welding operators is an important factor for adjusting the input welding parameters to have a high-quality welded joint. But, dependency of welding quality to the human operator skills, sometimes, may make non-uniformities or mistakes in the mass production.
The objective of this study is to decrease the operator dependency of GMAW process in the fault detecting of the welded joints and adjusting the input welding parameters. This is a way to minimize the operator mistakes in the welding process by employing the human welder experiences in the intelligent models.
Defects and geometry of weld bead are two important indicators of weld quality. Welding signals, such as sound and electrical signals, contain a large amount of useful information about the weld quality.1–3 On the other hand, the characteristics of these signals are directly affected by input parameter settings, such as voltage, feed rate, welding speed and electrode-to-work piece distance. Hence, the welding signals may be utilized to correlate the input welding parameters setting to the weld quality state.4,5 This relationship may then be used to adjust the settings of input welding parameters to improve the quality of welded joints.
There are broad researches about the welding signals and their characteristics. Generally, they investigate the relationship between welding signals and input welding parameters. Arata et al. 6 were among the pioneers who have studied the relationship between the welding sound signal and input welding parameters. Cudina et al. 7 have showed that the welding sound power can be calculated by the welding current. They have believed the arc ignition and extinction as well as the arc ionization are the two main sources of generating weld sound. Wang et al. 8 have reported that acoustic signal of gas tungsten argon welding (GTAW) process of aluminum is strongly affected by the input welding parameters. Based on the Fourier transforms and recursive least square method, they have developed mathematical models to state the relationship between welding power and sound.
Some researchers have focused on the relationship between welding signals and some welding output specifications, such as defects, strength or other characteristic of welded joints. It has been shown that analysis of welding sound signal in time domain may be more obvious in detecting defects than frequency domain. 9 Welding penetration as an output parameter of welding process may be estimated by the features of welding sound signal. 10 For friction stir welding process, Senthilkumar et al. 11 studied the correlations between the tensile strength of the joints and the sound signal parameters.
In the welding process, the transferring of molten mass to the work piece may be in three different modes: short circuit, globular and spray. These transference modes are different in droplet size and its rate of transfer. Each of transfer modes may be determined by the statistical characteristics of welding signals. Cayo and Absi Alfaro 12 have used some of the main statistical parameters of the sound pressure level spectrums, such as mean value, variance, standard deviation and number of pulses per second to determine the transference mode during the welding process. Poopat and Warinsiriruk 13 have specified the weld transfer mode based on the values of sound level and frequency of sound peaks.
Stability of weld arc is another criterion to have fine joints. Grad et al. 14 have studied the effects of the input welding parameters on the arc stability. They have concluded that the welding process is more stable in higher frequencies of molten mass droplets. Roca et al. 15 have proposed a welding stability measure using standard deviation of acoustic peak amplitude and time intervals between peaks.
The microstructure of welded joint affects the overall quality and strength of the joint. In this regard, Grujicic et al.16,17 have proposed thermal–mechanical coupled model combined with the physical–metallurgy concepts to predict the distribution of crystalline phases within the as-welded microstructure. This procedure has been applied to the low-carbon steel AISI1005 and high-hardness armor-grade MIL A46100 martensitic steel. In an improved analysis, for GMAW process, comprehensive multi-physics computational model has been presented by Grujicic et al. 18 The model has been applied to the butt-welding of MIL A46100 in order to predict the microstructure evolution and the local properties of the fusion zone (FZ) and heat affected zone (HAZ).
Some researchers have used the soft computing strategy to develop models for welding output parameters. Recently, Liu et al.19,20 have addressed the dynamic estimation of the weld penetration in GTAW process. They have developed a nonlinear dynamic adaptive neuro-fuzzy inference system (ANFIS) to estimate the weld penetration by measuring the back-side bead width. Later on, they utilized the proposed ANFIS model to develop a linear predictive controller for adjusting the weld penetration specified by back-side bead width. 21 They have completed their research by developing an iterative local ANFIS model-based data-driven approach to control an automated GTAW process. 22
Kovacevic and Zhang 23 have developed a neuro-fuzzy system to control the fusion state by estimating the back-side and top-side weld bead of pool geometry. Manikya and Rao 24 developed a back propagation neural network model for the prediction of weld bead geometry in pulsed GMAW process. Dhas and Kumanan 25 proposed an ANFIS model to predict the weld bead width in the submerged arc welding (SAW) process. Nele et al. 26 have utilized the neuro-fuzzy modeling approach to provide adaptive control of GMAW input process parameters’ adjustment and predict final weld joint characteristics.
Most of these studies do not specifically concentrate on predicting and improving the quality of the welded joints by means of welding signal features. The analysis of in-process welding signals including sound, voltage and current signals in the time and frequency domain will be useful for these purposes. These signals should be simultaneously considered in order to have an accurate representation of the weld quality since each of which has certain information about the weld quality which may not be shown by the others.
The present work may be divided into two main parts. In the first part, ANFIS called “predicting models” have been proposed to relate the most important weld quality measures to the main GMAW output signals. The quality measures consist of the three most important visual defects, lack of fusion (LF), overlap (OL) and discontinuity (DS) as well as the bead shape factor (SF). These models would predict the four mentioned weld quality indices according to the three welding signals. The predicted weld defects will be corrected by another set of ANFIS models named “improving models” which is developed in the second part of the article. The inputs of these models are the outputs of the predicting models, while the outputs are the adjustments to the welding parameters so as the predicted defects are eliminated. The training databases for these models consist of the corrective adjustments in the input welding parameters for faulty welds to make them flawless. These databases may be prepared based on the experiences of the professional welders.
Experimental methods
In this work to construct the required databases for ANFIS learning, experimental tests have been performed based on D-optimal method of design of experiment (DOE) approach. D-optimal maximizes the determinant of the information matrix. In this way, the corresponding design table is a subset of full factorial experiments. The merit of D-optimal is that it could provide large amount of useful information about the system under study with minimal number of actual tests. In addition, the design matrices may be non-orthogonal and the process parameters can be correlated. 27
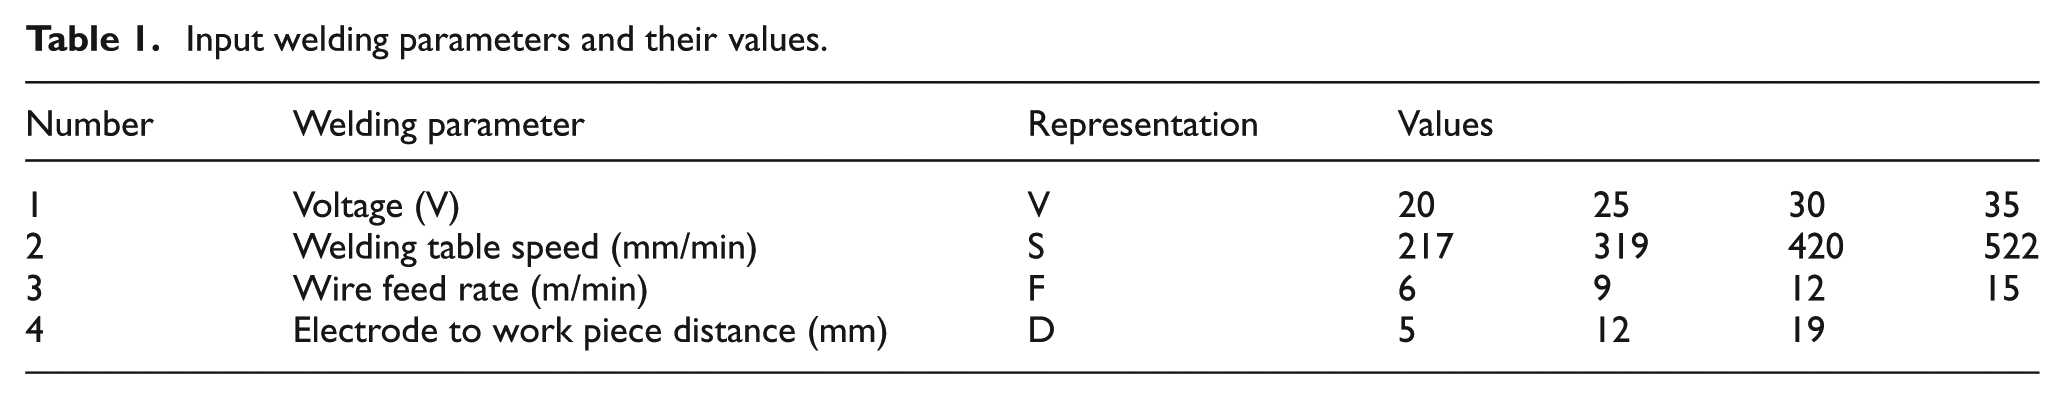
The input welding parameters in this study include voltage, welding speed, wire feed rate and electrode to work piece distance. The first three parameters are considered at four levels while the last one is set at three levels. Table 1 lists the input parameters and their corresponding levels used in DOE table.
Input welding parameters and their values.
Based on the D-optimal method, a total of 57 experiments are required for modeling procedure (Table 2). For each test, the output signals have been recorded and the corresponding statistical parameters computed. These statistics are then used as the input variables of the predicting models.
Design of experiments table.
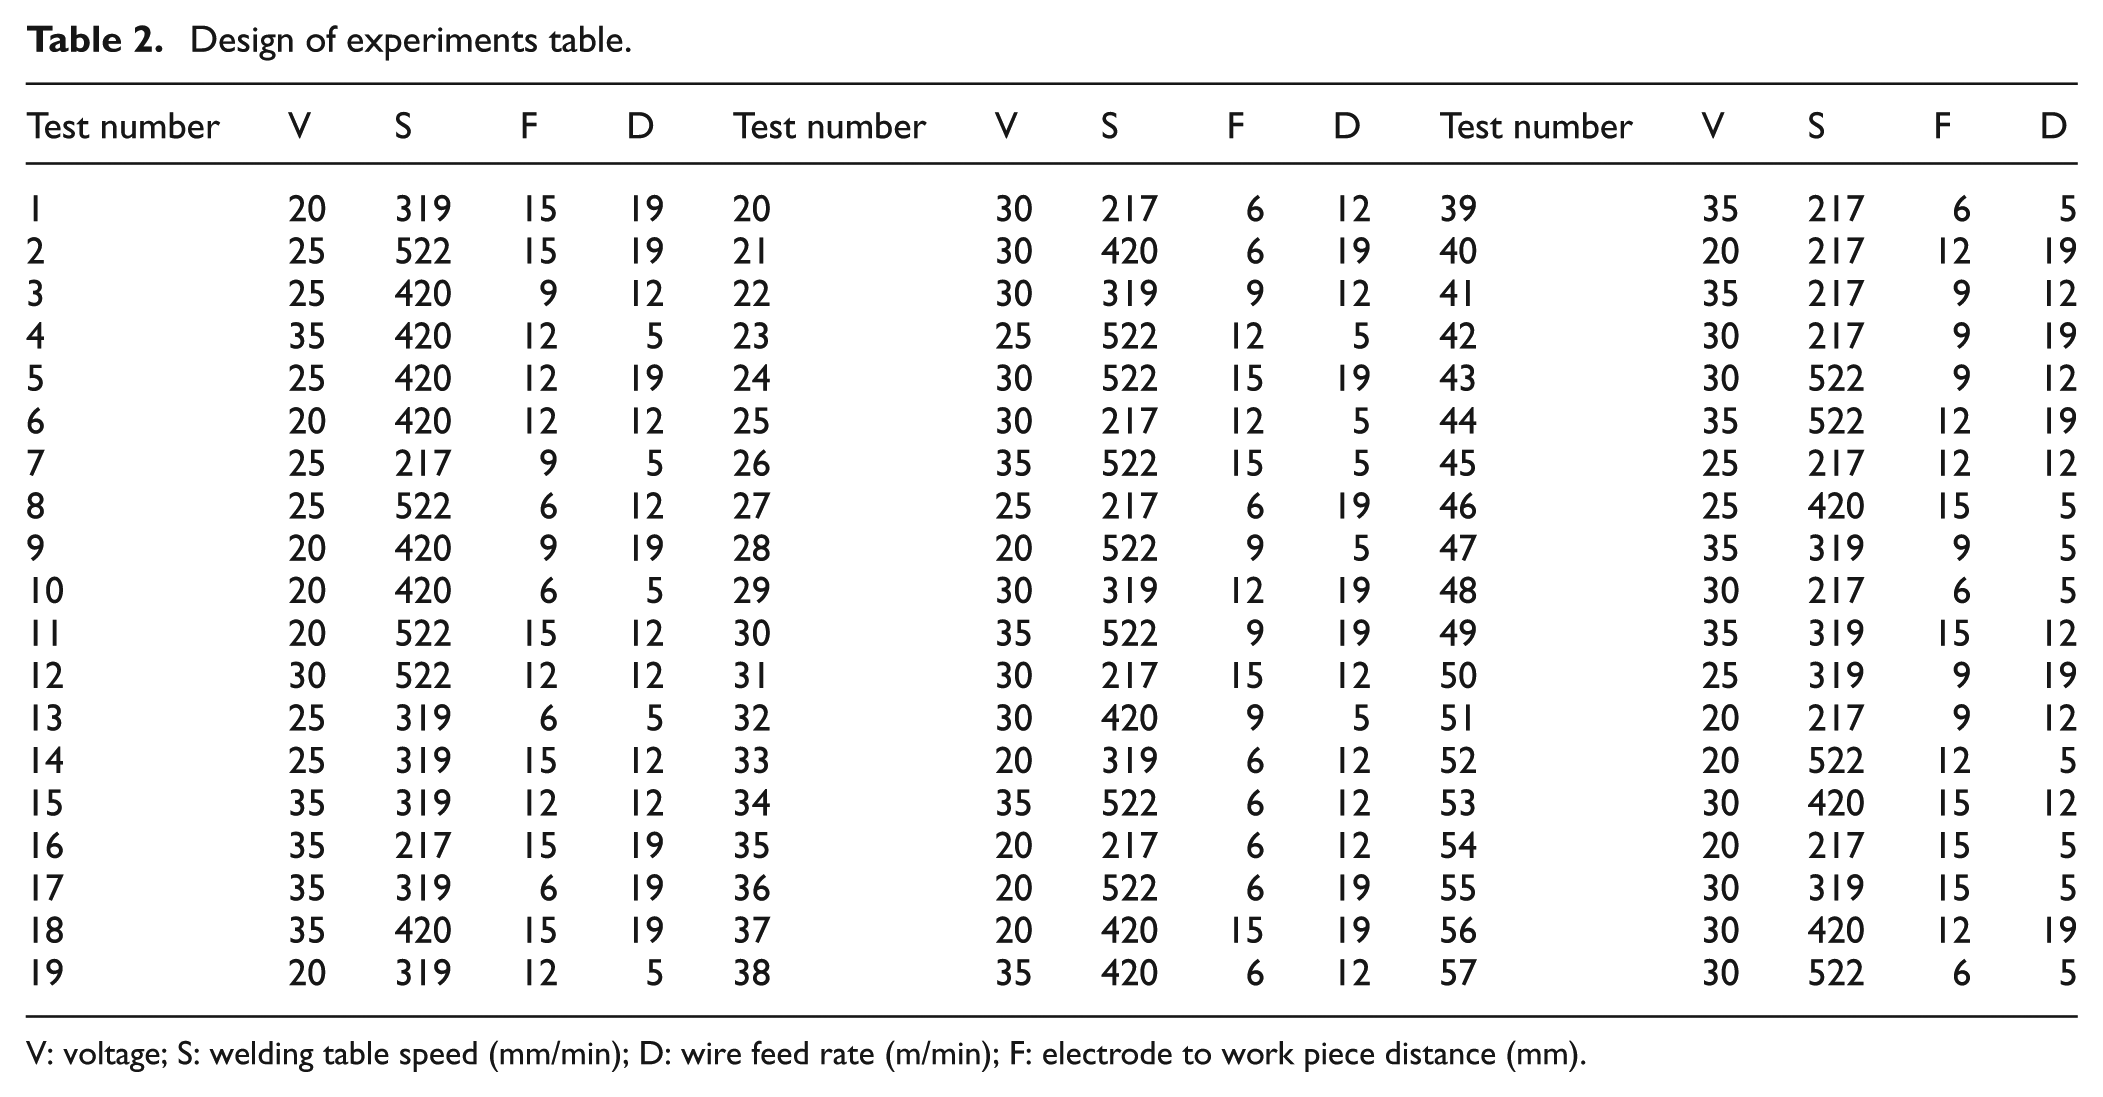
V: voltage; S: welding table speed (mm/min); D: wire feed rate (m/min); F: electrode to work piece distance (mm).
All experiments have been performed using the apparatus illustrated in Figures 1 and 2. A Pars-MIG-SP501 welding machine with constant static voltage was used. The filler wire electrode was a 1-mm diameter mild steel. The shielding gas composed of a mixture of 80%Ar and 20%CO2. The test specimens were selected from API 5LX42 plates with dimensions of 150 mm × 50 mm × 5 mm. The surface of the work pieces was cleaned by sand blasting process. For each test, the total length of the welded joint was 10 cm out of which the first 2 cm and the last 1 cm were cut off to increase the accuracy of the measurements.
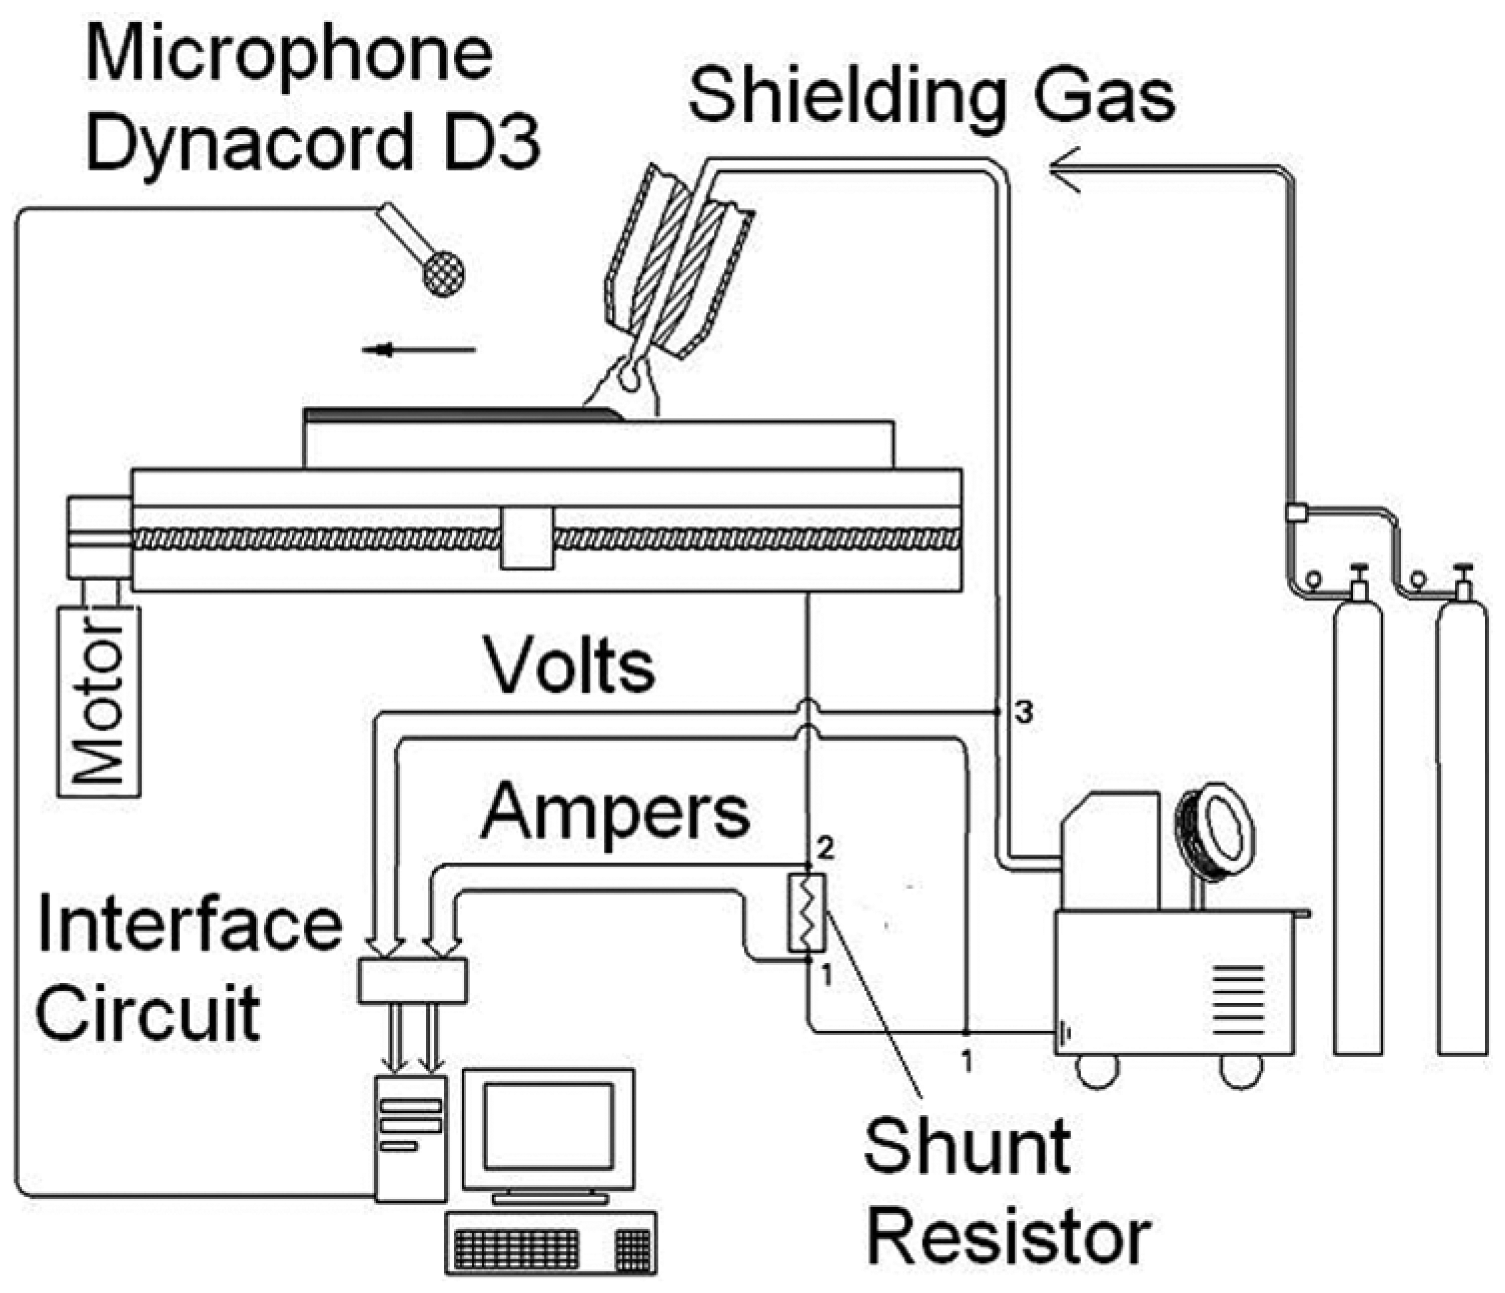
Schematic representation of experimental setup.
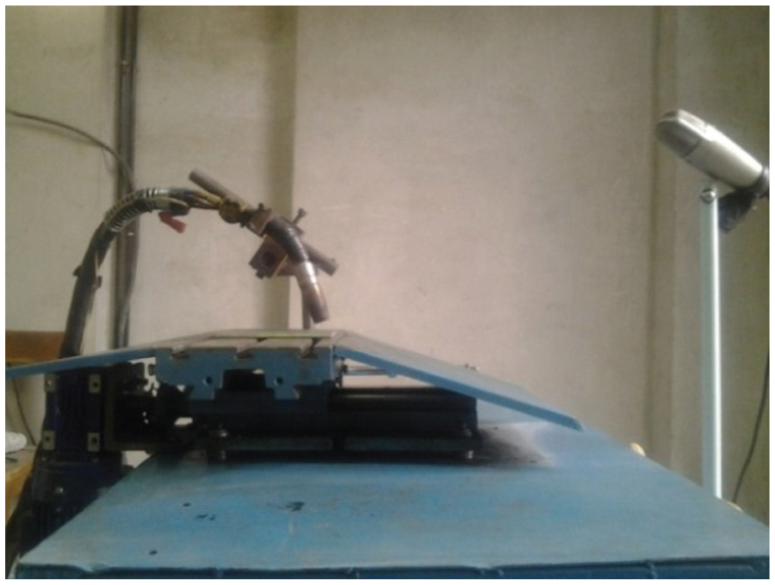
Welding torch and microphone.
The electrical signals (voltage and current) have been recorded using a PCI Eagle 703S data acquisition card. The sound signals have been collected through a Taskam144 external sound card connected to a C3 Dynacord microphone. The microphone was, in turn, mounted on the welding table with constant distance of 30 cm from the welding pool. The sampling rate of data collection was set at 40 kHz by data accusation subroutine in LabVIEW 7.0.
Part I: ANFIS models for predicting welded joints quality
The problem of finding membership functions and appropriate rules in fuzzy models is a tiring process of trial and error. This leads to apply the learning algorithms for fuzzy systems. Neural networks are good alternatives for tuning fuzzy membership function. 28 Neuro-fuzzy approach determines the parameters in fuzzy models using learning techniques developed in neural networks, and it has been successfully applied in various areas.19–23
Generally, there is not a certain numerical value of a definite variable for exact determination of welded joint quality. The weld quality is naturally a descriptive variable and may be described more precisely by fuzzy concepts. According to this and because of employing the human welder experiences in models training, in this work, the ANFIS has been used to construct predictive models for determining the quality of welded joints according the weld signal characteristics.
The statistical parameters of welding signals as inputs of models and the factors for evaluating weld quality as the outputs of models are described in the following.
The statistical characteristics of welding signals (model inputs)
As mentioned, the welding sound and electrical signals are strongly correlated to the quality of the weldment. Hence, the signal characteristics of a faultless weld are quite different than those of faulty ones. As illustrated in Figure 3, for all signals in defect zone, the amplitude and the occurrence frequency of the peaks are completely different than those of faultless regions. These changes in the signal patterns and shapes may be evaluated by its statistical parameters in time or frequency domain. With regard to this, some of the statistical parameters of welding signals have been used as the model inputs in the ANFIS modeling procedure (Table 3).
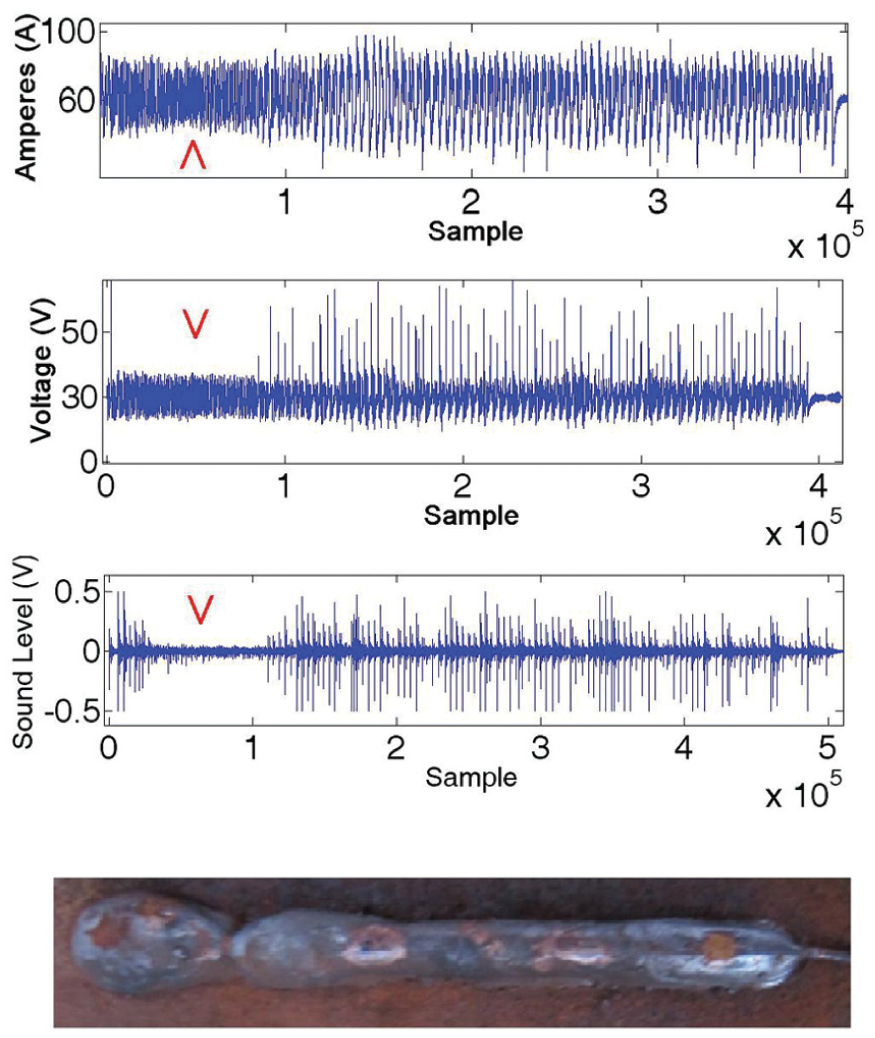
The effect of weld defects on the sound, voltage and current signals patterns.
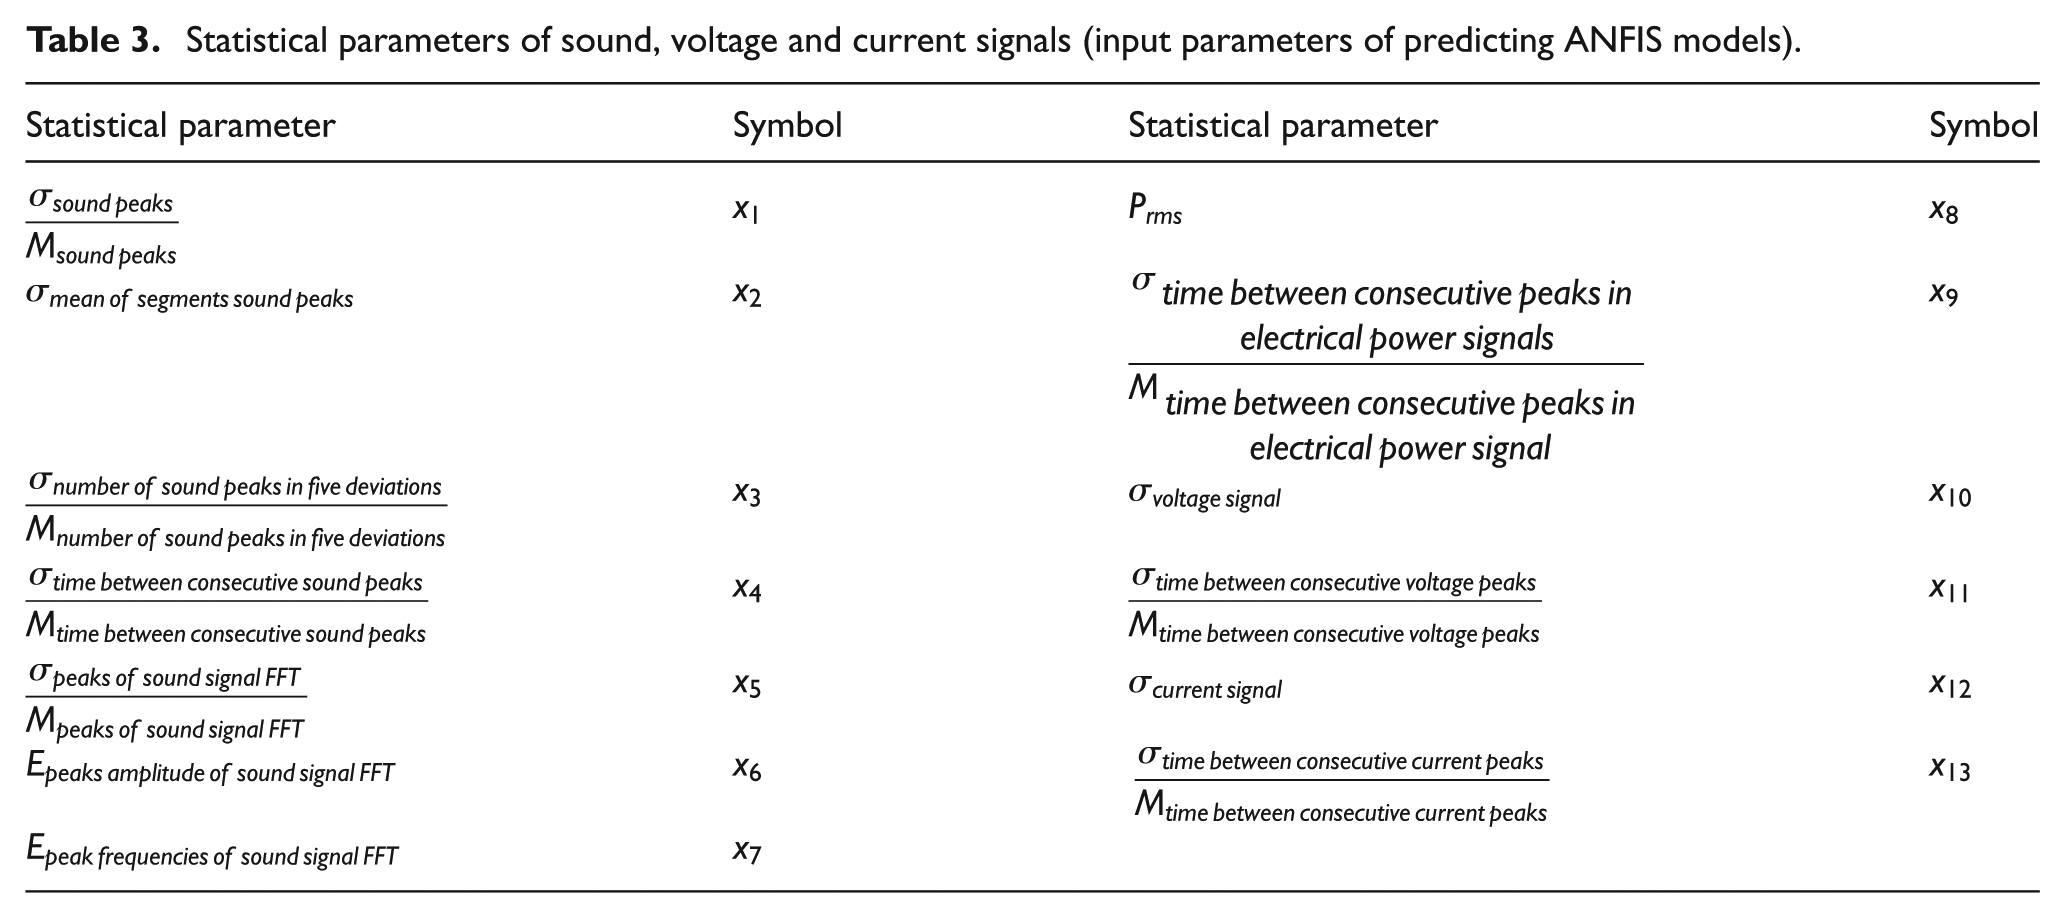
Statistical parameters of sound, voltage and current signals (input parameters of predicting ANFIS models).
It should be noted that the different defects may exhibit similar patterns on a given welding signal. For instance, in Figure 3, the DS defect has affected on all three signals. Some of these effects may be like other defects. As a result, an individual welding signal may not conclusively determine a specific weld defect. Therefore, to determine a specific defect by the patterns of the output signals, all of the three signals should be considered simultaneously.
The quality of the weldment is strongly related to the patterns of the weld signals; especially, signal peaks. In this study and by experience, for sound signal, peaks are those samples that are 3σ larger than average amplitude of overall signal. For current and voltage signals, the signal samples that are 1σ larger than average amplitude of overall signals are considered as peaks. The number of threshold Sigmas for sound and electrical signals are selected based on experience and the nature of signals. For instance, welding sound signals by nature have large variations. Therefore, to limit the number of sound signal peaks within a reasonable range, which would contain useful information about the process and could appropriately reflect the occurrence of any possible defect, a larger number of sigma has been selected. In contrast, electrical signals have much smaller variations. Therefore, using the same notion, smaller number of Sigma is chosen for analyzing welding voltage and current signals. These values have been selected by close observations on the signal samples and characteristics of the corresponding welded joints.
The signal patterns may be described by mean values (M) and standard deviations (σ) of peak amplitudes and the times between consecutive peaks. In this research, all of the statistical parameters of welding signals are defined based on these quantities. It is noted that since the values of welding signal samples (sound and electrical) are always larger than zero, their mean values are also non-zero positive numbers. This would prevent the occurrence of singularity (being divided by zero) for those parameters that are calculated by taking the ratios.
The uniformity of peak amplitudes in sound signals is usually an indication of perfect welds. In this study, parameters x1 and x3 are defined to evaluate sound uniformity. Parameter x1 is the ratio of the standard deviation to the mean value of sound peaks. While x3 is the ratio of the standard deviation to the mean value of number of sound peaks in five different amplitudes. Together, they assess the uniformity of amplitudes and distribution of sound peaks.
Similar patterns of peak distributions along the different segments of weldment may introduce a consistent weld quality along the entire welding pass. This is an important specification of fine welding process. To quantify this feature, parameters x2 and x4 have been recommended. The weld path may be divided into some segments of equal sizes (10 segments for 7 cm of welding path in our case). Then, the averages of peak amplitudes are calculated for each segment. The amplitude consistency of the welding process can now be shown by x2 which is the standard deviation of the peak’s averages of all segments. The similarity of time intervals between following peaks is another important sign of welding consistency. To enumerate this, the parameter x4 is introduced, that is, the ratio of the standard deviation to the mean value of times between consecutive sound peaks. In general, the lower the x2 and x4, the more organized sound signals would be.
Fast Fourier Transform (FFT) is a powerful technique in signal processing that can determine the dominant frequencies of signals. The parameters x5, x6 and x7 have been defined in frequency domain on the FFT diagram of sound signal.
The parameter x5 is the ratio of standard deviation to the mean value of peaks in the FFT of sound signals. It determines the amount of variations in the FFT of sound signal. The large values of x5 show that there is a dominant frequency band in the sound signal. For instance in Figure 4, dominant frequency band is less than 400 Hz. For the envelope curve of FFT diagram of sound signal, the coordinates of its center of area, defined by x6 and x7, are the mathematical estimated values for frequency and amplitude, respectively. Together x6 and x7 are approximate indications for the values of dominant sound signal frequency and its intensity (Figure 5).
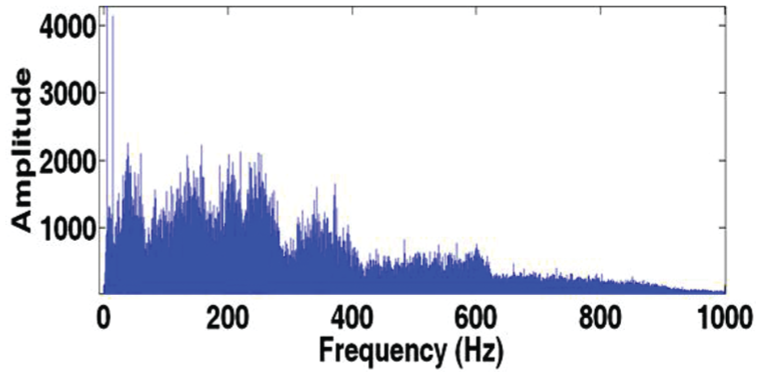
FFT of sound signal.
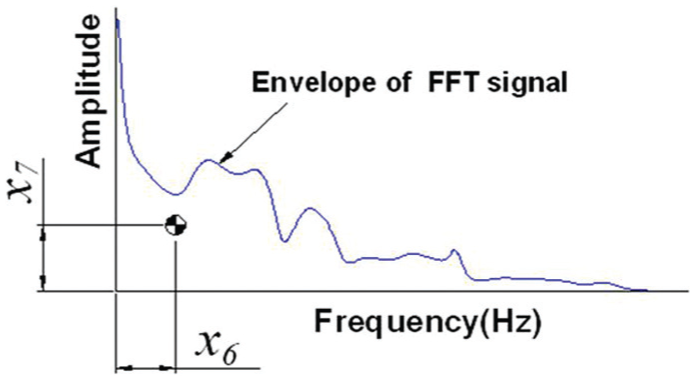
Center of area for FFT signal envelope.
The adequacy of electrical power is an essential condition for ideal welding. The parameter x8 is the root mean square (rms) value of electrical power signal, that is, an indication of input heat to the welding pool.
The parameters x9, x11 and x13 are introduced for the consistency of power, voltage and current signals, respectively. They are the ratio of the standard deviation to the mean value of times between consecutive peaks of corresponding signals. During the process, the welding voltage and current may be involved in rise and fall due to unstable arc, defects or surface conditions. To measure the extent of this subject, x10 and x12 are defined which are the standard deviation of voltage and current signals, respectively.
In summary, the statistical parameters defined for sound signals (x1–x7) as well as the ones for the electrical signals (x8–x13) for 57 experiments may provide comprehensive information about the process state and the possibility of defects occurrence in the welded joints. The weld quality measures may be modeled and predicted using the proposed statistical parameters through the proposed neuro-fuzzy systems.
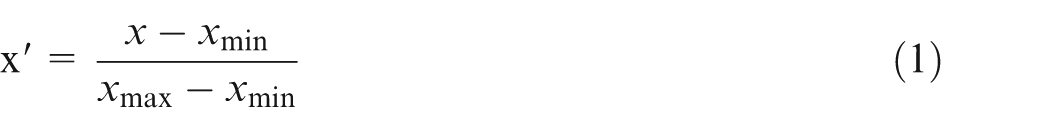
Such statistical parameters such as x2, x6 and x7 that are not in the range of [0–1] are normalized by the unity-based normalization technique using equation (1).
Weld quality measures (models outputs)
In the first part of this research, first-order ANFIS modeling strategy is used to predict the quality of welded joints. The quality measures modeled by ANFIS include the SF as well as three of the most important visual weld defects, namely, DS, LF and OL.
LF, also called cold lapping, occurs when there is no appropriate fusion between the molten mass and the workpiece surface. This may occurs when the welding pool is too large or welding speed is too slow. 29 Overlapping may take place when the filler metal does not spread enough on the workpiece and, as a result, the angle between the base part and the weld bead is less than 90°. Insufficient heat input to the welding pool or excessive deposition rate of filler are possible causes for this flaw. 29 DS occurs when the weldment line is broke up to the parts. Insufficient arc heat and small wire feed rate may be the cause of this flaw. All of the presented defects are visually detectable on the welded joint. They have somewhat signatures on the welding signals. Figure 6 schematically illustrates the shapes and the possible locations of these defects.
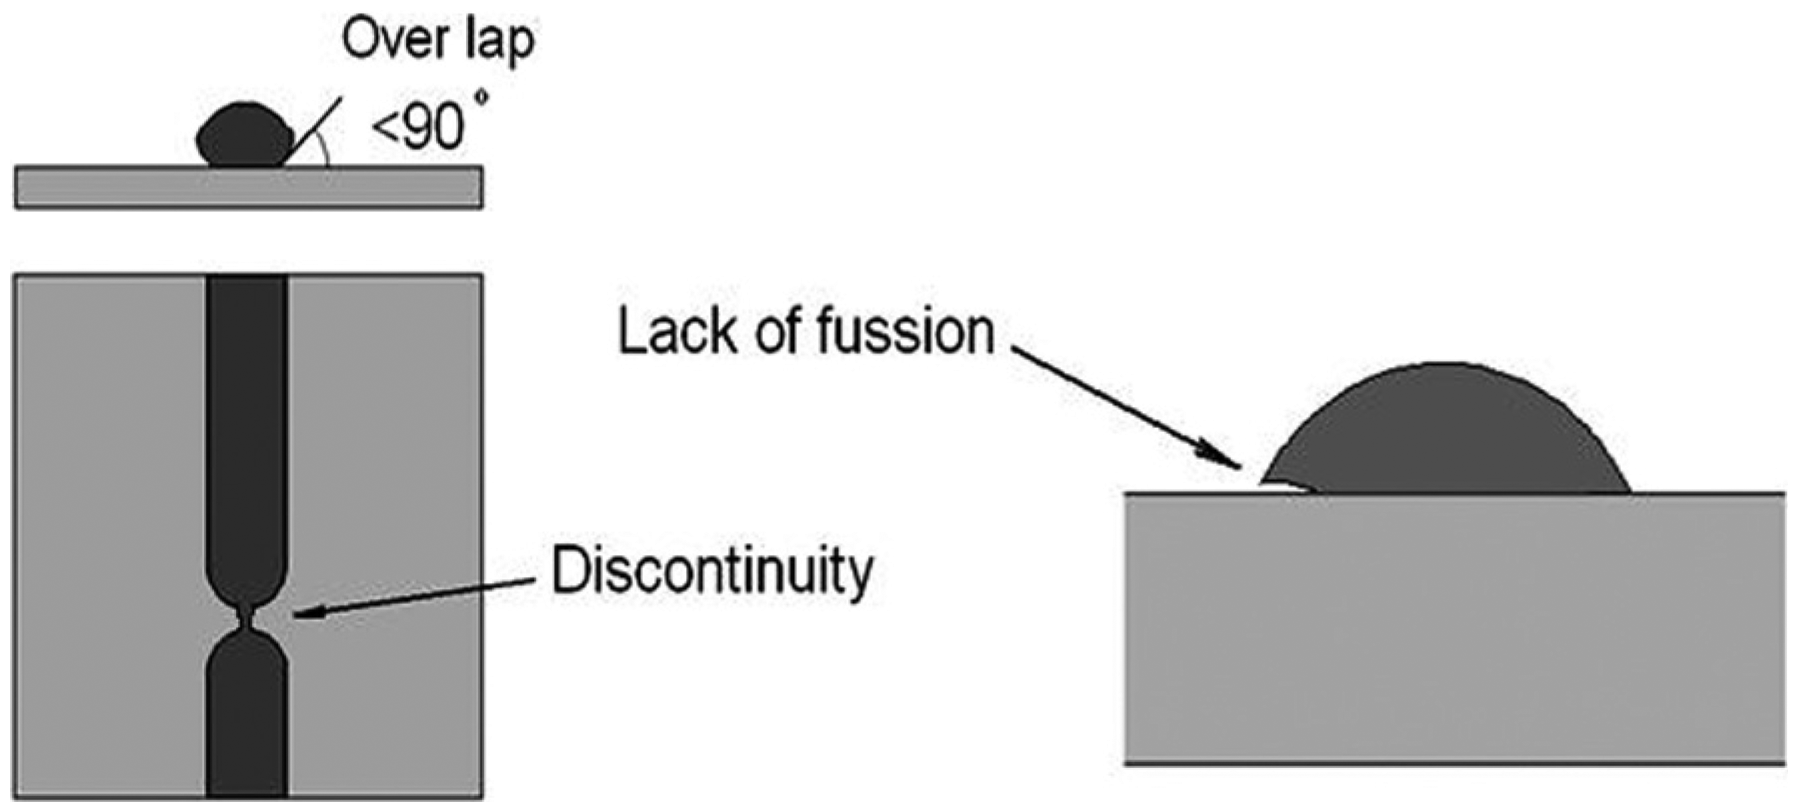
Schematic illustrations of three-weld defects.
SF is the ratio of the height to the width of the weld bead (Figure 7). It is defined as an index of weld bead geometry, one of the main quality measures in welding. 29 The geometry of weldment has distinct effects on the quality of welded joints. 30 Depending on the specific application and type of welding process, weld SF should be in a specific range as the out of range SF may be an indication of improper welding conditions and poor weld quality.
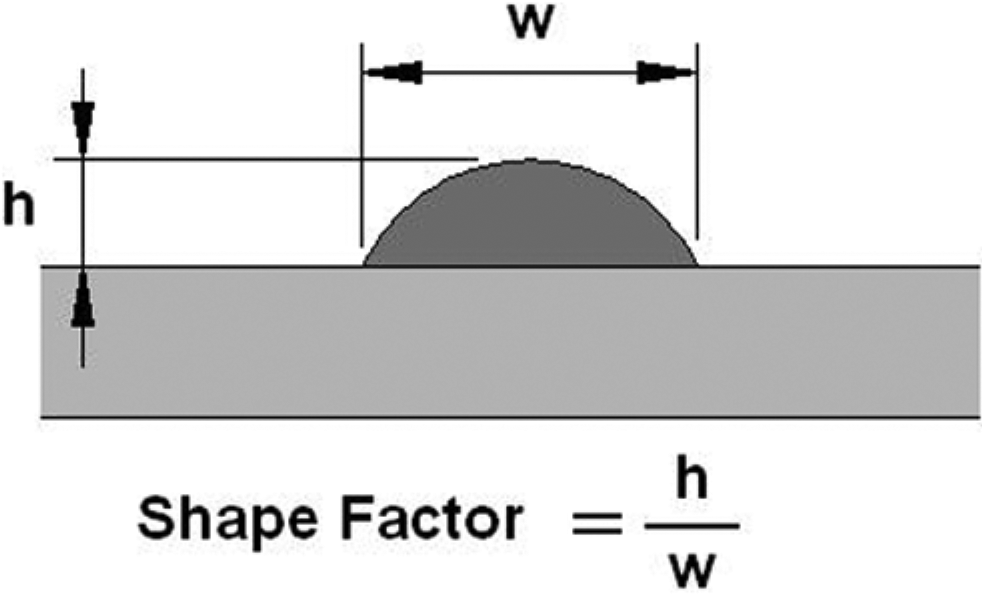
Weld bead geometry and shape factor.
ANFIS modeling procedure
ANFIS is a Sugeno-type fuzzy inference system implemented in the framework of neural networks. 25 A fuzzy system has three major conceptual components: database, rule base and reasoning mechanism. 23 The database contains the fuzzified inputs and outputs. The rulebase includes the fuzzy if–then rules, and the reasoning mechanism performs the inference procedure using fuzzy rules. This mechanism concludes a reasonable output for given inputs. Similar to the neural network models, the parameters of neuro-fuzzy systems are computed through learning method using input–output database.
For instance, a first-order Sugeno-type ANFIS with two inputs and one output is schematically shown in Figure 8. To clarify ANFIS structure and without loss of generality, this simplified model is explained here. Typical fuzzy rules for this structure are as follows:
If x1 is A11 and x2 is A21, then y1 = a11x1 + a12x2 + a10;
If x1 is A12 and x2 is A22, then y2 = a21x1 + a22x2 + a20.
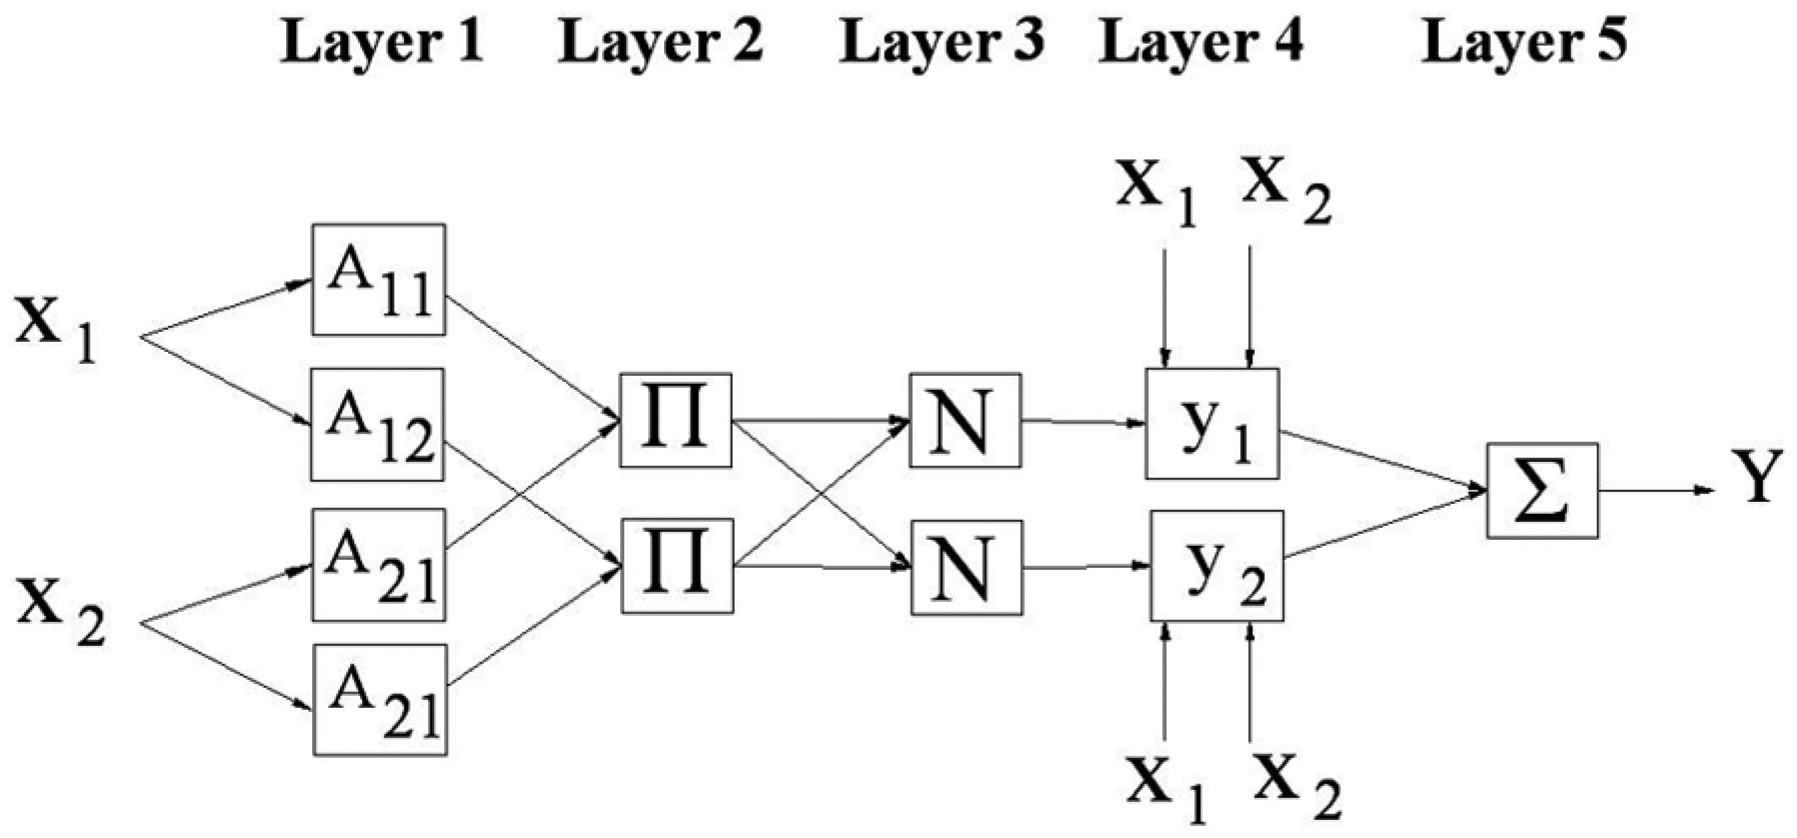
A schematic representation of Sugeno-type ANFIS with two input–one output.
As shown in Figure 8, Aij’s are membership functions. In this work, the generalized bell-shaped functions are selected as the membership functions. Equation (2) shows general form of this function. The parameters
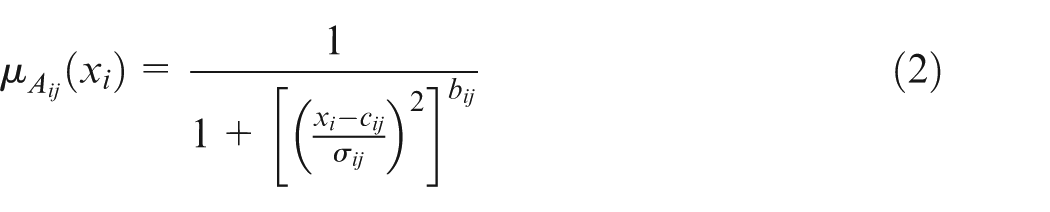
In Figure 8, the symbol
In this part of work, for each of weld quality factor, a first-order ANFIS model is developed (totally four models). The 57 pairs of input–output data (13 inputs for each pair) would generate large number of rules, parameters and equations, which would result in massive computational times. To avoid this problem, subtractive clustering method has been used to reduce the number of fuzzy rules. This method can be used to define membership functions and also to generate rules automatically. 31 Generally, the purpose of clustering is to identify natural groupings of data from a large data set to produce a concise representation of a system’s behavior using a minimum number of rules. The subtractive clustering algorithm and the corresponding formulas are well described in reference.31,32
As a result, the number of fuzzy rules for the four presented predicting ANFIS models; such as DS, LF, OL and SF are reduced to 6, 7, 6 and 4 rules, respectively.
The structural coefficients of presented ANFIS models may be adjusted using hybrid learning algorithm. In this algorithm, the consequent coefficients are identified by least square method in the forward pass; while in the backward pass, the premise parameters are updated by the gradient descent method. 33 The databases required for training processes consist of 57 sets of input–output data. In total, 13 statistical parameters of welding signals are involved as inputs while the 4-weld quality parameters are considered as outputs. The overall procedure for developing prediction ANFIS models is illustrated in Figure 9.
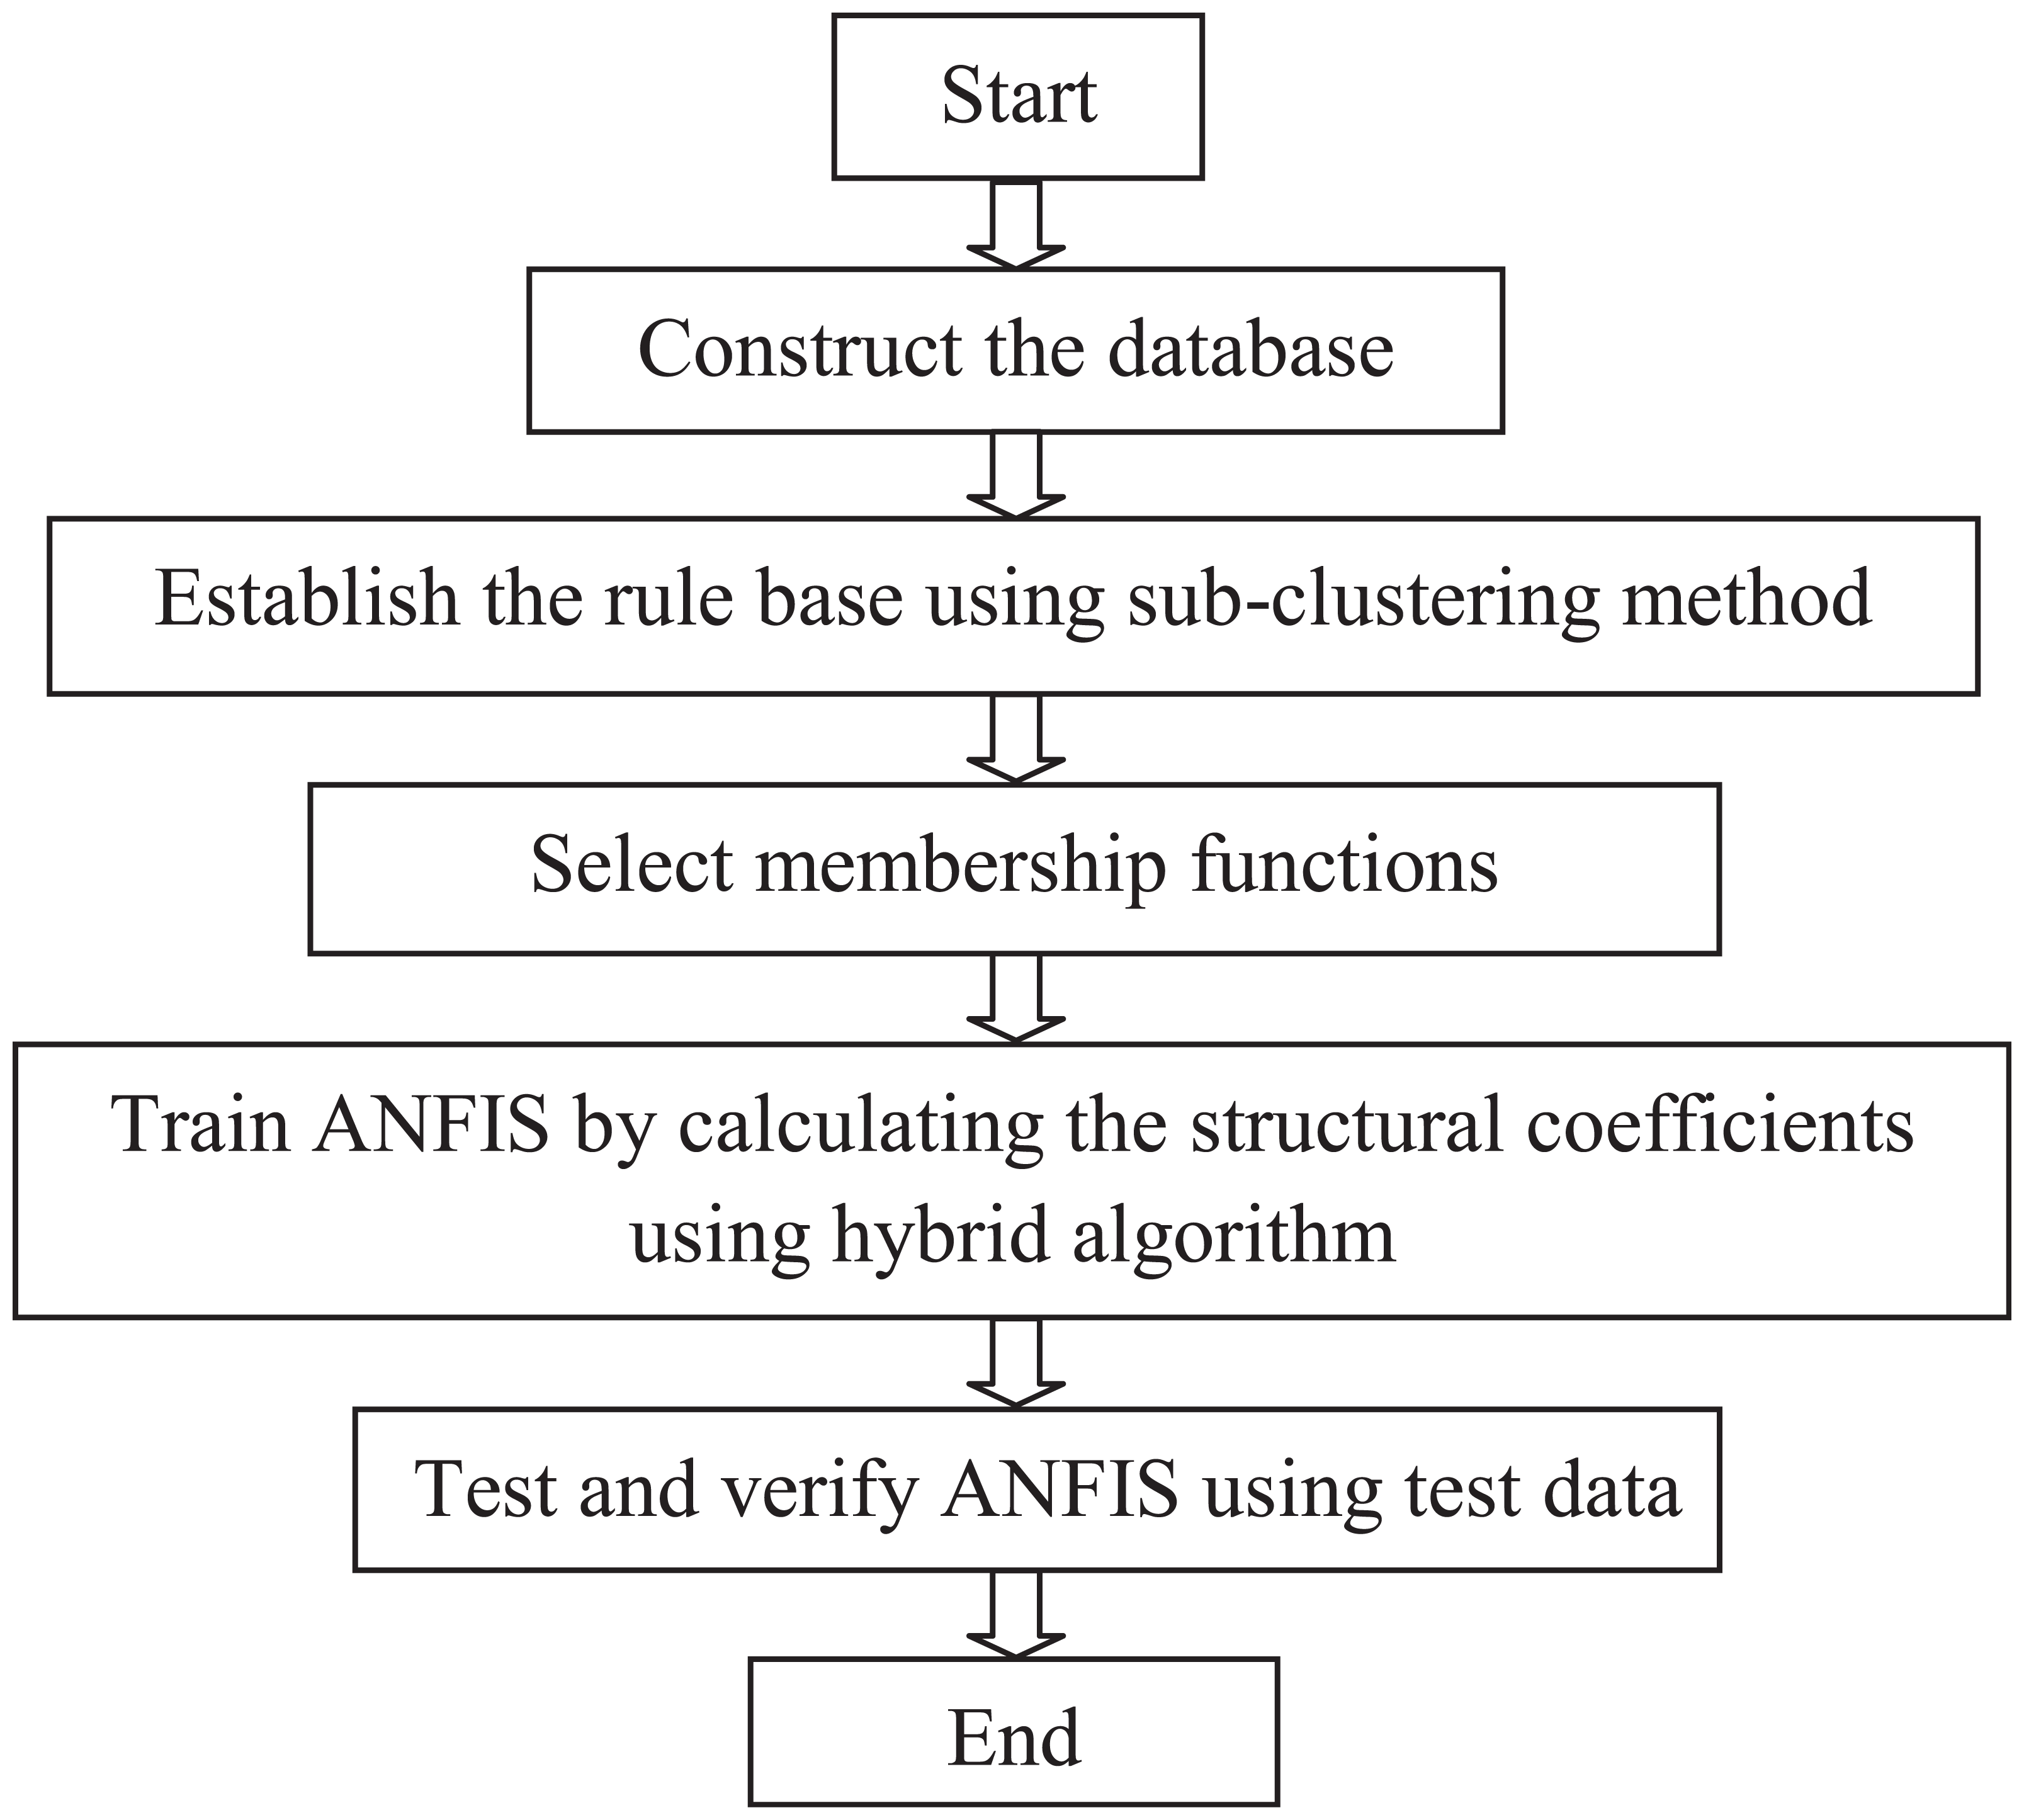
Procedure for construction of predicting ANFIS models.
Verification of predicting ANFIS models
In this research, the verification of predicting models has been done by two separate procedures. First, the possibilities of overfitting in the presented models have been investigated. Next, the capabilities of models in predicting new observations are verified.
The problem of “overfitting” is quite common in the neuro-fuzzy systems like any other machine learning models. Overfitting occurs when the model excessively fits the data. This problem usually happens when a model is very complex, such as having too many structural parameters. This phenomenon and the corresponding solutions are well documented in related researches.34,35
Having large amount of input parameters, in this work, the models may possibly overfits the data. To avoid this, the “early stopping” technique has been implemented. By this method, the model training stops when the error starts rising for checking data set during the training process. For this purpose, the data are divided into three subsets of training, checking and testing. The first two groups are selected from 57 initial experiments while the third group includes validating test data, which are the results of 10 additional experiments.
As per this technique, the number of iterations for convergence of predicting models were 44, 39, 19 and 26 for DS, LF, OL and SF models, respectively.
The experimental test results for the four-welded joint quality parameters and their corresponding theoretical values, predicted by the proposed ANFIS models, are compared in Figure 10. As shown, the predicted values closely follow the experimental results.
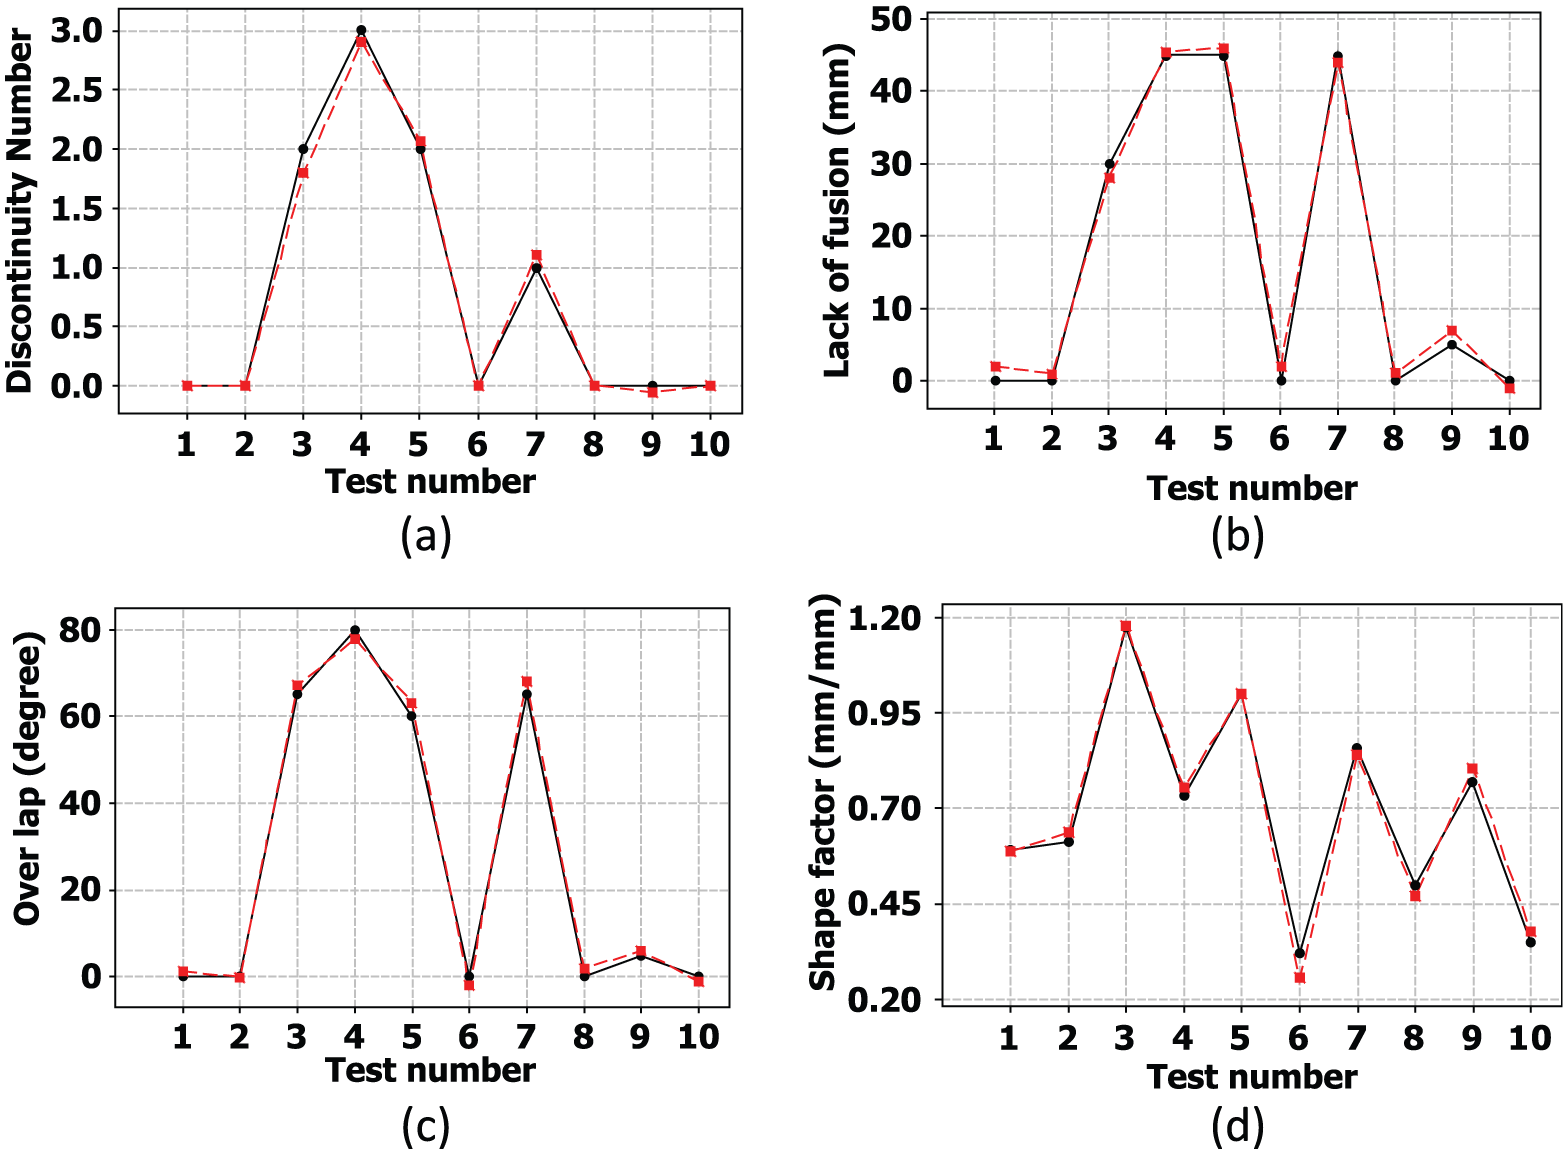
Measured and predicted values of weld quality parameters: (a) discontinuity, (b) lack of fusion, (c) overlap and (d) shape factor real data predicted data.
To investigate the accuracies of the proposed models in predicting process outputs, 10 additional experiments have been performed. In Table 4, the input parameters setting for validating tests and the measured output values are listed.
Input and output values for validating tests.
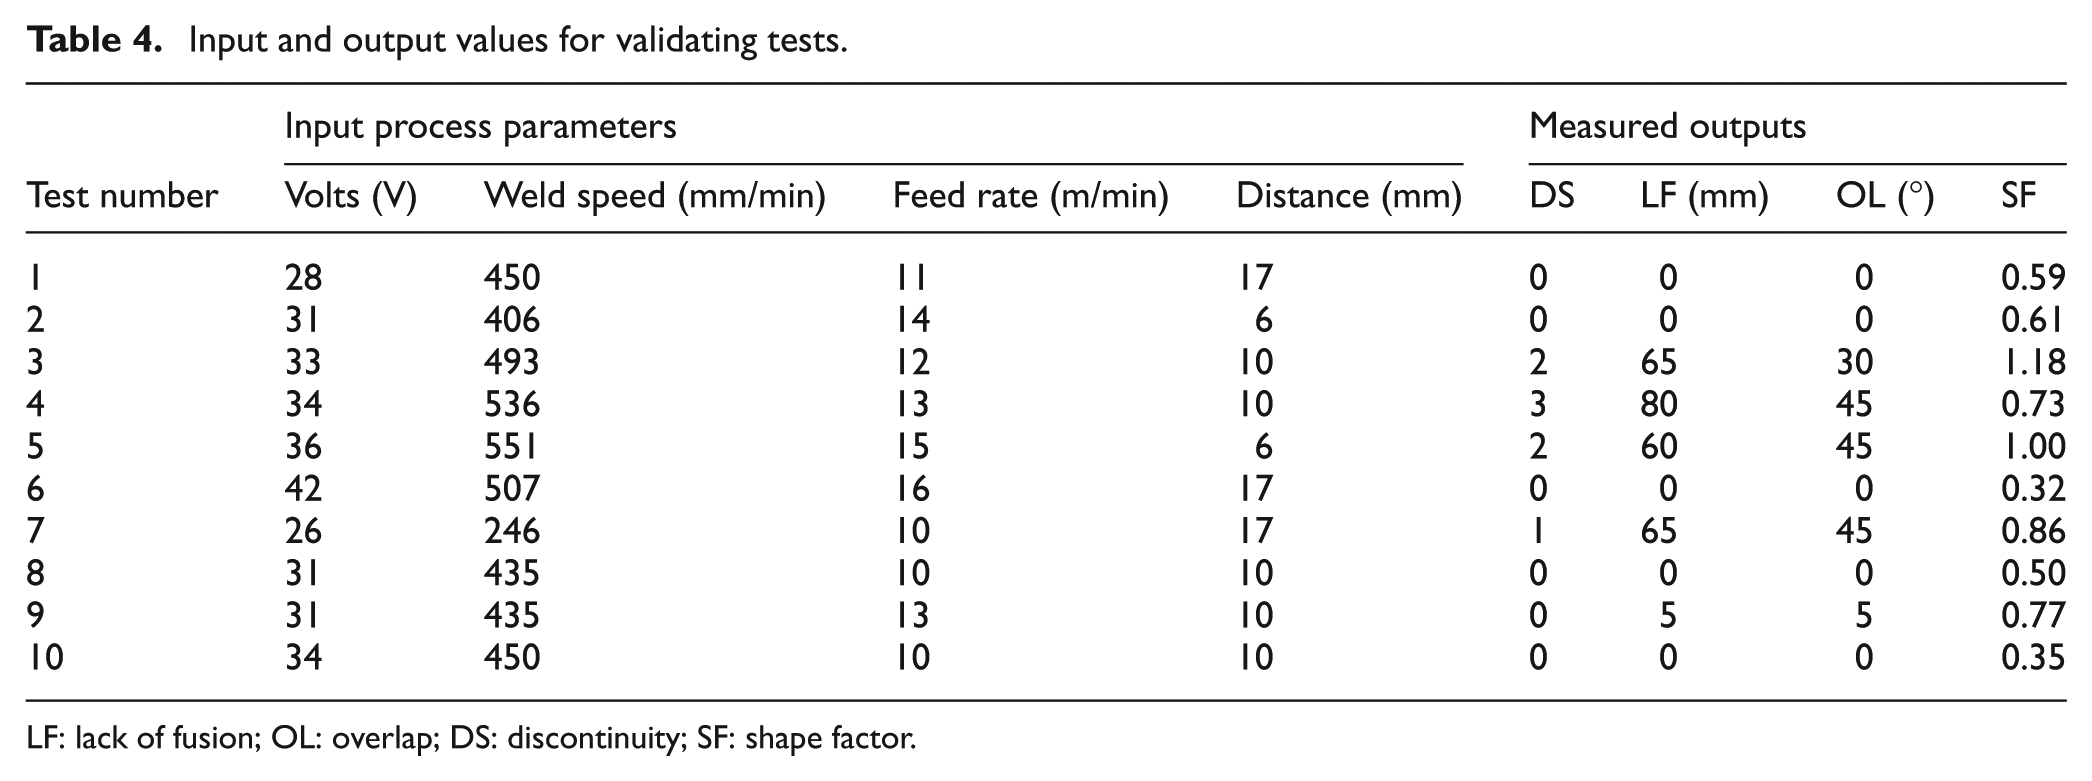
LF: lack of fusion; OL: overlap; DS: discontinuity; SF: shape factor.
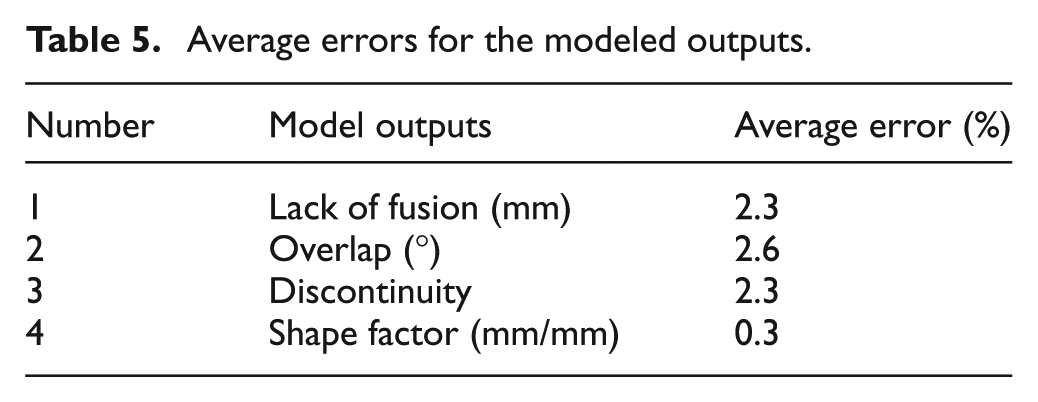
The average errors between the predicted and measured outputs are presented in Table 5. Such small errors between the predicted and actual output parameters prove that the proposed models are quite effective and efficient in predicting the four main weld quality measures. Therefore, the proposed ANFIS models can appropriately substitute the actual GMAW process in the modeling and optimization of this process.
Average errors for the modeled outputs.
Part II: using ANFIS models to improve weld bead quality
One of the most important and practical applications of the proposed ANFIS models (predicting models) is to use them to improve the quality of weldment by removing the weld defects. To achieve this, another set of ANFIS models, called “improving models” has been developed. This set of ANFIS is trained based on the corrective actions that an expert welder may take to remove defects from faulty weldments. These actions are basically corrective modifications of welding parameters settings to avoid defects. In this way, the predicting models, presented in Part I, predict the quality indices of the weldment with any given set of input parameter settings. Such a weldment would usually contain a number of defects, as the parameters settings are not optimized. Then, the predicted values of quality indices are fed into the improving ANFIS models in which the parameters settings are optimally modified so as weld defects are minimized in subsequent welding passes.
The underlying notion in developing the “improving ANFIS” models is utilizing the knowledge of skilled welding operators to determine the proper parameters settings in GMAW process. If a faulty welded joint is produced using a given set of parameter values, an experienced welder would know how to increase or decrease certain input parameters to avoid defects in subsequent welding passes. The proposed improving ANFIS have been trained based on the possible courses of actions which an expert welder may take to avoid weld defects. In this study, a total of 67 welding experiments (57 tests of DOE design, and 10 tests for verification of predicting models) have been performed, out of which 37 are defective. The databases have been used to train improving ANFIS models contain the corrective actions for 27 faulty tests. The remaining 10-test results are then applied for verification purposes.
It is noted that the number of possible parameter setting combinations to prevent the occurrence of a certain defect may be extremely large. In other words, a given defect may be avoided by adjusting voltage, feed rate, welding speed, nozzle-to-workpiece distance or any combination of these. To reduce computational effort and to simplify modeling procedure, in this study, the improving ANFIS models have been developed on the basis of only two most prominent conditions: constant voltage and constant welding speed.
In the first case, the voltage is held constant while the wire feed rate, welding speed and nozzle to work piece distance may be adjusted to improve weld quality. In the second approach, the welding speed is constant while the other factors may be changed to achieve a flawless joint. Consequently, two separate databases have been constructed and used to train two sets of improving ANFIS models. Tables 6 and 7, respectively, list parts of these databases in which the corrective modifications to the welding parameters have been incorporated. These tables include the weld quality indices of 27 faulty experiments in the four left columns. The three right columns are the corrective adjustments in the three of input welding parameters. The databases in Tables 6 and 7 are organized based on the unchanged values of voltages and weld speed, respectively.
Training database with constant voltage.
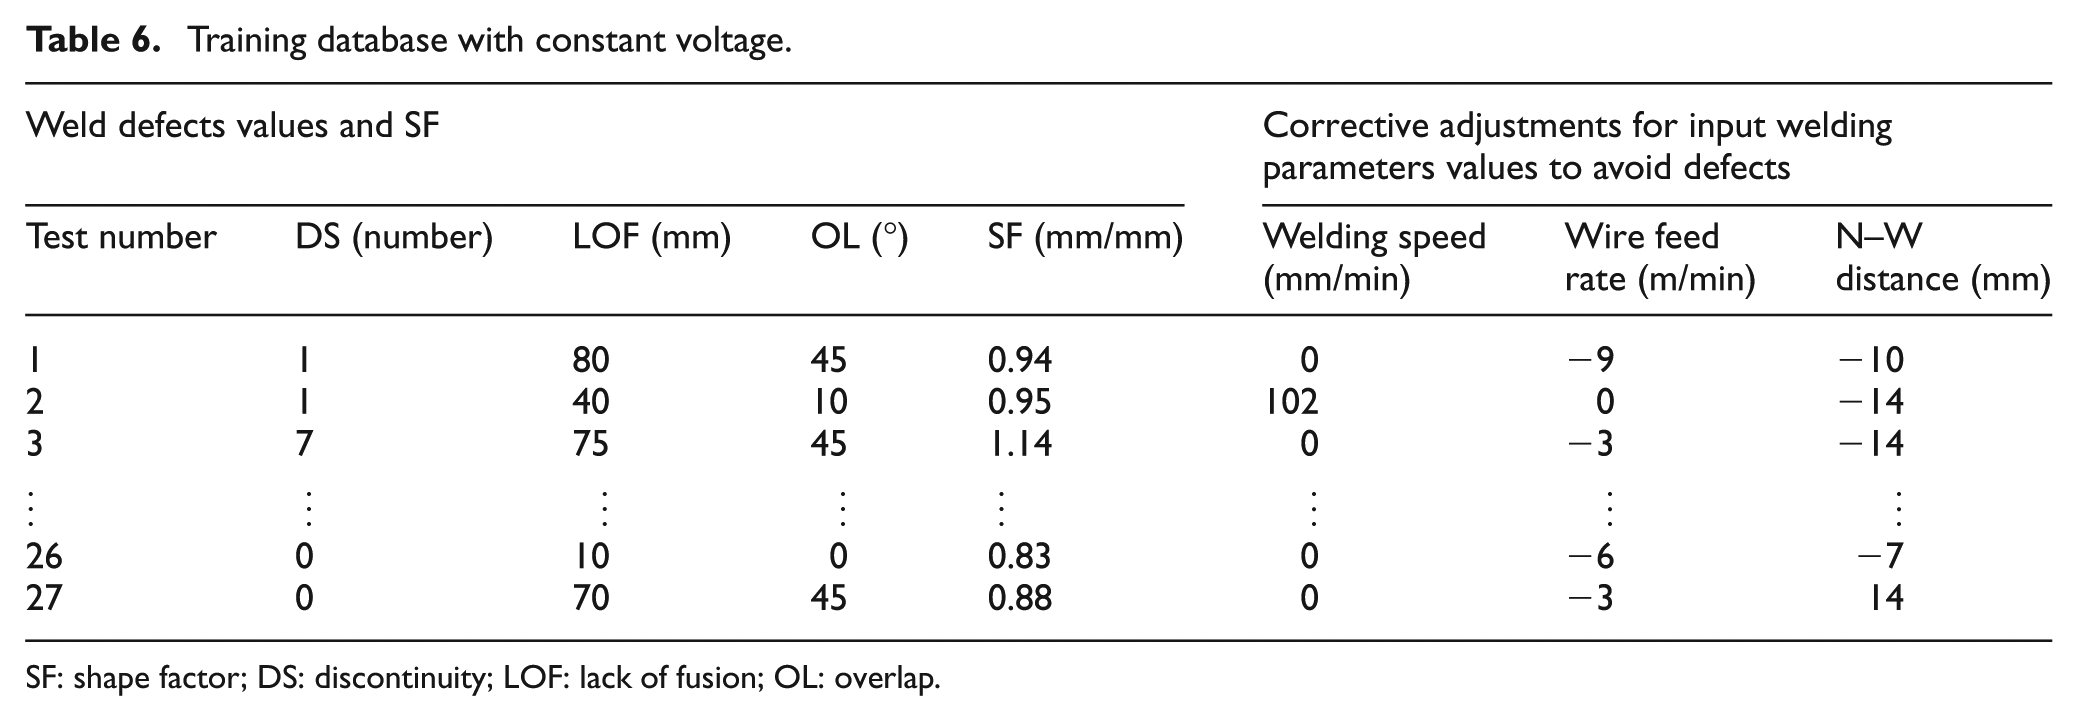
SF: shape factor; DS: discontinuity; LOF: lack of fusion; OL: overlap.
Training database with constant welding speed.
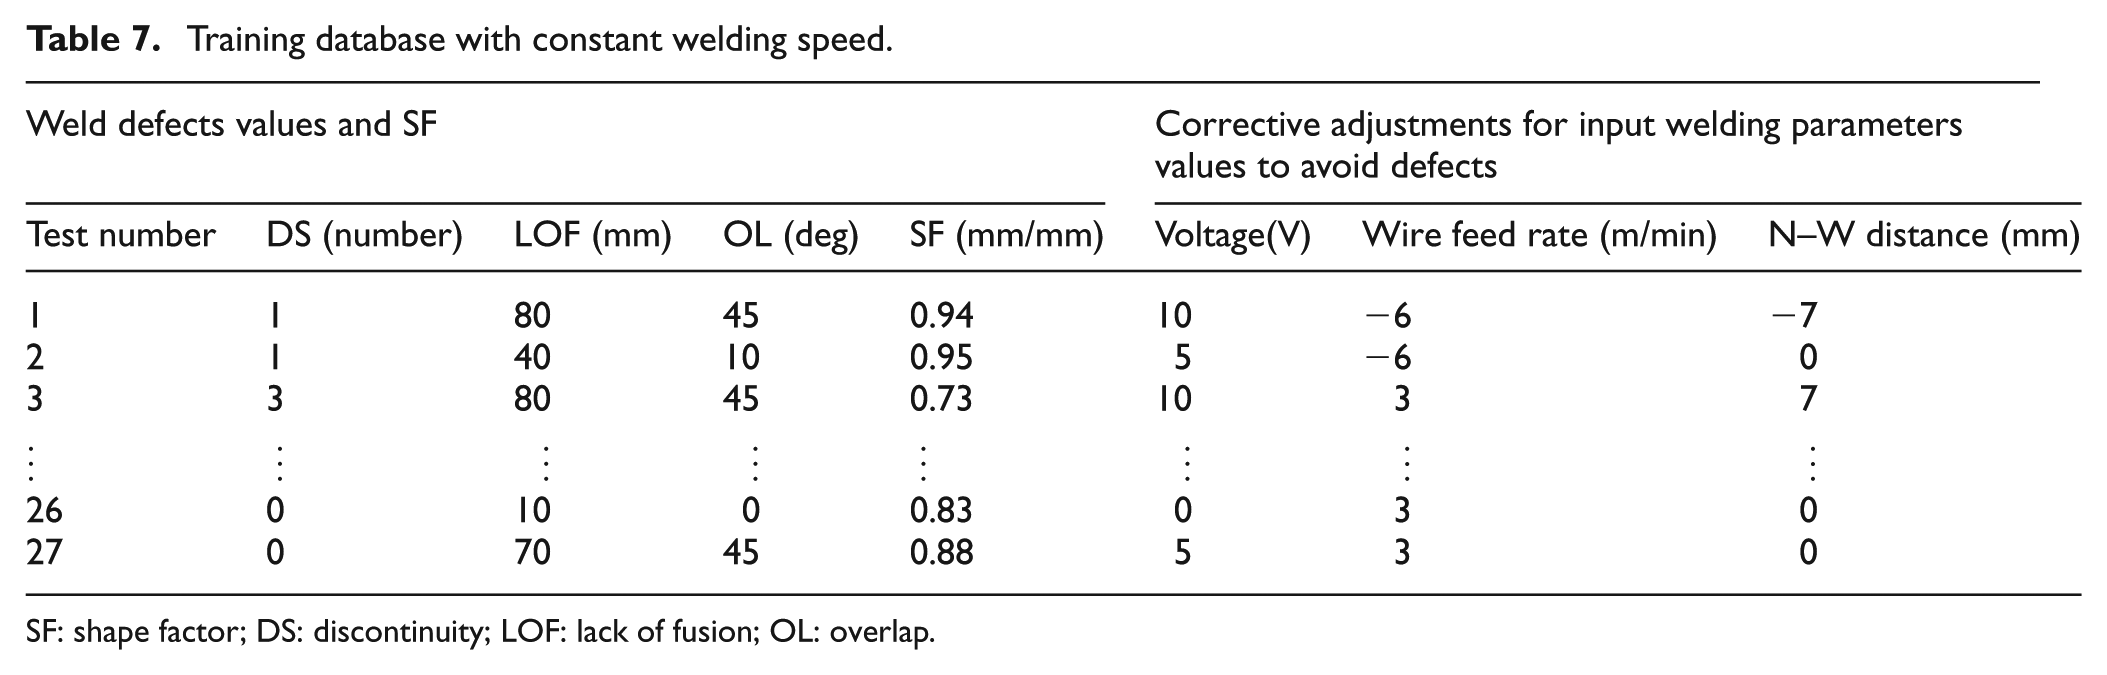
SF: shape factor; DS: discontinuity; LOF: lack of fusion; OL: overlap.
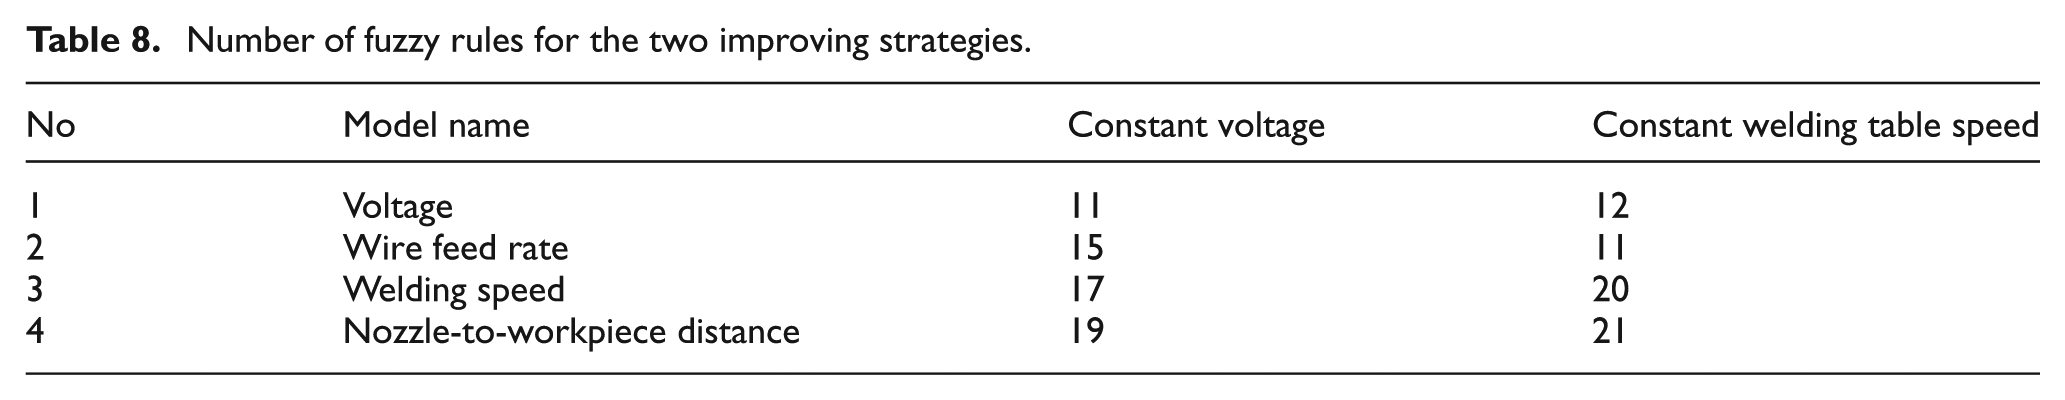
In these models, first-order Sugeno-type inference systems have been incorporated. The input–output data are fuzzified through the bell-shaped membership functions. Using subtractive clustering method, the number of fuzzy rules has been reduced for the two improving strategies. As shown in Table 8, there are 62 and 64 rules for constant voltage and constant speed strategies, respectively. To clarify, an illustrative example of such fuzzy rules for improving weld quality measures is presented as follow:
Number of fuzzy rules for the two improving strategies.
If DS is A1, LF is B1, OL is C1, and SF is D1 then, y1 = c11 × DS + c12 × LF + c13 × OL + c14 × SF. In which, y1 is one of the input welding parameters.
The two sets of improving ANFIS models are then trained using hybrid learning method described in previous section based on the two mentioned strategies and using corresponding databases. The flowchart in Figure 9 is proper for this section.
Results and discussions
To investigate the performance of the two presented improving strategies (constant voltage and constant welding speed), 10 additional faulty experiments were used. For each experiment, the input welding parameters were corrected through trial and error so as a flawless weldment was produced. These adjustments were then compared against those of the proposed improving ANFIS models.
For constant voltage strategy, the values of corrective adjustments in the welding parameters, given by the improving ANFIS model, have been compared with those of trial and error experiments in Figure 11. As shown, in most cases, the predicted values closely follow those found during the experimental tests.

Predicted and experimental values of corrective adjustments to remove defects for constant voltage models in (a) feed rates, (b) weld speed and (c) nozzle-to-workpiece distance. Predicted data and experimental data  .
.
The disagreement between the predicted and actual results in tests 2 and 3 may be due to the fact that in these tests, the molten mass was not produced as the wire was heated just below its melting point. Such tests are not suitable for constructing ANFIS database. In these cases, the welding arc is not generated, thus, there are not any meaningful welding signals. For instance, there are no arc ignitions and extinctions to generate significant sound signals.
Similarly, Figure 12 exhibits the experimental and predicted corrective adjustments for the case of constant welding speed. It can be seen that the adjustments in the welding parameters predicted by the improving ANFIS models are in very good conformity with those of experiments.
Predicted and experimental values of variations to remove defects for constant welding table speed models in (a) feed rates, (b) weld speed and (c) nozzle-to-workpiece distance. Predicted results and experimental results
The comparison between Figures 11 and 12 reveals that the strategy of constant welding speed works better than the constant voltage approach. The advantage of this strategy is the capability of voltage adjustment which may improve the welded joint quality since it affects directly on the amount and distribution of heat in the welding pool.
Conclusion
The quality of the welded joints in most welding process is strongly related to the amount of various weld defects and geometry of the weld bead. During welding process, sound and electrical signals are good indicators of welding defects and bead specifications. As the collective characteristics of these signals are greatly correlated to the quality of the welded joint, such signals may be used to construct appropriate models in order to predict weld quality measures. Moreover, prediction of weld defects and systematical implementing of human welder experiences may provide an opportunity to prevent defects occurrences by model-based adjusting of input welding parameters.
In this work, for GMAW process of API 5LX42 plates, two sets of ANFIS have been developed in order to predict and improve weld quality measures. The quality of the weldment is specified in terms of bead SF and three types of weld defects: DS, LF and OL.
In the first set which is named as predicting models, the weld quality specifications have been modeled in terms of 13 statistical parameters of GMAW sound and electrical signals. These models have been verified using 10 additional experiments. Having the average error of less than 3%, they have shown very good conformities with the actual process.
The second set of ANFIS models, called improving models, take the weld quality characteristics obtained from the first set as inputs. The improving models then provide the amount of process parameters adjustments needed to avoid producing defective joints in subsequent welding runs. The proposed ANFIS models work on the basis of two strategies: constant voltage and constant welding speed.
For this set of models, the ANFIS learning phase has been performed by the databases containing the information for parameters modifications required to correct 27 defective tests. Additional 10 defective experiments have been utilized for verification purposes. Comparisons between the amount of modifications given by the improving models and those of real tests (based on human experience) reveal that the developed models are quite capable in GMAW process parameter optimization; especially, the models with constant welding speed.
One of the main contributions of this work lies in using the experiences of human welder to construct ANFIS learning databases. Conclusively, the two presented set of ANFIS models may substitute the expert welding operator. The probable weld defects are estimated by the predicting ANFIS models while improving ANFIS models would correct the weld defects by adjusting the input welding parameters with the help of actual experiences. This paves the way for on-line monitoring and optimization of welding process which may be an interesting area for future researches.
Footnotes
Appendix 1
Declaration of conflicting interests
The author(s) declared no potential conflicts of interest with respect to the research, authorship and/or publication of this article.
Funding
The author(s) received no financial support for the research, authorship and/or publication of this article.