
Abstract
In this article, a new algorithm for diagnosing tool conditions in micro-scale grinding process is proposed using features extracted from measured tangential grinding force data with the aid of wavelet packet decomposition and back-propagation neural network methods. The tangential grinding forces are measured in a series of micro-grinding experiments by varying depth of cut and feed rate, and those measured profiles are analyzed to define the tool conditions—sharp, middle and dull. From each tangential grinding force signal, 32 node energies are extracted by applying a wavelet packet decomposition method, and a total of 34 features including 32 node energies, depth of cut and feed rate are used to build the micro-grinding tool condition diagnosis model based on a back-propagation neural network approach. In this model, the grinding tool condition can be represented as a numerical confidence value. The experimental verification is conducted and it is demonstrated that the developed model is applicable for effectively diagnosing the micro-grinding tool conditions.
Keywords
Introduction
Micro and meso-scale parts and features with high accuracy and productivity have been substantially demanded in modern industrial fields. In this context, various micro-scale mechanical manufacturing technologies have drawn a significant attention. 1 Among them, a micro-grinding technology has been regarded as a critical step to provide completive edge of products.2,3
A micro-grinding process involves a number of cutting processes of randomly shaped abrasives attached to a grinding tool, and thus, it is not easy to effectively monitor degradation of its condition. Moreover, a micro-grinding tool is very small, and its condition should be carefully controlled not to severely damage workpieces. As a result, the development of a proper tool condition monitoring and diagnosis model is of much significance for maintaining normal grinding operations.
Yang and Yu 4 studied the effective estimation on grinding tool damage by applying wavelet and support vector machine (SVM) approaches to acoustic emission signals during grinding process. The artificial intelligence model estimating grinding tool wear conditions was designed by Kwak and Ha 5 by capturing acoustic emission signals and spindle dynamic signals during the cylindrical plunge grinding. However, most of above-mentioned researches have covered conventional grinding process rather than micro-grinding process, and in addition, those studies considered only cases with fixed machining conditions.
In the domain of micro mechanical machining processes, most of the studies on tool condition monitoring and diagnosis has been focused on micro-milling and micro-drilling processes.6–10 In particular, in the case of micro-grinding process, Feng et al. 11 used combined grinding force and system vibration signals based on the concept of varying cutting stiffness to indicate actual wear status of the micro-grinding wheel. Meanwhile, this study considered a specific micro jig grinding of a ceramic workpiece.
In this article, the new tool condition monitoring and diagnosis model of micro-grinding process is developed by extracting features from tangential grinding forces via a wavelet packet decomposition (WPD) method and computing numerical confidence values based on a back-propagation neural network (BPNN) method for the cases with multiple grinding conditions of varying depth of cut and feed rate. The confidence values can quantitatively represent the micro-grinding tool conditions, which were defined from the measured tangential grinding force profiles. The validity and applicability of the developed model are also investigated via experiments.
Methodological overview for tool condition diagnosis of micro-grinding process
The overall research framework for diagnosing grinding tool conditions in the micro-grinding process is schematically shown in Figure 1. As can be seen in Figure 1, five steps are considered such as experiments and data acquisition, grinding force profile analysis, feature extraction, tool condition diagnosis modeling and experimental verification. First of all, the micro-grinding experimental system is built and a series of micro-grinding experiments are performed to obtain tangential grinding forces. In the second step, the measured tangential grinding force profiles are analyzed to define three tool conditions such as sharp, middle and dull conditions. In this step, the multiplication of the material removal rate (MRR) and number of grinding passes can be used as an index to determine the grinding tool conditions in various grinding cases with varying depth of cut and feed rate. In the third step, a WPD method is applied to the measured force signals, and 32 node energy features are extracted from one signal. Those 32 node energies and 2 grinding parameters—depth of cut and feed rate—are used as the features to be input to build the grinding tool diagnosis model. Then, in the fourth step, the grinding tool diagnosis model is established using a BPNN method. Finally, the developed model is verified by conducting a series of additional grinding experiments.
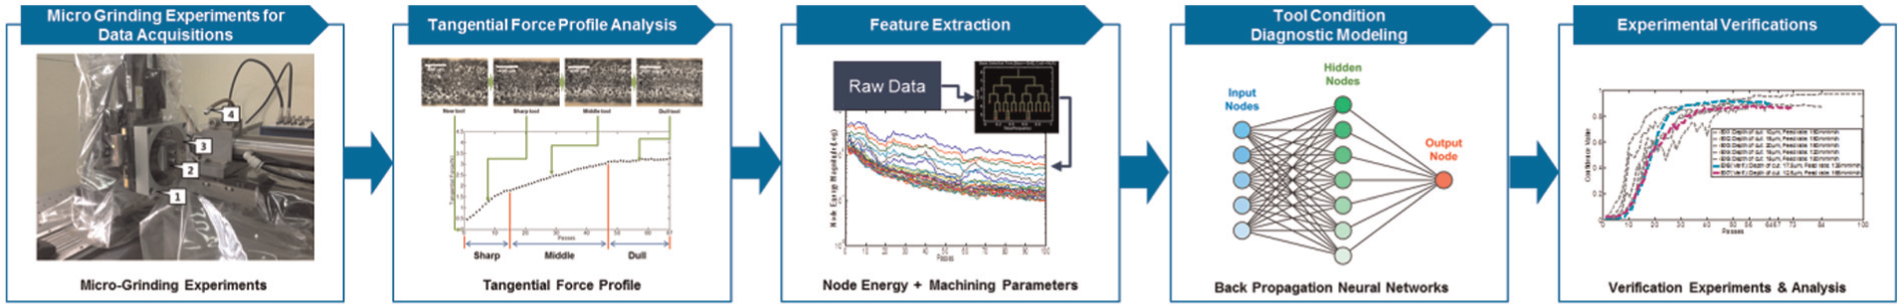
Schematic overview of micro-grinding tool condition diagnosis modeling and validation.
A WPD method has been popularly used for analyzing nonstationary signals having multi-scale components, and a wavelet packet node energy represents energy stored in a particular frequency band and is mainly used to extract dominant frequency components of the signal. 12 On the other hand, a BPNN algorithm is a multi-layer feed-forward perceptron trained according to error back-propagation algorithm. BPNN can be used to learn and store a great deal of mapping relations of input–output model, and no need to disclose in advance the mathematical equation that describes these mapping relations. 13
Design of micro-grinding experiments
The miniaturized machine tool system was built to conduct a series of micro-grinding experiments. It was developed with the 3-degree-of-freedom (DOFs) horizontal configuration. For precision positioning system, three direct current (DC)-motor-driven linear slides (MX80s) were installed, and the electric spindle with air bearing (E-800Z) was used for rotating a micro-grinding tool. The two-axis load cell was assembled to measure tangential grinding forces. The size of the developed machine tool systems was 210 mm ×190 mm × 220 mm.
A series of micro peripheral grinding experiments were conducted in the developed machine tool system with the electroplated cubic boron nitride (CBN) grinding tool having a grain size of #220 and a tool diameter of 1.0 mm and the workpiece made by a tool steel (SK-41C). The grinding width and length were 2 and 20 mm, respectively. A new grinding tool was used for each experimental run. During the experiments, the rotational speed was fixed at 60,000 r/min and the sampling frequency of the force measurement was 5 kHz. In addition, compressed air lubrication was applied at the interface between tool and workpiece.
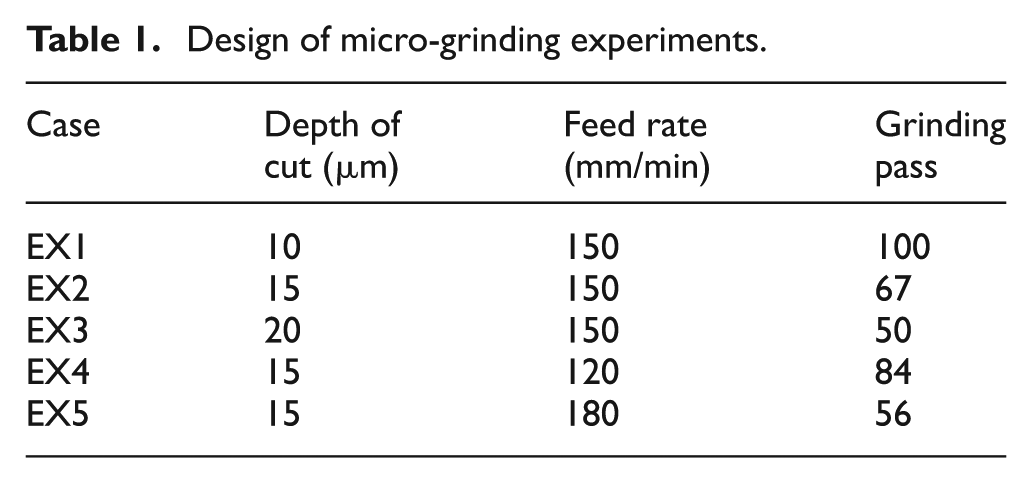
While designing micro-grinding experiments, two machining parameters—depth of cut and feed rate—were considered as controllable ones, and three levels of each controllable parameter were considered. Therefore, as can be seen in Table 1, a total of five experimental cases were arranged. In Table 1, the number of the grinding pass for each experimental case was determined by making the values of multiplication of MRR and grinding pass equal. Thus, the experimental case 2 whose MRR and grinding pass were 2.25 mm3/min and 67, respectively, was considered as a standard, and those in other cases were determined accordingly.
Design of micro-grinding experiments.
Monitoring and diagnosis of micro-grinding tool
Correlation analysis between tangential grinding force and tool condition
A grinding force has been known to be highly related to grinding tool condition and surface quality. Therefore, in this research, the measured tangential grinding forces were used for monitoring and diagnosing the grinding tool condition. Figure 2 shows the average measured tangential grinding forces for each grinding pass in the experimental case 2. As can be seen in Figure 2, the tangential grinding forces increased according to the increase in the number of grinding pass. Meanwhile, their increasing rates were somewhat different, and there were two inflection points, which could divide the entire average measured tangential grinding force profile into three sections. Those three sections were associated with the conditions of grinding tool and were named as “sharp,”“middle” and “dull,” as can be seen in Figure 2. These characteristics were also found in other experimental cases, and their numerical values of the multiplication of MRR and grinding pass were almost identical at each inflection point.
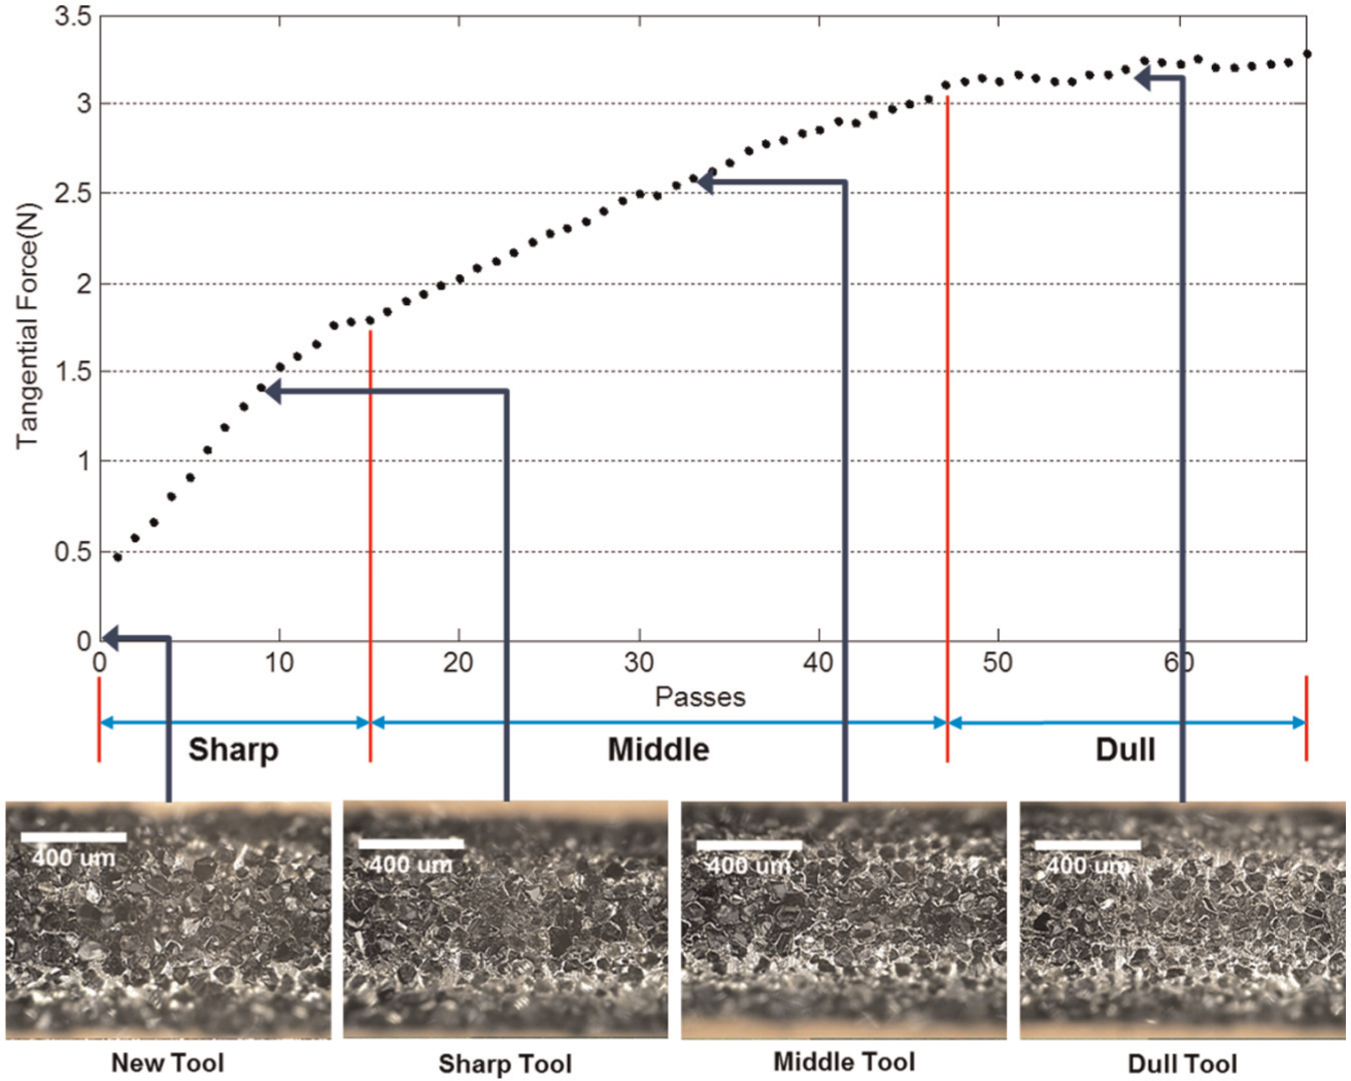
Average measured tangential grinding forces and associated photos of the grinding tool.
Tool condition monitoring and diagnosis model for micro-grinding process
A BPNN approach was applied for training the micro-grinding tool condition monitoring and diagnosis model with the consideration of above-defined three conditions—sharp, middle and dull. For each experimental case, the first five tangential grinding force data were used for each tool condition, and thus, a total of 15 data were used. Therefore, when considering whole five experimental cases, a total of 75 tangential grinding force data were used. In the meantime, a total of 34 features including 32 node energy features, depth of cut and feed rate were prepared for each grinding force data, and therefore, the (75 × 34) data set was input to the BPNN-based model.
The output from the BPNN-based model was the numerical confidence value, which quantitatively represented the micro-grinding tool condition. In this training phase of the model, the confidence values corresponding to each tool condition were set to be 0 for “sharp,” 0.5 for “middle” and 1 for “dull.”
Figure 3 shows the progressive results for calculating the confidence values representing the micro-grinding tool conditions in a clockwise direction for the experimental case 2. The average measured tangential grinding forces were analyzed by applying the WPD, and a total of 32 node energy features were extracted. Then, a total of 34 features including node energies, depth of cut and feed rate were input to the BPNN-based model for training, and the confidence values were computed. The larger the confidence value, the worse is the grinding tool condition.
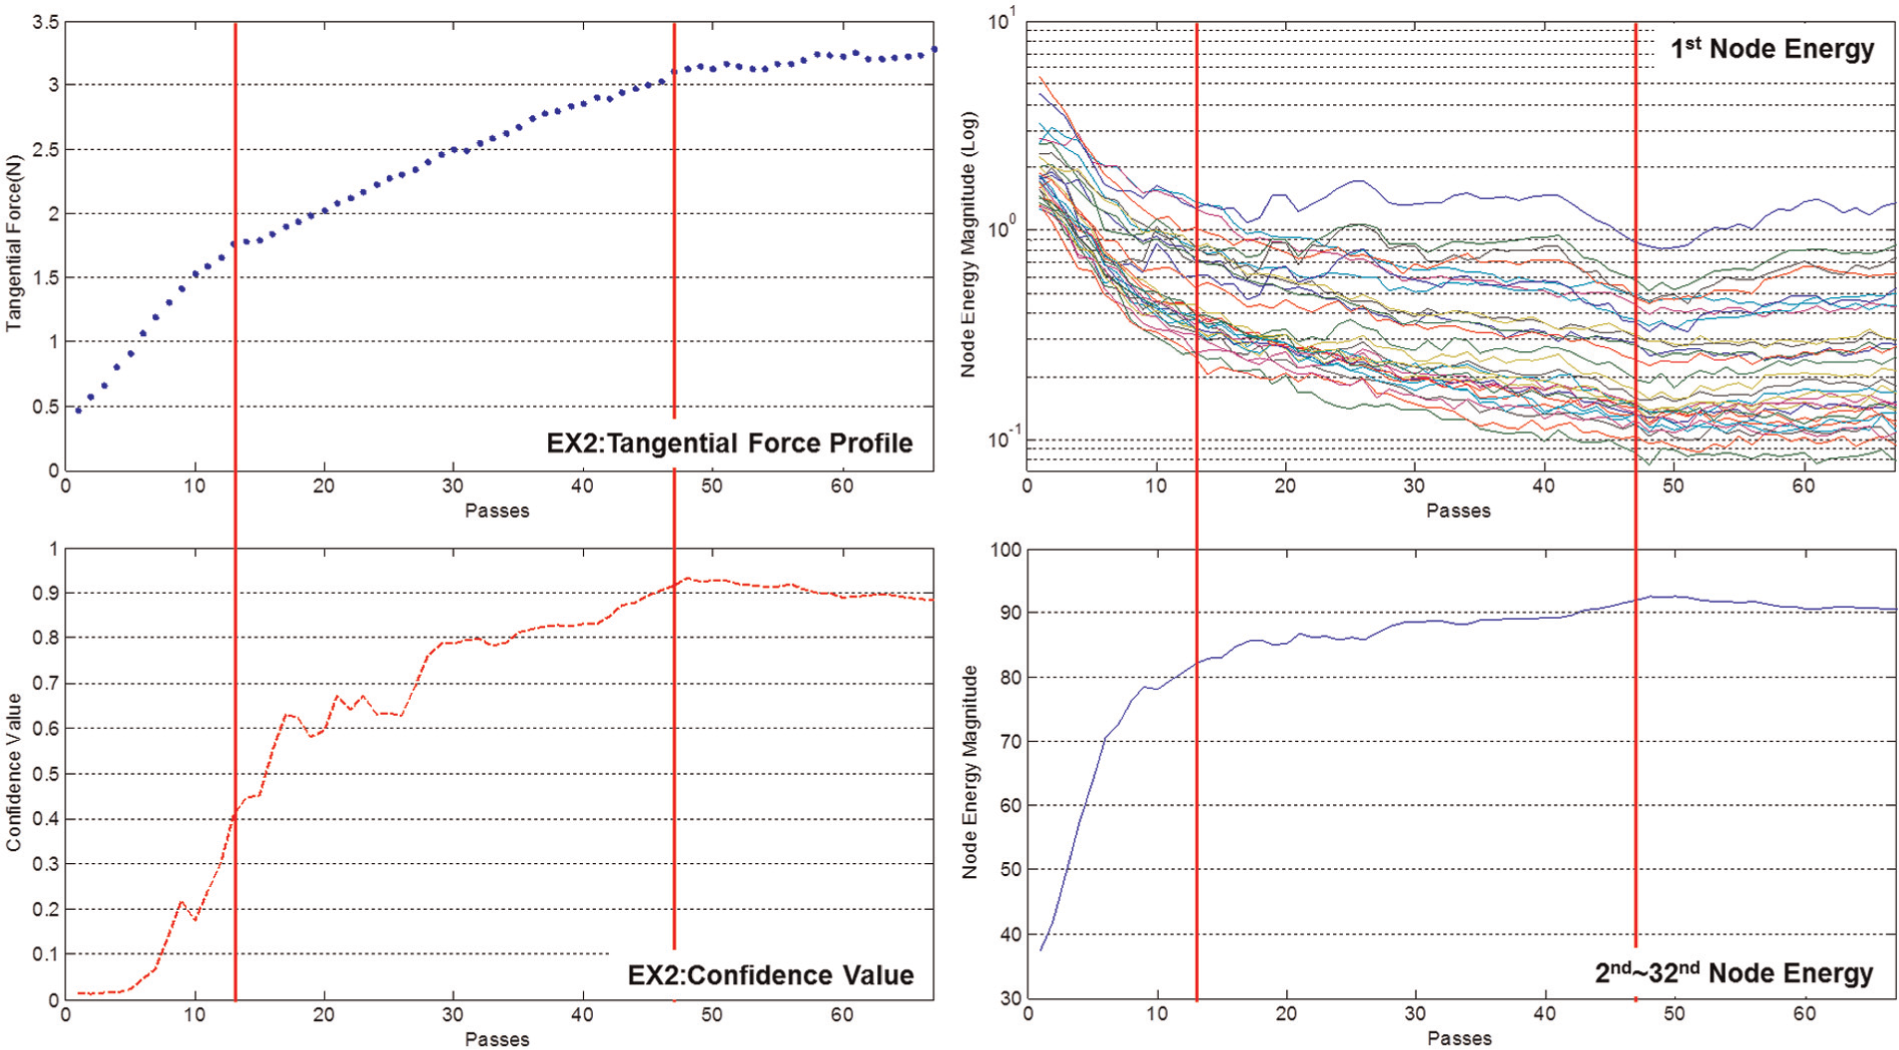
Measured tangential grinding forces, extracted node energy features and computed confidence values in the experimental case 2.
The confidence values computed from the BPNN-based model for all experimental cases are given in Figure 4. In Figure 4(a), the computed confidence values are given in the cases of varying depth of cut and fixed feed rate. As can be seen in Figure 4(a), the grinding tool condition was degraded much faster in the case of large depth cut (20 μm) than in the cases of intermediate (15 μm) and small (10 μm) depth of cut. Similarly, in Figure 4(b), those in the cases of varying feed rate and fixed depth of cut are given, and the degradation rate in the case of the largest feed rate (180 mm/min) was the maximum. Therefore, it is believed that larger depth of cut and feed rate in the micro-grinding process could result in faster degradation of the tool condition. These results coincided with generally observed physical phenomena of tool condition changes in the micro-grinding process.
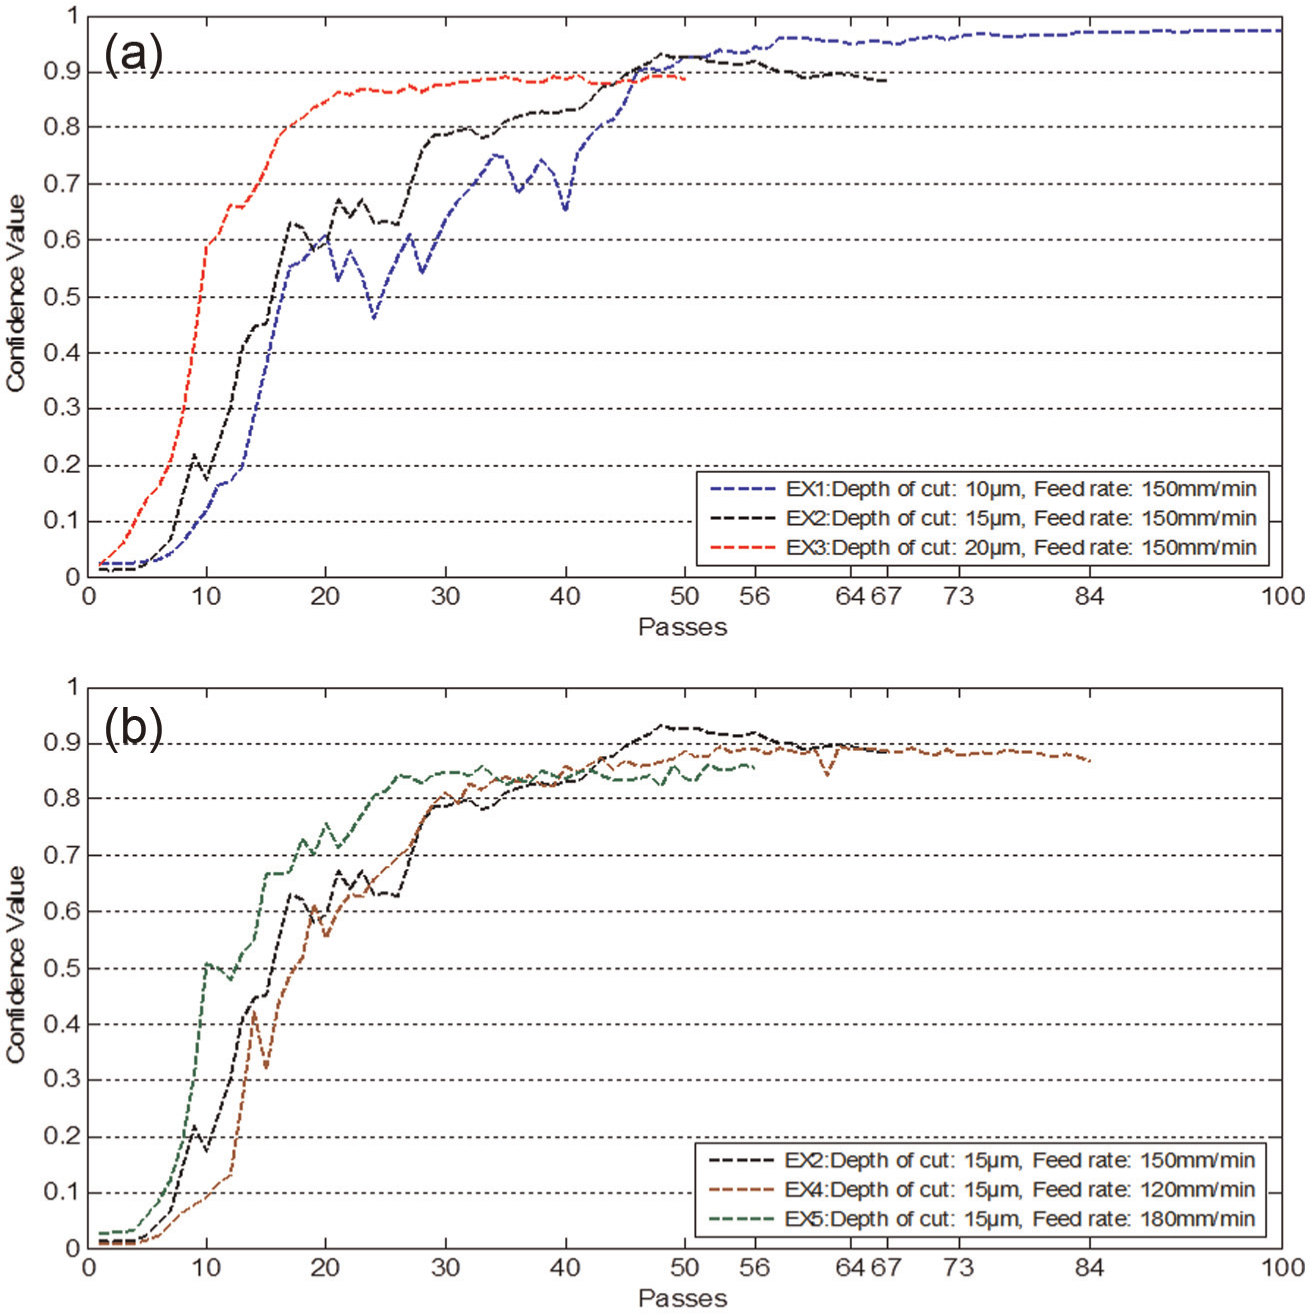
Computed confidence values (a) in the experimental cases of 1–3 under varying depth of cut and fixed feed rate of 150 mm/min and (b) in the experimental cases of 2–5 under fixed depth of cut of 15 μm and varying feed rate.
Experimental validation
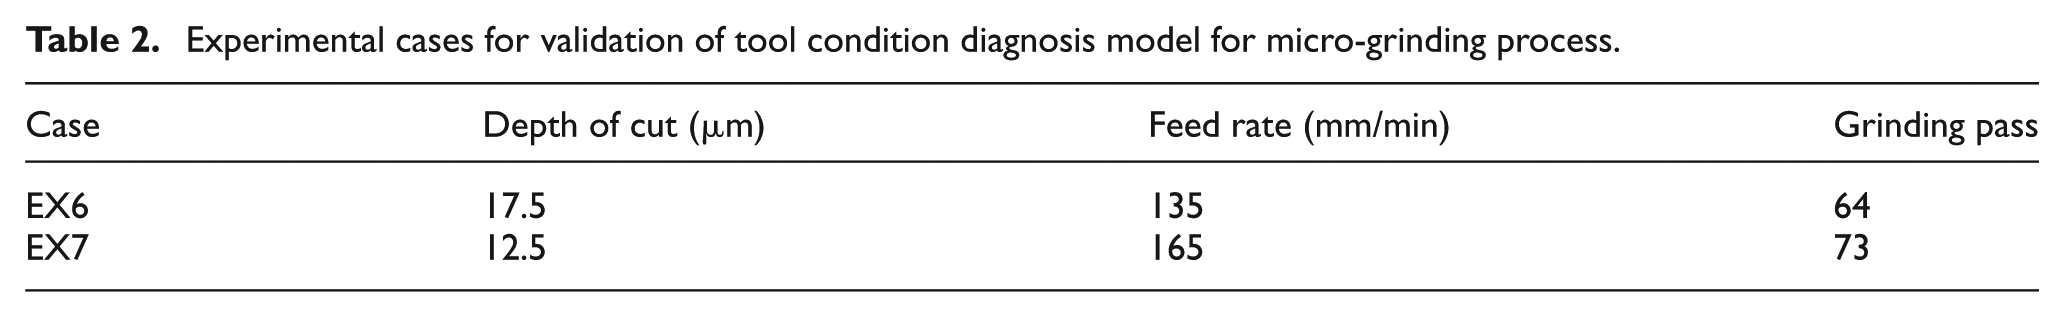
The developed tool condition monitoring and diagnosis model for the micro-grinding process was experimentally validated by considering the numerical values of depth of cut and feed rate, which were in the ranges from 10 to 20 μm and from 120 to 180 mm/min, respectively. Two experimental cases for the model validation are given in Table 2. Figure 5 shows the measured tangential grinding forces and computed confidence values in the experimental cases of 6 and 7. The numbers of grinding passes in each case were also determined by making the values of multiplication of MRR and grinding pass identical.
Experimental cases for validation of tool condition diagnosis model for micro-grinding process.
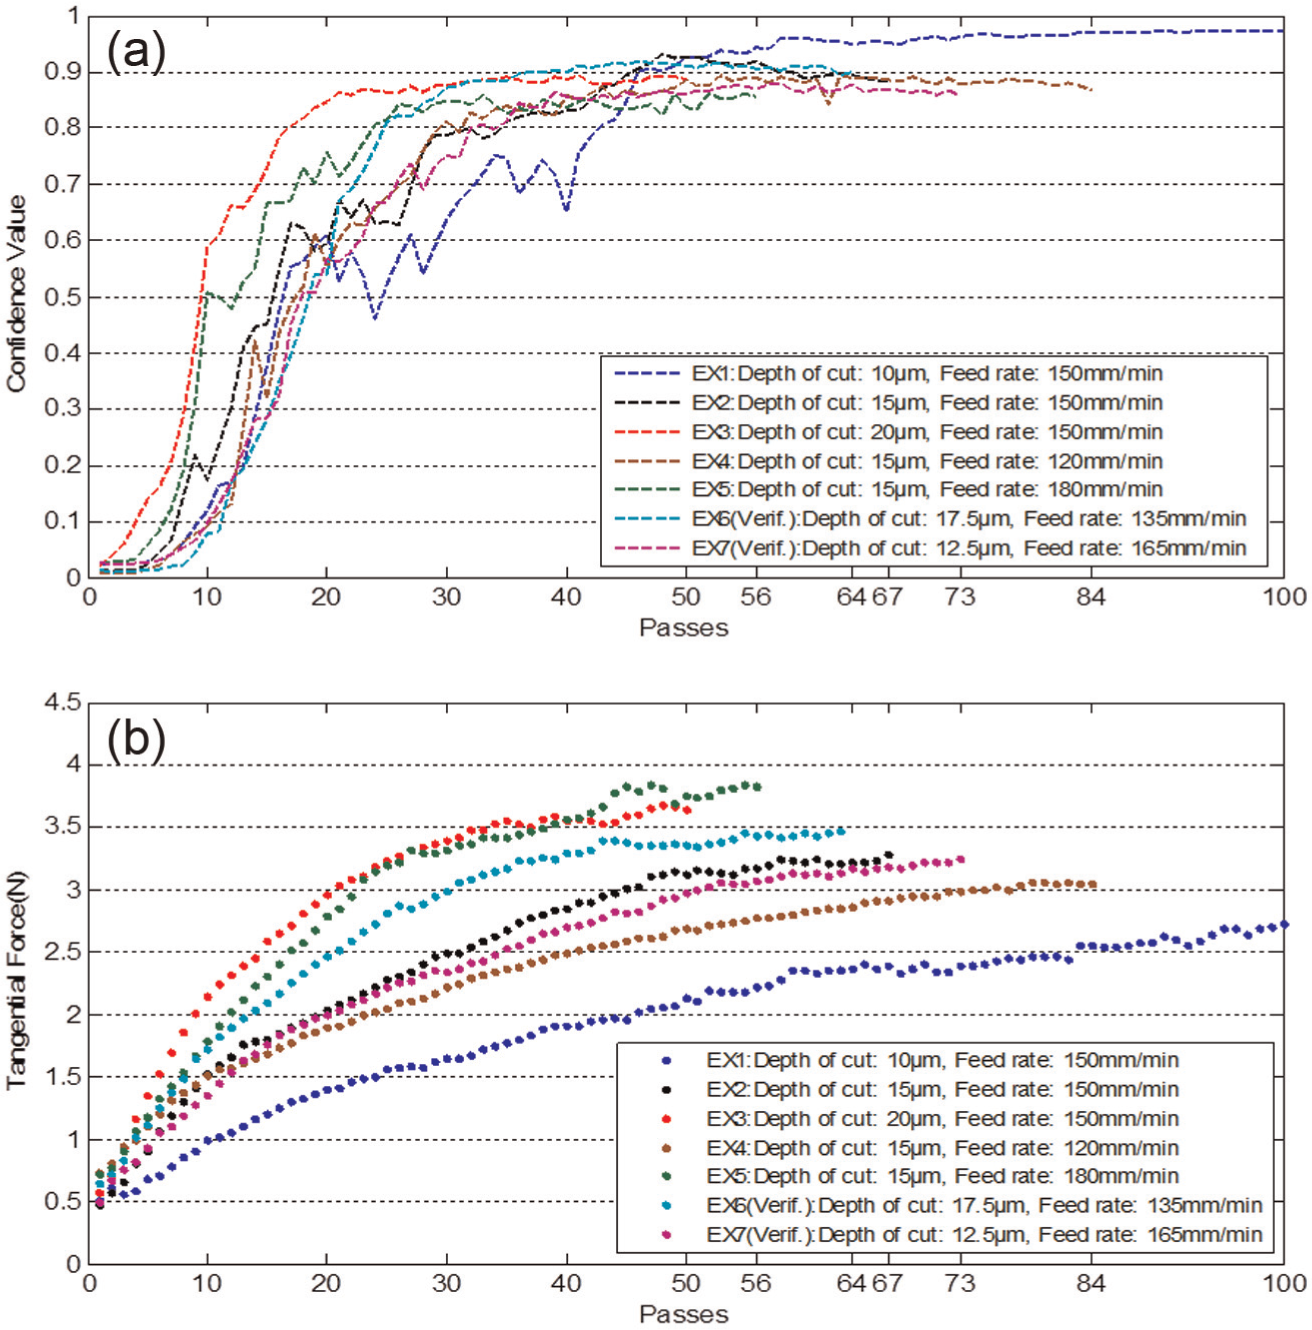
Measured (a) tangential grinding forces and computed (b) confidence values in the experimental cases of 6 and 7 with the results from other experimental cases.
As can be seen in Figure 5(a), the tangential grinding force profiles in the experimental cases 6 and 7 also had two inflection points. In other words, three tool conditions could be identified from the measured force profiles by applying the developed tool condition monitoring and diagnosis model. In Figure 5(a), it is found that the tangential grinding forces in the experimental case 6 (cyan dotted line) are located between those in EX5 and EX2, and that those in the experimental case 7 (purple dotted line) are located between those in EX2 and EX4.
The confidence values computed from the BPNN-based model are given in Figure 5(b). As can be seen in Figure 5(b), the confidence values in both experimental cases of 6 (cyan dashed line) and 7 (purple dashed line) were similar. However, after 20 grinding passes, those in the experimental case 6 rapidly increased, and thus, the tool condition was degraded much faster than that in the experimental case 7. Therefore, it is believed that the depth of cut could influence on tool condition degradation more dominantly than the feed rate. When comparing the results from the experimental cases of 6 and 7 with those from other cases, their measured tangential grinding forces and computed confidence values were within the range of the results from other experimental cases. Therefore, the developed grinding tool condition monitoring and diagnosis model could be effectively used at any grinding conditions in the given specific ranges of depth of cut (from 10 to 20 μm) and feed rate (from 120 to 180 mm/min).
Conclusion
In this article, the new tool condition monitoring and diagnosis model for the micro-grinding process was developed based on WPD and BPNN approaches and was experimentally validated. The developed model could be applied to any multiple grinding cases with varying depth of cut and feed rate within their specific range, while other existing models could only be applied to the certain fixed grinding cases.
In the development of the model, the average measured tangential grinding forces were used to define three tool conditions such as sharp, middle and dull from their profiles. A total of five experimental cases were designed by considering three levels of two controllable parameters—depth of cut and feed rate. The WPD was applied to the measured grinding forces to extract 32 node energy features, and in total, 34 features including 32 node energies, depth of cut and feed rate were prepared for each tool condition of a single experimental case. Since five force data were used to extract the features for each tool condition, total (75 × 34) data set could be input to the BPNN-based model for taking into a consideration of all five experimental cases in the training phase. Then, the BPNN-based model could compute the confidence values for quantitatively representing the tool conditions.
The experimental validation was also conducted by considering different depths of cut and feed rates within the range of maximal and minimal of them. The computed confidence values were useful to effectively predict and diagnose the grinding tool condition degradation behaviors for determining a proper moment of tool change and maintaining a sound grinding process.
Footnotes
Declaration of conflicting interests
The authors declare that there is no conflict of interest.
Funding
This work was supported by the Industrial Strategic Technology Development Program (10040952) and funded by the Ministry of Trade, Industry & Energy (MI, Korea).