
Abstract
In this work, a finite element model is developed for predicting the thermo-mechanical response of Ti-6Al-4V during electron beam deposition. A three-dimensional thermo-elasto-plastic analysis is performed to model distortion and residual stress in the workpiece and experimental in situ temperature, and distortion measurements are performed during the deposition of a single-bead-wide, 16-layer-high wall built for model validation. Post-process blind hole–drilling residual stress measurements are also performed. Both the in situ distortion and post-process residual stress measurements suggest that stress relaxation occurs during the deposition of Ti-6Al-4V. A method of accounting for such stress relaxation in thermo-elasto-plastic simulations is proposed where both stress and plastic strain are reset to 0, when the temperature exceeds a prescribed stress relaxation temperature. Inverse simulation is used to determine the values of the absorption efficiency and the emissivity of electron beam–deposited, wire-fed Ti-6Al-4V, as well as the appropriate stress relaxation temperature.
Introduction
Additive manufacturing (AM) has seen increased attention in recent years due to the ability of the process to produce near-net shape parts directly from computer-aided design (CAD) files without the retooling cost associated with casting or forging. The electron beam deposition process is of particular interest to the aerospace industry due to its ability to deposit large amounts of feedstock material at rapid rates. The process involves melting metal wire onto a substrate and allowing for it to cool and form a fully dense geometry on a layer-by-layer basis. Unfortunately, large thermal gradients during the deposition process result in undesirable distortion and residual stress. Modifications to the build plan may reduce distortion and residual stress. To optimize the build plan without the expensive trial-and-error iterations, an accurate predictive model is needed.
Numerical modeling for the prediction of temperature, distortion, and residual stress caused by the AM process is similar to that of multi-pass welding. Weld modeling has been an active area of research for nearly four decades. Several weld models have been used to predict thermal and mechanical behaviors.1–7 Other modeling work has focused on material phase change during welding.8,9 Lindgren 10 has written detailed summaries on the development of weld model complexity, material modeling in welding, 11 and improvements in computational efficiency for weld modeling. 12 In more recent weld model work, Michaleris et al. 13 focused on predicting distortion modes caused by welding, as well as residual stress.
AM modeling adds significant computational cost when compared to multi-pass welding due to the increased amount of deposited material, passes, and process time. The addition of material into the simulation requires an element activation strategy. 14 Like weld models, AM models require accurate process parameters to yield acceptable results. The parameters of particular interest are absorption efficiency and surface emissivity, as these parameters determine the energy entering and exiting the system during the process. Yang et al. 15 experimentally determined the absorption efficiency and surface emissivity of deposited Ti-6Al-4V using a laser-assisted machining process. Shen and Chou 16 modeled the efficiency of a powder-based electron beam system as 0.90 and assumed the emissivity of Ti-6Al-4V to be a constant 0.70, resulting in close agreement with experimental results. No available literature provides values of efficiency and emissivity for a wire-fed electron beam system. Over the past decade, significant work has been performed to model AM.17–20
Some researchers have focused on material phase change caused by AM such as predicting the resulting microstructure of deposited Ti-6Al-4V.21–27 Additional work has focused on predicting stress and distortion in materials that undergo phase transformation. 28 Ghosh and Choi 29 concluded that simulated distortion results are significantly affected by failing to properly take into account the microstructural changes present in the deposited material. Griffith et al. 30 showed that the high temperatures reached during the laser deposition of stainless steel 316 can cause the material to anneal, thus reducing the measured residual stress. Song et al. 31 accounted for the plastic strain relaxation in a deposited nickel-based alloy by setting a threshold temperature that, when surpassed, sets the plastic strain value to 0. Qiao et al. 32 performed microhardness measurements to demonstrate that the equivalent plastic strain needs to be dynamically adjusted at high temperatures in thermo-elasto-plastic models to simulate material annealing. An approach for managing the stress relaxation in AM-deposited Ti-6Al-4V has not yet been presented.
The objective of this work is to develop a finite element model for predicting the in situ thermo-mechanical response of a Ti-6Al-4V workpiece deposited using a wire-fed electron beam system. Workpiece distortion and residual stress is modeled using a three-dimensional (3D) thermo-elasto-plastic analysis. The model is validated using experimental in situ temperature and distortion measurements performed during deposition of a 16-layer-high, single-bead-wide wall build as well as post-process residual stress measurements taken using blind hole drilling. Both the in situ distortion and post-process residual stress measurements suggest that stress relaxation occurs in Ti-6Al-4V during deposition. The thermo-elasto-plastic model presented accounts for the observed stress relaxation by resetting both stress and plastic strain to 0 when the temperature exceeds a prescribed stress relaxation temperature. The absorption efficiency, emissivity, and stress relaxation temperature are determined by applying inverse simulation.
Electron beam deposition simulation
The thermal and mechanical histories are determined by performing a 3D transient thermal analysis and a 3D quasi-static incremental analysis, respectively. The thermal and mechanical analyses are performed independently and are weakly coupled, meaning that the mechanical response has no effect on the thermal history of the workpiece. 33
Thermal analysis
The governing heat transfer energy balance is written as
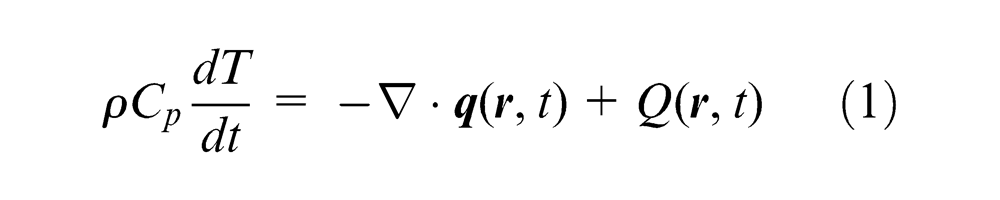
where

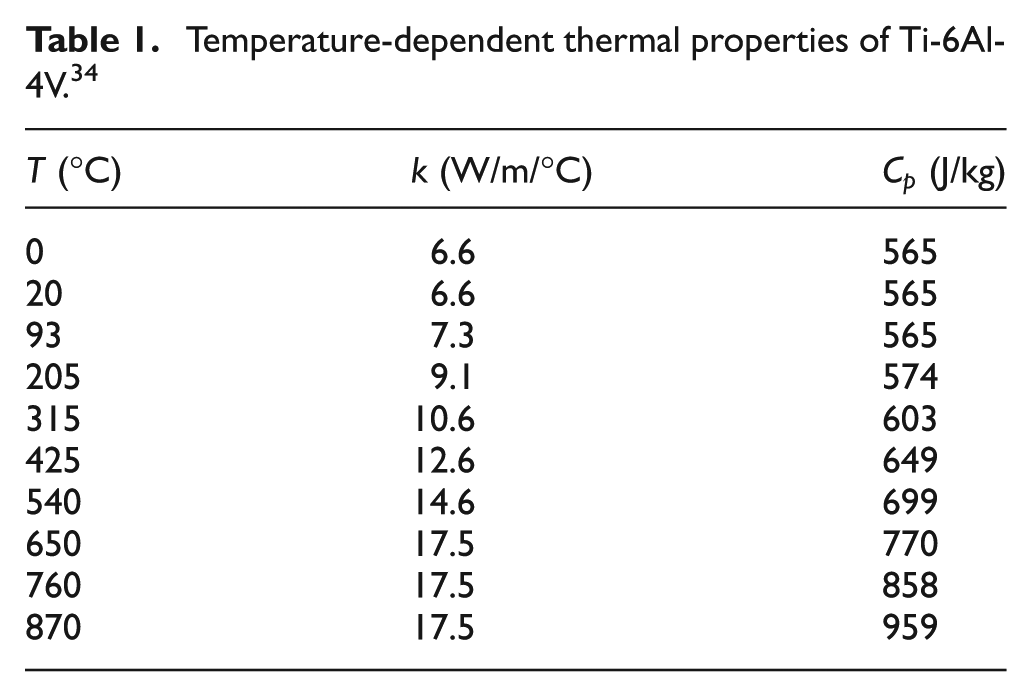
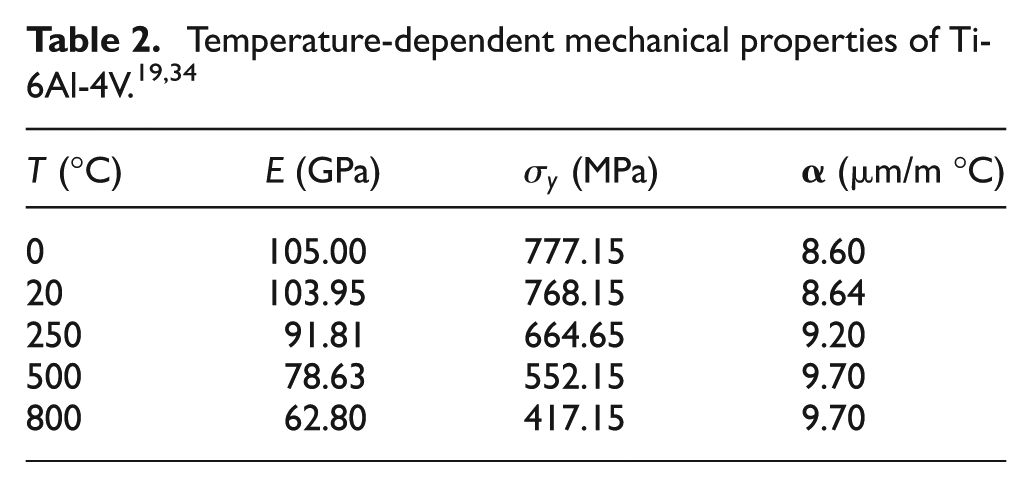
Table 1 lists the values of all temperature-dependent material properties (thermal conductivity
Temperature-dependent thermal properties of Ti-6Al-4V. 34
The electron beam heat source is modeled using the Goldak double-ellipsoid model as follows
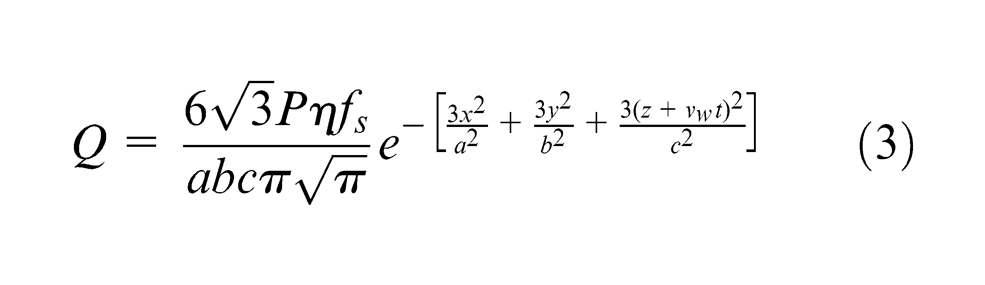
where
Radiation is applied to all free surfaces, including those of the newly deposited material, using the Stefan–Boltzmann law
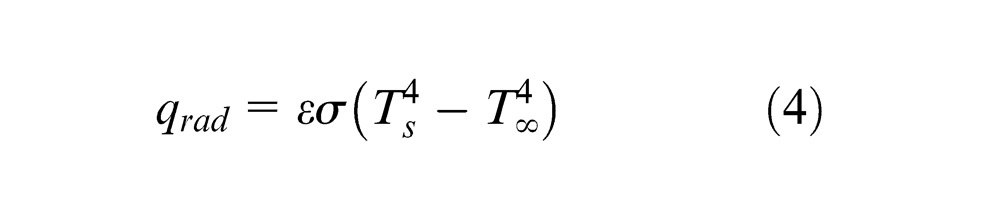
where
When the electron beam is on, the magnitude of the time increments is calculated such that the beam travels a distance equal to its radius as follows
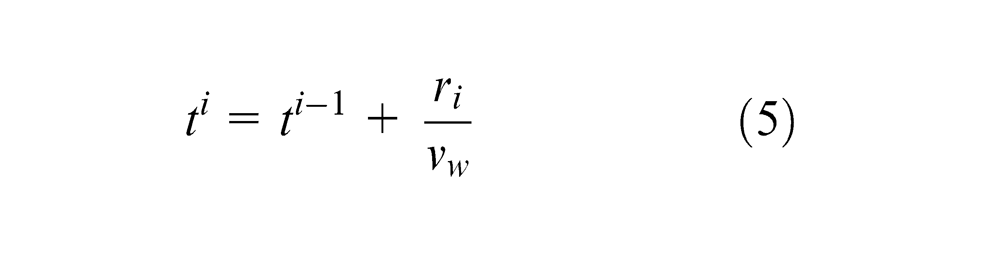
where
Mechanical analysis
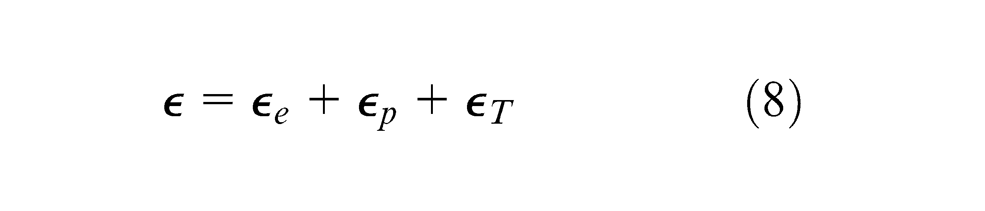
A thermal history–dependent, quasi-static mechanical analysis is performed to obtain the mechanical response of the workpiece during deposition. The results of the thermal analysis are imported as a thermal load into the mechanical analysis. The governing stress equilibrium equation is

where

where

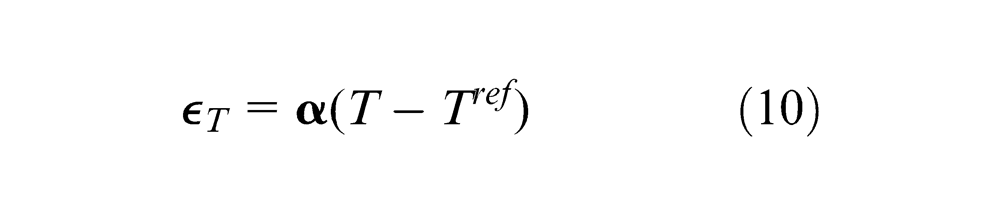
where
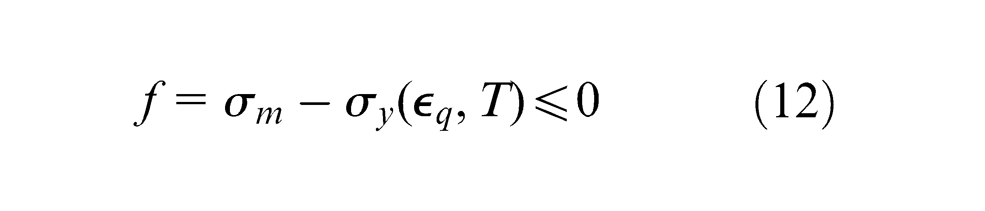

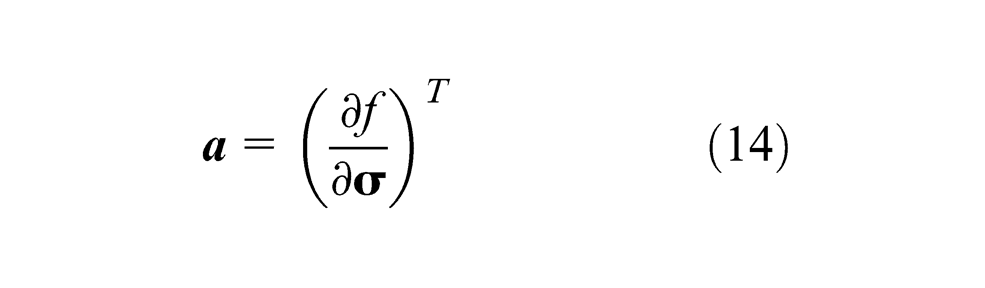
where
For an incremental formulation, equation (7) is re-written as
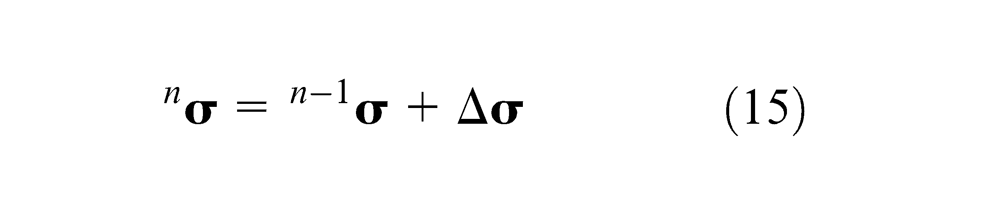
where
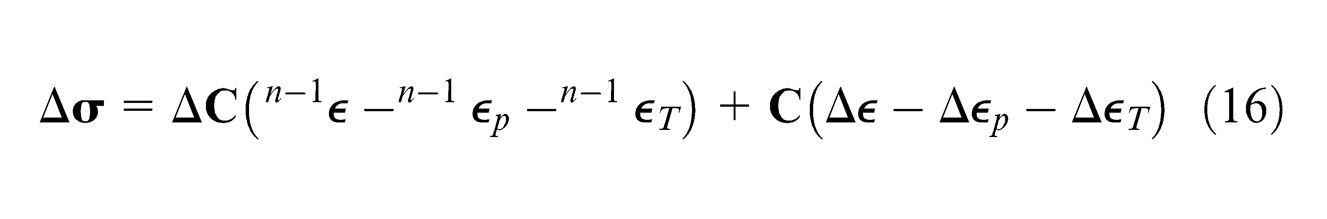
where left superscripts denote the time increment where a quantity is computed and
Incorporation of annealing in the constitutive system involves resetting the plastic strain
A stress relaxation is proposed in this work where instantaneous annealing and creep occurs when a stress relaxation temperature
Table 2 displays the temperature-dependent mechanical properties of Ti-6Al-4V, including the elastic modulus
Calibration and validation
Deposition process
Electron beam freeform fabrication is used to deposit Ti-6Al-4V in a vacuum chamber. A Ti-6Al-4V plate 254 mm long, 101.6 mm wide, and 12.7 mm thick is used as a substrate. The substrate is clamped at one end and cantilevered, allowing the unconstrained end to deflect freely, while monitored by a laser displacement sensor (LDS). Figure 1 shows the test fixture and constrained substrate after deposition.
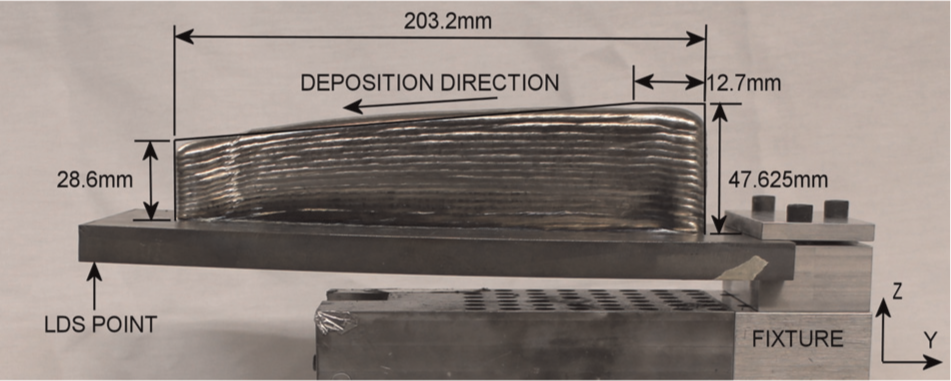
Sample mounted in the test fixture and a schematic of the approximated deposited geometry.
The AM system used is the Sciaky VX-300, which welds in the range of
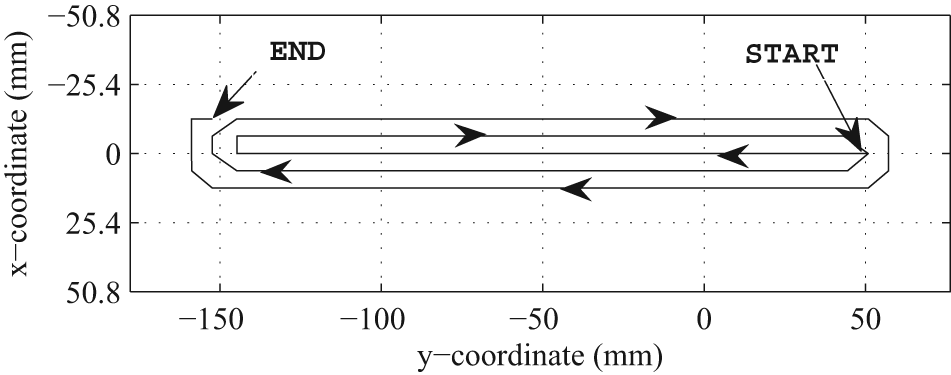
Scan pattern of the preheat performed on the top of the substrate.
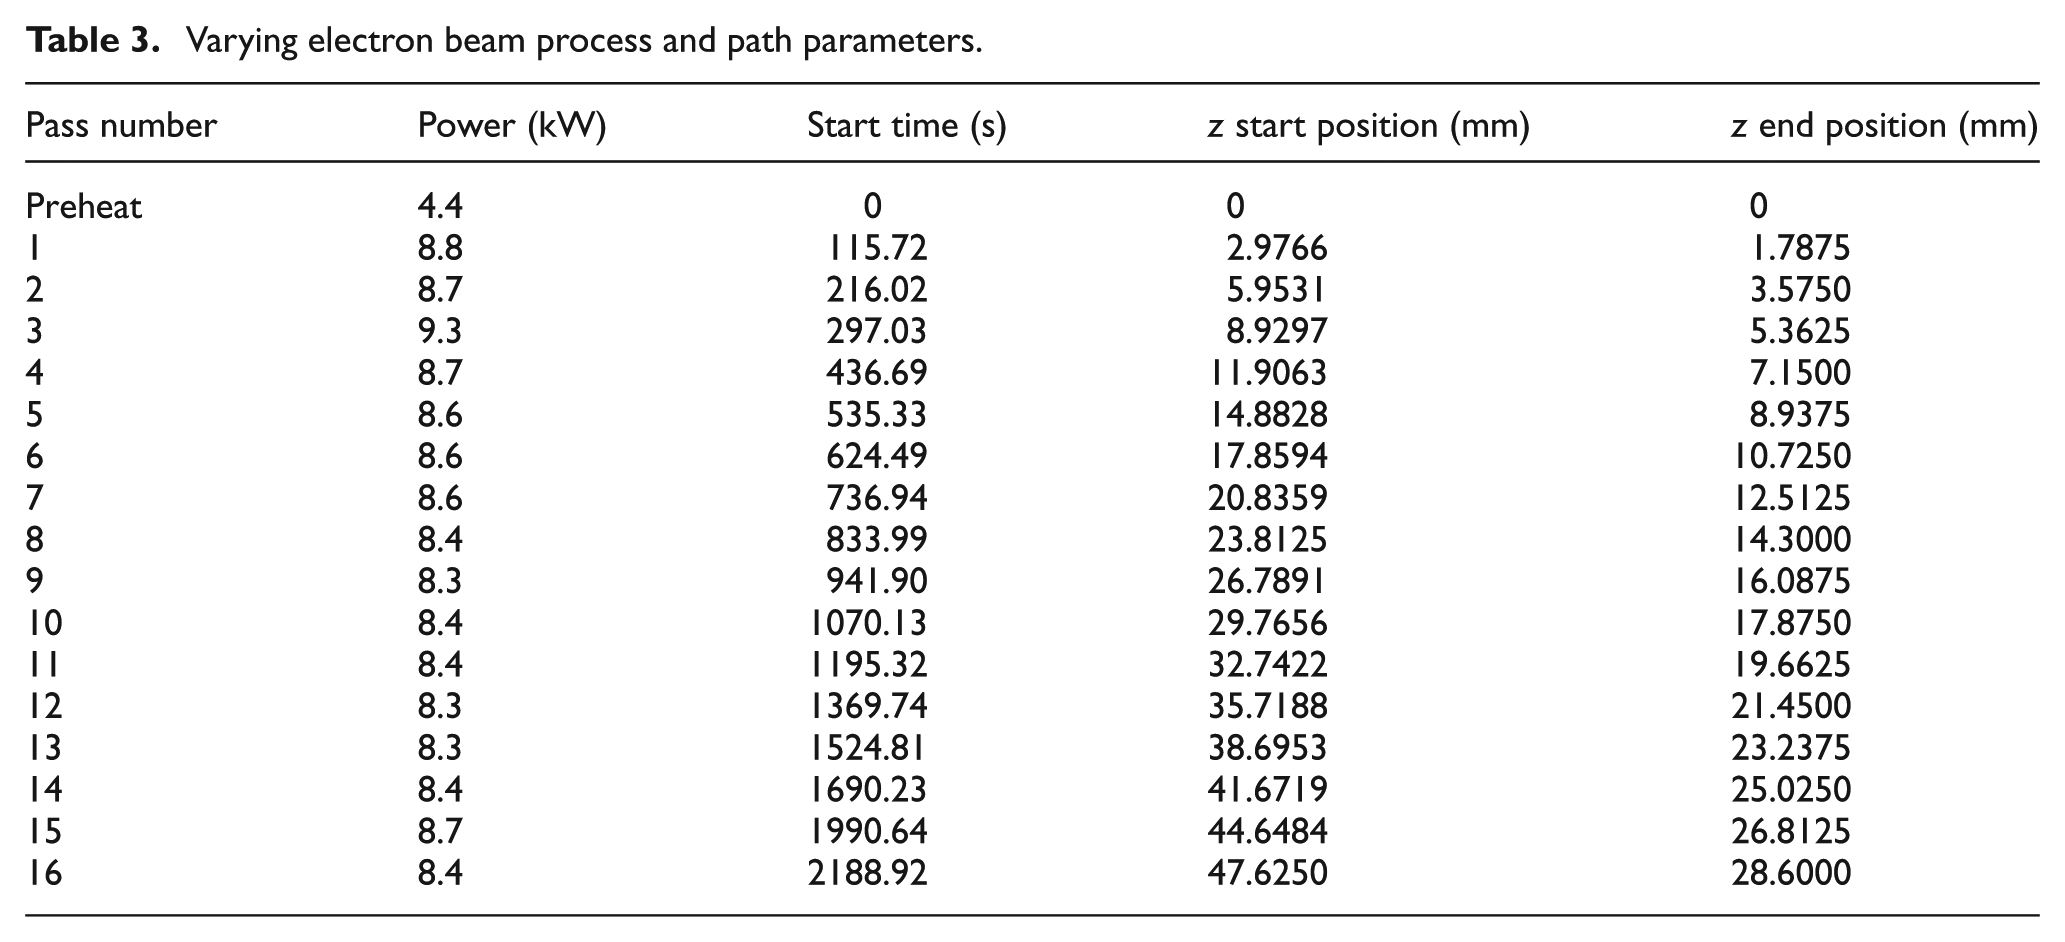
After heating the top surface of the substrate, a one-bead-wide deposition is built 16 layers high and 203.2 mm long. The wire feed rate is set to 50.8 mm/s. The scan speed is a constant 12.7 mm/s. The electron beam operates at a power varying between 8 and 10 kW. The power is fluctuated to control the melt pool size. Figure 1 shows the resulting deposited geometry. The sloped wall is approximated as being 47.625 mm high near the clamped end of the substrate and 28.6 mm high near the free end for the succeeding finite element modeling work. Table 3 shows, for each deposition layer, the average power and start time, as well as the beginning and ending z-coordinates.
Varying electron beam process and path parameters.
In situ distortion and temperature
In situ distortion measurements are taken using a Micro-Epsilon LDS, model LLT 28x0-100 and Micro-Epsilon controller scanCONTROL 28x0. The LDS is positioned to measure the longitudinal bowing distortion mode in the z-direction at the free end of the substrate, as shown in Figure 3(b). The LDS targets a point approximately 6.3 mm from the free end of the substrate. A National Instruments 9250 module reads the LDS analog voltage signal.
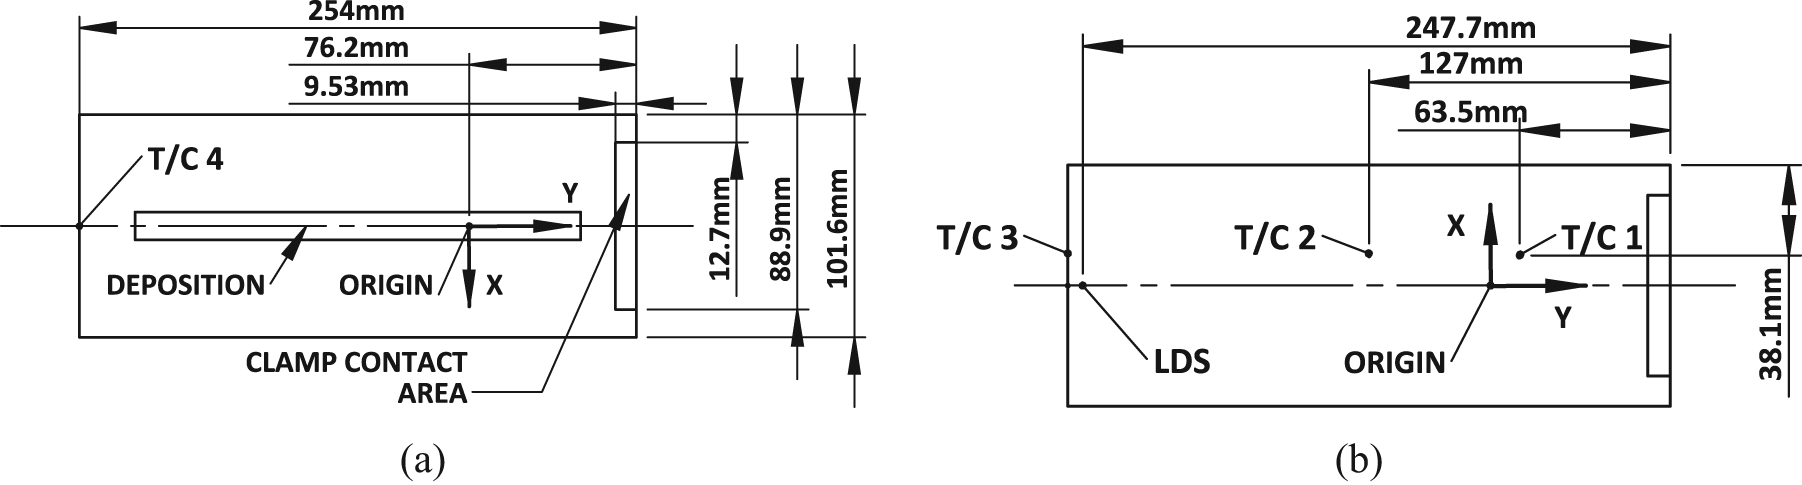
Schematic showing the LDS measurement location and the thermocouple (T/C) locations on the (a) top of the substrate and (b) the bottom of the substrate.
Figure 3 shows the locations of the four thermocouples (0.25 mm diameter) used to monitor in situ temperature. Thermocouples 1–3 measure the temperature on the bottom of the substrate, parallel to the axis of deposition, and are located 63.5 mm from the clamped end of the substrate, at the center of the substrate, and 6.35 mm from the free end of the substrate, respectively. Thermocouple 4 measures temperature along the axis of deposition, on the top edge, and at the free end of the substrate. The thermocouples are placed to allow for temperature readings at various substrate locations, without interfering with the LDS. A National Instruments 9213 module reads the thermocouple analog voltage signals. Both National Instruments modules record data into LabVIEW at a frequency of 20 Hz.
Residual stress
Post-process residual stress is measured using the hole-drilling method. Eight residual stress measurements are taken, seven measurements on the bottom of the substrate along the axis of deposition (see Figure 4(a)) and one measurement on the deposited material (see Figure 4(b)). The majority of the measurements are taken on the substrate, as it provides a large smooth surface appropriate for applying strain gauges and placing the milling guide. Micro-Measurements® strain gauges, model EA-06-062RE-120, are bonded to the bottom center of the substrate. Gauges are calibrated using the procedure described in manufacturer engineering data sheet U059-07 and technical note 503. The ASTM E837 drilling process is followed. Incremental drilling is done using RS-200 Milling Guide and high-speed drill from Micro-Measurements®. A 1.52-mm-diameter, carbide-tipped, Type II Class 4A drill bit was used. Strain measurements are read by a Micro-Measurements® P-3500 Strain Indicator. Bridges are balanced with a Micro-Measurements® Switch and Balance Unit, model SB-1.
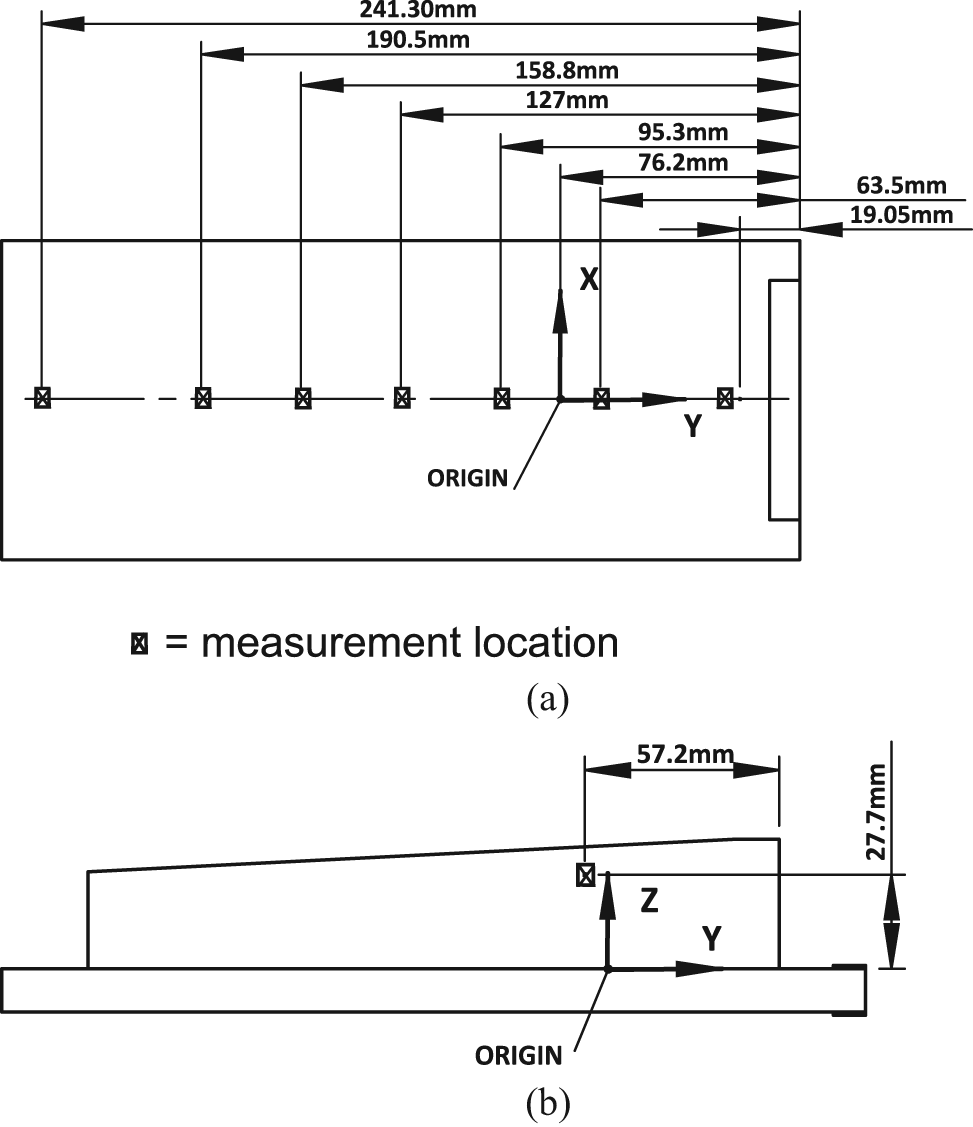
Schematic showing the locations of the residual stress measurements (a) on the bottom of the substrate and (b) on the build portion.
Numerical implementation
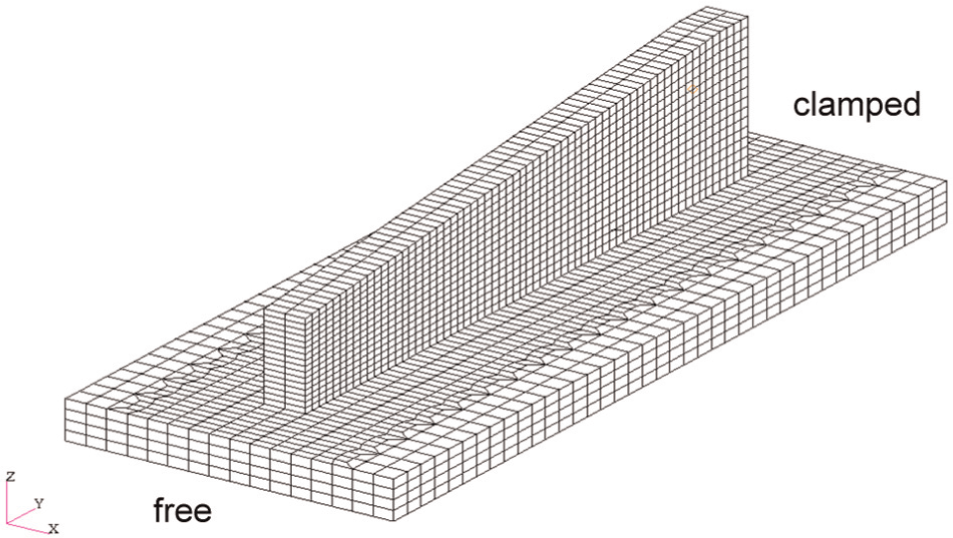
Figure 5 displays the 3D finite element mesh used for both the thermal and mechanical analyses. The mesh contains 6848 Hex-8 elements and 9405 nodes. The mesh is generated using Patran 2012 by MSC. The mesh allots one element per deposition thickness and one element per heat source radius. A mesh convergence study was performed using two and then four elements per heat source radius resulting in 1.47% and 7.17% peak change, respectively, in the computed temperatures at the nodes corresponding to thermocouples and a 1.02% and 2.85% average change, respectively, at the nodes corresponding to thermocouples. However, the mesh with one element per heat source radius is used in this work because computational efficiency is critical in modeling electron beam deposition. The thermal and mechanical analyses are performed using the code CUBIC by Pan Computing LLC.
14
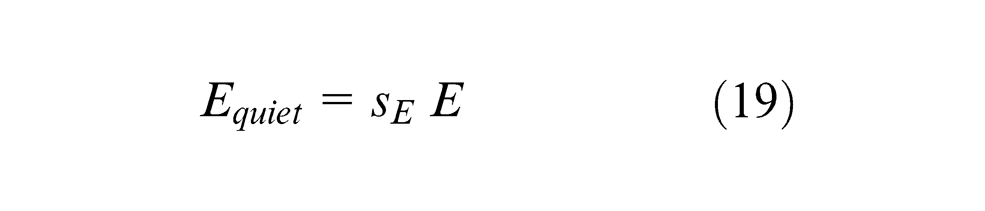
The quiet element activation approach is used in this work, where elements representing the metal deposition regions are present from the start of the analysis. However, they are assigned properties so that they do not affect the analysis. For the heat transfer analysis, the thermal conductivity
Mesh generated for the thermal and the mechanical analyses.
where
For the mechanical analysis, the quiet elements are assigned a lower elastic modulus
where
Figure 6 illustrates the mechanical constraints applied to the model. Three corner nodes on the clamped end of the substrate are constrained to model clamping the end of the substrate.
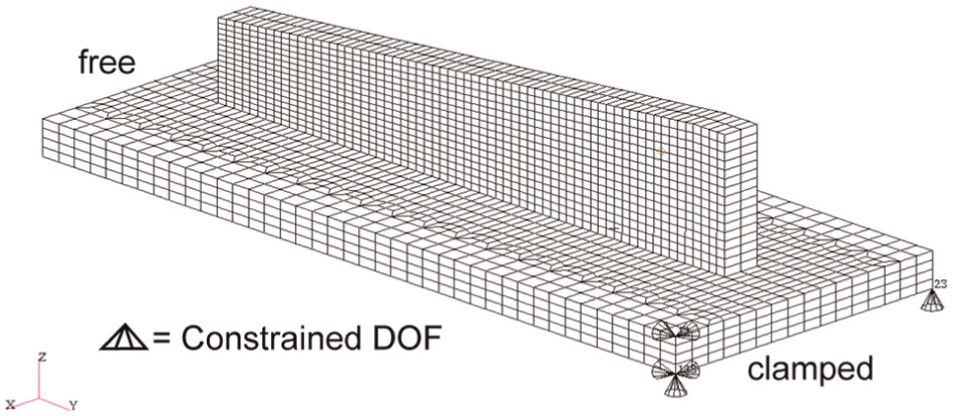
Mechanical constraints used to fix the clamped end of the substrate.
The numerical model is calibrated, using inverse simulation, as in Aarbogh et al.,
36
to determine the unknown values of efficiency
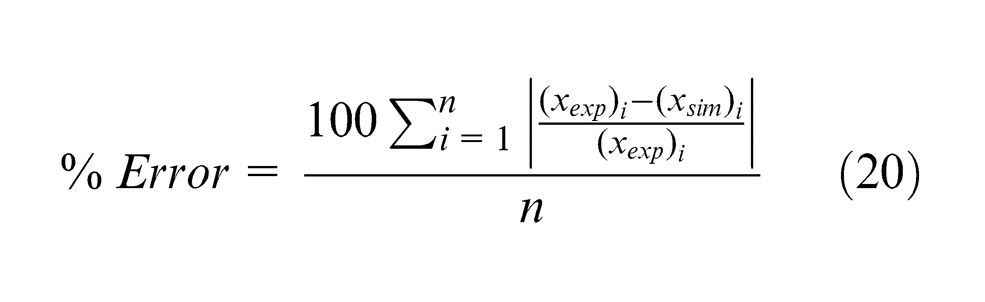
Efficiencies are varied from 0.90 16 to 0.95, 37 based on the available literature. The emissivity is varied from 0.44 to 0.69. 38 The percent error is calculated as
where
The results from the calibrated thermal model are imported as a thermal load into the mechanical simulation. The mechanical model is calibrated by adjusting the relaxation temperature
Results and discussion
Thermal history
Table 4 shows the results of the simulated cases used to calibrate the thermal model. The efficiency
Cases examined for thermal model calibration.
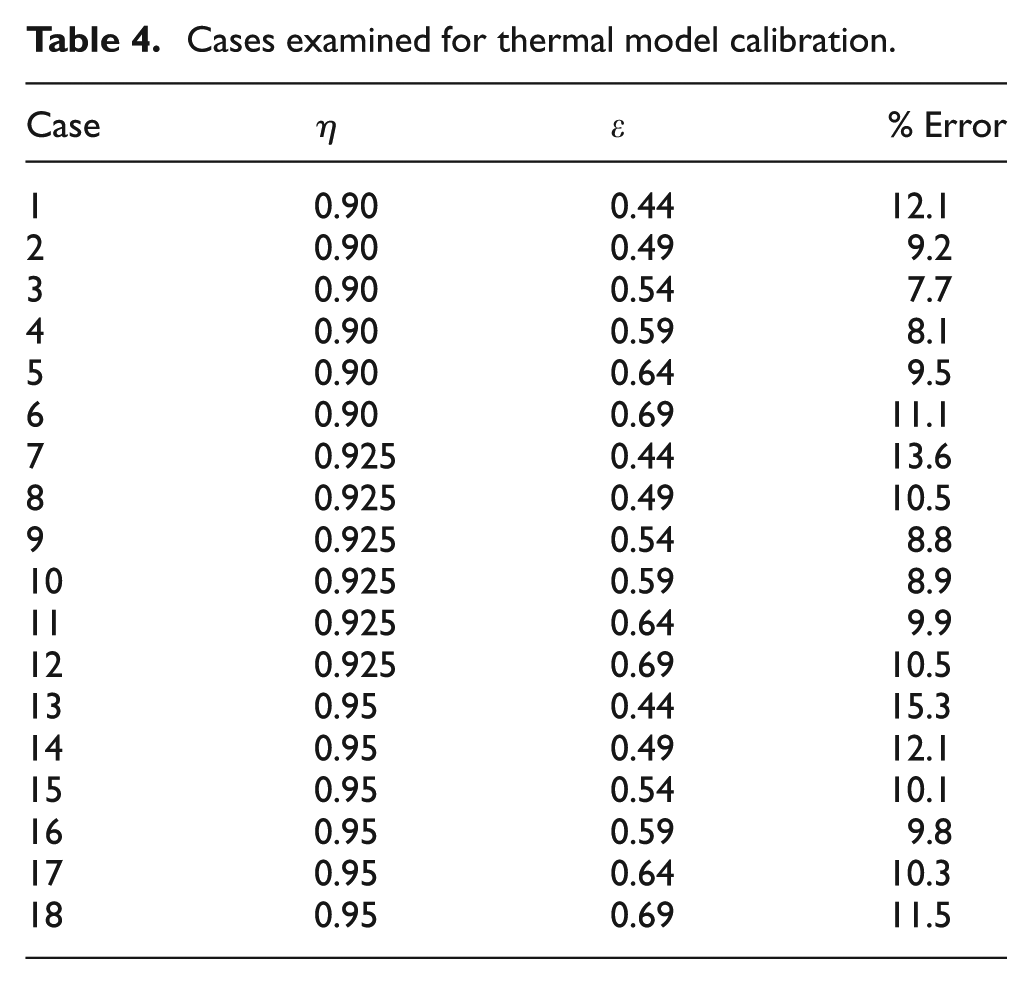
Figure 7 displays the thermal histories experimentally measured by the four thermocouples compared with the simulation results for the calibrated process efficiency of η = 0.90 and emissivity of ε = 0.54 at nodes corresponding to the locations of the thermocouples. A process time of 0 min corresponds to the start of the preheat. The ambient temperature is approximately 25 °C. Thermocouple 2 (located in the middle of the bottom of the substrate) records the highest temperature. Thermocouple 3 (located in the bottom of the substrate near the clamped end) records the lowest temperature, as it is nearest to the clamp which absorbs heat through conduction. Although the process efficiency
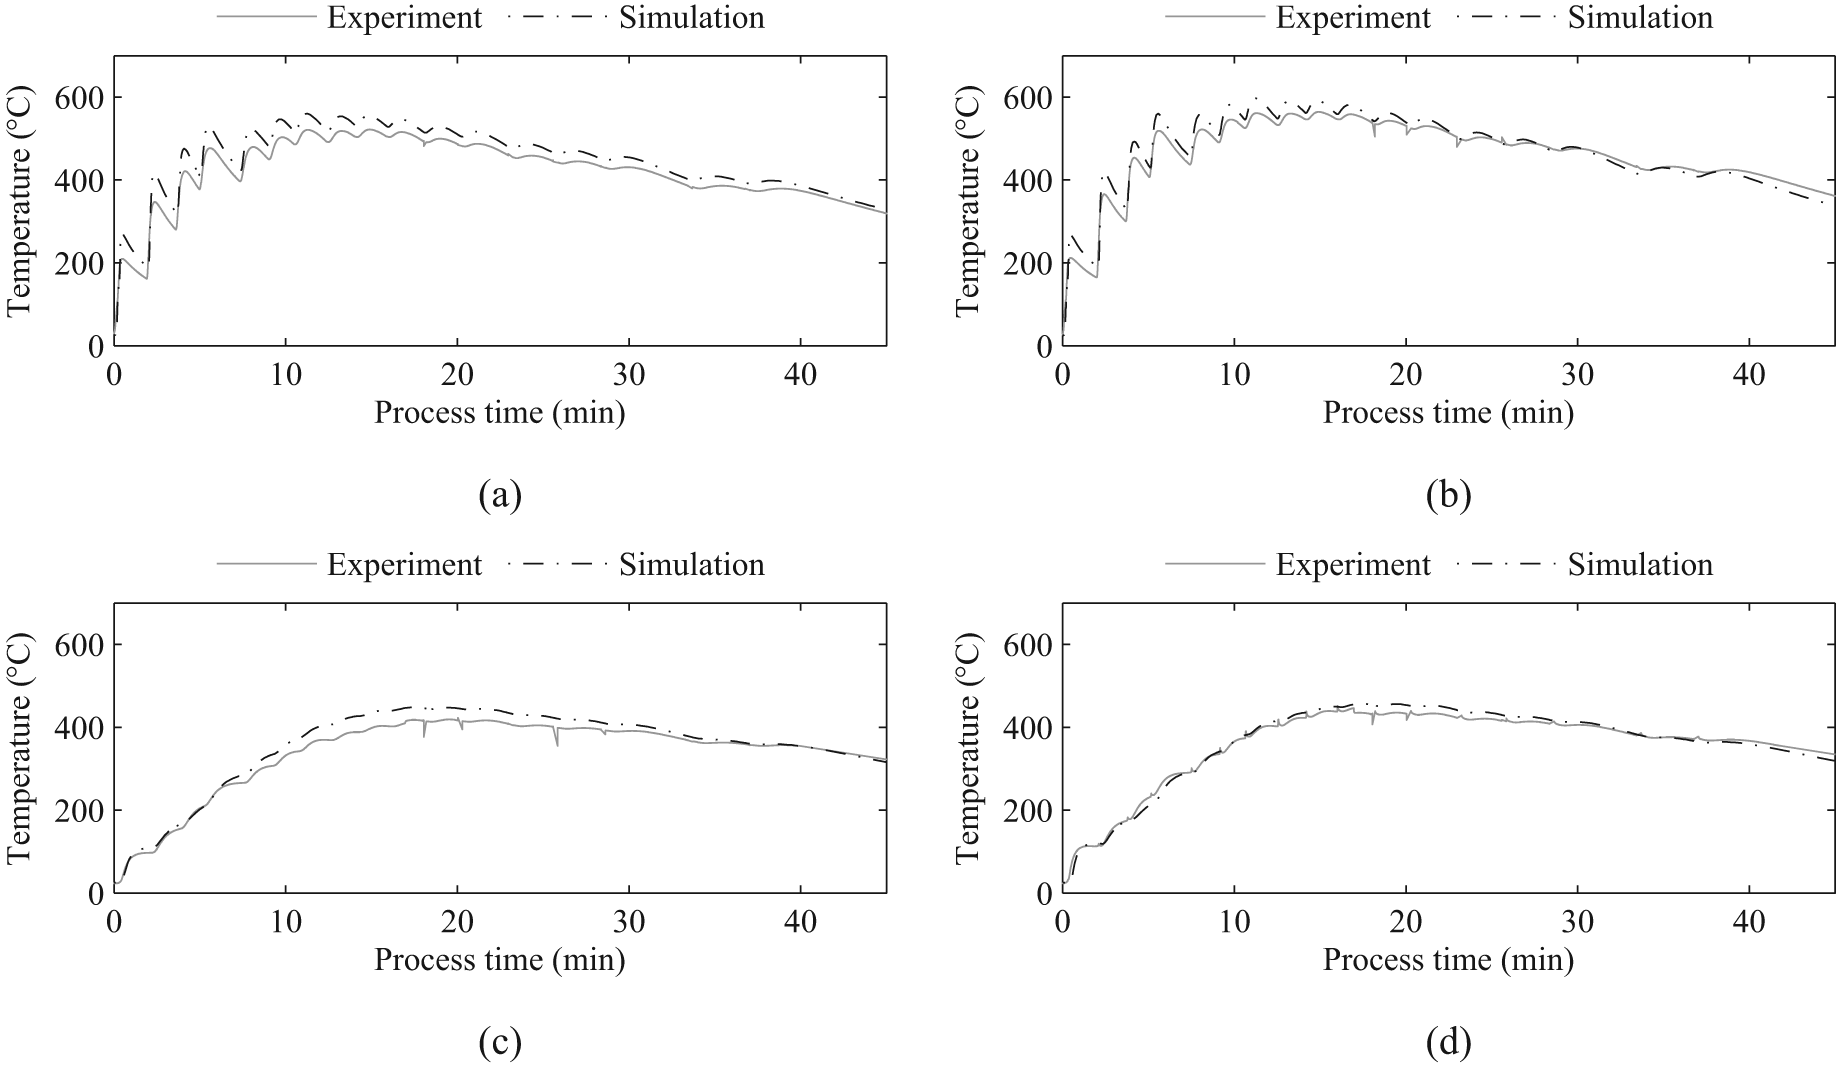
Computed thermal history with η = 0.90 and ε = 0.54 compared with the experimental measurements. (a) Thermocouple 1, (b) Thermocouple 2, (c) Thermocouple 3, and (d) Thermocouple 4.
Distortion history
Table 5 lists the results of the simulated cases run to investigate the effect of changing the relaxation temperature on the in situ distortion. A final error is also computed by comparing the post-process experimental distortion with the post-process simulation distortion. A stress relaxation temperature of 690 °C provides results in closest agreement with the experimental post-process distortion.
Cases examined for mechanical model calibration.
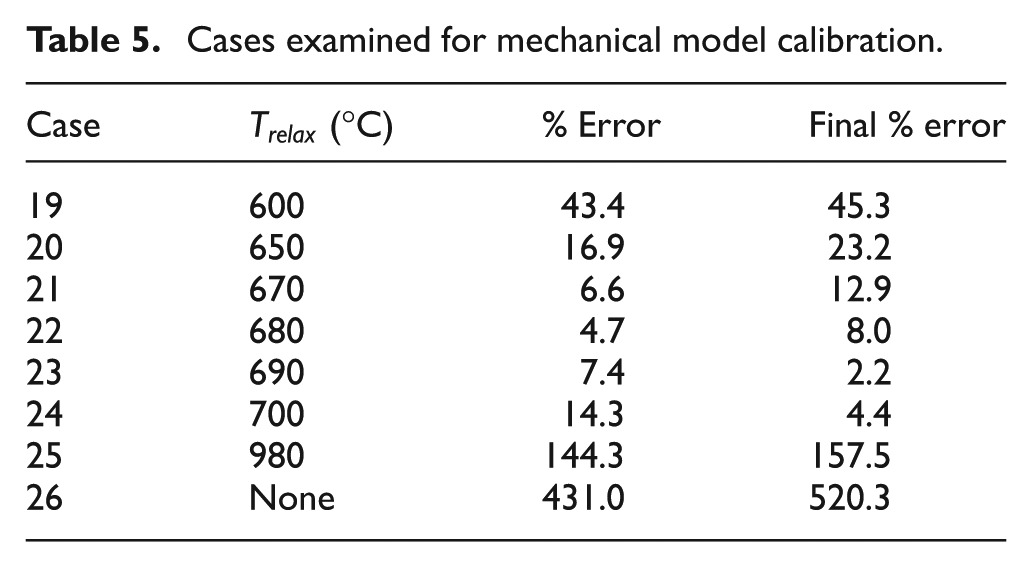
Figure 8 illustrates the computed model distortion at the LDS point for selected relaxation temperatures. As seen in the figure, no relaxation (Case 26) results in a nearly linear increase in distortion with time up to 20 min. The increase rate becomes lower afterward. The distortion trend is quite different from that of the LDS measurement which shows a decrease in distortion after 7 min of processing. Also, the final distortion is over-predicted by 520.3%. A high relaxation temperature (case 25, 980 °C) exhibits a similar distortion trend when compared to that with no relaxation, but with lower magnitudes. The distortion is still over-predicted by 157.5%. Case 23 with
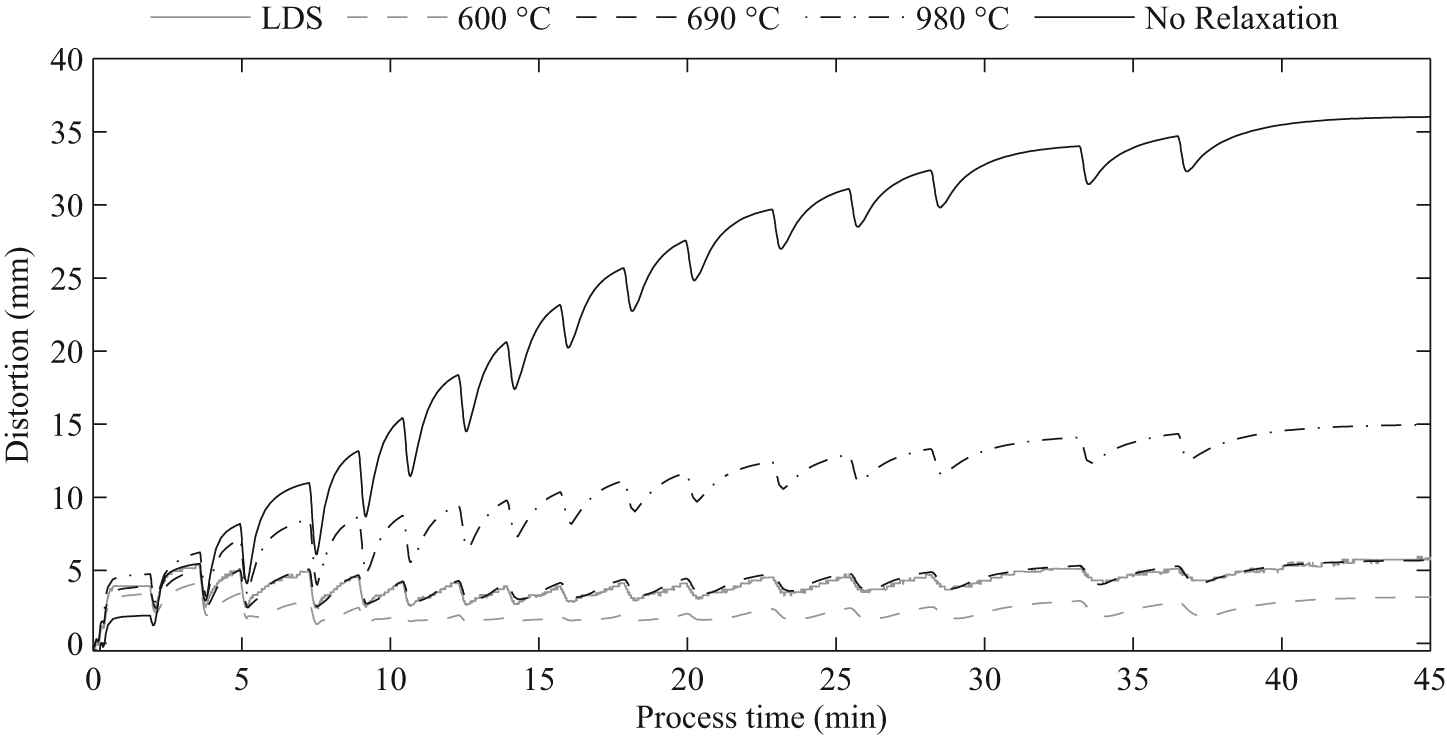
Computed distortion histories at various stress relaxation temperatures compared with the experimental measurement.
Figure 9 shows the post-process distorted shape of the workpiece as predicted by the calibrated model. The maximum distortion occurs at the free end of the substrate. Figure 10 displays a close-up of the in situ measured distortion and the computed results for the calibrated relaxation temperature of 690 °C. It is noted that although the relaxation temperature is calibrated to match the in situ measured distortion, a very good correlation (7.4% error) is achieved for the entire duration of the process.
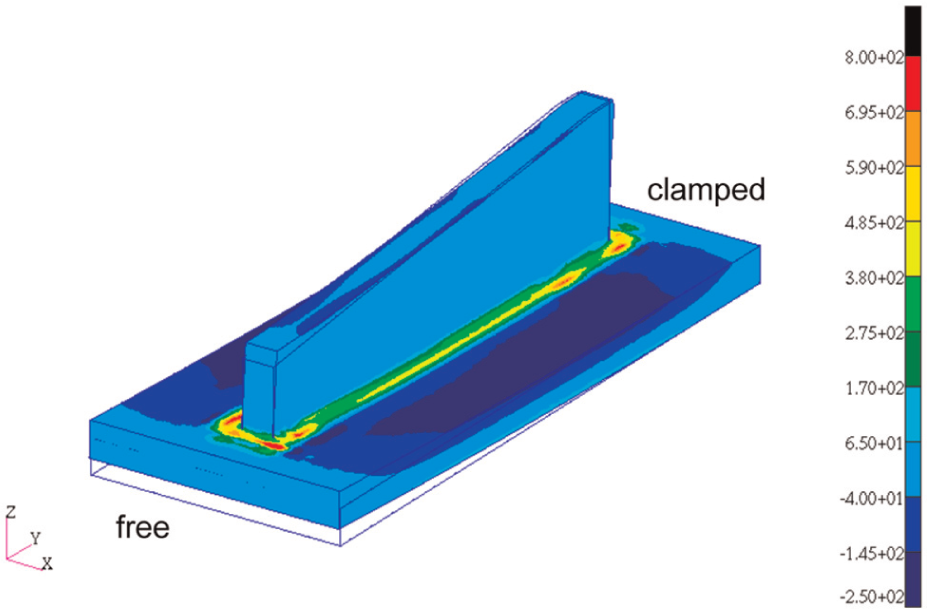
Final post-process distortion (1× magnification) and longitudinal
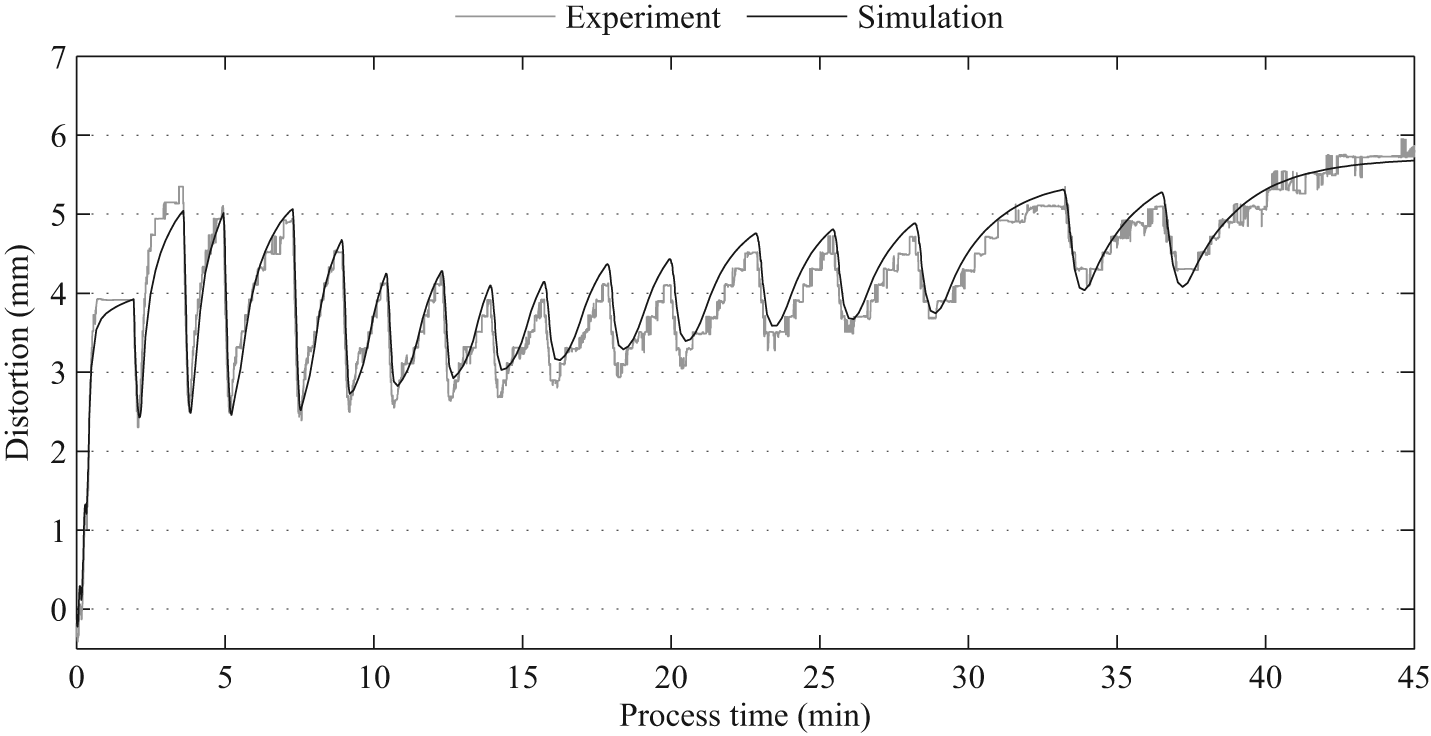
Computed in situ distortion at the LDS point compared with the experimental results.
Residual stress
Figure 11 displays the computed post-process longitudinal component of the residual stress at nodes on the bottom of the substrate along the axis of deposition as well as experimental values at corresponding locations. Computed results for no stress relaxation (case 26) and stress relaxation temperature of
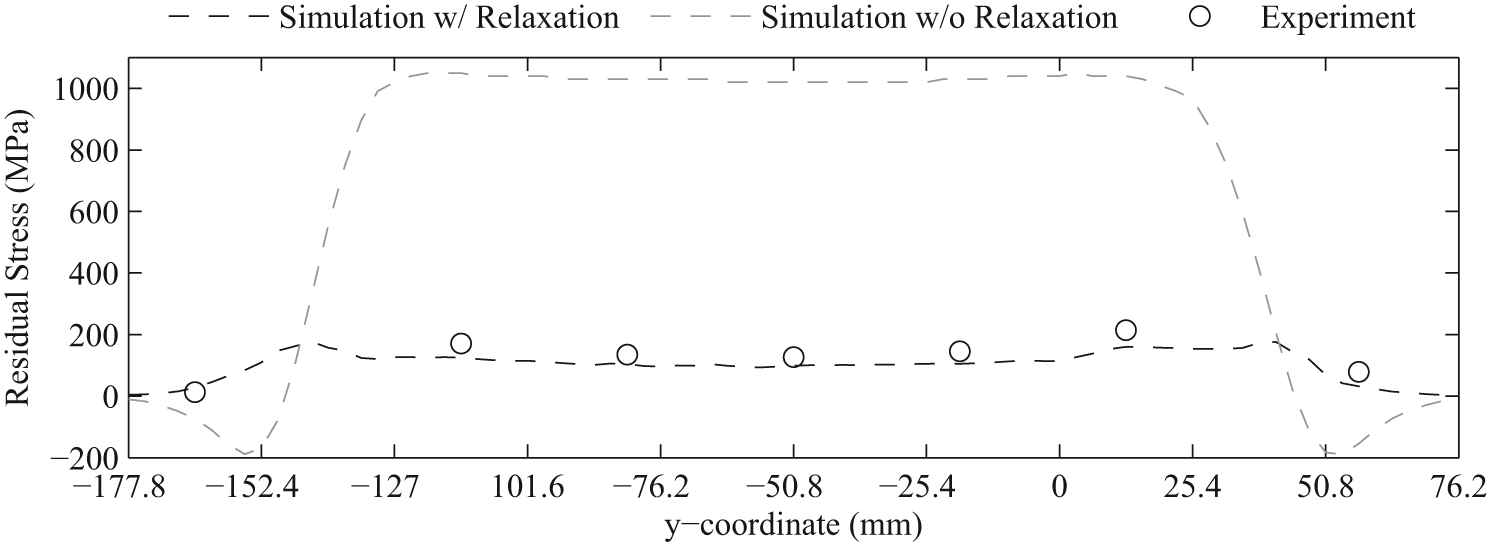
Computed residual stress results with and without stress relaxation, compared with the experimental measurements along the axis of deposition.
Conclusion
A finite element model is developed for predicting the thermo-mechanical response of Ti-6Al-4V during electron beam deposition. A 3D thermo-elasto-plastic analysis is performed, and experimental in situ temperature and distortion measurements are performed during the deposition of a single-bead-wide, 16-layer-high wall build for model validation. Post-process blind hole–drilling residual stress measurements are also performed.
Both the in situ distortion and post-process residual stress measurements suggest that stress relaxation occurs during the deposition of Ti-6Al-4V. A method of accounting for such stress relaxation in thermo-elasto-plastic simulations is proposed where both stress and plastic strain is reset to 0, when the temperature exceeds a prescribed stress relaxation temperature.
Inverse simulation is performed to determine the values of the absorption efficiency and the emissivity of electron beam–deposited, wire-fed Ti-6Al-4V, as well as the appropriate stress relaxation temperature. An efficiency of 0.90 and an emissivity of 0.54 result into the best correlation between measured and computed temperature history. Both values are in agreement with those published for laser-assisted machining and powder-based AM. A stress relaxation value of 690 °C is found to provide the best correlation between in situ measured and computed distortion. The results show that failure to implement stress relaxation in the constitutive model leads to errors in the residual stress and the in situ distortion predications of over 500% when compared with the experimental measurements.
Suggested future work includes sectioning and microstructural analysis of the test piece and establishing a correlation with the computed results. In addition, the possibility of a gradual stress relaxation model should be investigated to compare with the instantaneous model used in this work. This would require further testing to establish the suitable rate of relaxation.
Footnotes
Appendix 1
Declaration of Conflicting Interests
The author(s) declared no potential conflicts of interest with respect to the research, authorship, and/or publication of this article. (Distribution Statement A: Approved for Public Release, Distribution Unlimited).
Funding
The author(s) disclosed receipt of the following financial support for the research, authorship, and/or publication of this article: This work was sponsored by a subcontract from Sciaky Inc. and funded by AFRL SBIR FA8650-11-C-5165. Jarred Heigel contributed to this work under funding from NSF Grant No. DGE1255832. Any opinions, findings, and conclusions or recommendations expressed in this material are those of the authors and do not necessarily reflect the views of the National Science Foundation. The authors would also like to acknowledge the partial support for this research by the Open Manufacturing program of the Defense Advanced Research Projects Agency and the Office of Naval Research through Grant N00014-12-1-0840. Any opinions, findings, and conclusions or recommendations expressed in this material are those of the authors and do not necessarily reflect the views of the National Science Foundation, the Department of Defense or the US government.