
Abstract
An arc sensor for reciprocating wire feed gas metal arc welding was developed to detect the torch height and track weld joints. The welding voltage waveform was adopted for the characteristic signal because the welding current remains almost constant with a change in the contact tip-to-workpiece distance. During reciprocating wire feed gas metal arc welding, the voltage waveform changes in an inherently complicated but periodic manner. After recognizing the voltage waveform pattern, the voltage characteristic for each phase was analyzed for arc sensing, and it was revealed that the short-circuit and cycle voltage characteristics were good estimators for torch height sensing. The dynamic arc sensing characteristics for reciprocating wire feed gas metal arc welding were investigated and found to be similar to those of a conventional constant voltage welding system. The seam tracking capability was evaluated by using the voltage integration difference method with transverse torch weaving. The voltage integration difference showed a linear relationship with the offset distance, and the reliability of the joint tracking sensor could be increased by using the moving average algorithm.
Keywords
Introduction
The concept of gas metal arc welding (GMAW) was introduced in the 1920s, and GMAW is now used in a wide variety of industrial applications. 1 In GMAW, a welding arc is established between the end of a continuously fed electrode and the weld pool, and the metal droplet melted at the end of the wire is transferred into the welding pool. The length of the gas metal arc is inherently less stable than that in gas tungsten arc welding, in which the welding arc is established between a non-consumable tungsten electrode and the weld pool. Because an unstable welding arc can lead to a loss of weldability, it is important to control the gas metal arc, and numerous digital control technologies for the welding power source have been introduced.2,3 In the last decade, a new control technology concept called “reciprocating wire feed” (RWF) was industrialized by some power source manufacturers such as Fronius and Panasonic welding systems.3,4 In RWF-GMAW, the wire is not only pushed toward but also drawn back from the workpiece, and the current waveform is synchronized with the wire motion. 5 In previous studies on RWF-GMAW, the heat input was reduced for welding thin sheets,6,7 the spatter generation was suppressed even under a pure CO2 shielding condition, 8 and the gap bridging capability was improved up to 2 mm in the lap joint welding of two sheets. 9 More recently, the application of RWF-GMAW was expanded to thick plate welding. Staufer 10 showed that RWF-GMAW could be incorporated with the conventional pulsed GMA welding as a tandem welding system, which provided a significant improvement in welding productivity. The RWF-GMAW process was also applied to the root pass welding of butt joints using thick plates, and stable back beads were formed without any backing plates even when the root gap varied from 0 to 4 mm and from 2 to 4 mm. 11 Moreover, the fatigue strength could be improved by performing the root welds without a backing plate, compared with those with a steel backing plate. 12
In the automated welding of thick plates, weld seam tracking is a problem that should not be ignored because positional variation inevitably exists as a result of thermal distortion during welding, inaccurate joint preparation, tack beads, robot teaching error, and so on. Among the sensing techniques used to detect and track the weld seam, through-arc sensing (arc sensor) using the electrical signals obtained from the welding arc is known to be the most effective because the arc sensor enables real-time control, no auxiliary parts are required around the welding torch, and coaxial monitoring is possible. 13 In the conventional GMAW system, a constant voltage (CV) power source is widely employed for the automatic regulation of the arc length. 1 In earlier studies, the relationships between the contact tip-to-workpiece distance (CTWD) and the welding current were investigated using the CV power source with theoretical and empirical approaches.13–15 The welding current is inversely proportional to the CTWD, and the torch height can be estimated from the measured welding current. In V-groove and fillet welding, the seam tracking using an arc sensor is usually accompanied by torch weaving across the joint. A U-shaped current waveform is observed because of the effect of molten pool motion and the arc pressure, although the original joint has an angled shape. When the center of the torch weaving coincides with the center of the weld seam, the current waveform is symmetric about the center position. When the center of the torch weaving deviates from the center of the seam, that is, if there is an offset between the centers of the torch weaving and the seam, the current waveform has an asymmetrical shape.16,17 The position of the weaving center can be corrected to follow the weld seam by compensating for the offset distance calculated from the asymmetrical current waveform. The sensitivity and reliability of the arc sensor in a dynamic state have been evaluated in experimental and theoretical investigations.18–21 During a quasi-steady state, that is, when the weaving frequency is relatively low (≪1 Hz), the phase difference between the welding current waveform and the change in CTWDs is almost 180°. However, when the weaving frequency is relatively high (≥1 Hz), the phase difference between them varies in a dynamic manner, which can lead to poor joint tracking and sometimes a collision of the torch with the structure. The application of an arc sensor has expanded to seam tracking for welding Al alloy 22 and end point detection.23,24 Recently, an arc sensing system for current-controlled pulse GMA welding was investigated, 25 and an arc length detection algorithm was suggested that used the arc signal and wire feed speed (WFS) in RWF-GMAW. 26 However, to the best of the author’s knowledge, there has been no study on seam tracking during RWF-GMAW.
In this study, the relationship between the arc signals and the CTWDs was investigated during the static and dynamic states for RWF-GMAW, and the sensitivity and phase response of an arc sensor were derived for various torch oscillation frequencies. Finally, the arc signals were analyzed using the torch weaving in V-groove welding with various offset distances between the centers of the weaving motion and the weld joint.
Experimental system
The overall experimental apparatus used is shown in Figure 1. In the experiments, a mild steel plate was used as the base material, and an AWS ER 70-S electrode with a diameter of 1.2 mm was used. Ar-CO2 20% shielding gas was supplied at a flow rate of 20 L/min. A Fronius CMT 3200 was used as the RWF-GMAW power source, and it was operated in the cold metal transfer (CMT) mode, where the built-in database provides appropriate waveforms for the welding parameters, including the welding current, voltage, and wire feeding, according to a given average WFS. Figure 2 shows typical waveform patterns for RWF-GMAW, 8 including three pulsing phases (boost, burning, and short-circuit). The welding current and voltage were measured and recorded during welding by using a data acquisition (DAQ) system (NI 9229 module) with a sampling frequency of 5 kHz and a cutoff frequency of 2.265 kHz.
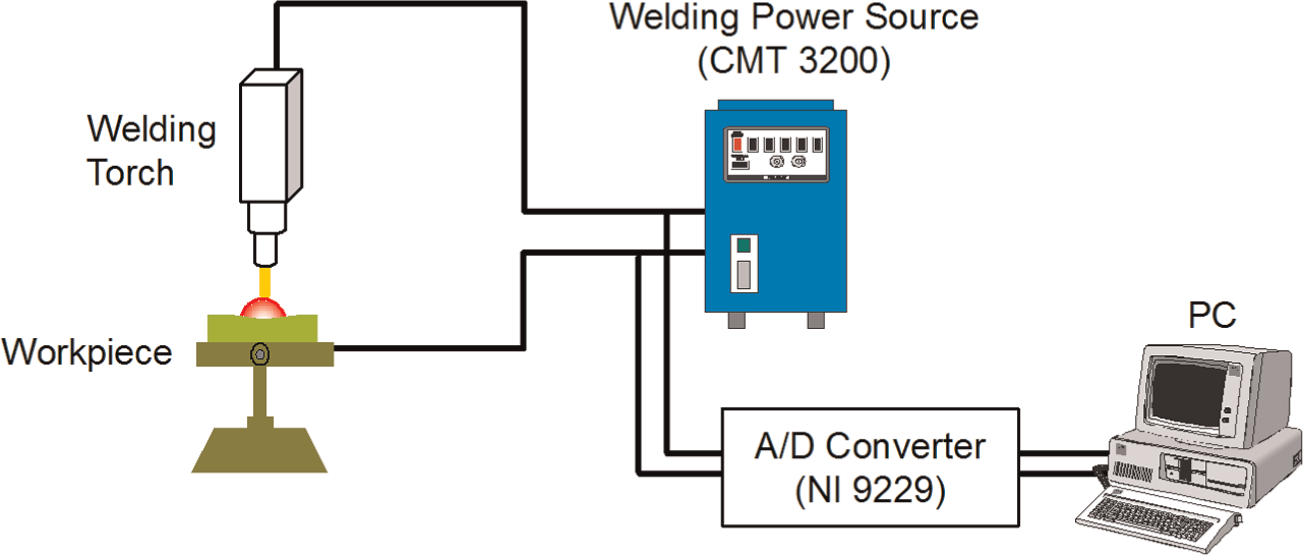
Schematic diagram of experimental system.
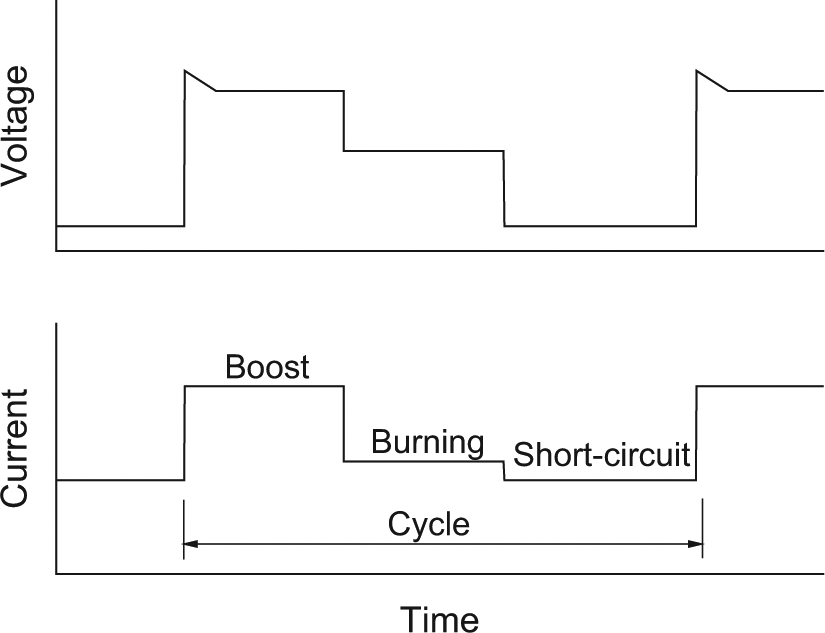
Typical waveforms for welding parameters of RWF-GMAW. 8
Results and discussion
Static characteristics
Bead-on-plate welding was conducted for fixed CTWDs, and the welding current and voltage waveforms were measured for 5 s to evaluate the static characteristics for height sensing. The WFS varied from 73.3 to 100.0 mm/s, and the CTWD varied from 11 to 19 mm, whereas the welding speed was fixed at 8.33 mm/s. The welding current and voltage were measured and arithmetically averaged for each condition, and given in Figures 3 and 4. At a given WFS, the average welding current was maintained at an almost constant value, whereas the average welding voltage was increased with an increase in CTWD.
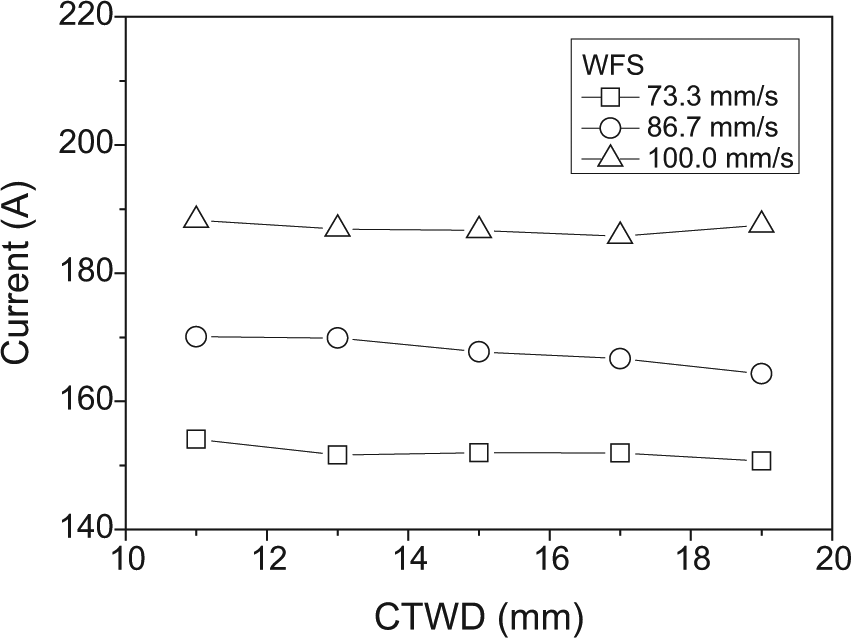
Average welding currents for various CTWDs and WFSs.
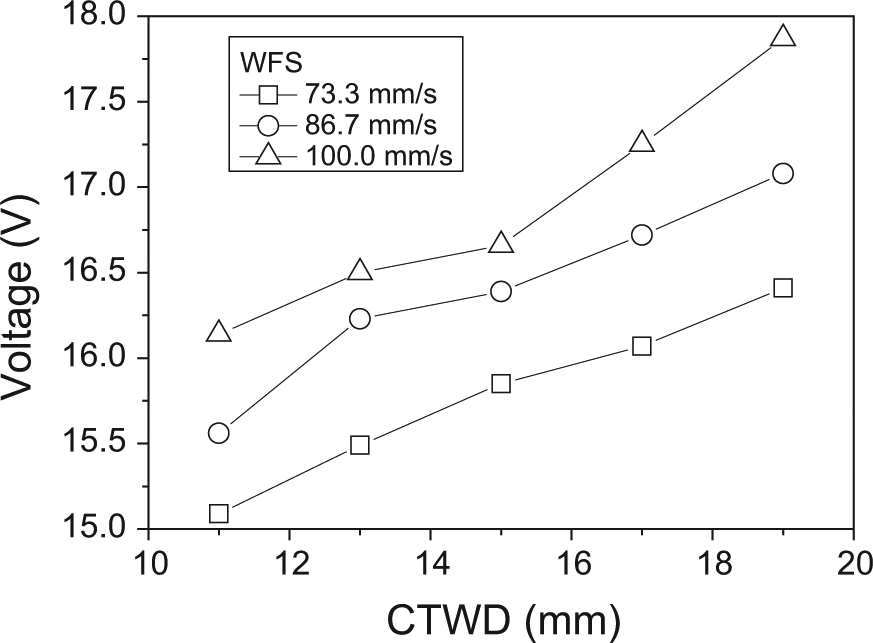
Average welding voltages for various CTWDs and WFSs.
In the conventional GMA welding system, a CV characteristic is employed, so the welding current is inversely proportional to CTWD. In RWF-GMAW, the welding parameters are digitally controlled in a more sophisticated manner. Short-circuiting is detected by analyzing the welding voltage waveform, and the wire electrode is retracted backward from the molten pool.5,8 The arc length can be mechanically controlled by adjusting the retracting WFS and time during the boost phase. 26 The sum of the welding currents for the arcing phase (i.e. the boost and burning phases) should be maintained to melt a given average WFS per period, which produces almost constant current characteristics regardless of the change in CTWD. The welding voltage consists of the arc voltage and the voltage drop across the wire extension. In RWF-GMAW, the arc length in the arcing phase is nearly constant. Thus, the increase in CTWD brings about an increase in the voltage drop across the wire extension.
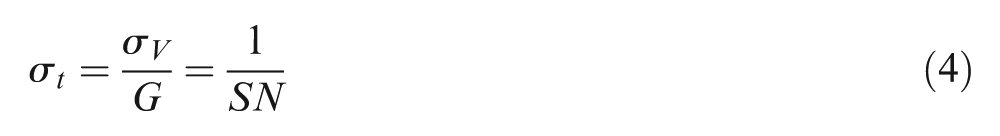
In the RWF-GMAW process, the voltage waveform is inherently fluctuating, and the signals were analyzed for each phase. Figure 5 shows the relationship between CTWD and the measured voltage characteristics for four different phases, including the average values for the boost, burning, and short-circuit phases and for an entire single cycle. Hereafter, these voltage characteristics are called the boost, burning, short-circuit, and cycle voltage characteristics, respectively. In Figure 5, the dots and error bars indicate the average values and standard deviations (SDs) of the voltage characteristic for each phase, respectively. Similar relationships were found, except in the case of using the burning voltage characteristic. For a more quantitative comparison, the signal-to-noise (SN) ratio was defined as follows
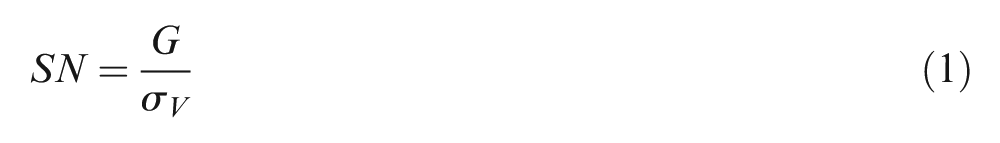
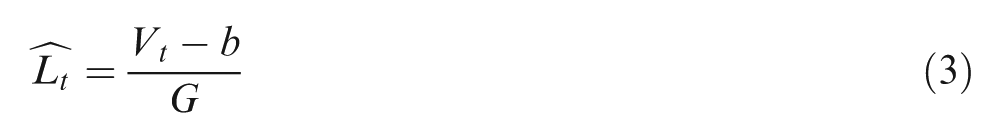
where G is the change in the voltage characteristic per unit change of CTWD, and σV is the SD of the voltage. From the measured voltage characteristics for each CTWD, the relationship between CTWD and the welding voltage characteristic can be linearly fitted as follows

where Vt is a voltage characteristic, Lt a CTWD, and b a fitting coefficient. Figure 6 shows the SN ratio for various WFSs and pulsing phases, where the averaged SD in the signal for each CTWD was used for σV. The SN ratios for the short-circuit voltage characteristic were the highest with the SN ratios for the cycle voltage characteristic as second highest.
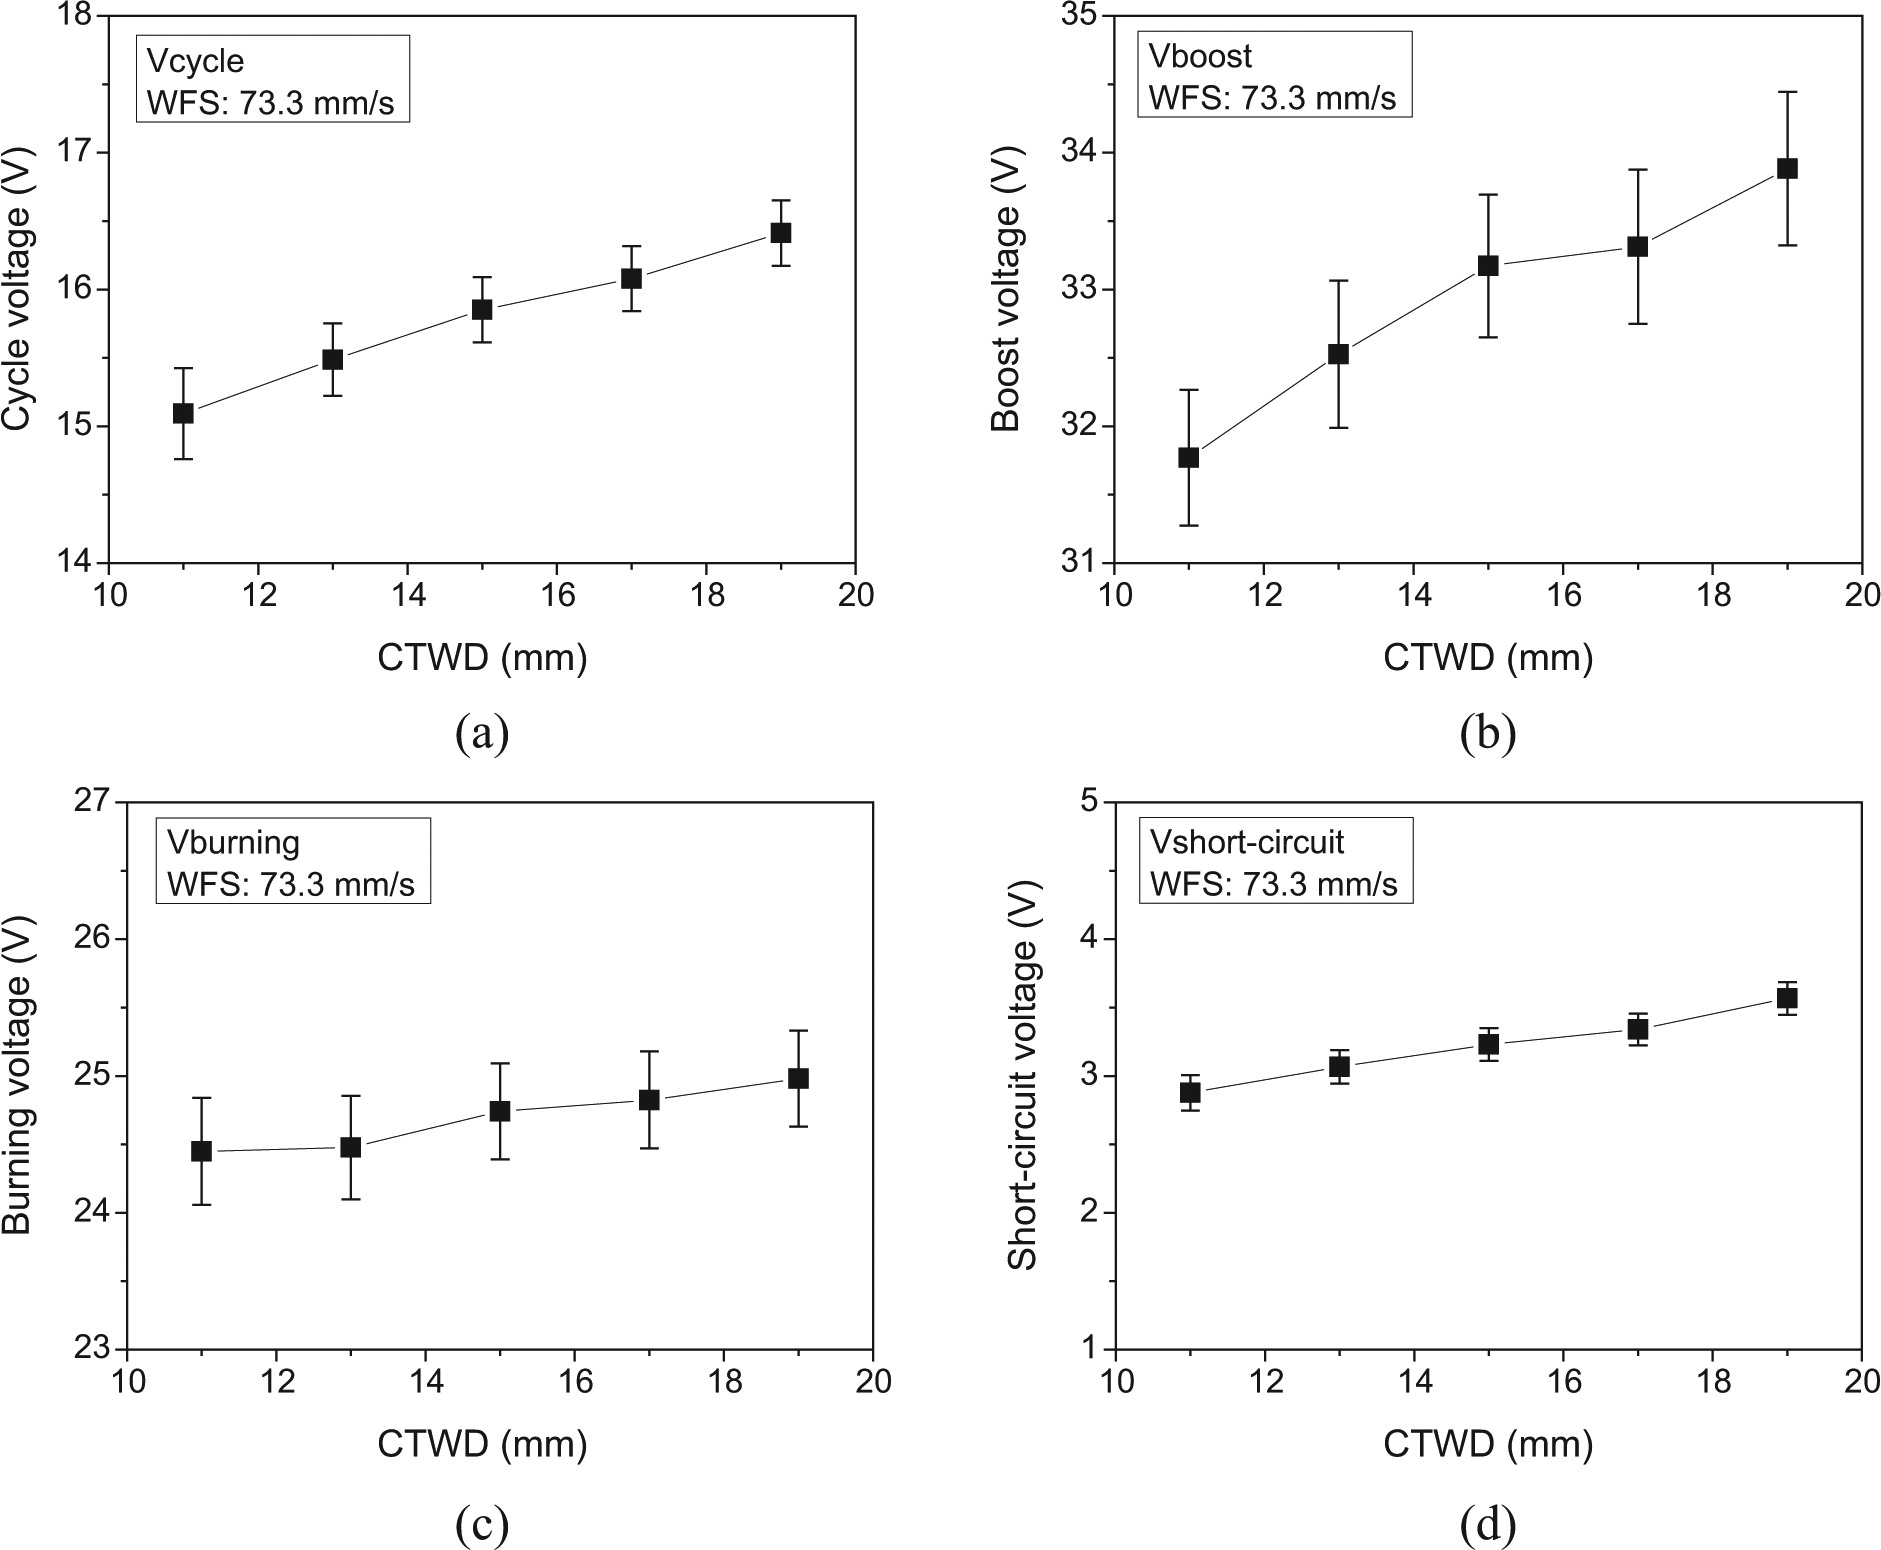
Welding voltage characteristics for various CTWDs: (a) average per cycle, (b) boost phase, (c) burning phase, and (d) short-circuit phase.
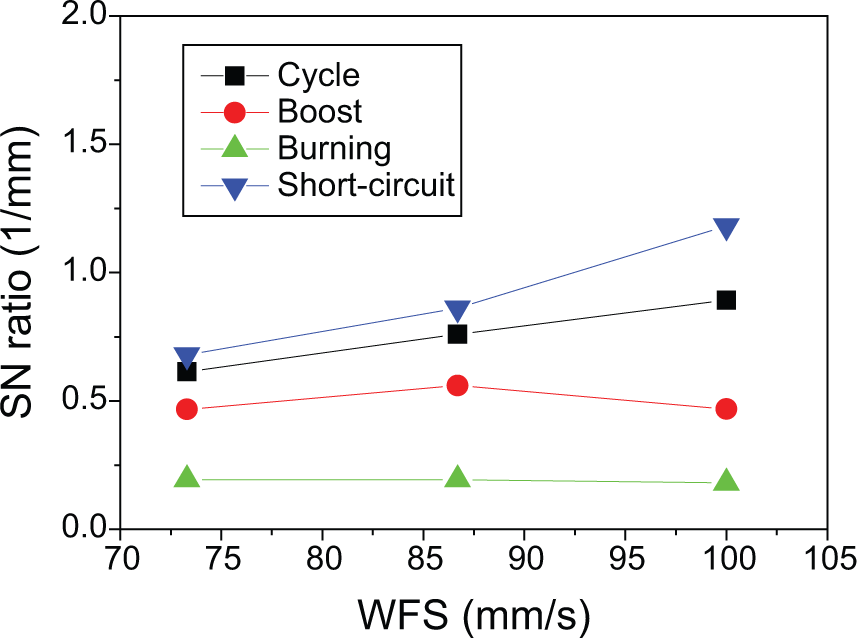
Calculated S/N ratios for various WFSs and voltage characteristics.
From equation (2), the CTWD estimated from the voltage characteristic and the SD for the CTWD estimation can be given as follows
where
where
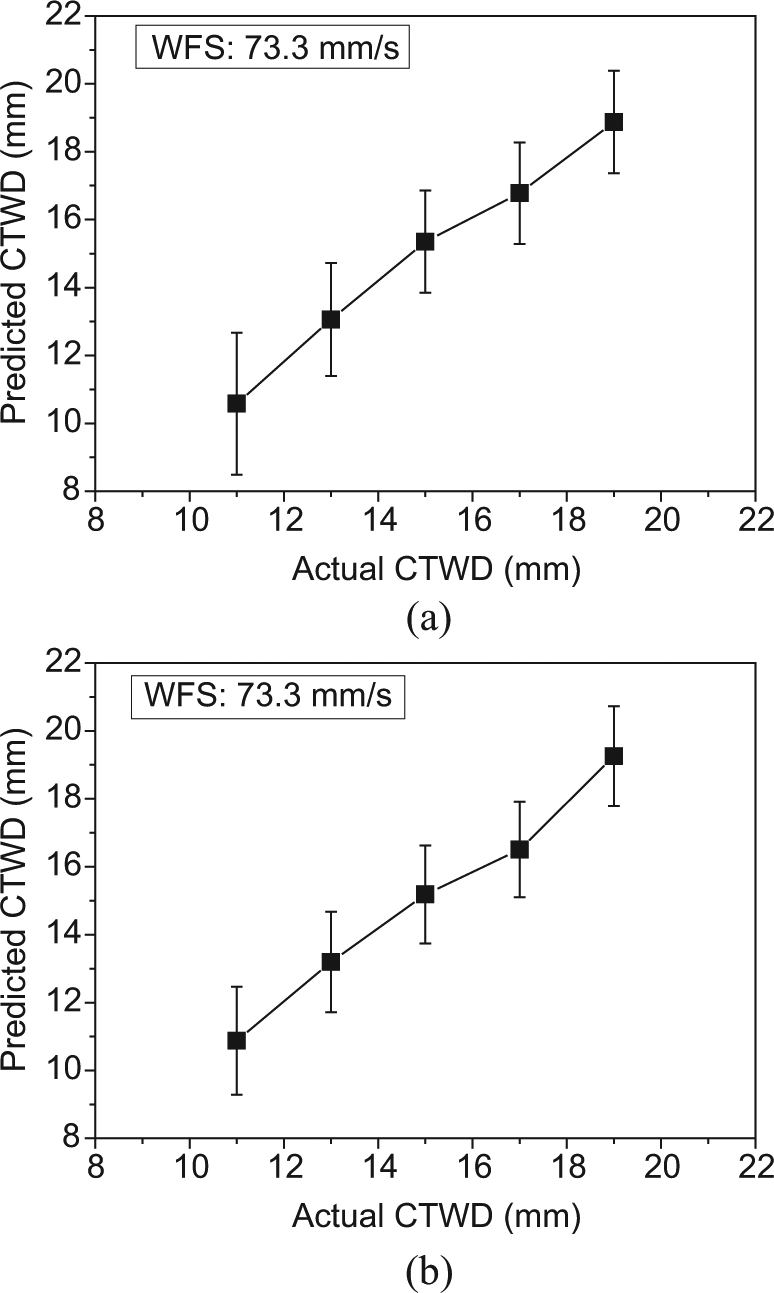
Comparison between actual and predicted CTWDs: (a) cycle voltage characteristic and (b) short-circuit voltage characteristic.
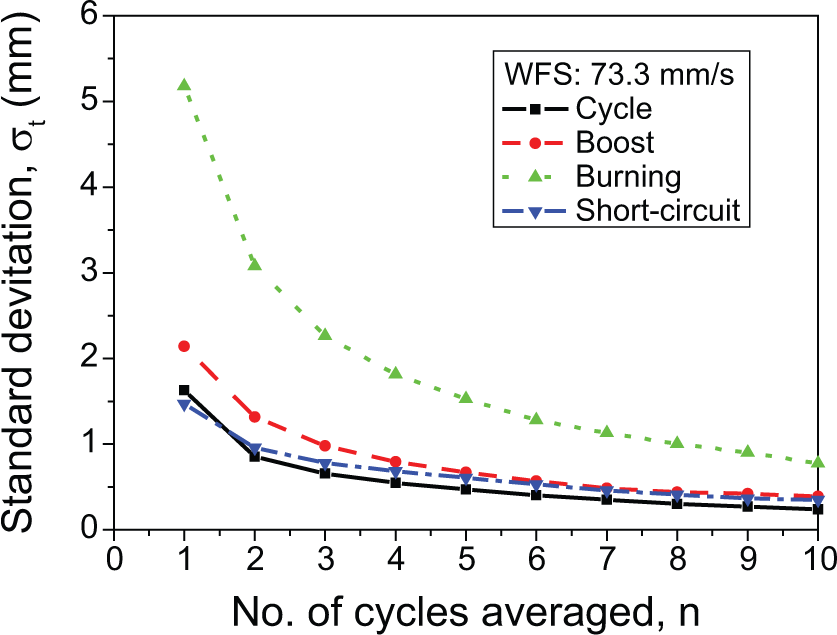
Standard deviation of estimated CTWD using moving average.
Dynamic characteristics
Two kinds of experiments were conducted to evaluate the dynamic characteristics. In the first set of experiments, bead-on-plate welding was performed on a specimen inclined at an angle of 15° using various welding speeds, from 3.33 to 8.33 mm/s, which resulted in an increase in CTWD with a rate from 0.893 to 2.223 mm/s. The WFS was fixed at 100 mm/s. When welding the inclined specimen, the cycle voltage characteristic continuously increased with the increase in CTWD, and its slope was proportional to the rate of CTWD change, as shown in Figure 9. By linearly fitting the measured voltage characteristic, the slopes were found to be 0.188, 0.214, and 0.258 V/mm for CTWD change rates of 0.893, 1.563, and 2.223 mm/s, respectively, whereas the slope for the static experimental data was 0.162 V/mm, as shown in Figure 5(a). This means that the voltage characteristic changes with the CTWD in a dynamic manner. When welding with a conventional CV power source, it is known that the dynamic performance of the arc sensor is determined by the power source characteristics, dynamic behavior of the wire melting, welding conditions, and so on.19,20
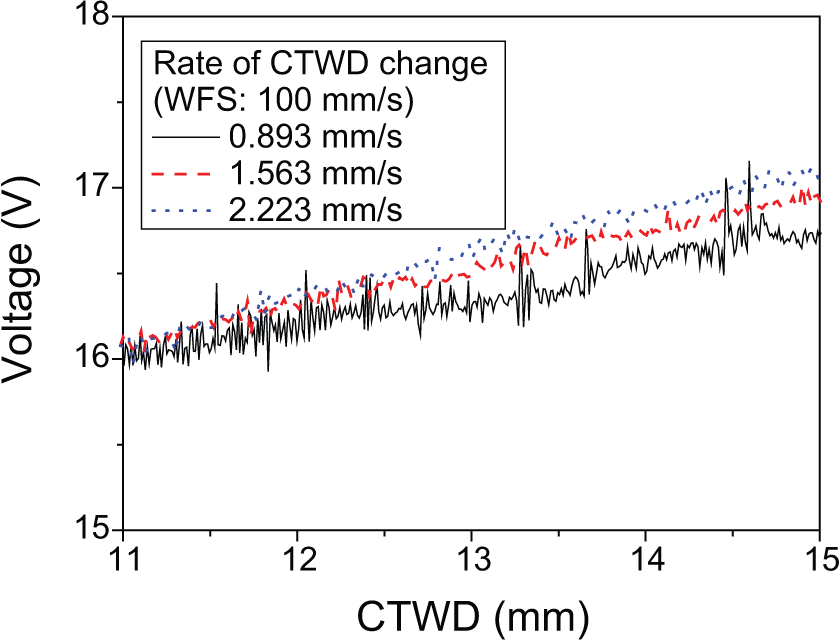
Measured cycle voltage characteristic when welding on inclined specimen.
In the second set of experiments, high-frequency torch oscillation was implemented with a torch vibration device using a pendulum oscillator to evaluate the high-frequency dynamic behavior. The torch height was sinusoidally oscillated with an amplitude of 2 mm and various frequencies from 1 to 10 Hz. The welding speed and WFS were fixed at 8.33 and 86.7 mm/s, respectively. As shown in Figure 10, the amplitude of the waveform of the measured cycle voltage characteristic increased with increasing torch oscillation frequency. The phase of the measured voltage characteristic was advanced from that of the torch motion, and its tendency was more complicated than that of the amplitude response. Figure 11 summarizes the amplitude and phase responses of the voltage sensing. Among the measured data, the maximum phase difference was 95.1° at 3 Hz, and its tendency was very similar to that of the experimental results using the conventional CV welding power source, which resulted from the overall inductance of the welding loop (i.e. the welding power source and welding cable). 19 In the design of the seam tracking arc sensor, the frequency characteristics, especially in high-frequency weaving, should be considered to prevent tracking error.
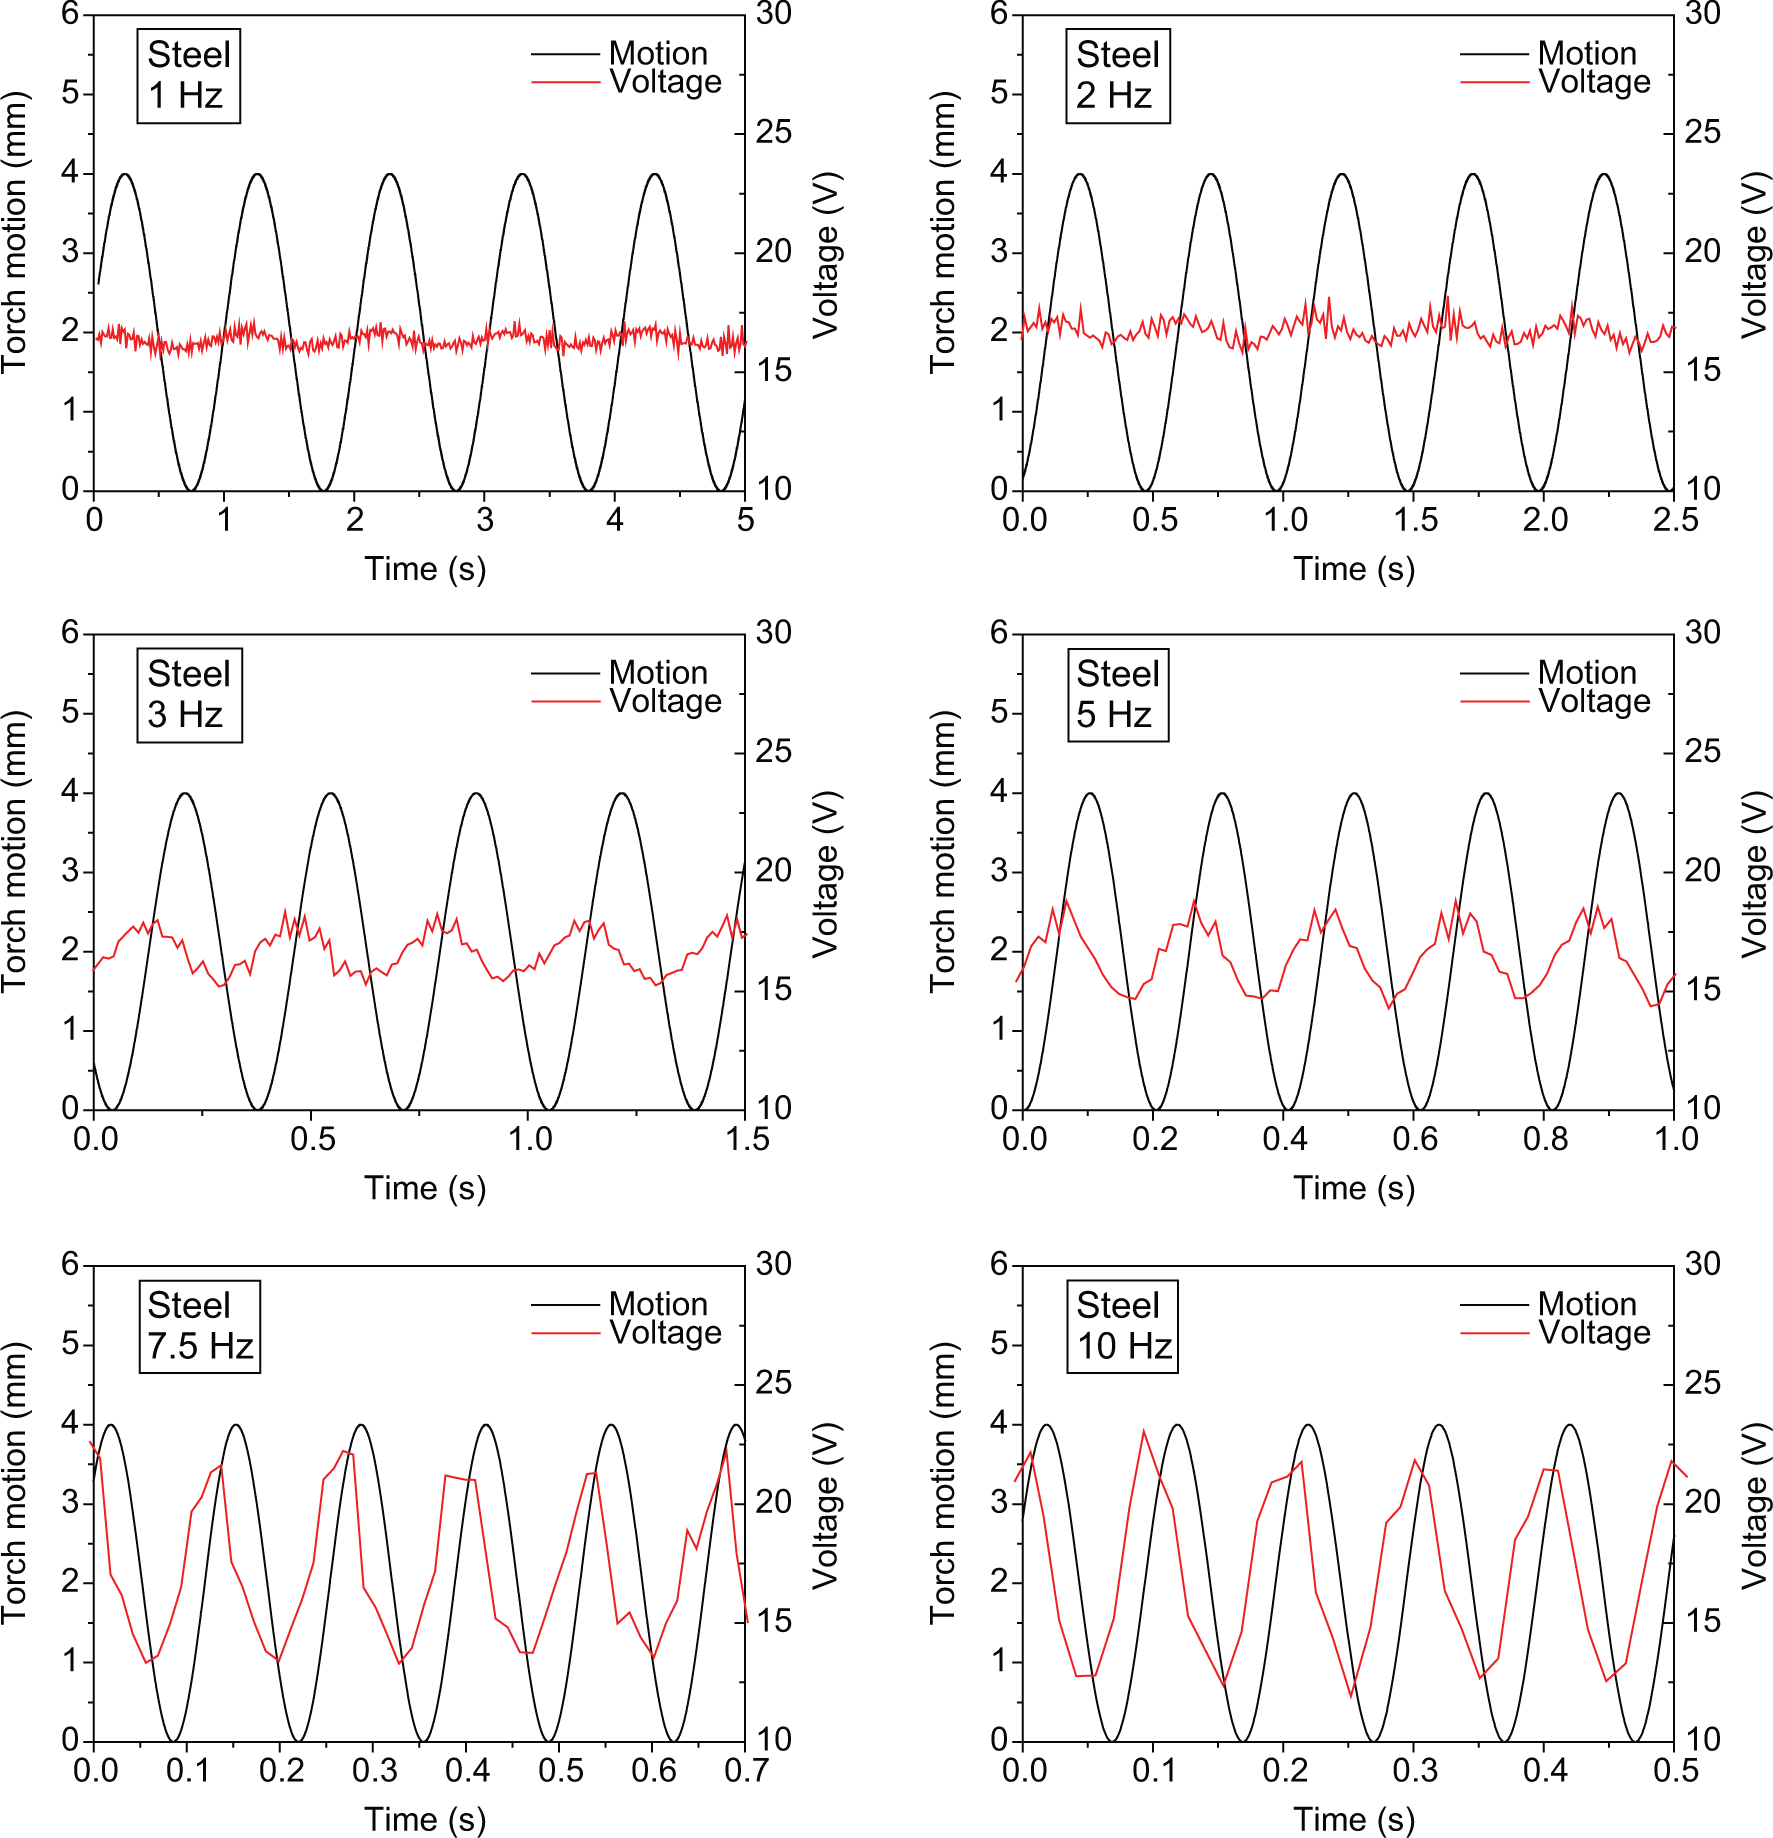
Cycle voltage characteristics with various torch oscillation frequencies.
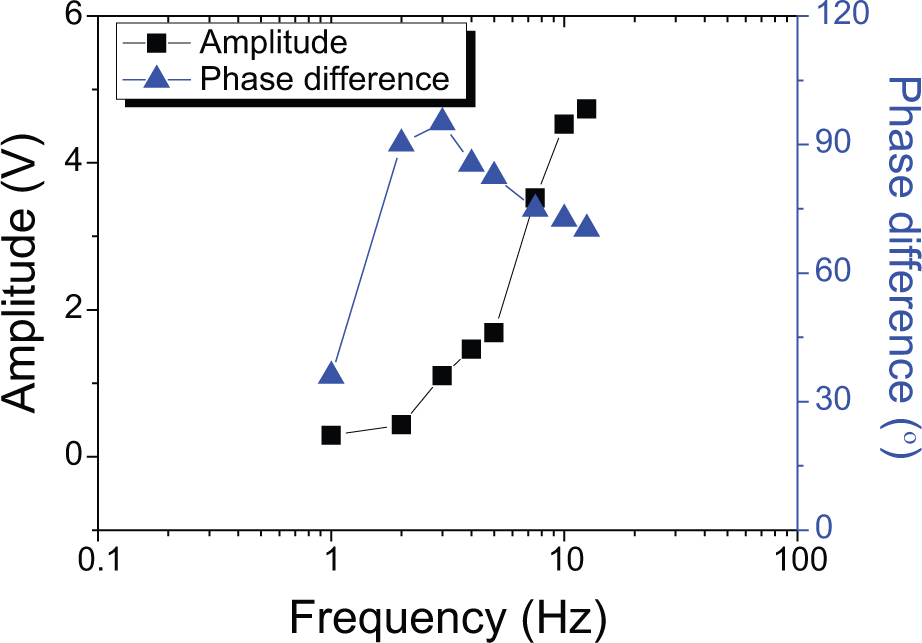
Frequency characteristics of voltage sensing.
Evaluation of seam tracking capability in V-groove welding
Several seam tracking algorithms such as the current area difference, current integration difference, and weaving end current difference have been proposed for arc sensing using the conventional CV power source.17,22,27,28 In this study, the voltage integration difference method was employed to estimate the offset distance between the centers of the torch weaving and groove. In RWF-GMAW, the welding voltage characteristic is proportional to CTWD. When the center of the torch weaving coincides with the center of the groove, the waveform of voltage characteristic is symmetric about the weaving center position. In contrast, when the center of the torch weaving deviates from the center of the groove, the waveform of voltage characteristic changes to an asymmetric shape, as shown in Figure 12.
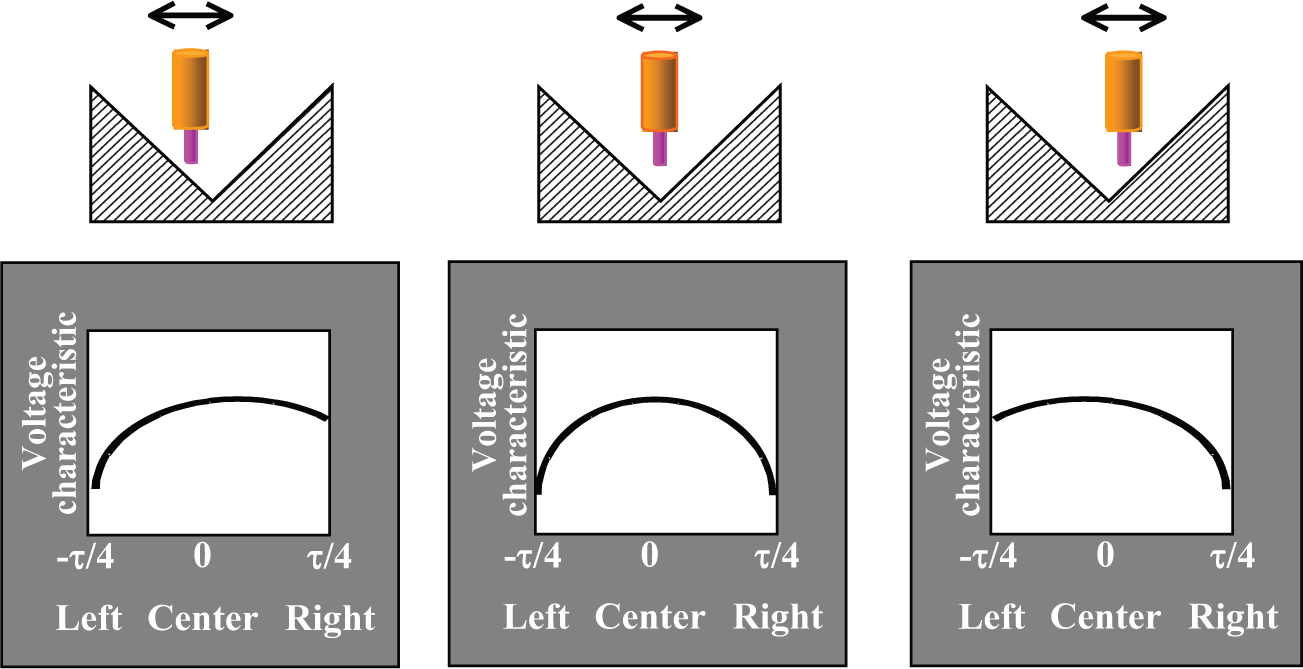
Typical welding voltage waveforms in V-groove welding with RWF-GMAW.
The voltage integration difference (ΔS) was defined as follows
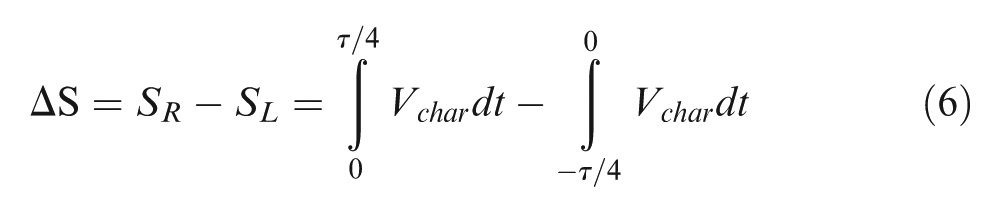
where SR is a voltage integration between the center position (C) and the right dwell position (R), SL is a voltage integration between the left dwell position (L) and the center position (C), τ is a period of the transverse weaving, and Vchar is a voltage characteristic.
Welding experiments were conducted on V-groove specimens with a joint angle of 90°. The welding speed and WFS used were 8.33 and 86.7 mm/s, respectively. Transverse weaving with both side dwells was used, and the weaving width, weaving speed, and dwell time at each side were fixed at 2 mm, 8 mm/s, and 0.5 s, respectively.
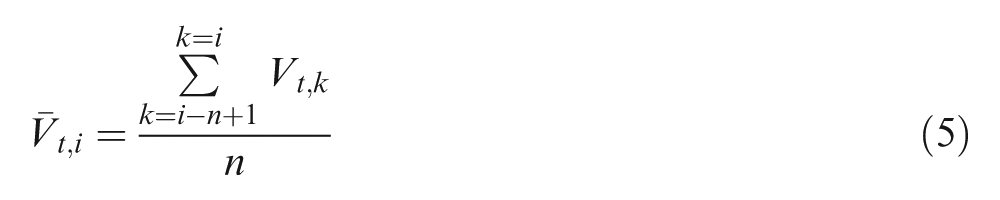
Figure 13 shows the measured cycle voltage waveforms according to the offset position, and Figure 14 shows the voltage integration difference with regard to the offset distance, where the dots and error bars indicate the average values and SDs of the voltage integration difference, respectively. The voltage integration difference shows a linear relationship with the offset distance, and it can be adopted for the error criterion. The slope of the fitted line was 0.189 V·s/mm, and the average SD of the voltage characteristic for each position was 0.111 V·s. The SD of the offset estimation could be calculated as 0.587 mm by using a calculation similar to equation (4). A moving average algorithm like that in equation (5) was also applied to the offset estimation, and the SD could be remarkably decreased, as shown in Figure 15. For instance, the SD of the offset estimation was calculated to be 0.111 mm when the number of data points that were averaged, n, was equal to 5.
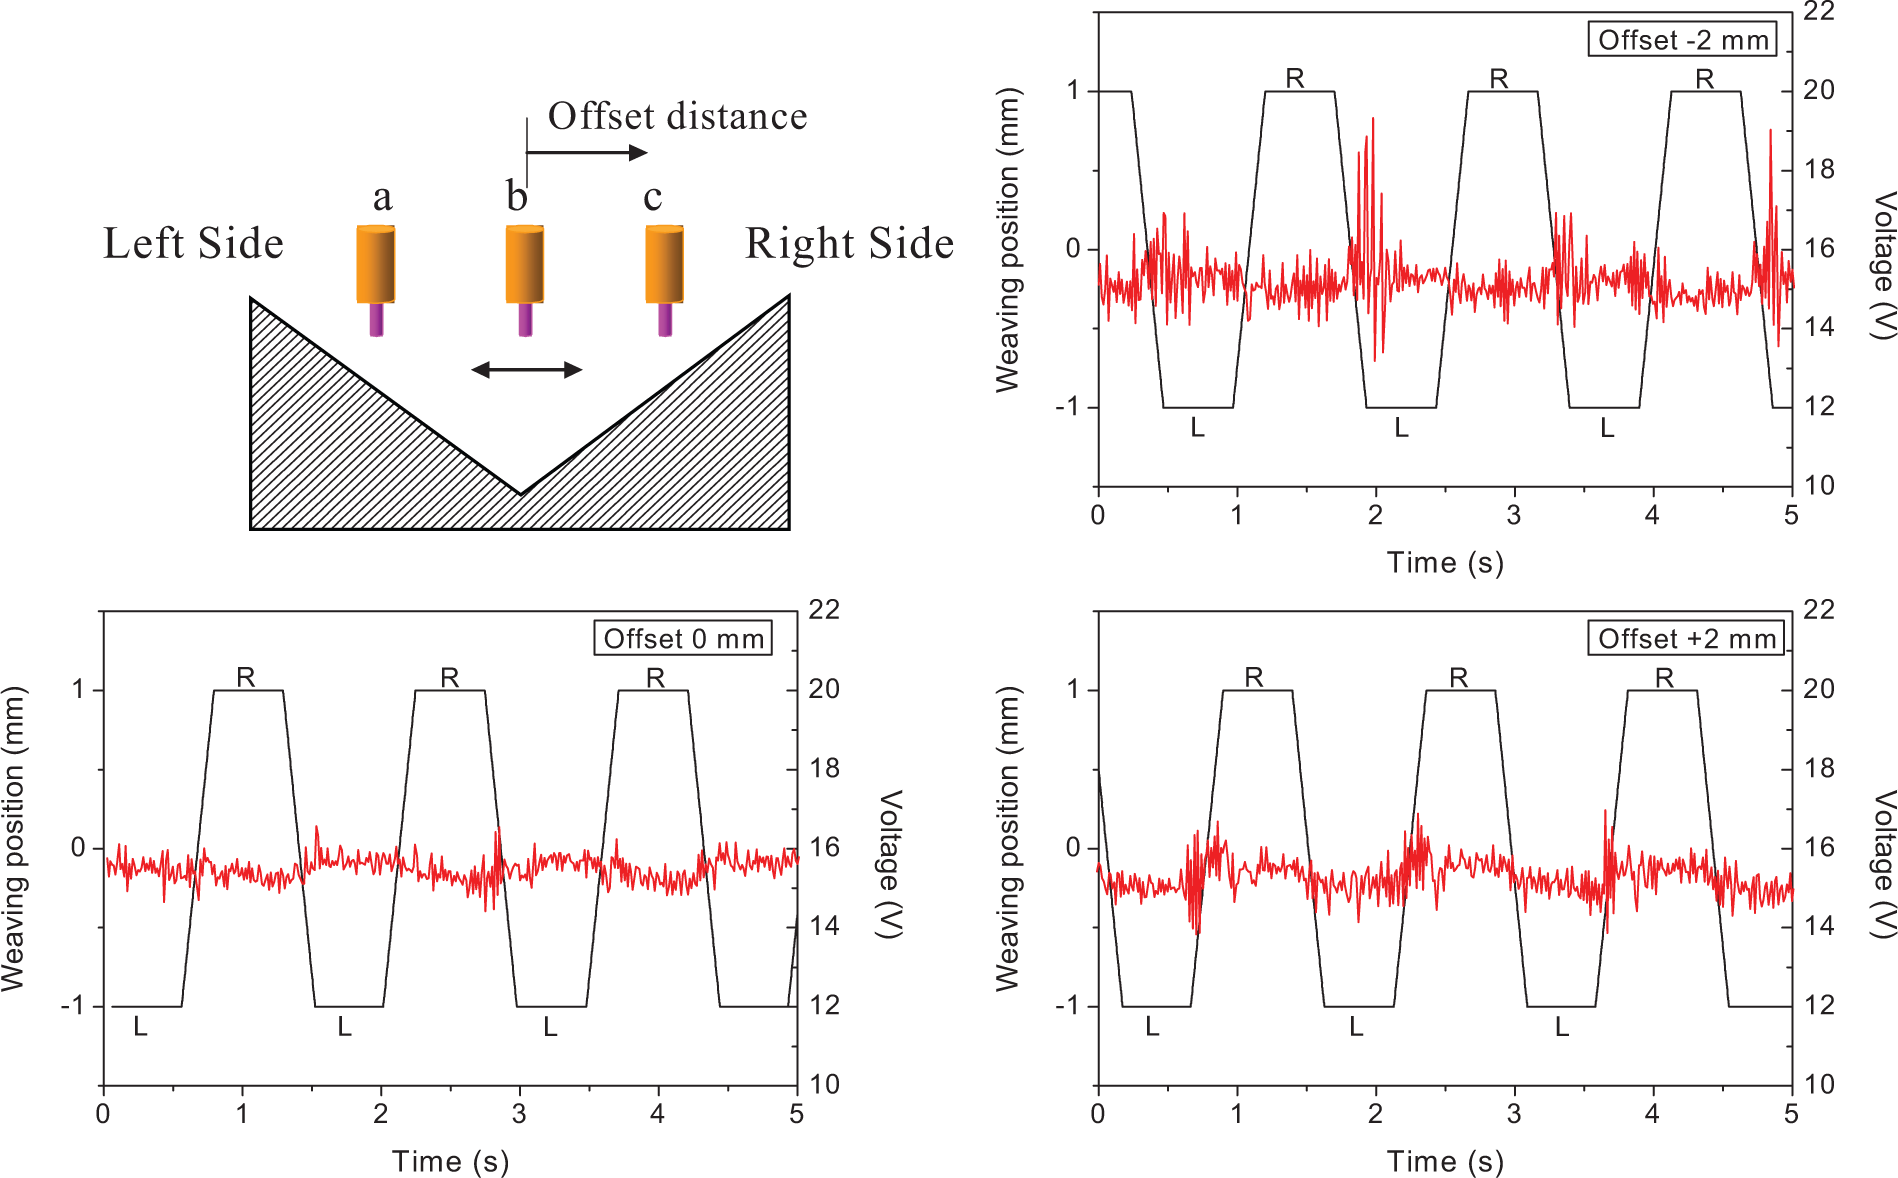
Cycle voltage characteristic at various offset distances.
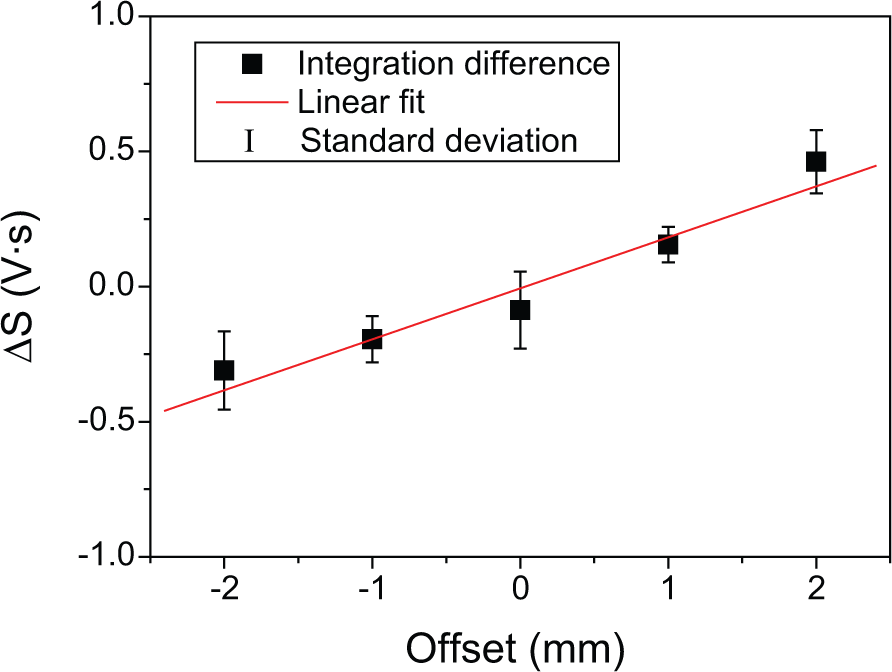
Correlation between offset distance and voltage integration difference.
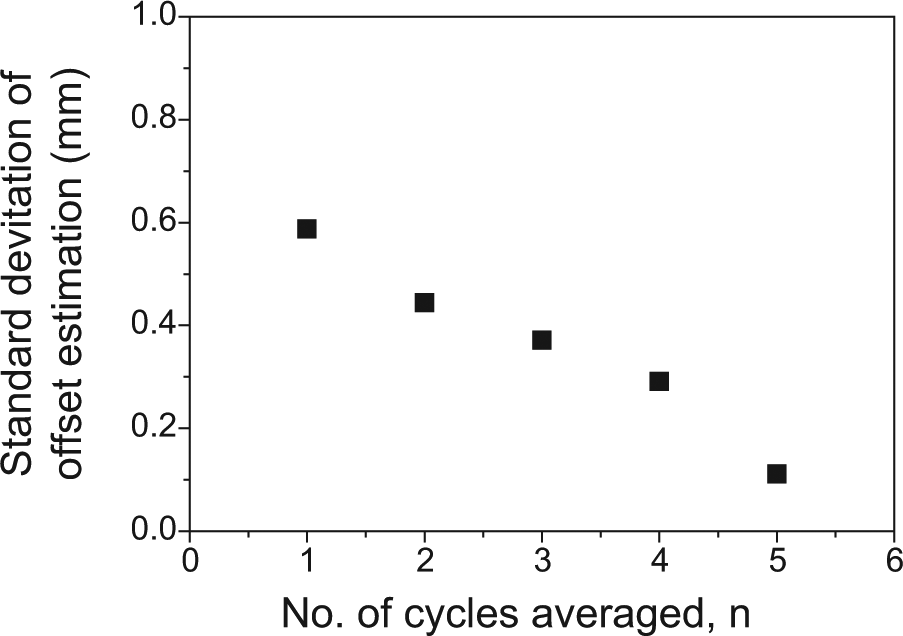
Standard deviation of offset estimation using moving average.
Conclusion
In this study, torch height detection and joint tracking methods were proposed for RWF-GMAW. The arc sensing system was evaluated in the static and dynamic states, and the following results were derived:
In bead-on-plate welding with fixed CTWDs, the average welding voltage was proportional to CTWD, whereas the average welding current was not affected by the change in CTWD.
The voltage waveform pattern was analyzed, and the voltage characteristic for each phase was evaluated to predict CTWD. The height detection performance could be increased by using the moving average algorithm, and the moving average cycle voltage characteristic gave the most reliable estimation.
In high-speed CTWD change experiments, an arc sensor for RWF-GMAW showed a dynamic behavior similar to that of the experimental results when using a conventional CV welding power source. In high-frequency oscillation experiments, the maximum phase difference was 95.1° at 3 Hz.
The voltage integration difference algorithm was applied in weaving welding for a V-groove with various offset distances between the centers of the weaving motion and weld joint. The integration difference showed good linearity with the offset distance, and the reliability of the offset estimation could also be improved by the moving average algorithm.
Footnotes
Declaration of conflicting interests
The author declares that there is no conflict of interest.