
Abstract
Green production is implemented to save energy, reduce energy consumption, and decrease pollution levels. Green production is associated with preventing pollution and can be used to further extend manufacturer responsibility to products and the environment, thereby achieving the goals of ecological benefits and sustainable development. Green production is a crucial part of corporate social responsibility; thus, enterprises pursuing sustainable development should determine how green production and social responsibility can be integrated with their core operation strategies. This study developed green production–based assessment indicators to establish a green production assessment framework. In addition, the decision-making trail and evaluation laboratory and analytical network process were used to create a decision-making trail and evaluation laboratory–based analytical network process model. We employed the decision-making trail and evaluation laboratory–based analytical network process to calculate the level of influence and causality between the indicators and subsequently determine the weight of the indicators. Finally, the indicators were used to establish a comprehensive assessment system for green production. The green production criteria system established in this study is both a theoretical contribution and has wide practical applications.
Keywords
Introduction
In green production (GP), management and technological approaches are used to minimise and control the amount of pollutants produced during industrial production processes. The purpose of GP is to conserve energy, reduce energy consumption, and reduce pollution. Since the 1980s, methods used worldwide to control industrial pollution have undergone critical changes. The ‘end processing’ strategy adopted among advanced Western countries originally involved treatment only after pollution was generated; this process was transformed into a pollution control strategy emphasising pollution prevention. The United Nations Environmental Program (UNEP) named this new strategy ‘green production’ or ‘cleaner production’ (CP).1–3
According to the UNEP, GP or CP is defined as ‘the continuous application of an integrated environmental strategy to processes, products, and services to increase efficiency and reduce risks to humans and the environment’. GP is used to reduce pollution, extend manufacturer responsibility to products and the environment, and pursue ecological benefits and sustainable development.2,3
GP has two primary purposes. It is implemented to (a) eliminate or reduce the generation of waste material and pollutants during the production process to rationally use resources, promote environmental compatibility in product manufacturing and consumption processes, and reduce the harm that the production process causes to humans and the environment; and (b) enable resources to be effectively used, to slow depletion by finding alternatives to scarce resources, to reuse resources, and to conserve energy, materials, and water.4–6
According to Porter and Kramer, 7 corporate social responsibility (CSR) is a 21st-century competition strategy. Companies pursuing sustainable development must consider the integration of social responsibility with core operating strategies.
CSR, broadly defined, stipulates that corporations behave ethically within society. From a business perspective, corporations are responsible to all stakeholders rather than only to stockholders. The World Business Council for Sustainability and Development stated that corporations should value sustainable development, equality, and responsibility when addressing matters that affect all stakeholders and that businesses must provide excellent work environments for employees, develop green products, ensure environmental quality, provide effective post-sales service, and maintain positive interactions with the communities in which they are situated.8–11
Thus, GP is a crucial CSR for enterprises when pursuing sustainable development. This study developed GP-based indicators to establish a GP assessment framework. In addition, the decision-making trail and evaluation laboratory (DEMATEL) and analytical network process (ANP) were used to establish the decision-making trail and evaluation laboratory–based analytical network process (DANP) model, which was then employed to calculate the level of influence and causality between the indicators and subsequently determine the weight of the indicators. Finally, the indicators were used to establish an assessment system for GP (Figure 1).
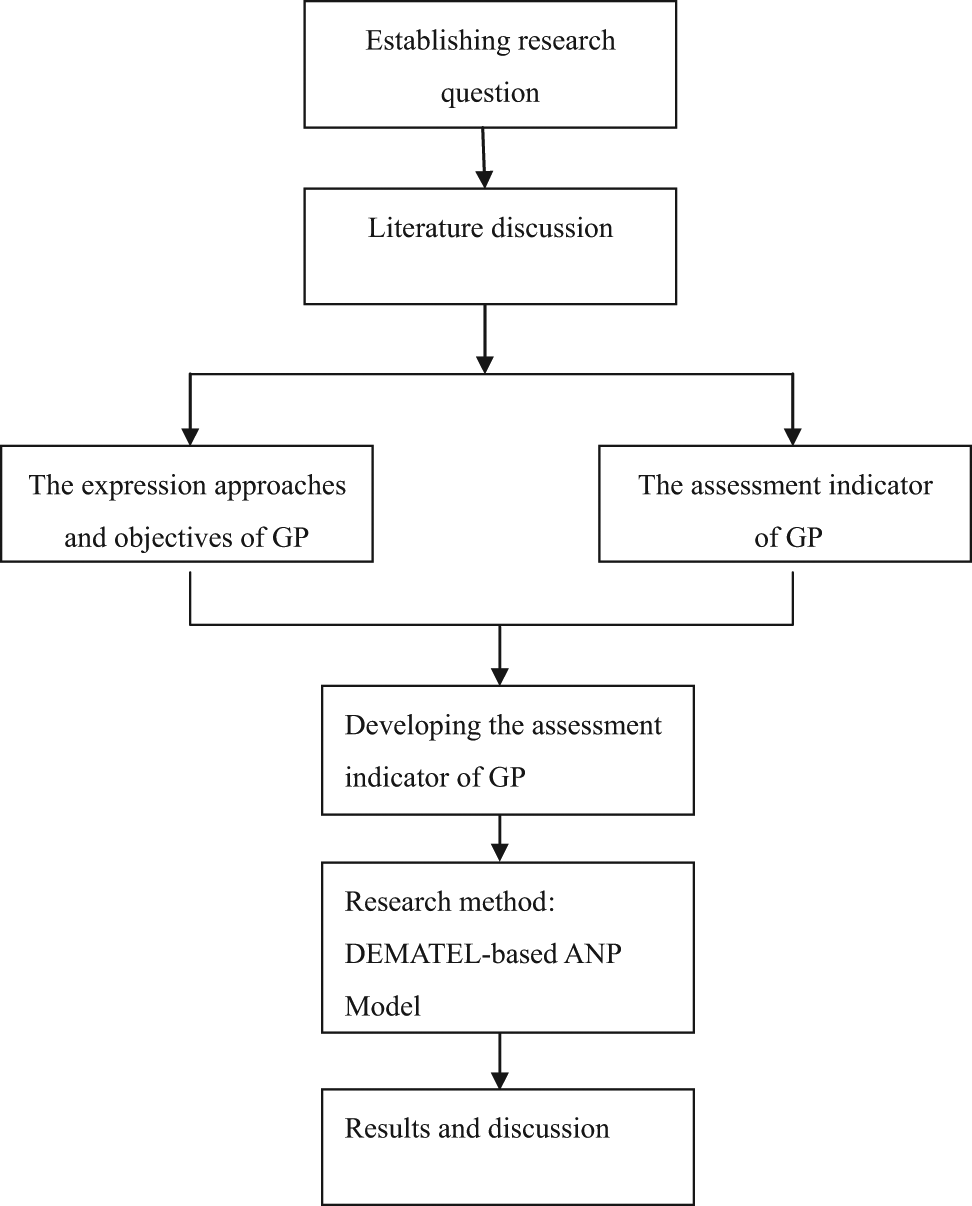
Research framework.
Literature review
GP
GP can be divided into two components: green energy and production processes, and green environmental products.
Green energy and production processes.
Choosing green resources: using pollution-free, conservative energy sources or resources such as solar, wind, ocean, tidal, geothermal, biomass, and other renewable forms of energy.
Using clean fossil fuels and rapidly developing energy-conservation technologies to improve energy efficiency.
Using nonpolluting or minimally polluting technologies and new equipment to conserve energy and resources, reusing and recycling raw materials, and using waste materials to improve energy efficiency and reduce the consumption of the earth resources.
Intensifying the management of manufacturing processes, equipment, raw material storage, and production process organisation to reduce material waste and leakage.
Comprehensively treating emitted pollutants.
Green environmental products.
Materials used in product manufacturing should be nontoxic and decomposable.
Products should exhibit reasonable functions and service lives and feature energy, water, and power conservation and low-noise characteristics.
Products should not be harmful to human health or the ecological environment after use, and should be easy to recycle, reuse, and renew.
To attain the goals of GP, corporations should first address their problems. The primary ways to implement GP are as follows:4–6,12,13
Comprehensively using resources (raw material and energy resources) and developing secondary resources (e.g. using wastewater and waste gas).
Preventing material loss during the GP process and using waste materials.
Improving product designs, equipment, and production processes.
Improving and developing green technology, and pollution and environmental protection measures.
Strengthening scientific management, producing zero-waste facilities, and ensuring friendly communication with the community.
GP is a comparative and dynamic concept involving continual improvement processes. As technology progresses and economies grow, GP also continues to develop and progress. Corporations that produce green products must introduce green, clean production concepts, transforming or improving any original equipment that consumes large amounts of energy or emits excessive pollution. Regarding design, corporations must consider the extended functionality and reuse of green products to reduce the amounts of raw material used and waste produced during production.
Criteria for GP
Based on our literature review, GP criteria were established and divided into four dimensions: green operating efficiency, environmental protection, effective resource use, and contribution to the community. Table 1 details the 16 criteria included in the proposed system.
GP criteria.
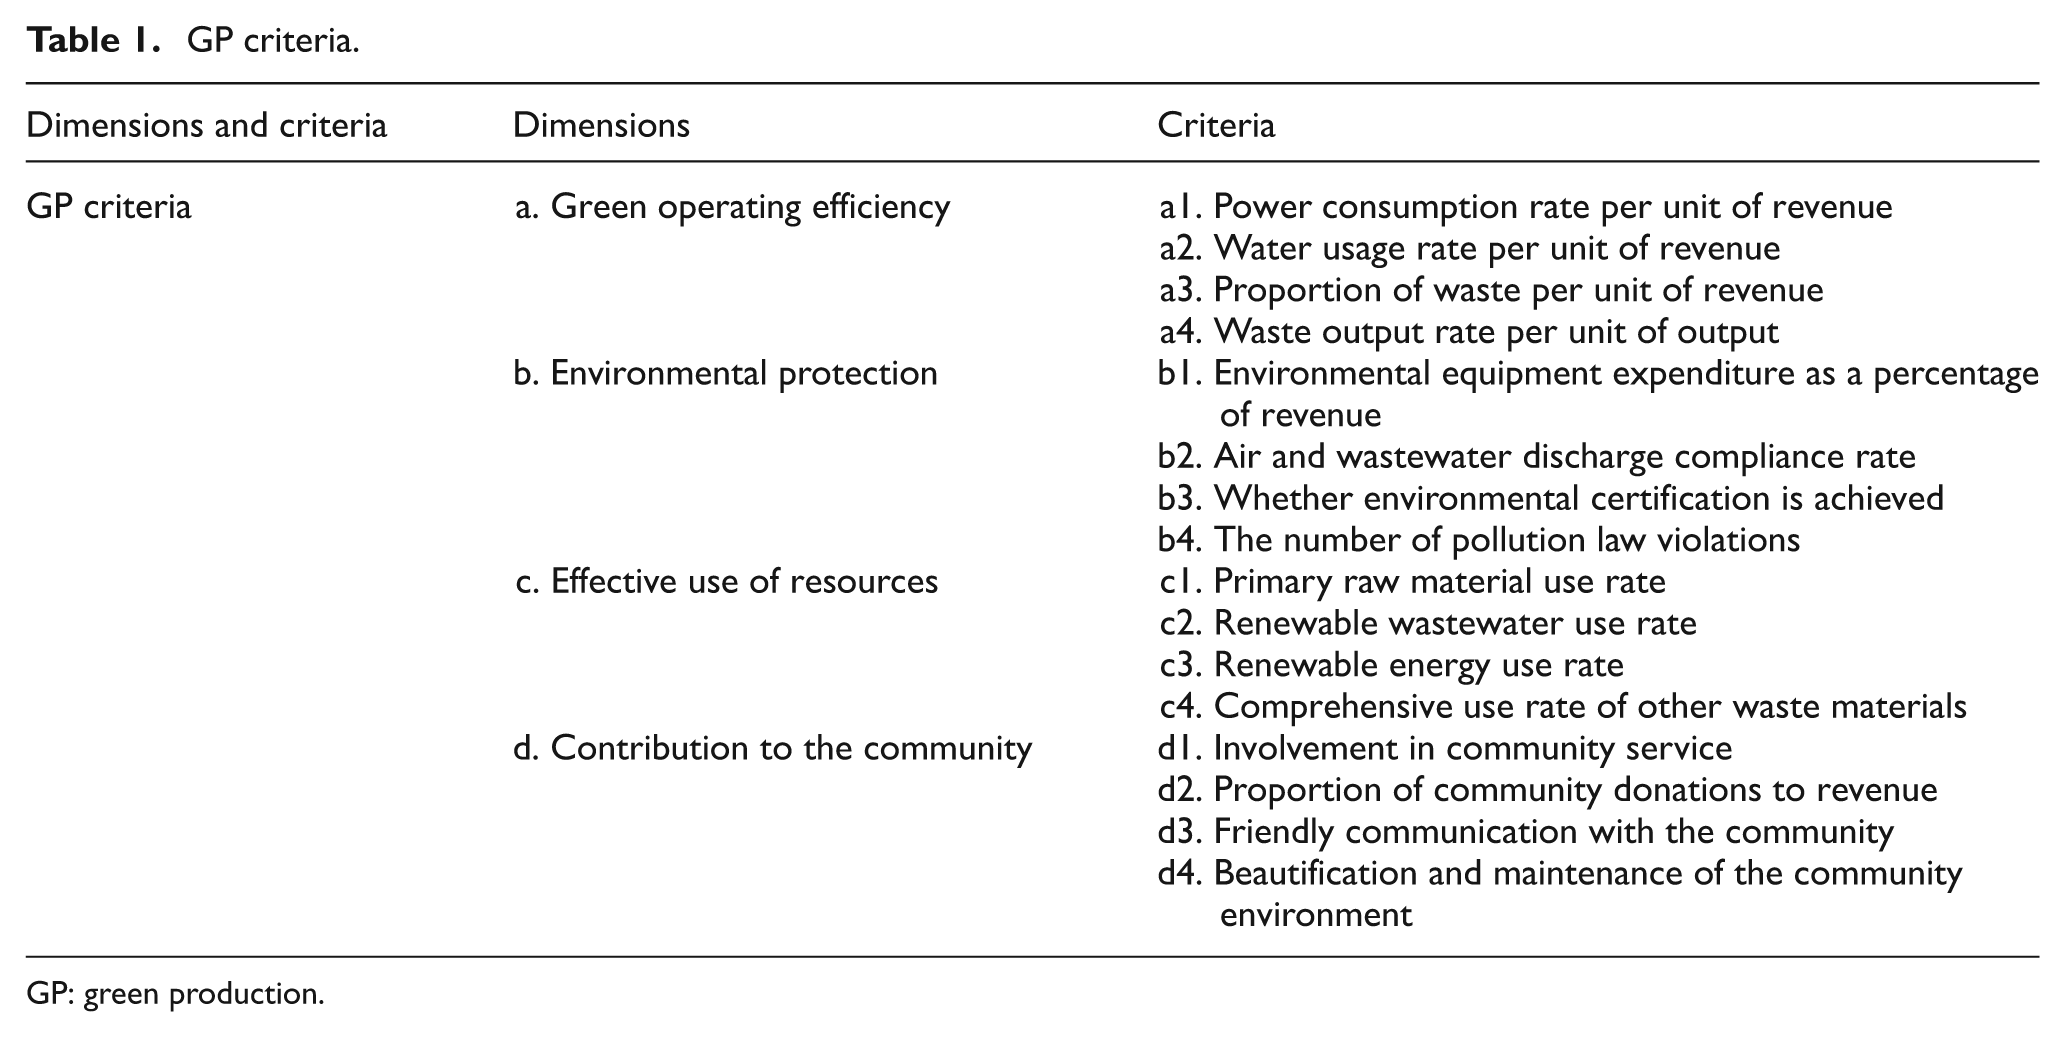
GP: green production.
Research methodology
This section introduces the DEMATEL and ANP decision-making methods. The DANP model, which was employed to calculate the level of influence of each criterion and causal relations among the criteria, is also explained. The DANP model was used to calculate criteria weights.
DEMATEL
In 1971, the natural science and social science research projects of the Battelle Institute initiated the DEMATEL. In its early stages, the DEMATEL primarily focused on complex global problems such as racial conflicts, hunger, environmental protection, and energy. The three major research domains were described as follows: (a) studying the structure of global problems; (b) analysing and developing adaptation methods in response to complex global problems; and (c) reviewing global problem–related studies, models, and data.14,15
The DEMATEL is characterised by its application of matrices to obtain the causalities and influential strength between factors. The level of influence and direction of the essential constituents are explained in direct relationship diagrams, in which influential strength was numerically represented (Figure 2). Causal diagrams are used to structure complex questions, dividing all evaluation criteria into causes and effects, to identify core problems and corresponding solutions.15–18
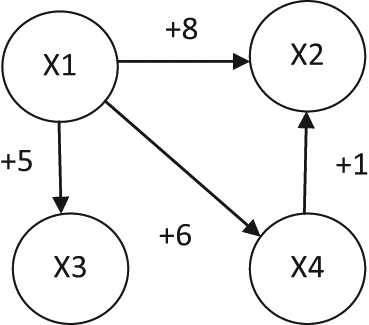
Direct relationship in DEMATEL.
To use the DEMATEL, several assumptions must be satisfied:14,15,18–20
The core problem must be explicit: in the problem formation and planning stages, the nature of the problem must be clearly defined to accurately determine the direction of the solution to the problem.
The correlation between problem elements must be expressed: the correlation between every element must be indicated by 0, 1, 2, 3, and 4.
The essence and relevant characteristics of every problem element must be understood: supplementary explanations (including agreements and disagreements) for relevant problems must be provided.
In recent years, many scholars have noted the practicability of the DEMATEL and have widely used it to improve decision-making quality and performance. Tzeng et al. 21 applied the DEMATEL to assess digital learning performance. Wu and Lee 22 employed the fuzzy DEMATEL to solve problems related to group decision-making. Lee et al. 23 identified the benefits of applying the DEMATEL to the technology acceptance model. Wu et al. 24 used the DEMATEL to evaluate personnel performance criteria used by an employment service outreach program. Lee and Hsieh 19 used the DEMATEL to analyse the causal relations between service attributes and adjusted the weighting of these attributes to resolve core problems.
ANP
In the 1970s, Saaty proposed the analytic hierarchy process (AHP), a systematic method for multicriteria decision-making (MCDM). This method can be used to logically solve complex, unstructured economic, social, and managerial decision-making problems. 25 However, the AHP model is limited in that it requires assuming that criteria are independent of each other. Saaty 26 later proposed an ANP in the form of a nonlinear structural network. This model extended the AHP by adding a feedback mechanism; its primary purpose was to overcome the problems in traditional AHP hierarchical structures, including possible feedback and interdependent relations between each criterion and hierarchy. The ANP is an integrated decision-making technique that accounts for both the external independent aspect of the criteria, and the feedback relations between the internal and external aspects of the criteria.27–29
The ANP is a relatively new MCDM method used to calculate the interdependence and relative weights of factors. Researchers have applied this method in a number of fields, including project selection and planning, policy decisions, and planning optimisation.30–33
DANP model and calculation process
Although normalisation using the ANP is simple, assuming that each cluster is of equal weight when generating a weighted supermatrix is unreasonable, because criteria may exhibit distinct degrees of influence. 29 Because criteria demonstrate varying degrees of influence, the DEMATEL and ANP models were combined to accurately yield the relative influential weights of the examined dimensions or criteria. This integrated method – the DANP method – solves the dependence and feedback problems.34,35
The DANP method was implemented in this study using the following steps:
Step 1. The attribute characteristics and measurement scales were defined.
The expert opinion approach was used to establish the causal relationship between the attributes and the measurement scale for the level of influence. Kim 36 used a scale with six levels, where the scores ‘0’, ‘1’, ‘2’, ‘3’, ‘4’, and ‘5’ represented no influence, very low influence, low influence, medium influence, high influence, and very high influence, respectively. Lin and Wu 37 used a scale with four levels, where scores of ‘0’, ‘1’, ‘2’, and ‘3’ represented no influence, low influence, high influence, and extremely high influence, respectively. Lee and Hsieh 19 and Lee et al. 23 employed 11 points ranging from 0 to 10; ‘0’ represented no influence, and ‘10’ represented extremely high influence. An 11-point measurement scale, ranging from no influence to extremely high influence, was adopted in this study. An 11-point measurement scale was used because the wide range of options enabled the experts to effectively distinguish the level of influences among the attributes and complete the questionnaire.
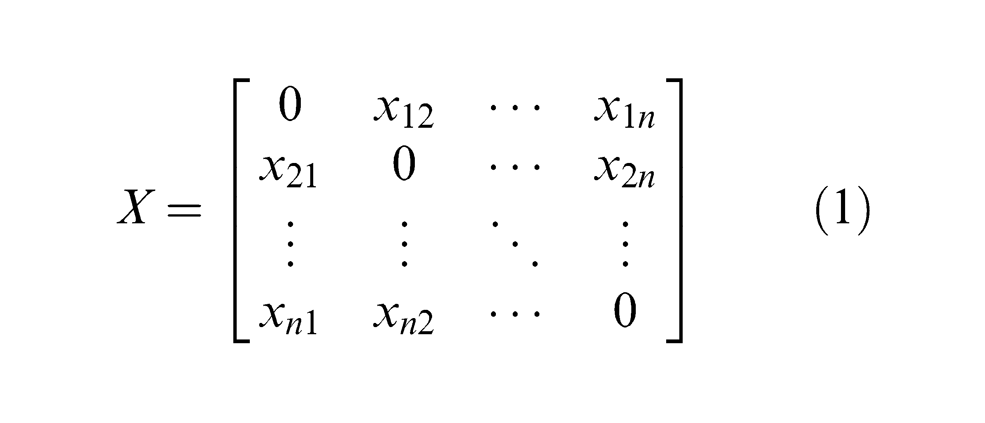
Step 2. The direct-relation matrix X was established.
The initial direct-relation n-by-n matrix X, denoted as equation (1), was formulated based on pairwise comparisons generated in an expert survey. In matrix X, Xij is the degree to which the criterion i affects the criterion j
Step 3. The direct-relation matrix N was normalised.
Based on the direct-relation matrix X, the normalised direct-relation matrix N was generated using the following

Where
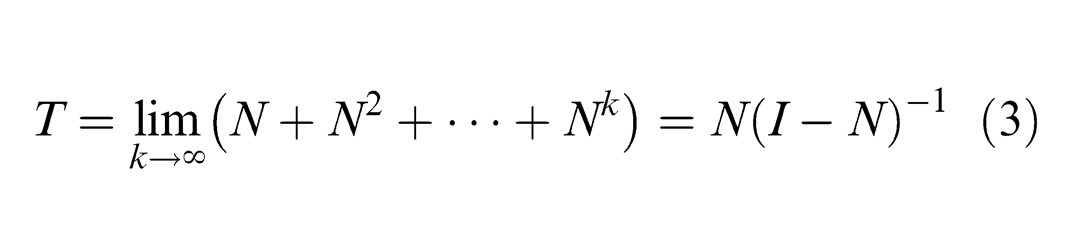
Step 4. The total-relation matrix T was calculated.
After generating the known N, the identity matrix I was used to acquire the direct–indirect matrix T, also called the total-relation matrix
Step 5. The influence and influential levels of the factors were calculated.
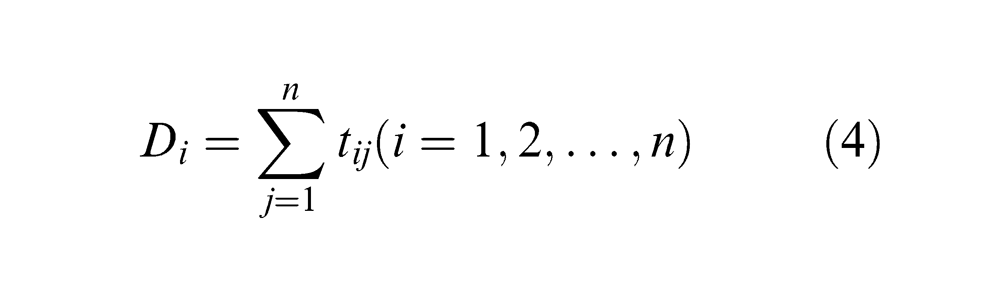
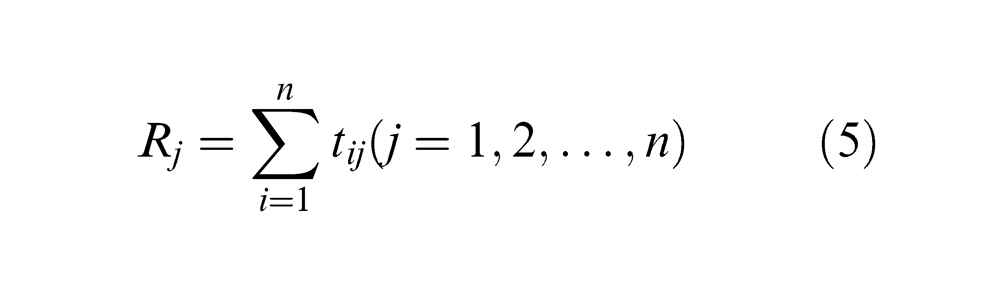
After determining T, the influence of certain attributes on other attributes was calculated to determine the degree to which the target attribute was influenced by other attributes. The term tij was used to define the characteristics of the attributes in T, where i, j = 1, 2, ..., n. The term Di was considered the sum of row i and represented the sum of the attributes influenced by i. The term Rj represented the sum of column j (i.e. the sum of the attributes that influenced attribute i). The terms Di and Rj were acquired from T and included both direct and indirect influences. The sum of the rows and the sum of the columns were separately denoted as vector D and vector R in equations (4) and (5)
The prominence was defined as (Dk + Rk), and k = i = j = 1, 2, ..., n, indicated the overall influence of and influential levels of a specific attribute (k). This value represented the core level of k in all problems. The varying degree of the influence of and influential levels of k was defined as (Dk − Rk). This value indicated the causal level of k in all problems. If the value was positive, k was categorised as a cause. Conversely, if the value was negative, k was categorised as an effect. Increased (Dk + Rk) values indicated an increased degree of influence on other attributes or an increased degree of being influenced by other attributes.
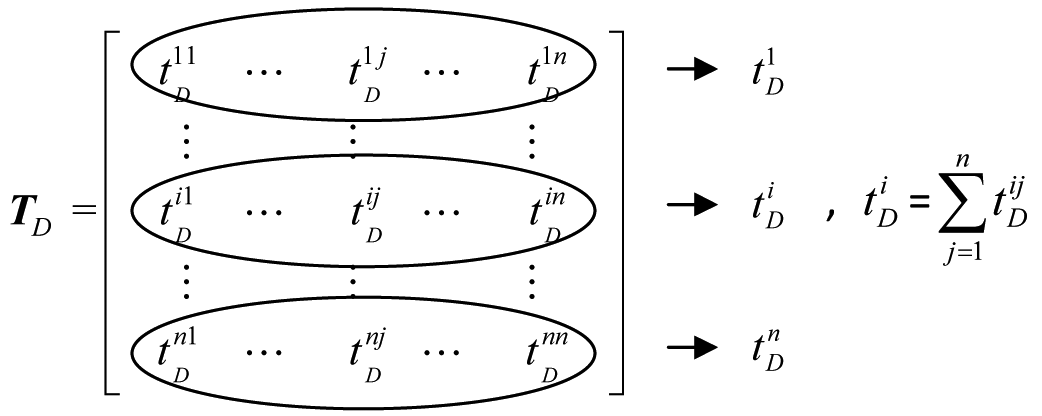
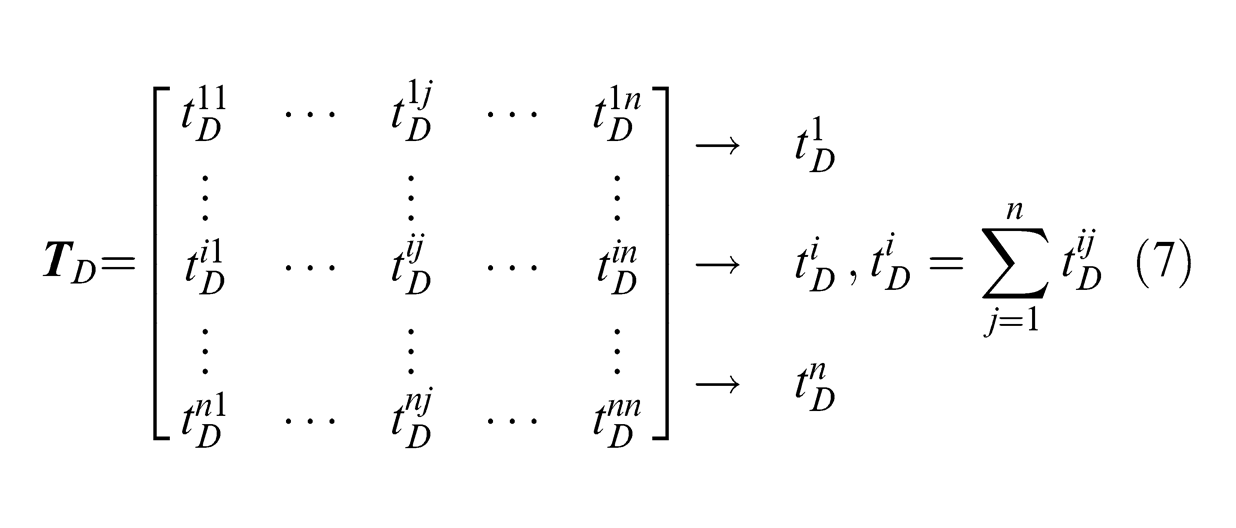
Step 6. The total-relation criteria and dimension matrices, Tc and Td, were calculated.
The total-relation matrix T was further divided into two matrices, Tc and Td, based on the criteria shown in equation (6) and the dimensions shown in equation (7), respectively
Step 7. The normalised total-influential matrix
Td was further normalised using the sums of the rows and was denoted as
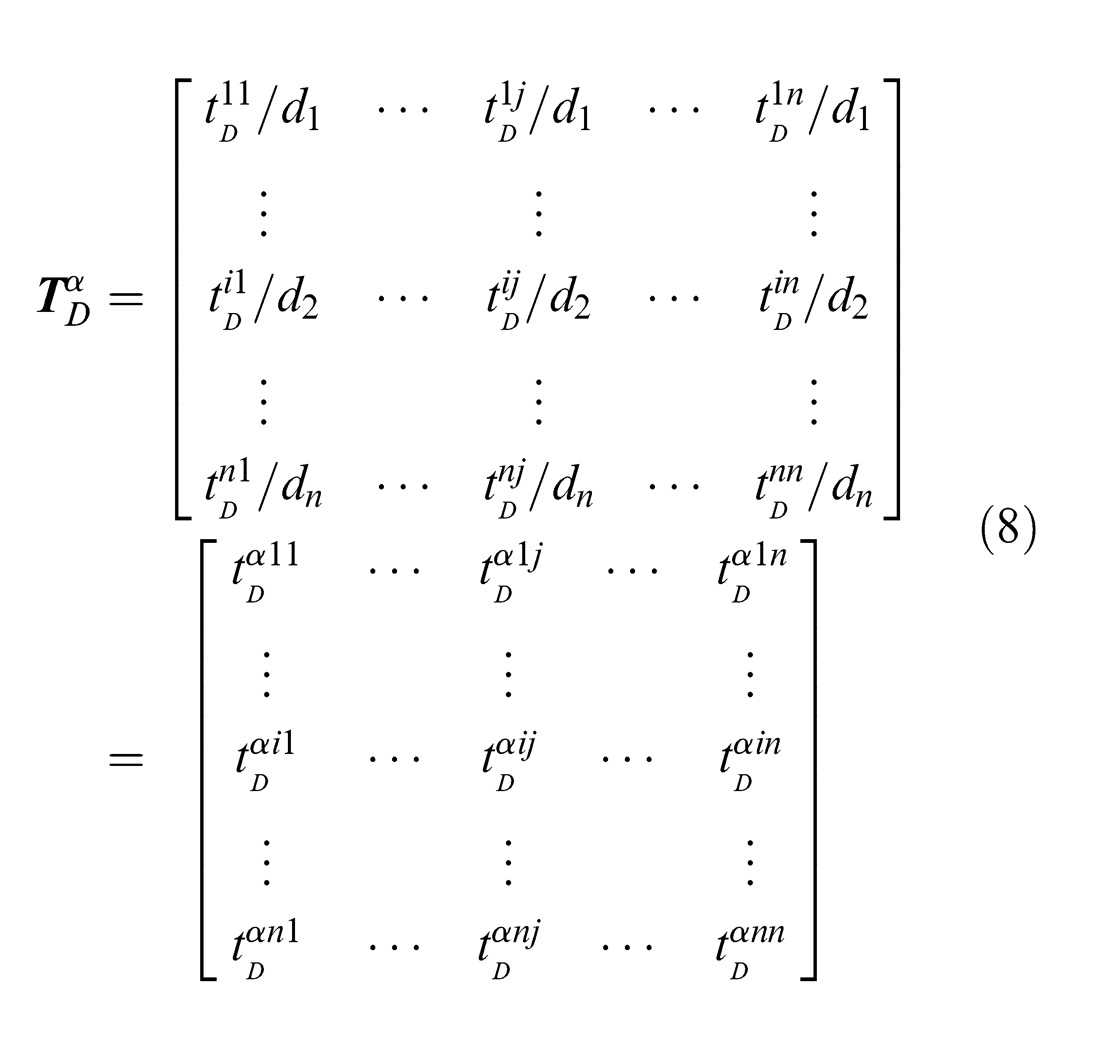
Step 8. The normalised total-influential matrix
The total-influential matrix
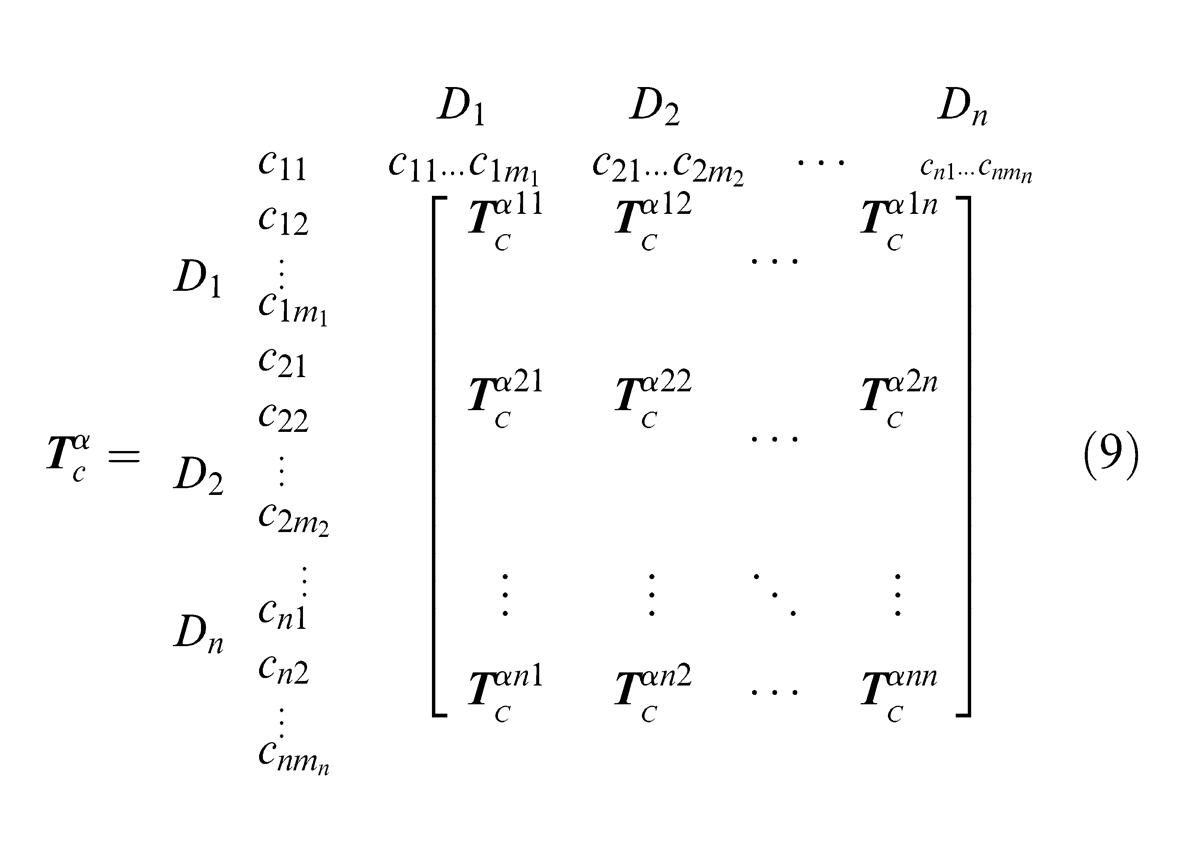
Step 9. An unweighted supermatrix
The total-influential matrix was normalised into a supermatrix. According to the interdependent relations between the dimensions and clusters, an unweighted supermatrix Wc was generated as shown in equation (10)
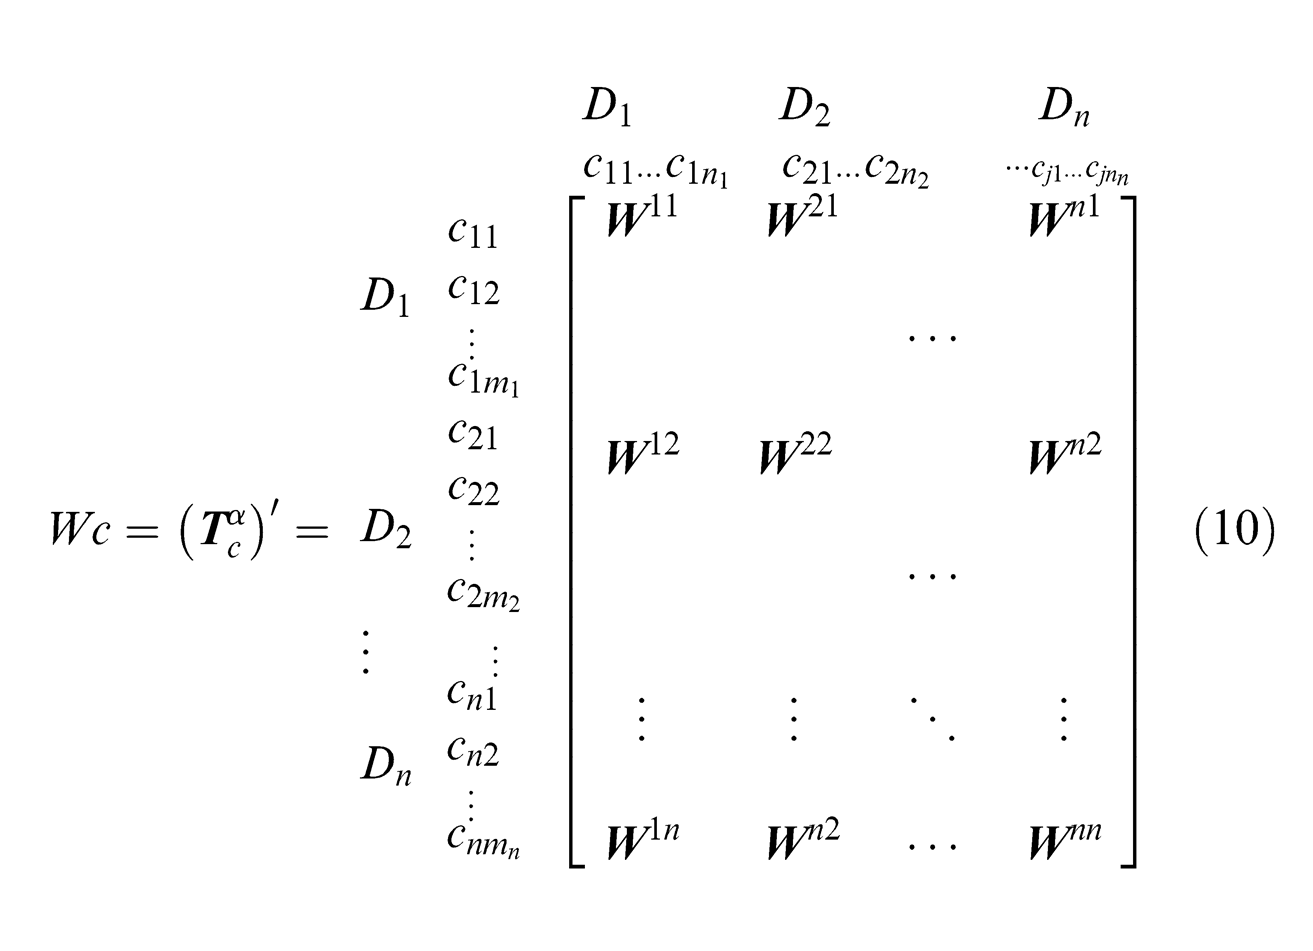
The unweighted supermatrix Wc was the matrix transposed from
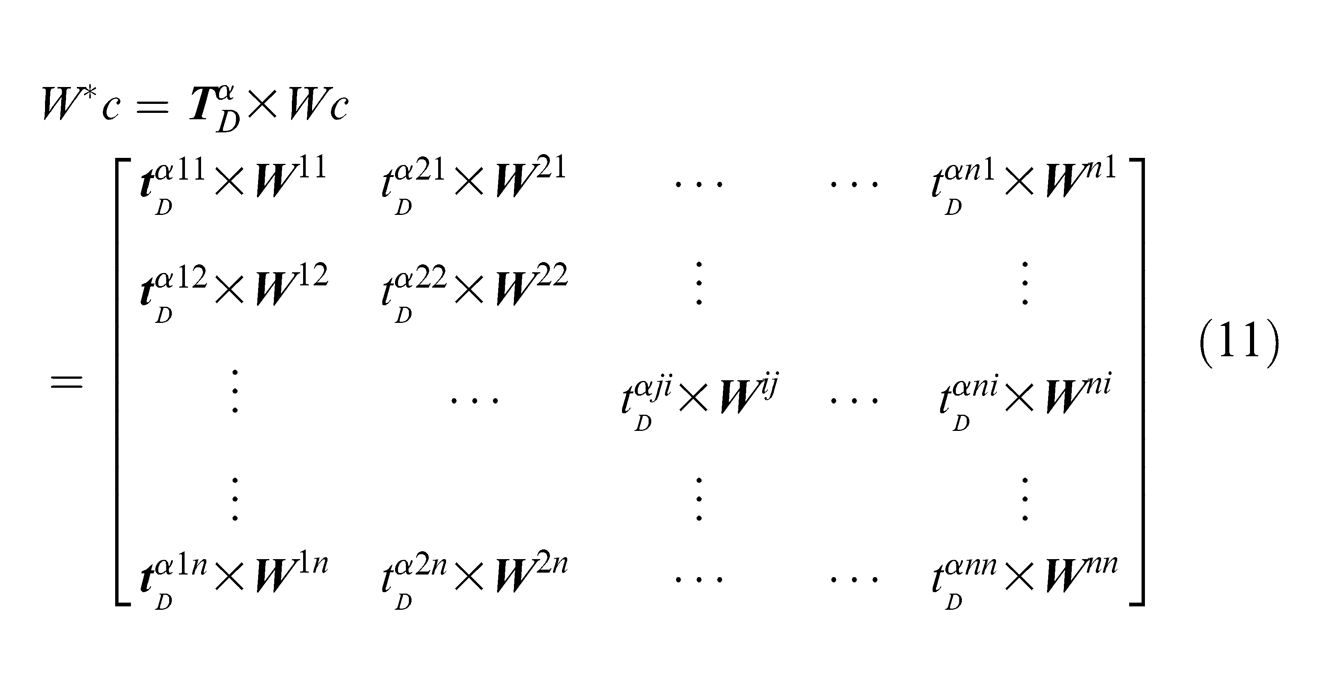
Step 10. The influential weights
By using equation (11), a weighted supermatrix
Step 11. The DANP results were obtained.
Multiplied by itself multiple times, the weighted supermatrix
Results and discussion
Two high-tech manufacturers in the integrated circuits and photovoltaic industries in the Hsinchu Science Park in Taiwan were selected as the study subjects. The output value of these two industries accounted for 90% of the total output. In 2013, the Hsinchu Science Park housed approximately 500 vendors and accommodated more than 150,000 employees, producing a turnover of US$50 billion. Both the integrated circuits and photovoltaic industries are capital-intensive and high-tech, consuming substantial amounts of power, water, and chemicals and emitting large quantities of pollution, including wastewater and waste substances.
Thus, investigating the simultaneous accommodation of profit generation and GP promotion by these high-tech manufacturers is crucial. A GP CSR criteria framework was developed and comprised four dimensions and 16 criteria.
DANP questionnaire
The DANP questionnaire comprised four dimensions: green operating efficiency (Dimension a), environmental protection (Dimension b), the effective use of resources (Dimension c), and contribution to the community (Dimension d). The 16 criteria were as follows: (a1) power consumption rate per unit of revenue; (a2) water usage rate per unit of revenue; (a3) proportion of waste per unit of revenue; (a4) waste output rate per unit of output; (b1) environmental equipment expenditure as a percentage of revenue; (b2) air and wastewater discharge compliance rate; (b3) whether environmental certification was achieved; (b4) the number of pollution law violations; (c1) primary raw material use rate; (c2) renewable wastewater use rate; (c3) renewable energy use rate; (c4) comprehensive use rate of other waste materials; (d1) involvement in community service; (d2) proportion of community donations to revenue; (d3) friendly communication with the community; and (d4) beautification and maintenance of the community environment.
The DANP questionnaire was distributed from November 2013 to December 2013. Experts were invited to provide their opinions regarding GP CSR criteria, using an 11-point measurement scale, where ‘10’ represented the highest level of influence and ‘0’ represented no influence. The survey participants were 16 experts: four were company board directors, four were professors, three were government officials in environmental agencies, and three were chairmen of community associations. The researchers visited each expert and explained the questionnaire content before asking them to provide their opinions. Of the 14 formal questionnaires distributed, 14 valid questionnaires were retrieved, yielding a retrieval rate of 100%.
DANP calculation and results
Calculating the relations among the dimensions and criteria
After gathering the questionnaire data, the DANP was used to analyse the relations and levels of influence among the four dimensions and 16 attributes. MATLAB software was used. Table 2 shows the expert questionnaire results. The mean values of the 14 expert scores were calculated to the hundredths place to generate a survey chart of 16 criteria, yielding a total of 256 squares. Excluding the 16 diagonal attributes that exerted zero influence on each other, Table 2 lists the 240 levels of influence.
The initial direct-relation matrix X.
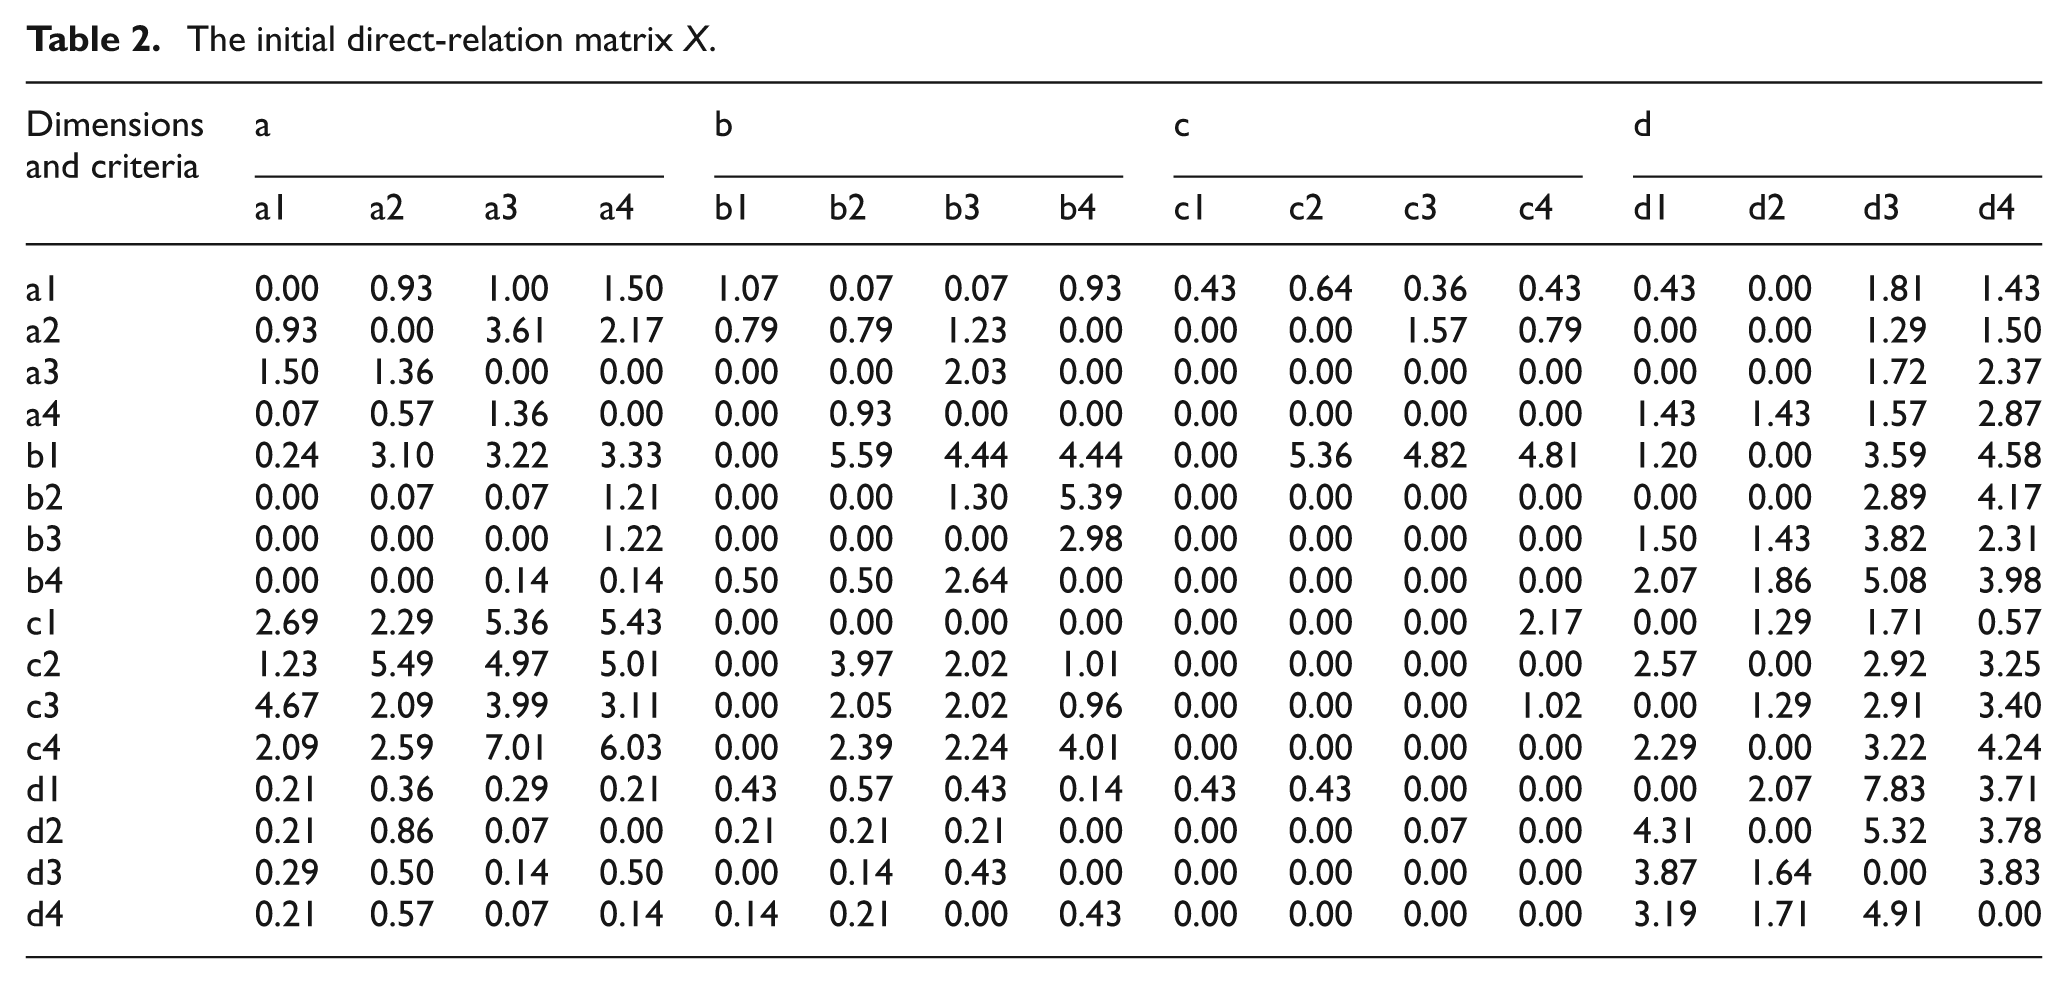
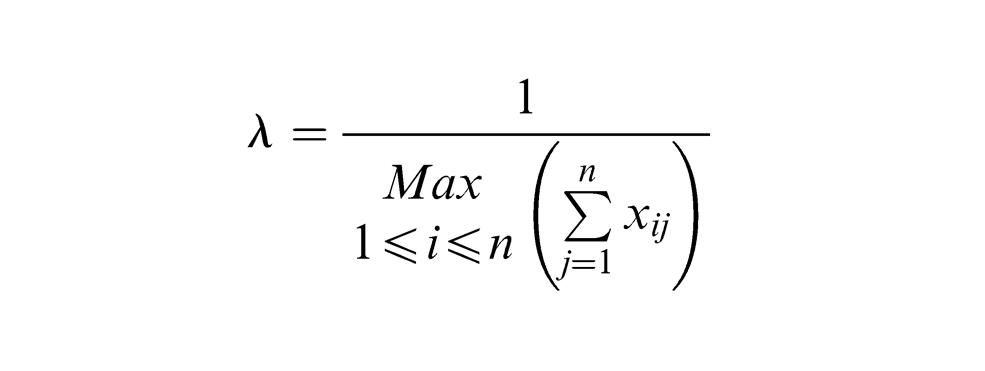
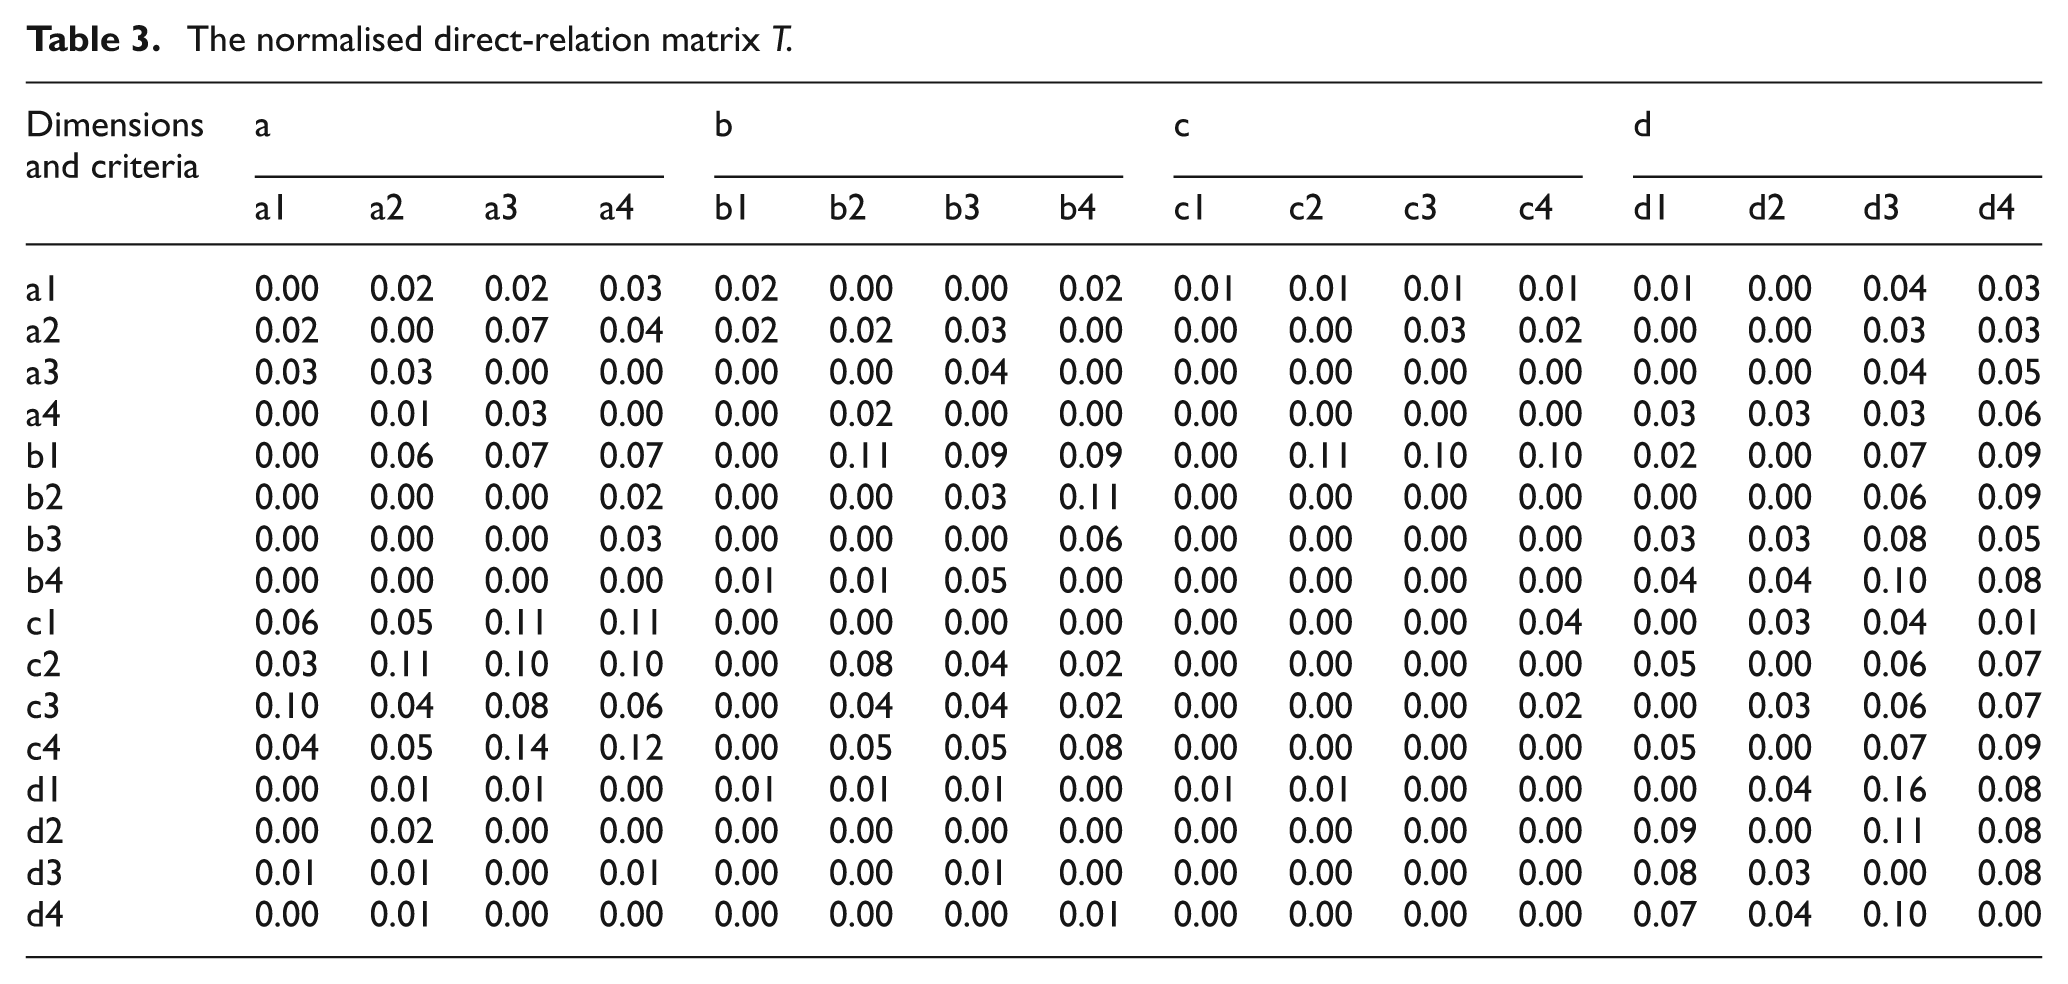
The normalised direct-relation matrix was calculated; the row vector and maximum value were applied as the basis for normalisation. The reciprocal of the maximum value of the sum of each row was defined as the value of λ. As shown in equation (2), the direct-relation matrix X was multiplied by λ to yield the normalised direct-relation matrix N. The level of influence was calculated and rounded to the hundredths place (Table 3).
The normalised direct-relation matrix T.
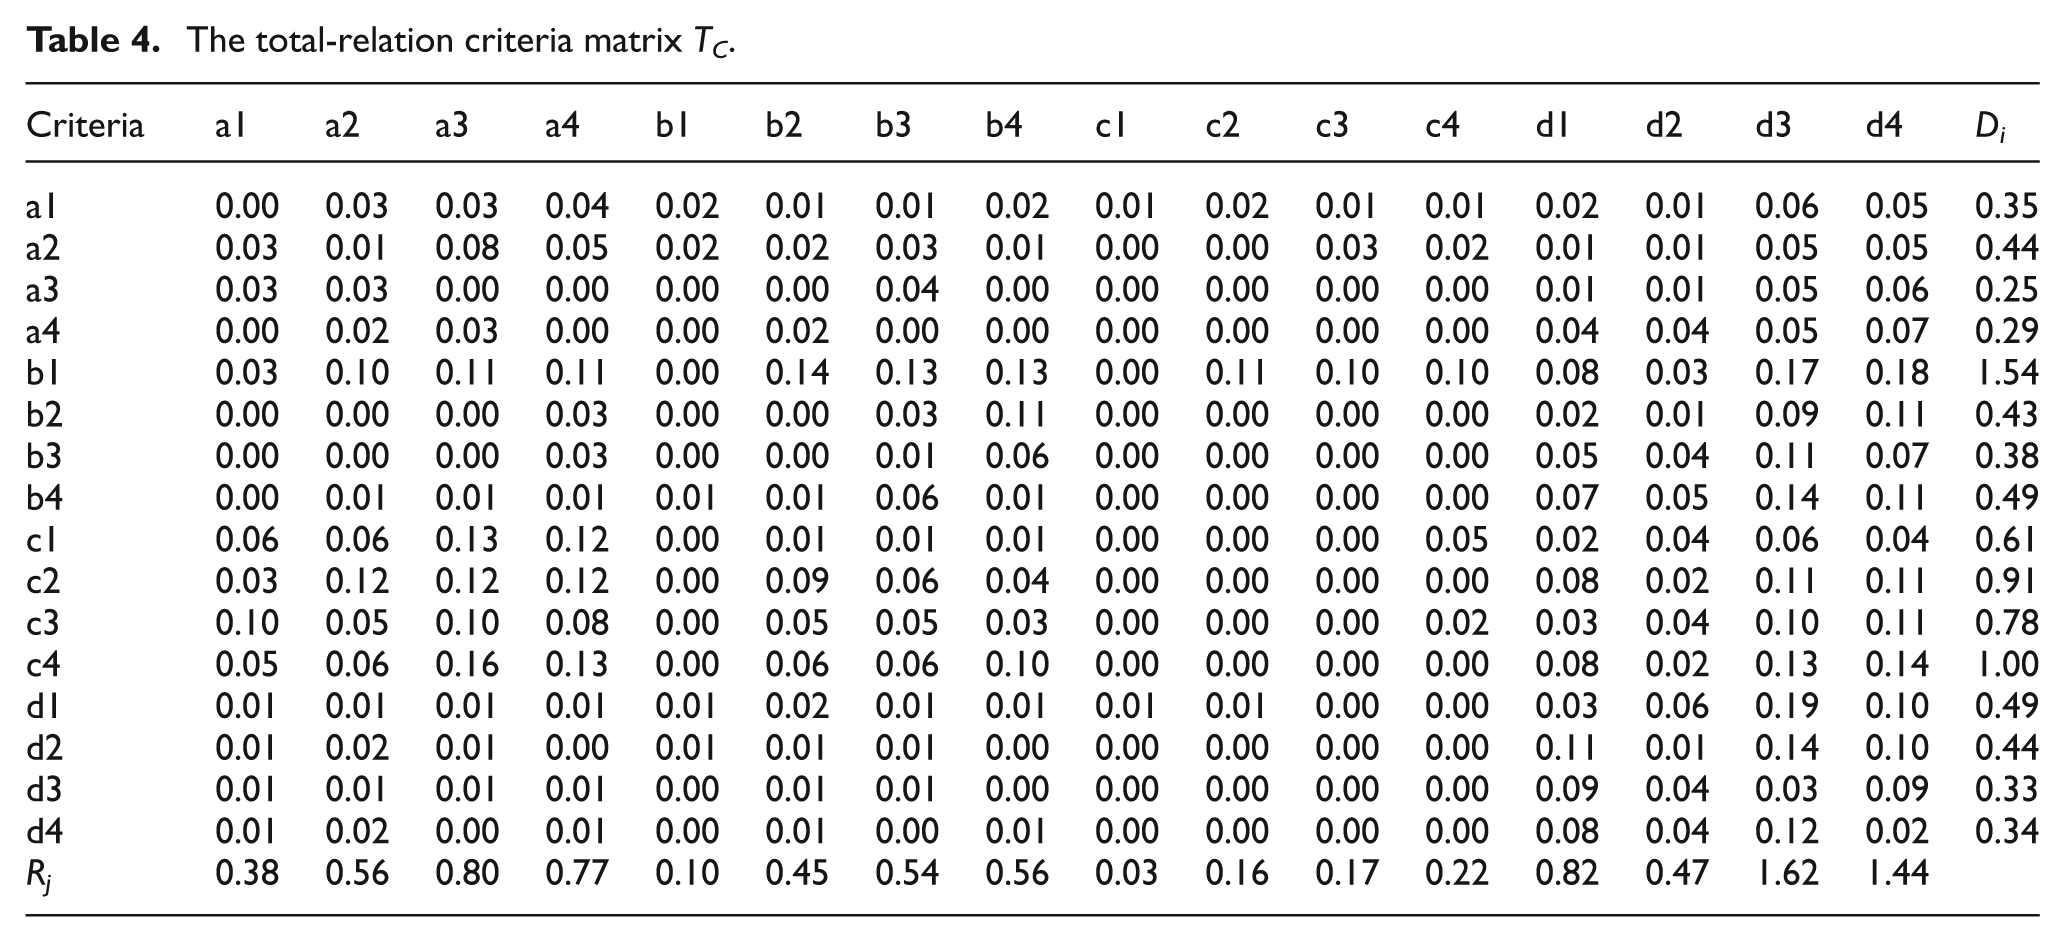
Equations (3), (6), and (7) were used to calculate the total-relation matrix T. The total-relation criteria and dimension matrices were acquired and are shown in Tables 4 and 5.
The total-relation criteria matrix TC.
The total-relation dimensions matrix TD.
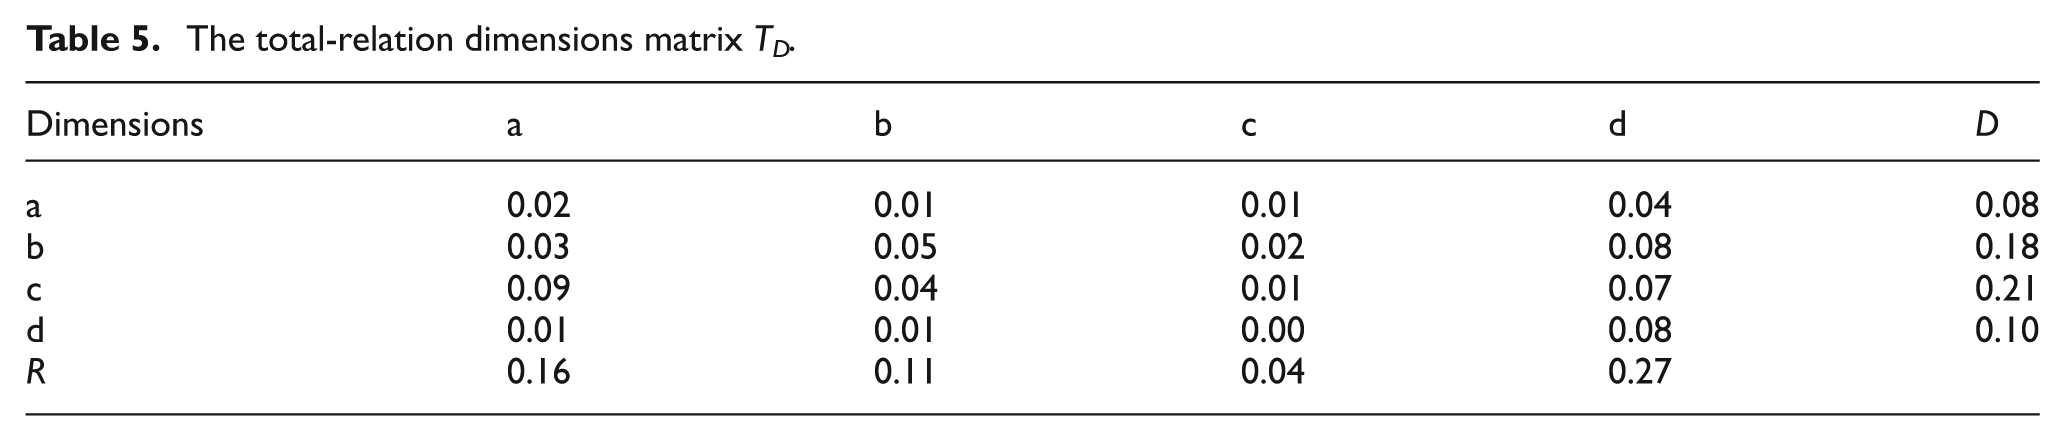
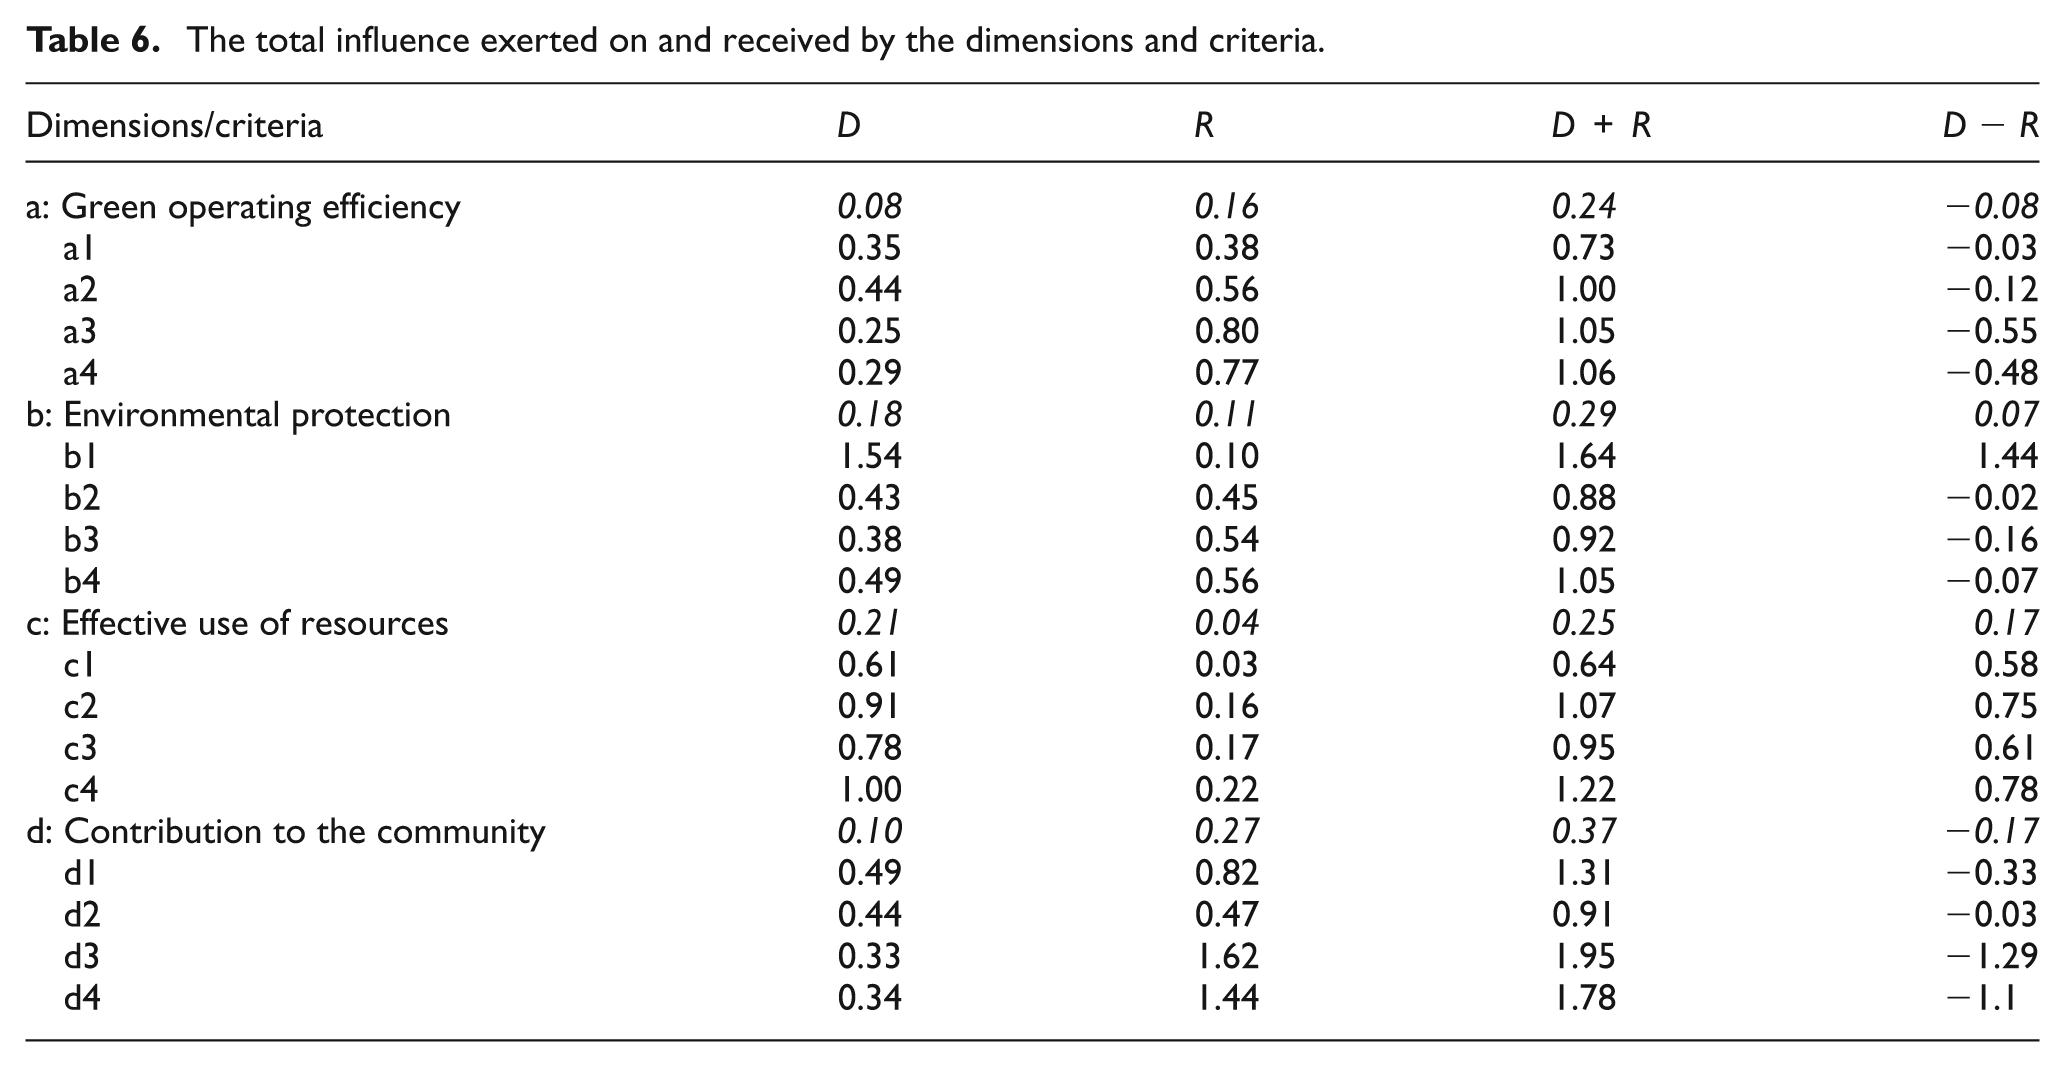
Equations (4) and (5) were used to calculate the Di value of each row and the Rj value of each column. The prominence (D + R) and relation (D − R) were then calculated. Table 6 summarises the total influences exerted on and received by each dimension and criterion. The (D + R) and (D − R) values, shown in Table 6, were calculated based on the total-relation dimension matrix (Table 5), which was calculated according to the total-relation criteria matrix (Table 4).
The total influence exerted on and received by the dimensions and criteria.
Setting the prominence (D + R) as the horizontal axis and relation (D – R) as the vertical axis, a relation chart of the four dimensions and 16 criteria was illustrated, as shown in Figures 3 and 4.
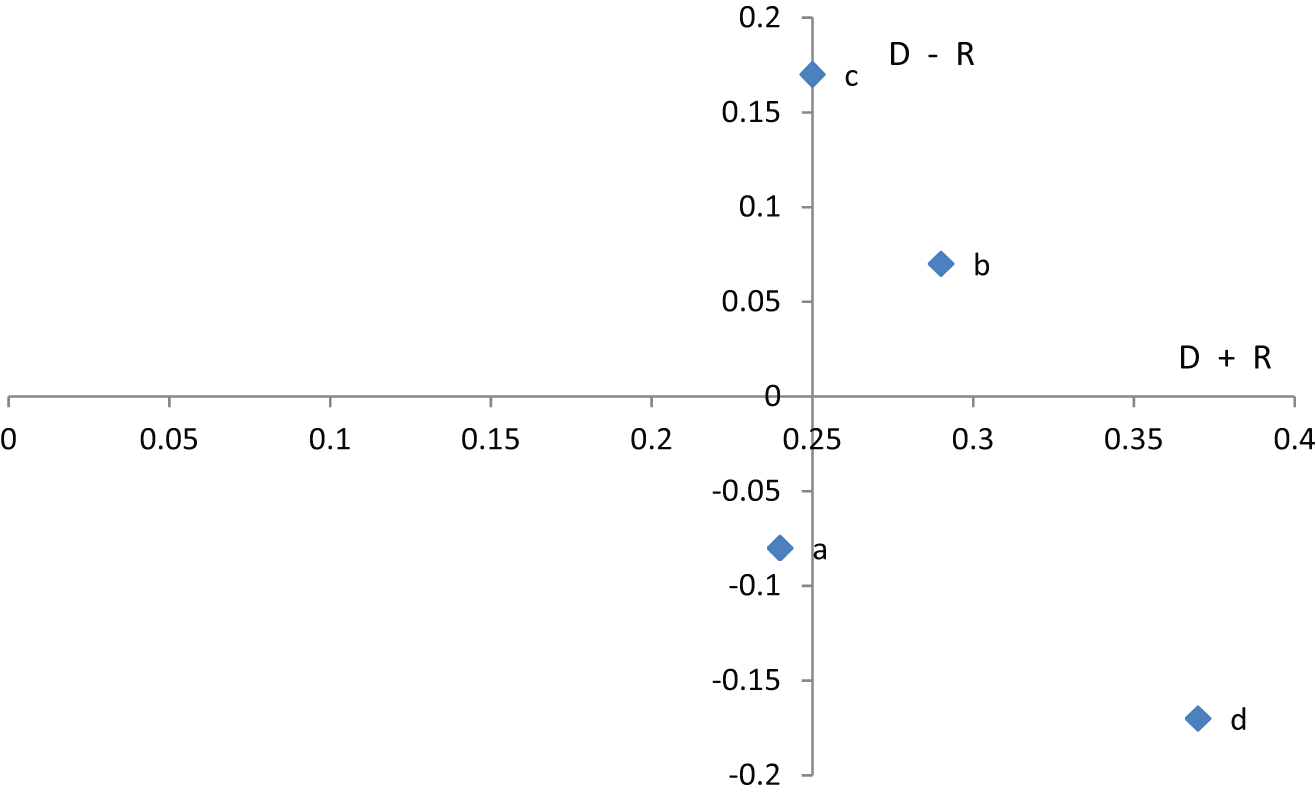
The DANP relations between the four dimensions.
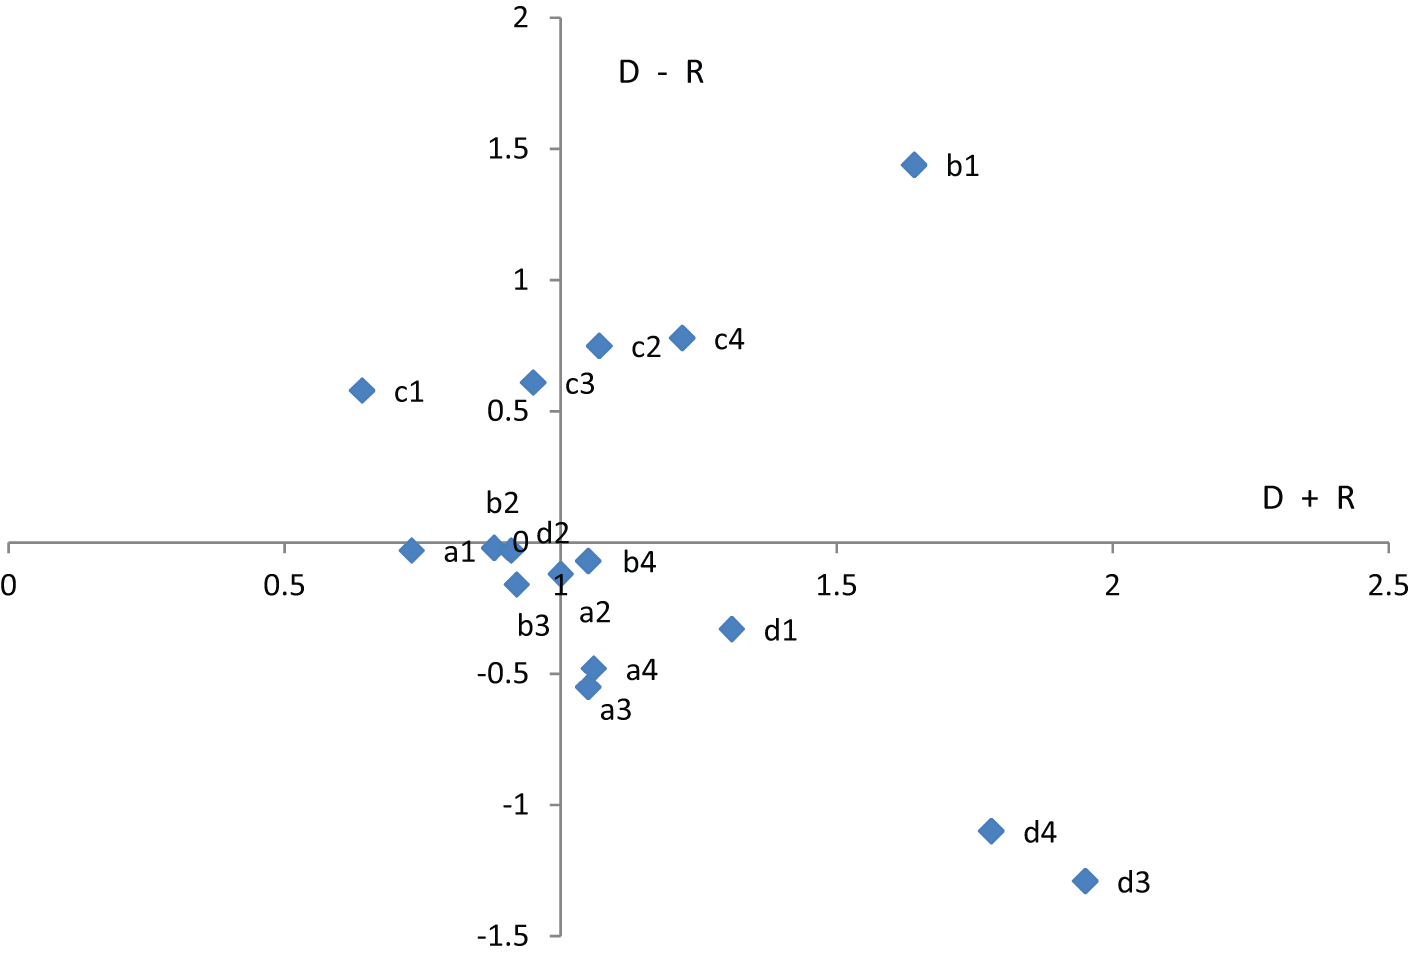
The DANP relations between the 16 criteria.
As shown in Figure 3, among the CSR dimensions, environmental protection (Dimension b) and the effective use of resources (Dimension c) were determined to be the cause attributes – core items affecting other dimensions. Thus, these two dimensions were considered the driving factors for problem-solving.
Figure 3 shows that among the CSR criteria, (b1) environmental equipment expenditure as a percentage of revenue, (c4) comprehensive use rate of other waste materials, and (c2) renewable wastewater use rate were categorised as causes and were determined to be core items affecting the other dimensions. Thus, these attributes were the driving factors for problem-solving.
Calculating the weights of the dimensions and criteria
According to the DANP calculation process, the limited supermatrix of DANP can be calculated using equations (8)–(11) to determine the weights of the four dimensions and 16 criteria (Table 7).
Criteria and weights of green production.
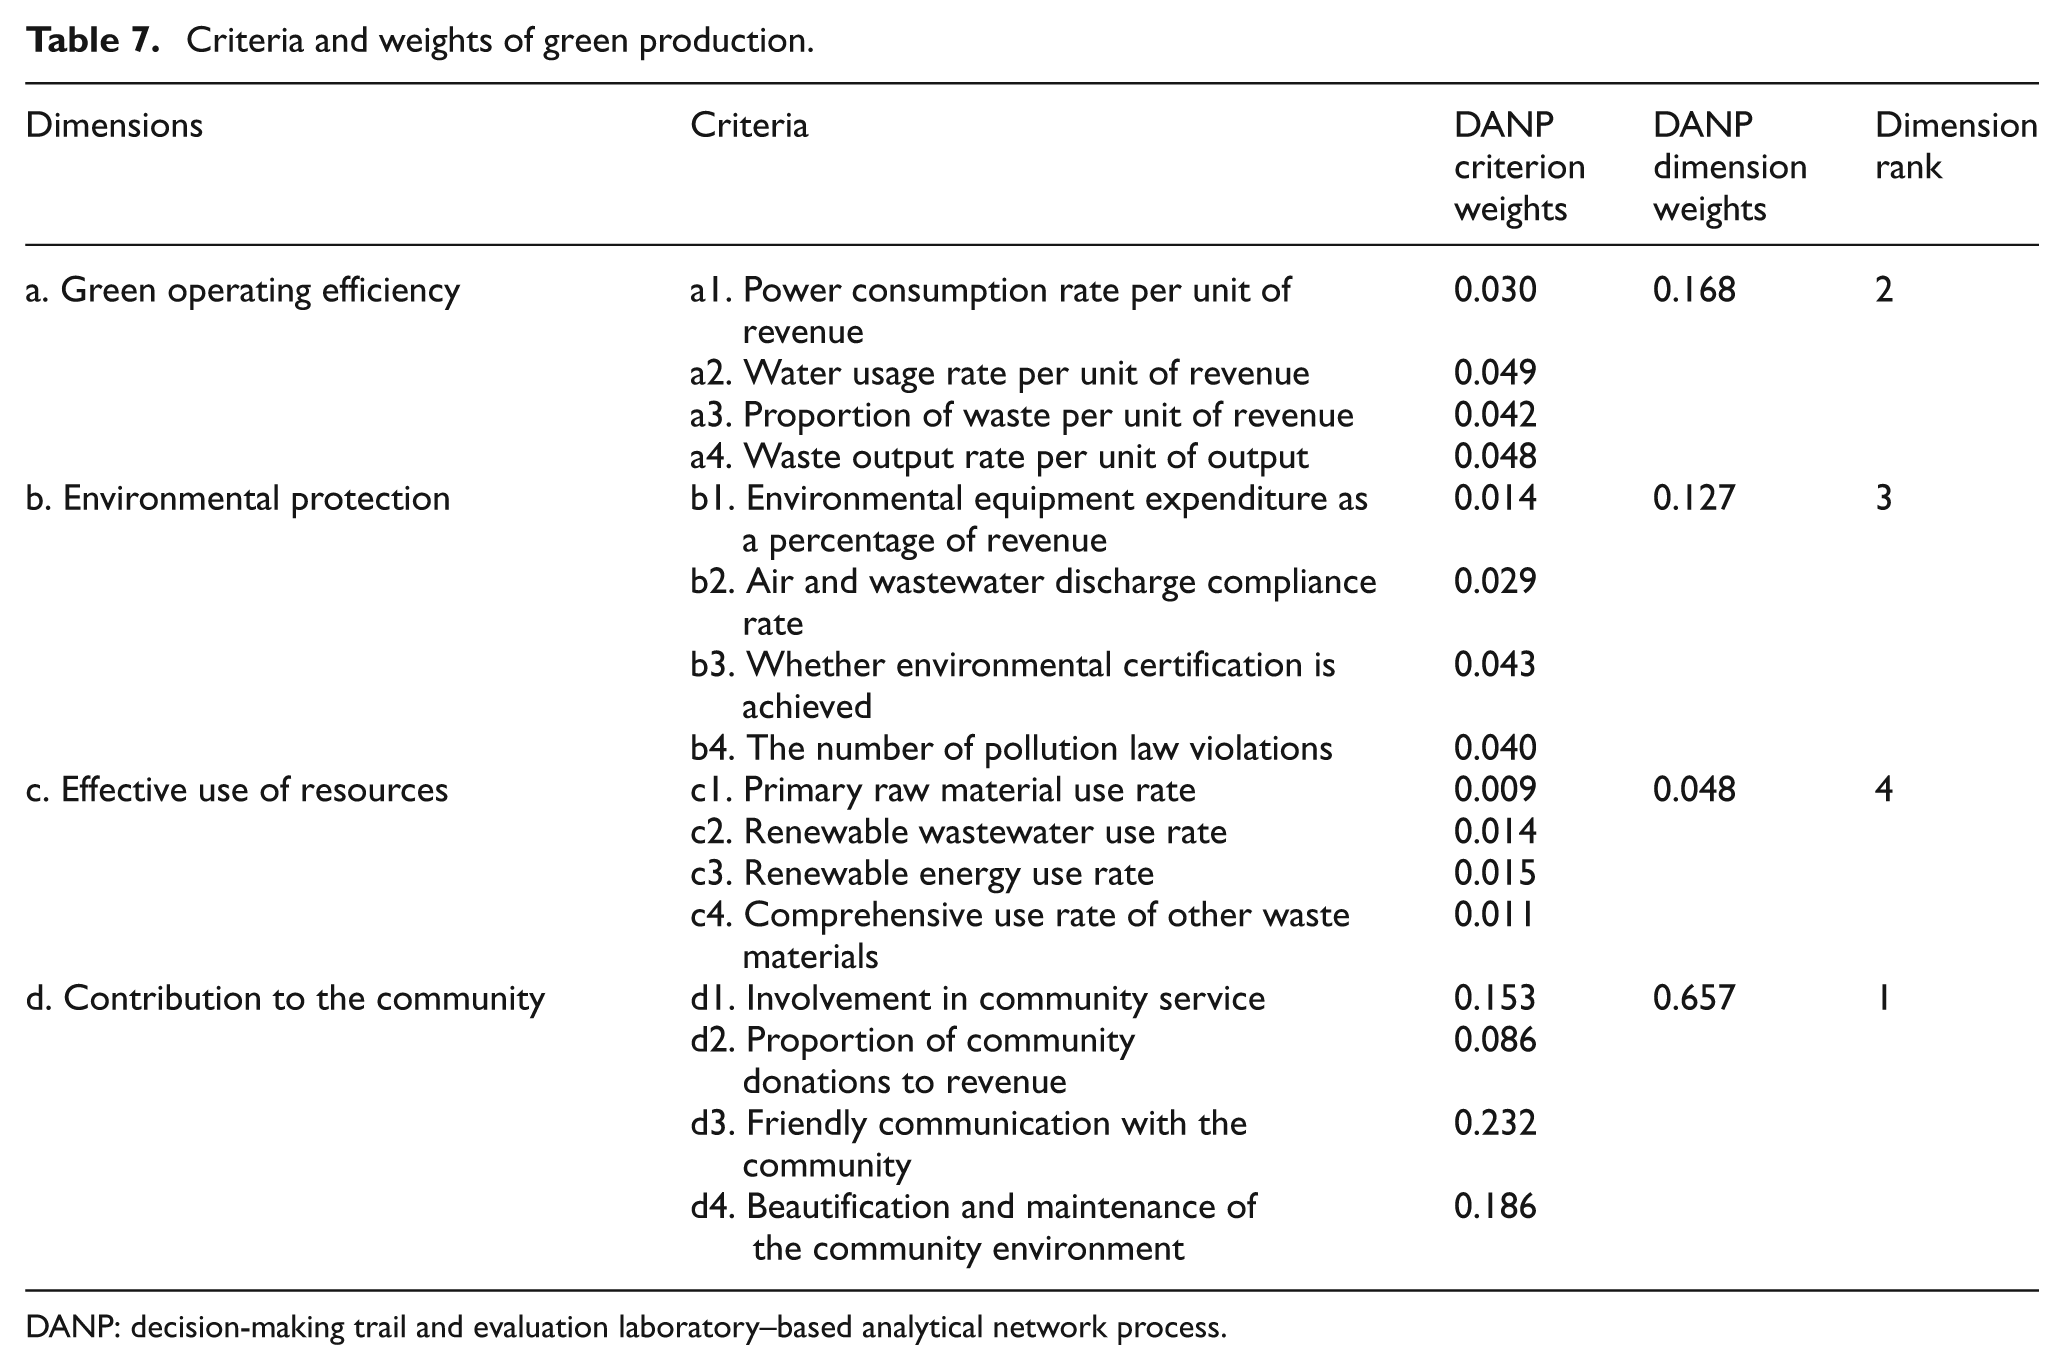
DANP: decision-making trail and evaluation laboratory–based analytical network process.
The DANP weight calculation indicated the following among the four dimensions: Dimension d: contribution to the community the greatest weight (0.657); followed by Dimension a: green operating efficiency (0.168); Dimension b: environmental protection (0.127); and Dimension c: effective use of resources (0.048).
The 16 criteria are as follows: (d3) friendly communication with the community, the greatest weight (0.232)); followed by (d4) beautification and maintenance of community environment (0.186); (d1) involvement in community service (0.153); (d2) proportion of community donations to revenue (0.086); (a2) water usage rate per unit of revenue (0.049); (a4) waste output rate per unit of output (0.048); (b3) whether environmental certification is achieved (0.043); (a3) proportion of waste per unit revenue (0.042); (b4) the number of pollution law violations (0.040); (a1) power consumption rate per unit of revenue (0.030); (b2) air and wastewater discharge compliance rate (0.029); (c3) renewable energy use rate (0.015); (c2) renewable wastewater use rate (0.114); (b1) environmental equipment expenditure as a percentage of revenue yielded (0.014); (c4) comprehensive use rate of other waste materials (0.011); and (c1) primary raw material use rate (0.009).
Discussion
As shown in Figure 3, Dimensions b (environmental protection) and c (effective use of resources) were categorised as causes and were core items that influenced the other dimensions. Dimension d (contribution to the community), though essential, was categorised as an effect and was considered unable to be directly improved. Regarding Dimension a (green operating efficiency), both its influence on other dimensions and the degree to which it was influenced by other dimensions was small, indicating that this attribute was relatively independent.
The 16 attributes were analysed to determine their level of influence and causal relations. The attributes were divided into the following categories based on relation (D − R) and prominence (D + R), as shown in Figure 4.
High relation, high prominence: (b1) environmental equipment expenditure as a percentage of revenue, (c2) renewable wastewater use rate, and (c4) comprehensive use rate of other waste materials were characterised as high relation, high prominence attributes. These attributes were considered cause attributes – the core items and driving factors influencing the other attributes.
High relation, low prominence: (c1) primary raw material use rate and (c3) renewable energy use rate were considered high relation, low prominence attributes. These attributes influenced certain other attributes to a relatively minor degree.
Low relation, high prominence: (d1) involvement in community service, (d3) friendly communication with the community, (d4) beautification and maintenance of the community environment, (a2) water usage rate per unit of revenue, (a3) proportion of waste per unit of revenue, (a4) waste output rate per unit of output, and (b4) the number of pollution law violations were considered low relation, high prominence attributes. These criteria were considered effect attributes; in other words, attributes influenced by other attributes which could not be directly improved.
Low relation, low prominence: (a1) power consumption rate per unit of revenue, (b2) air and wastewater discharge compliance rate, (b3) whether environmental certification was achieved, and (d2) proportion of community donations to revenue were considered low relation, low prominence attributes. These criteria were subtly influenced by other criteria, indicating that they were relatively independent.
Compiling these analyses of the influence level and causal relations indicated that Dimensions b (environmental protection) and c (effective use of resources) were core items and driving factors influencing other dimensions. A reasonable explanation for this phenomenon is as follows. Regarding (b1) environmental equipment expenditure as a percentage of revenue of the environmental protection dimension, corporations could actively invest in environmental protection equipment to reduce the level of pollution caused by wastewater, waste gas, and other waste material, thereby mitigating pollution to implement GP. Regarding Dimension c (effective use of resources), (c2) regenerated wastewater use rate, (c3) renewable energy use rate, and (c4) comprehensive use rate of other waste materials are crucial because corporations could proactively invest in the promotion of research and development and environmental protection to enhance the reuse rates of wastewater, waste heat, gas, and other waste materials. This minimises the wasteful use of resources, facilitates energy conservation, and reduces energy consumption.
Moreover, because Dimensions b (environmental protection) and c (effective use of resources) were main factors considered when solving problems, elevating the criteria in these dimensions promotes enhanced green operating efficiency and contributions to the community.
In conclusion, a green production criteria system (GPCS) comprising four dimensions and 16 criteria was proposed. Table 7 lists the weights of each dimension and criteria.
Conclusion
GP is implemented to save energy, reduce energy consumption, and decrease pollution levels. GP is associated with preventing pollution and can be used to further extend manufacturer responsibility to products and the environment, thereby achieving the goals of ecological benefits and sustainable development.
In this study, a GPCS was established, comprising four dimensions: green operating efficiency, environmental protection, the effective use of resources, and contribution to the community. In total, 16 criteria were grouped into these dimensions. The DEMATEL and ANP methods were combined to produce a DANP model to calculate the degree of influence and causal relations among the criteria and determine the criteria weights. Thus, a comprehensive GPCS was established.
The findings indicated that Dimensions b (environmental protection) and c (effective use of resources) were core items and driving factors affecting the other dimensions. The GPCS established in this study is both a theoretical contribution and has wide practical applications. Subsequent studies could use the DANP model to establish other CS by analysing the degree of influence and causal relations between dimensions and criteria. Alternatively, the CS established in this article could be used to conduct large-scale corporate surveys, providing data regarding GP criteria.
Footnotes
Declaration of conflicting interests
The authors declare that there is no conflict of interest.
Funding
This study was funded by the Department of Social Sciences of the Ministry of Education of the People’s Republic of China (Grant No. 11JJD630002) and National Natural Science Foundation of China (Grant No. 71372092).