
Abstract
Green suppliers form an active and independent green production management system that complies with green manufacturing regulations, eliminates bottlenecks and difficulties encountered by enterprises related to the requirements of green products, and enhances enterprises’ green competitiveness. Previous studies on competitive indices and strategies of green suppliers have generally had two limitations. First, most studies have assumed that competitive indices are independent of one another and are not causally related. Second, several studies have assumed that the weights of the evaluation indices are identical. To overcome these two limitations, this study integrated simultaneous importance-performance analysis and decision-making trial-and-evaluation laboratory methods and proposed a simultaneous importance-performance analysis–decision-making trial-and-evaluation laboratory model. In this study, simultaneous importance-performance analysis was used to explore the green performance and competitive situations of a case company and its competitors. Subsequently, decision-making trial-and-evaluation laboratory was used to calculate the degrees of influence that the competitive indices of green supplier regarding green performance exhibited on each other and to investigate the causal relationships among the competitive indices. Finally, competitive green supplier strategies for the case company were proposed. The results indicated that the method developed in this study not only provides theoretical contributions but also can be applied to businesses.
Keywords
Introduction
Green production (GP) is defined as a set of production processes that conform to environmental protection principles to produce green products and to meet green consumption demands.1,2
GP is a relative and dynamic concept. GP processes and green products are relative to the original production process and original product, making GP a process of continual improvement. As technology advances and the economy grows, the meaning of GP continues to expand. Businesses producing green products should introduce a clean GP production concept into their manufacturing process and upgrade their high energy-consuming production equipment that engenders pollution. When designing green products, businesses should consider expanding the functionality of these products and identifying new applications to reuse them. Thus, they can reduce the amount of raw materials consumed and the waste produced. Moreover, businesses should focus on providing appropriate services to make waste recycling and treatment processes more convenient for consumers. These services reduce or eliminate the pollution that consumers inadvertently create because of the inconvenience of waste disposal.2,3
In a green supply chain (GSC), suppliers must consider both the products and ecofriendly management methods and incorporate ecofriendly principles into the supplier management mechanism. The goal of a GSC is to encourage suppliers to produce green products and increase their market competitiveness. In practice, businesses have proposed environmental-based procurement projects, performance standards, and assessment processes for most suppliers to follow. Other businesses list all the substances that are harmful to the environment and request suppliers to exclude these substances from their raw materials or during the packaging and emission processes.4,5
This study examined green supplier (GS) competitive attributes and competitive strategies in a GSC. We combined the simultaneous importance-performance analysis (SIPA) model with the decision-making trial-and-evaluation laboratory (DEMATEL) method, creating a SIPA-DEMATEL model. The SIPA was employed to investigate the green performance of the case company and its competitors, and the DEMATEL method was adopted to calculate the degree of influence and the causal relationships among their attributes. Finally, we proposed competitive strategies for the case company.
Literature review
GS assessments
Walton et al. 6 stated that a GSC includes five processes: procurement, raw material management, transportation, packaging, and recycling and reverse logistics. Processes influencing green performance such as procurement, transportation, pollution, and recycling management are components of crucial green management decisions that businesses must make.7–9
The Laws of Green Industry that integrate industrial policies and environmental resource laws can facilitate environmental protection and resource conservation and promote industrial development. The main function of the Laws of Green Industry and Green Environmental is to vigorously develop a green consumption market and recycling industry. Green consumption and recycling must be closely connected to GP to enhance the environmental performance of manufacturing companies. 9
To meet the GP specifications, GSs must integrate GP into their current management systems and refer to requirements and practices related to environmental protection as tools for establishing their own green production management system (GPMS). Consequently, the bottlenecks that they encounter during green product production can be resolved to enhance their green competitiveness. In addition, GPMS provides businesses with the ability to continually offer parts that meet set standards and produce green products that satisfy market demands. Furthermore, this system enables businesses to gain trust from international manufacturers.
GS evaluation indices possess four management functions: 7 environmental information platform, pricing and negotiation, tracking and control, and technology and strategy development, as shown in Figure 1.
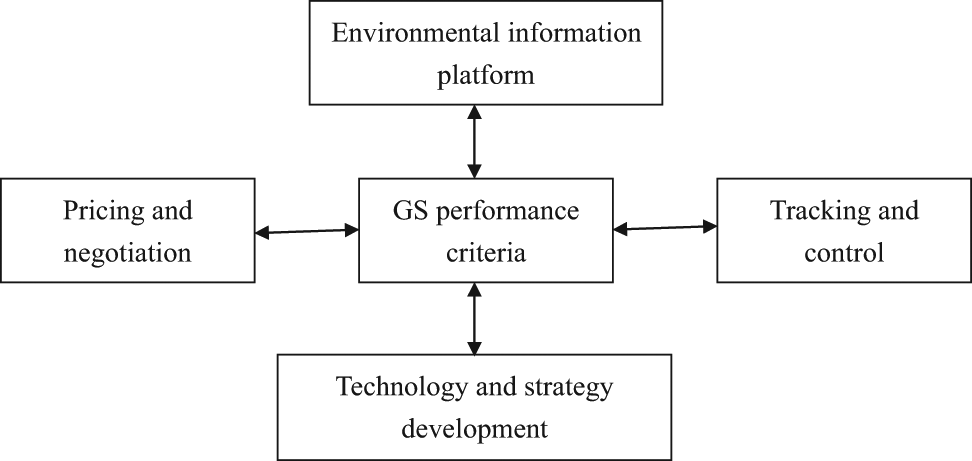
Evaluation of green supplier.
Competitive GS strategies and evaluation criteria
To determine whether suppliers meet the green performance requirements specified by businesses, Noci 10 devised a four-stage GS selection process: (1) develop environmental improvement strategies according to the business’ environmental objectives and strategies; (2) determine the environmental assessment criteria based on existing suppliers, technologies, and environmental regulations; (3) select a decision-support method to analyse the suppliers’ green performance; and (4) implement and monitor the operation.
Handfield et al. 11 selected GSs using an analytical hierarchy process and divided the GS criteria into four dimensions: the effectiveness of an environmental management system, continued compliance with relevant laws, complete internal management procedures, and green image. Zhang et al. 12 indicated that green procurement and GS management substantially affect medium-to-large enterprises. They chose 28 case companies, conducted field surveys, and subsequently employed a multivariate analysis to establish GS selection criteria.
The methods used by an enterprise to improve its environmental performance, and the enterprise’s competitive strategies vary according to the enterprise’s role within a supply chain. Analysing the competitive strengths and weaknesses of the environmental performance of a company can help that company allocate resources, enhance resource efficiency, and improve environmental performance. Based on a literature review of GS evaluation indices and competitive strategies, this study established GS competitive indices. Overall, 10 competitive indices were classified into four dimensions. Details are provided as follows.
Green manufacturing performance: waste gas emission, wastewater discharge, and hazardous waste.
Environmental management performance: the effectiveness of the environmental management system, continued compliance with relevant laws, and complete internal management procedures.
Green management performance: green sales and green image.
Green product performance: the volume of products recycled and green product packaging.
Green industry legal perspective
Following the spread of green concepts worldwide, enacting green practices has been gradually popularised among international industries. Governments have actively promoted and encouraged adopting green practices through policy implementation, and consumers have cultivated increasing green consumption awareness. In addition, global green trade regulations have been transformed from nonmandatory measures to requirements with a certain degree of mandatory power. Green consumption has revolutionised the production field. The global green consumption demands have reshaped the concepts of production enterprise managers worldwide. Thus, producers can no longer ignore the environment. To satisfy green consumption demands, producers must develop novel green products by changing the traditional production model and implementing GP practices. Moreover, enterprises must establish an innovative and environmentally friendly image to attract consumers. Therefore, the green industry has increased rapidly, and green products have prevailed globally. In future international markets, products that severely pollute the environment and undermine ecological balances will be restricted, prohibited, and eventually replaced by green products that are pollution free and environmentally friendly.7,8
Previously, enterprises were not penalised for causing pollution; thus, they ignored environmental problems. However, because of the increased green consumption tendency, amendments to environmental laws, and demands requested by conservationists, the environmental pressure on enterprises has increased. Advanced countries, such as European countries, the United States, and Japan, have created legislation using novel legislative techniques and concepts and have developed content and relevant laws that can be implemented to adjust the relationship between economics and environmental protection to one that benefits economic development and minimises social costs. The Laws of Green Industries, which combine industrial policy and laws pertaining to environmental resources, can enhance environmental protection and resource conservation and can promote industrial development, particularly among environmentally friendly industries.
Regarding environmental protection legislation in Taiwan, the Taiwan Environmental Protection Administration has sequentially established environmental regulations to legislate the principles of environmental protection, negotiation, and cooperation; these regulations take into account environmental public interest and complete the environmental protection laws according to environmental protection policy guidelines. Examples of the environmental protection laws in Taiwan are listed as follows: the Environmental Protection Act, which serves as an environmental protection constitution that can be used to control public nuisances and protect the environment; the Environmental Impact Assessment Act, which considers how to optimally use environmental resources with technological integration methods; the Soil Pollution Remediation Act, which is an innovative system used for controlling public nuisances; and the Public Nuisance Disputes Mediation Act, which involves a system that resolves public nuisance disputes fairly and effectively. 7
Research methodology
Previous studies on competitive indices and strategies of GSs possess two limitations. First, most studies have assumed that the competitive indices are independent of one another and are not causally related. Second, several studies have assumed that the weights of the evaluation indices are identical. To overcome these two limitations and to explore the competitive attributes and strategies of GSs based on the GP concept, we introduced a new SIPA-DEMATEL model by combining the SIPA model with the DEMATEL method in this study. We then investigated the green performance of the case companies and their competitors using SIPA and calculated the degree of influence and causality between their competitive attributes using the DEMATEL method. Finally, competitive strategies for the case company in this study were proposed.
Based on the literature discussion regarding GS Assessments, competitive GS strategies, and evaluation criteria, the GS criteria were categorised into four major dimensions and 10 criteria for analysis. These dimensions and criteria were accredited by experts.
SIPA
In 1986, Burns 13 introduced SIPA, which enables a simultaneous analysis of the importance of attributes, the performance of the business, and the performance of the competitors. The basic function of SIPA is to compare the target business with its competitors by administering questionnaires that address the desired attributes. The level of importance that the target businesses attach to a particular attribute is characterised as ‘high’ or ‘low’, and the scores assigned to the attributes are separated into ‘good’ and ‘poor’. This analysis enables a business to determine performance differences between itself and its competitors in the attributes that clients consider valuable. Businesses can thus devise corresponding competitive strategies to allocate their resource investment.
Because of the advantages of Burns’ SIPA model in 1986, it has subsequently been used in various studies, including in the study by Dolinsky, 14 who used SIPA to assess the importance of the attribute health care and competitor performance. Yavas and Shemwell 15 employed SIPA to devise 16 types of competitive strategies that can be used by businesses with various service attributes in the competitive market. Bei and Shang 16 adopted SIPA to conduct a comparative analysis of the difference in service features between public and private banks and publicly and privately owned gas stations. Lee and Hsieh 17 applied SIPA to analyse the competitive advantage, competitive disadvantage, and competitive strategies of telecommunication service operators. Tsai et al. 18 employed SIPA to investigate how manufacturing companies acquire additional purchase orders and maintain a competitive advantage.
DEMATEL
The DEMATEL method was developed by Gabus and Fontela 19 at the Battelle Memorial Institute Geneva Research Centre. It was originally created to resolve complicated global problems such as racism, hunger, environmental protection problems, and energy problems.19,20
The DEMATEL method involves the use of matrix computation to calculate the degree of influence and causal relationship among factors. Complex problems are structuralised using a causal diagram, and criteria are divided into cause and effect groups to clarify the nature of the problem and identify core problems and methods for improvement.21–25
In recent years, the DEMATEL method has been widely used to resolve problems in various fields. Lin and Wu 26 used fuzzy DEMATEL to make group decisions. Lee et al. 21 verified the efficiency of the DEMATEL method by applying it to the technology acceptance model. Lee and Hsieh 17 employed DEMATEL to analyse the causal relationships among the various service attributes in the telecommunications industry and adjusted the importance of these attributes to improve business competitiveness. Wu 27 employed fuzzy DEMATEL to investigate the core problems and implementation methods of knowledge management.
The DEMATEL framework and computation steps are described as follows:
Define the attribute property and recommend a measurement scale
List and define the various attributes that may affect the performance of a complex system using various tools and methods such as brainstorming, expert-opinion, and literature review methods.
Establish direct-relation matrices
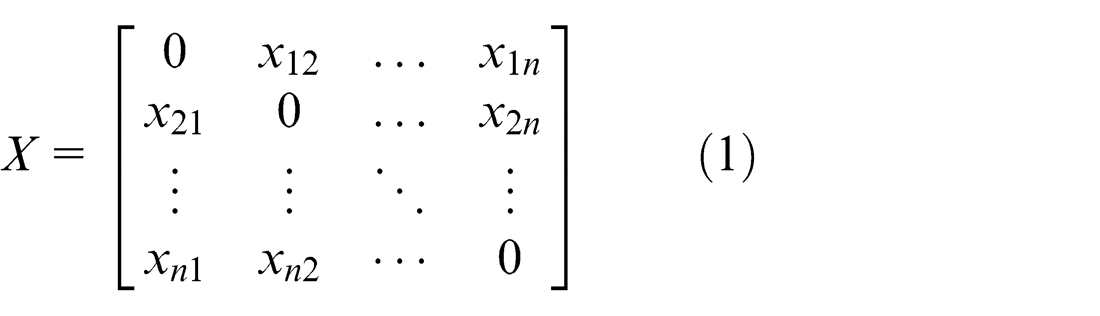
If n attributes have an effect on a complex system, using the expert-opinion method, the attributes can be organised into an n × n direct-relation matrix X based on the relationship and degree of influence among the attributes. In equation (1), Xij denotes the degree to which attribute i influences attribute j, and the diagonal matrices Xii are set to 0
Calculate the normalised direct-relation matrix
To calculate the normalised direct-relation matrix, Lin and Wu, 26 Lee et al., 21 and Lee and Hsieh 17 used the column vector with the highest sum as the normalisation basis
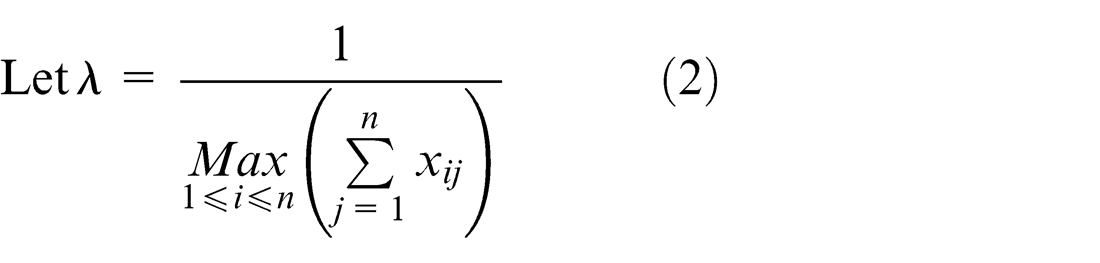
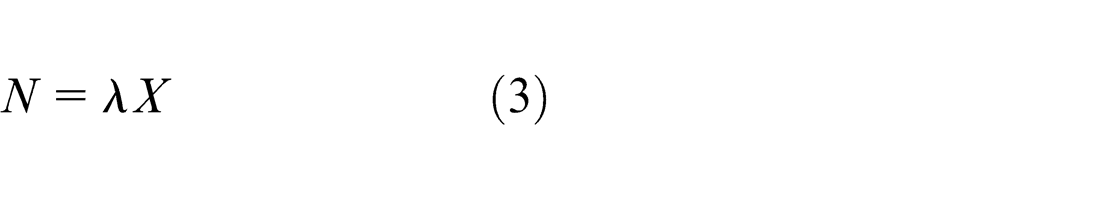
Next, the direct-relation matrix X is multiplied by λ to obtain the normalised direct-relation matrix
Calculate the direct–indirect relation matrix
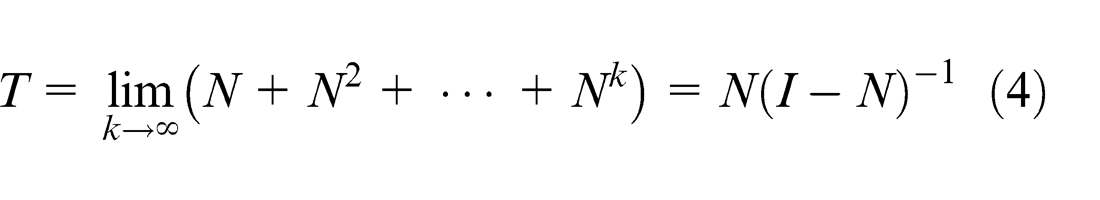
Once the normalised direct-relation matrix N is obtained, the identity matrix I can be used to derive the indirect–direct relation matrix T, which is also called the total-relation matrix
Calculate the degree to which each attribute influences every other attribute
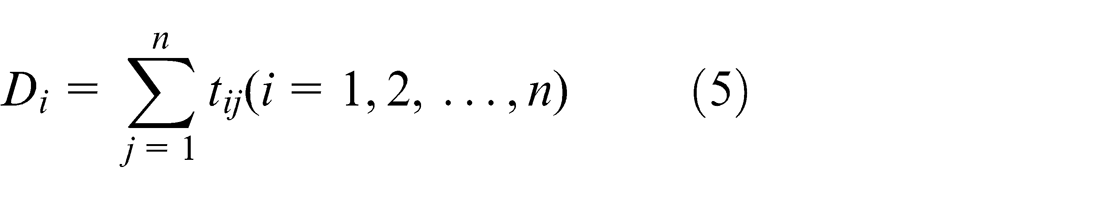
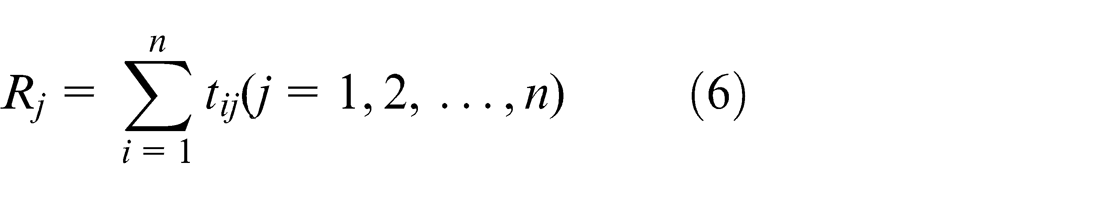
Once the direct–indirect relation matrix T is obtained, the influence of the attributes on each other can be calculated. tij was first defined as the attribute properties in T in which i, j = 1, 2,..., n. Symbol Di is the sum of the ith row and represents the sum of the influence that attribute i has on the other attributes. Rj is the sum of the jth column and represents the sum of the influence that other attributes have on attribute i. Both Di and Rj are obtained using T and represent the direct and indirect influences
Draw the causal diagram
Dk + Rk is defined as the prominence, in which k = i = j = 1, 2,..., n. Dk + Rk represents the total influence that attribute k has on the other attributes and the influence that the other attributes have on attribute k. This value represents the degree of importance that k has in a given problem. Conversely, Dk − Rk is defined as the relation, indicating the difference between the influence that attribute k has on the other attributes and the influence that the other attributes have on k. This value reveals whether the attribute is a cause or an effect in a given problem. If the value is positive, the attribute is considered a cause, whereas a negative value denotes that the attribute is an effect.
SIPA-DEMATEL model
SIPA can be used to simultaneously analyse the importance of attributes, the performance of the business, and the performance of competitors, thereby creating a total of eight possible competitive dimensions. When studying the competitive attributes and competitive strategies of GSs, attributes under the dimensions of neglected opportunity, competitive disadvantage, competitive advantage, and false advantage must first be investigated. However, because SIPA assumes that each of the attributes influencing business performance is independent and that no causal relationships exist among the attributes, causal relationships among the attributes must be identified following the use of SIPA. To determine the degree of influence and causal relationships among the 10 GS competitive attributes of four dimensions, a DEMATEL analysis was conducted to determine the core attributes and devise a corresponding competitive strategy.
Results and discussion
A company that manufactures integrated circuit (IC) substrates, called Company X, was used as the case company for this study. The primary function of the IC substrates is to serve as a carrier for ICs and connect the signals between chips and printed circuit boards using the IC substrates’ internal circuits. IC substrates are a key component in the semiconductor packaging process because they protect and fixate the electric circuits and conduct additional heat; they are also a crucial component of motor and electronic products. However, IC substrates produce substantial pollution. The IC substrate manufacturing process is similar to that used for printed circuit boards in that it requires a large amount of electricity, water, and chemical solutions, which create various types of wastewater, waste liquids, and solid wastes. These wastes include various organic pollutants and high concentrations of heavy metals such as copper, lead, and nickel, thus generating a high level of pollution. Therefore, failure to implement pollution prevention and control results in severe environmental pollution. Consequently, the reduction in IC substrate production and pollution remains a great concern for both the government and businesses.
According to the 2014 Prismark Laminate Report, Companies X, Y, and Z were ranked seventh, sixth, and tenth, respectively, according to their global market share. We used Company X as the case company and selected Companies Y and Z as its competitors to explore their green performance competitive attributes and competitiveness. Finally, we recommended appropriate competitive strategies to improve Company X’s green performance.
Study questionnaire
Based on the literature discussion regarding the GS Assessments, competitive GS strategies, and evaluation criteria, the GS criteria were categorised into four major dimensions and 10 criteria for analysis. These dimensions and criteria were accredited by experts.
Two questionnaires, the SIPA questionnaire and the DEMATEL questionnaire, were designed in this study. Both questionnaires comprised the four dimensions and 10 attribute items. The four dimensions were green manufacturing process performance, environmental management performance, green management performance, and green product performance. The 10 attributes were waste gas emission (a1), wastewater discharge (a2), hazardous waste (a3), the effectiveness of the environmental management system (b1), continued compliance with relevant laws (b2), complete internal management procedures (b3), green sales (c1), green image (c2), volume of products recycled (d1), and green product packaging (d2).
The SIPA questionnaire was used to investigate the importance and performance of the 10 criteria for Companies X, Y, and Z. The questionnaires were distributed between 20 March 2014 and 15 April 2014. In the questionnaire, a 7-point Likert scale was adopted in which 1 and 7 indicated strongly disagree and strongly agree, respectively. The importance and performance levels were examined using close-ended question items. A total of 20 questionnaires were administered to the deputy director of procurement, the vice president of technology, or the general managers of 20 global companies that purchase IC substrates. Of those questionnaires, 18 valid questionnaires were returned, indicating a return rate of 90%.
Concurrently, the DEMATEL questionnaire was used to collect the personal opinions of an expert group concerning the 10 green performance attributes of GSs. The questionnaires were distributed between 18 April 2014 and 30 April 2014, and a 7-point Likert scale was employed in which 6 and 0 signified maximal and zero effect, respectively. The attributes were scored based on the level of importance. The study participants comprised 14 experts, 6 of whom were general managers in electronic system companies who were responsible for the purchase of IC substrates. The remaining participants comprised the following: two general managers from IC substrate companies, four professors, and two government officials from the Environmental Protection Administration of Taiwan. We personally visited each of these participants. After explaining the content of the questionnaires, the questionnaires were provided for the study participants to complete. A total of 14 questionnaires were distributed, and 14 valid questionnaires were returned, yielding a return rate of 100%.
SIPA results
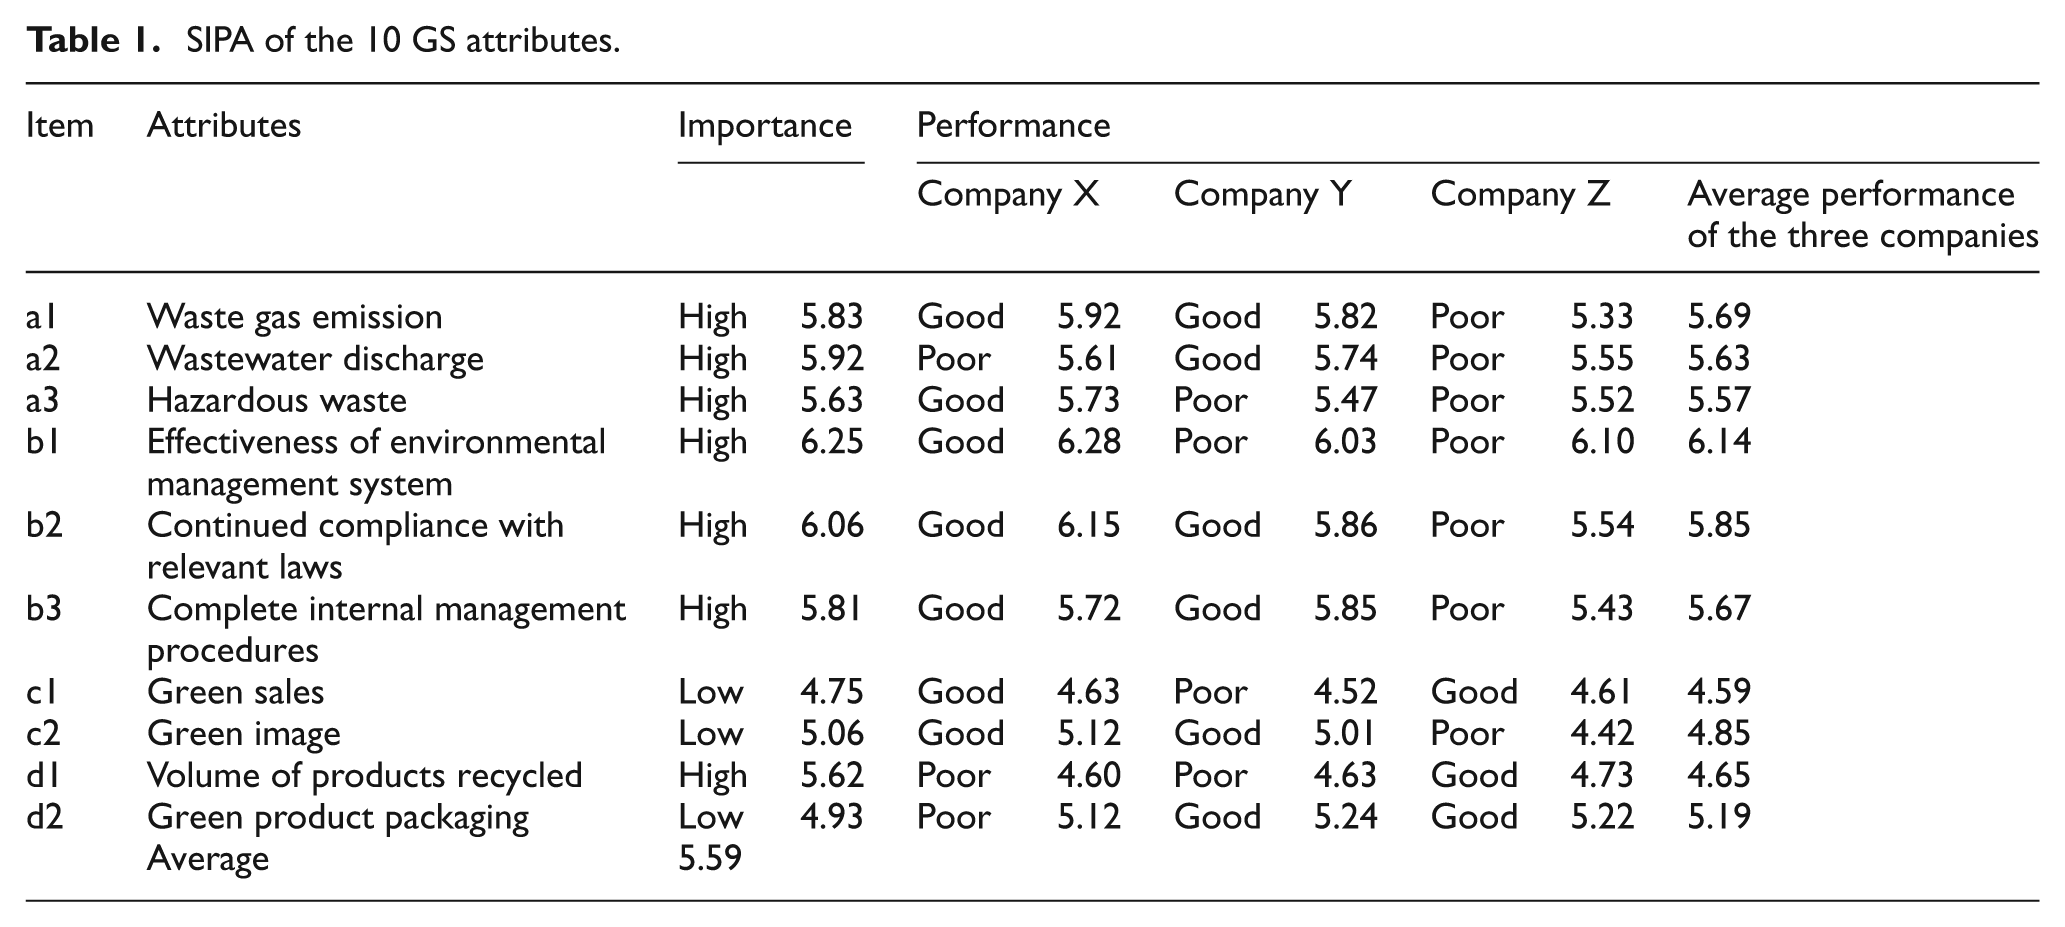
We used the average importance score (5.59) as the standard and rated the importance level as ‘high’ or ‘low’ accordingly. Concerning business performance, we used the average company performance as the basis, rating the performance of each business as ‘good’ or ‘poor’, as shown in Table 1.
SIPA of the 10 GS attributes.
To analyse the market competition between Company X and Companies Y and Z, the competitors of Company X were considered as one unit. The market share of Companies Y and Z was then used to calculate their weighted performance. Based on the importance of each attribute, the performance of Company X, and the weighted performances of Companies Y and Z, the marketing strategies of Company X were devised using SIPA. The results are shown in Table 2.
SIPA of competitive strategy.
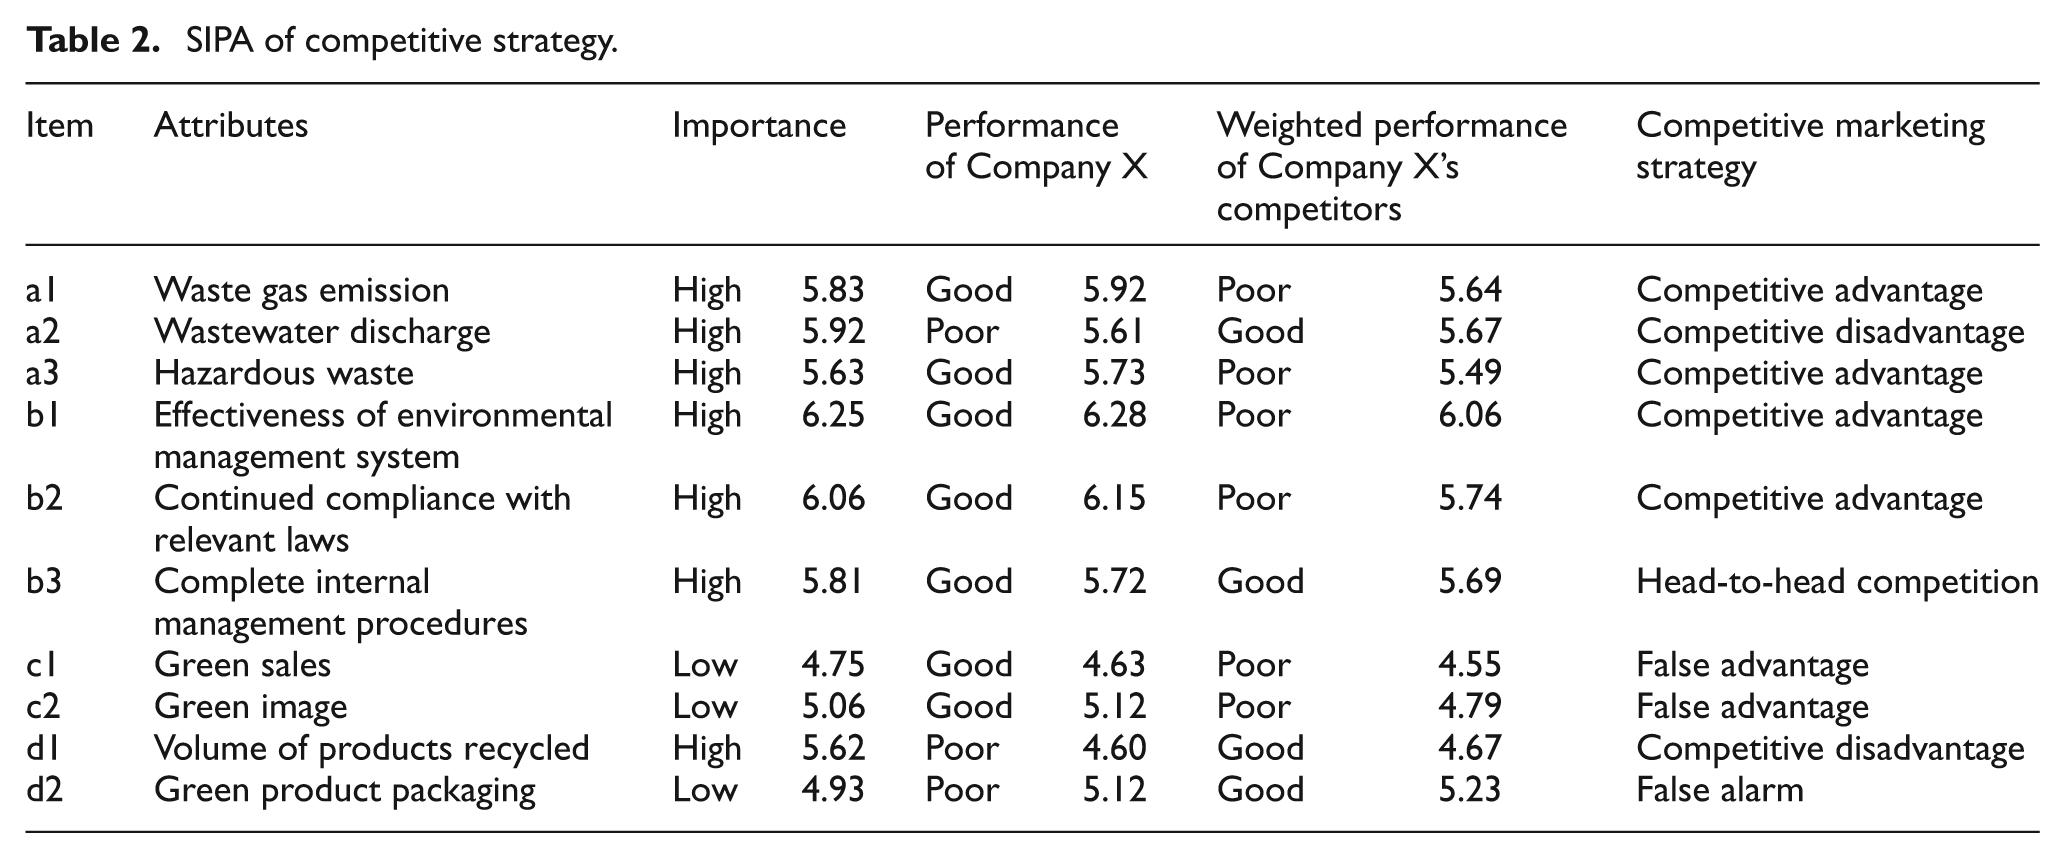
The SIPA results indicated that Company X had a competitive advantage in the attributes of waste gas emission (a1), hazardous waste (a3), effectiveness of its environmental management system (b1), and continued compliance with relevant laws (b2). These four attributes were Company X’s strengths and should be maintained to achieve favourable green performance. Regarding wastewater discharge (a2) and the volume of products recycled (d1), Company X was at a competitive disadvantage and thus must gather resources to increase the competitiveness of these two attributes to obtain a competitive advantage and improve its green performance. Concerning green sales (c1) and green image (c2), Company X possessed a false advantage. Although the company exhibited superior performance compared with that of its competitors, these attributes had a low level of importance to the clients, and the company should consider transferring resources to other aspects. The attribute green product packaging (d2) was classified as a false alarm. Although Company X exhibited a performance inferior to that of its competitors, this criterion had a low level of importance to the clients; thus, it would not influence the company’s green performance.
DEMATEL results
The expert opinions are shown in Table 3. The scores given by the 14 experts were averaged to one decimal place to produce a 10-attribute table. The matrix contained 100 squares. After removing the diagonal attributes that exerted zero influence on each other, 90° of influence was obtained.
Initial direct-relation matrix X.
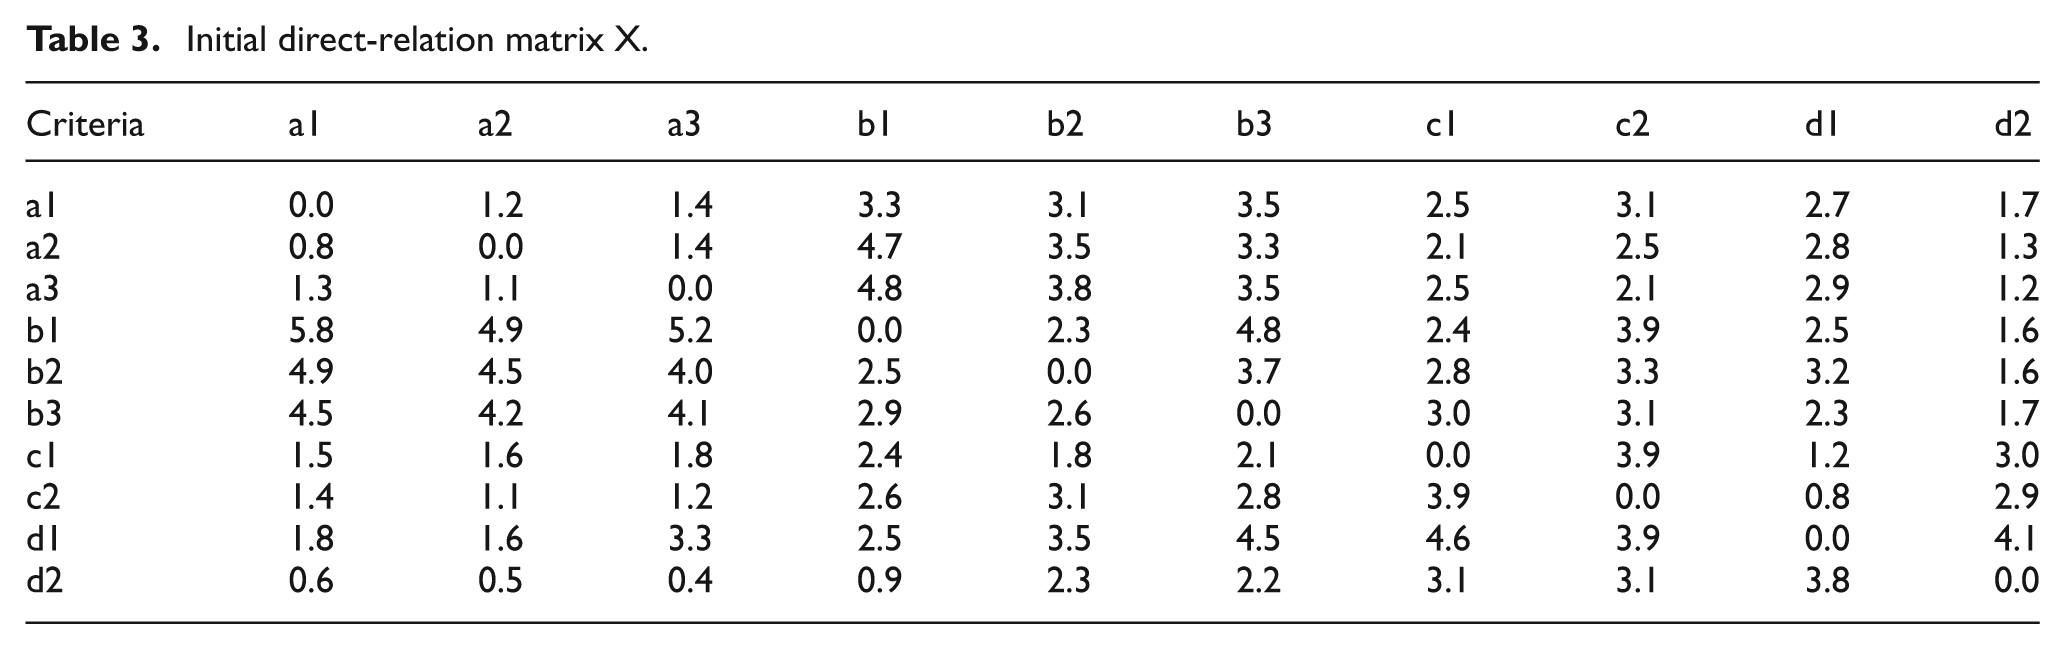
To calculate the normalised direct-relation matrix, the column vector with the highest sum was used as the normalisation benchmark. The reciprocal of this value was λ. Using equation (2), the direct-relation matrix X was multiplied by λ to produce a normalised direct-relation matrix N. The correlation coefficient was rounded to two decimal places, as shown in Table 4.
Normalised direct-relation matrix T.
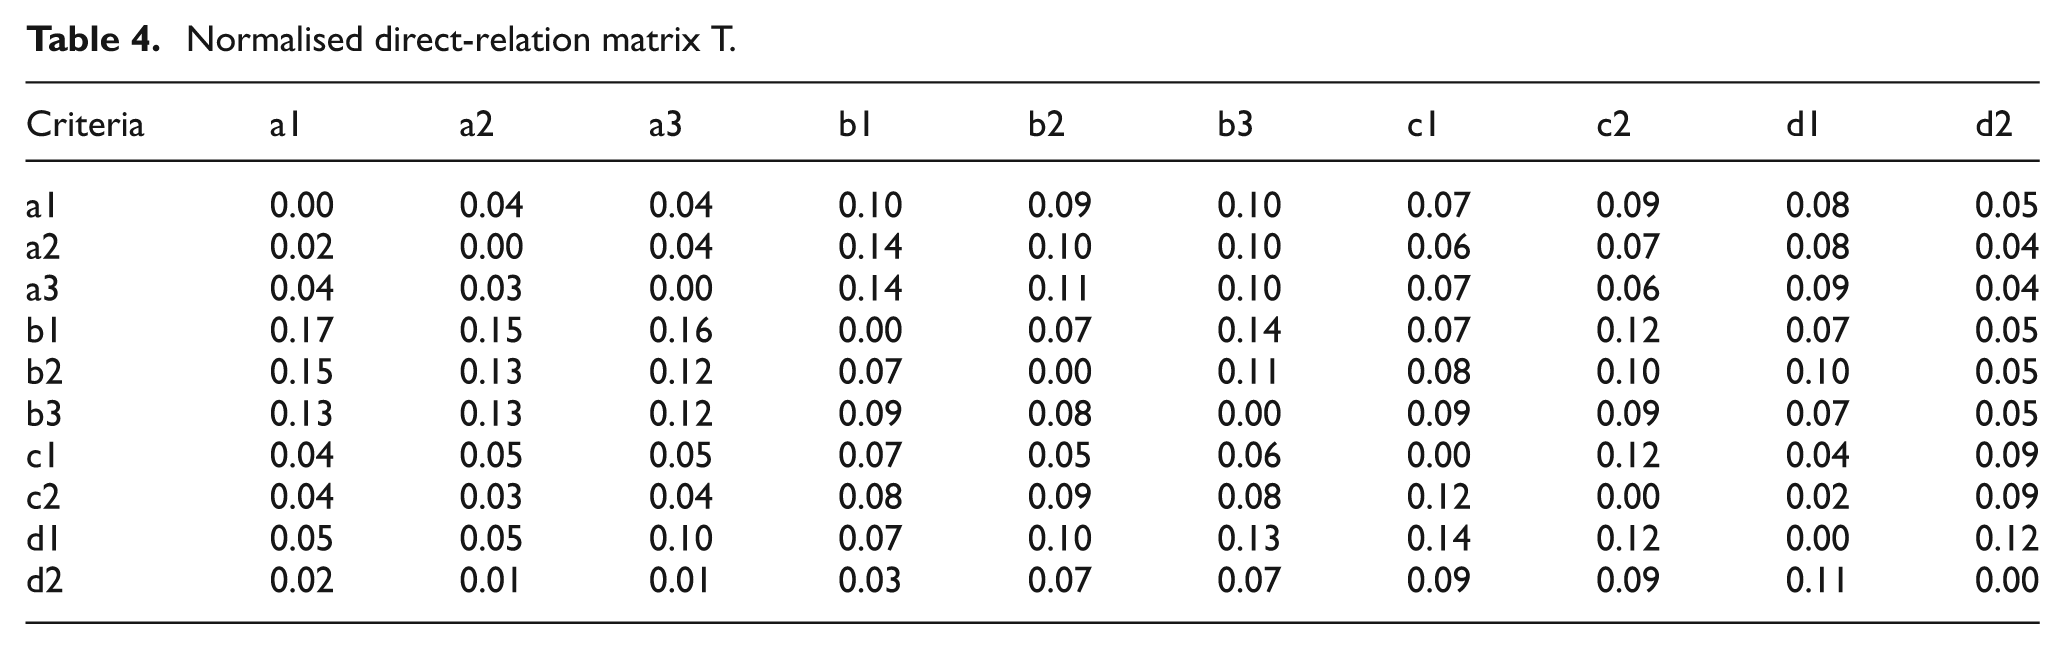
By using equations (3) and (4), the total-relation criteria matrix T was acquired, as shown in Table 5.
Total-relation criteria matrix TC.
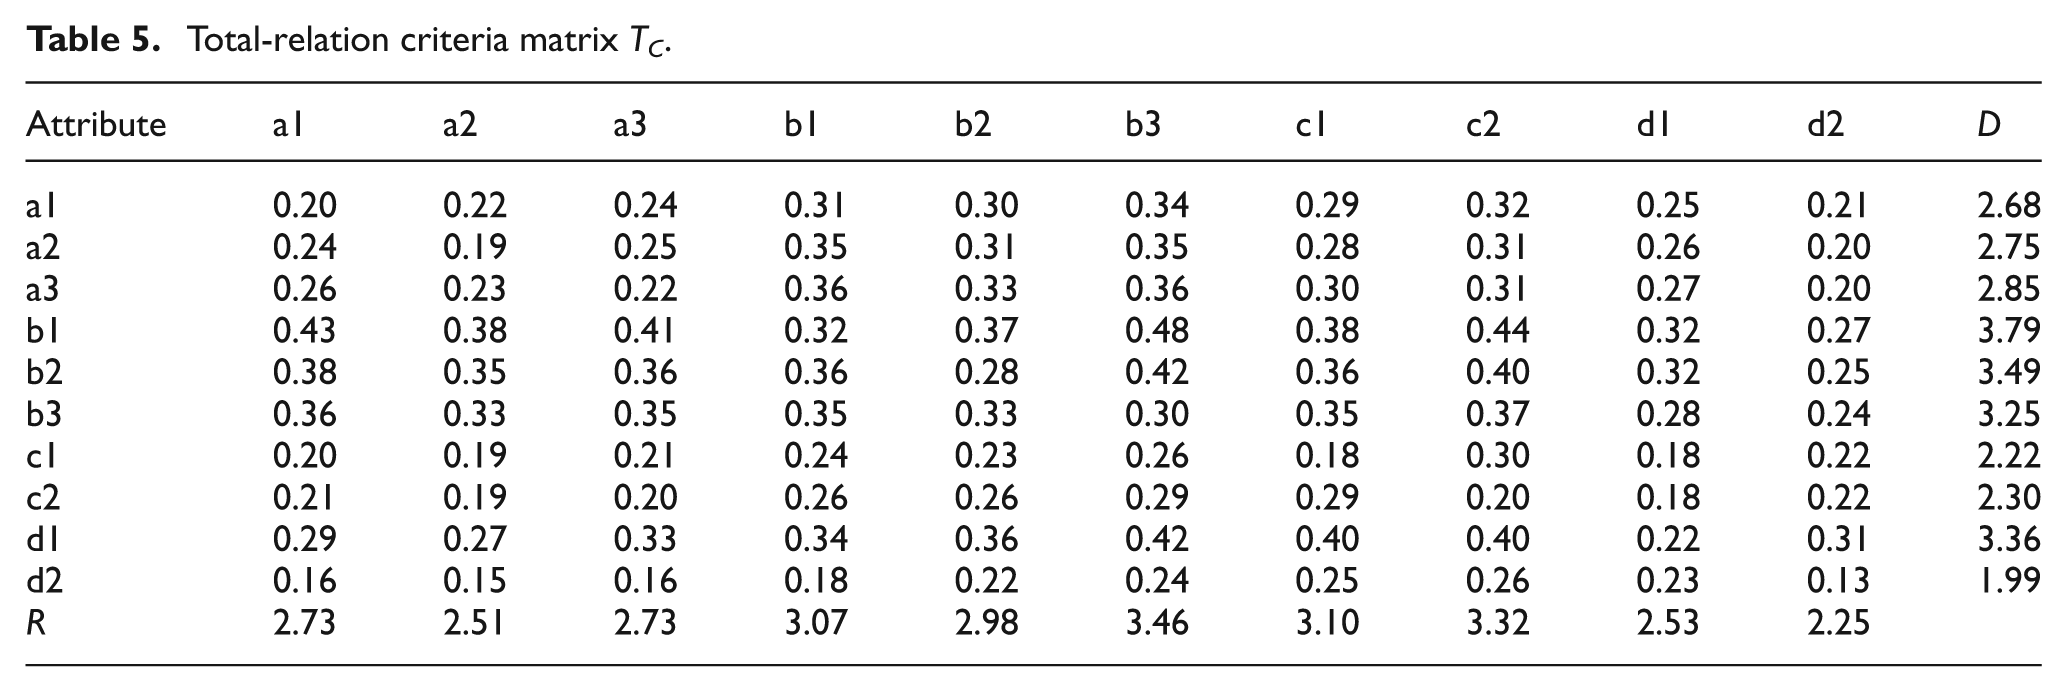
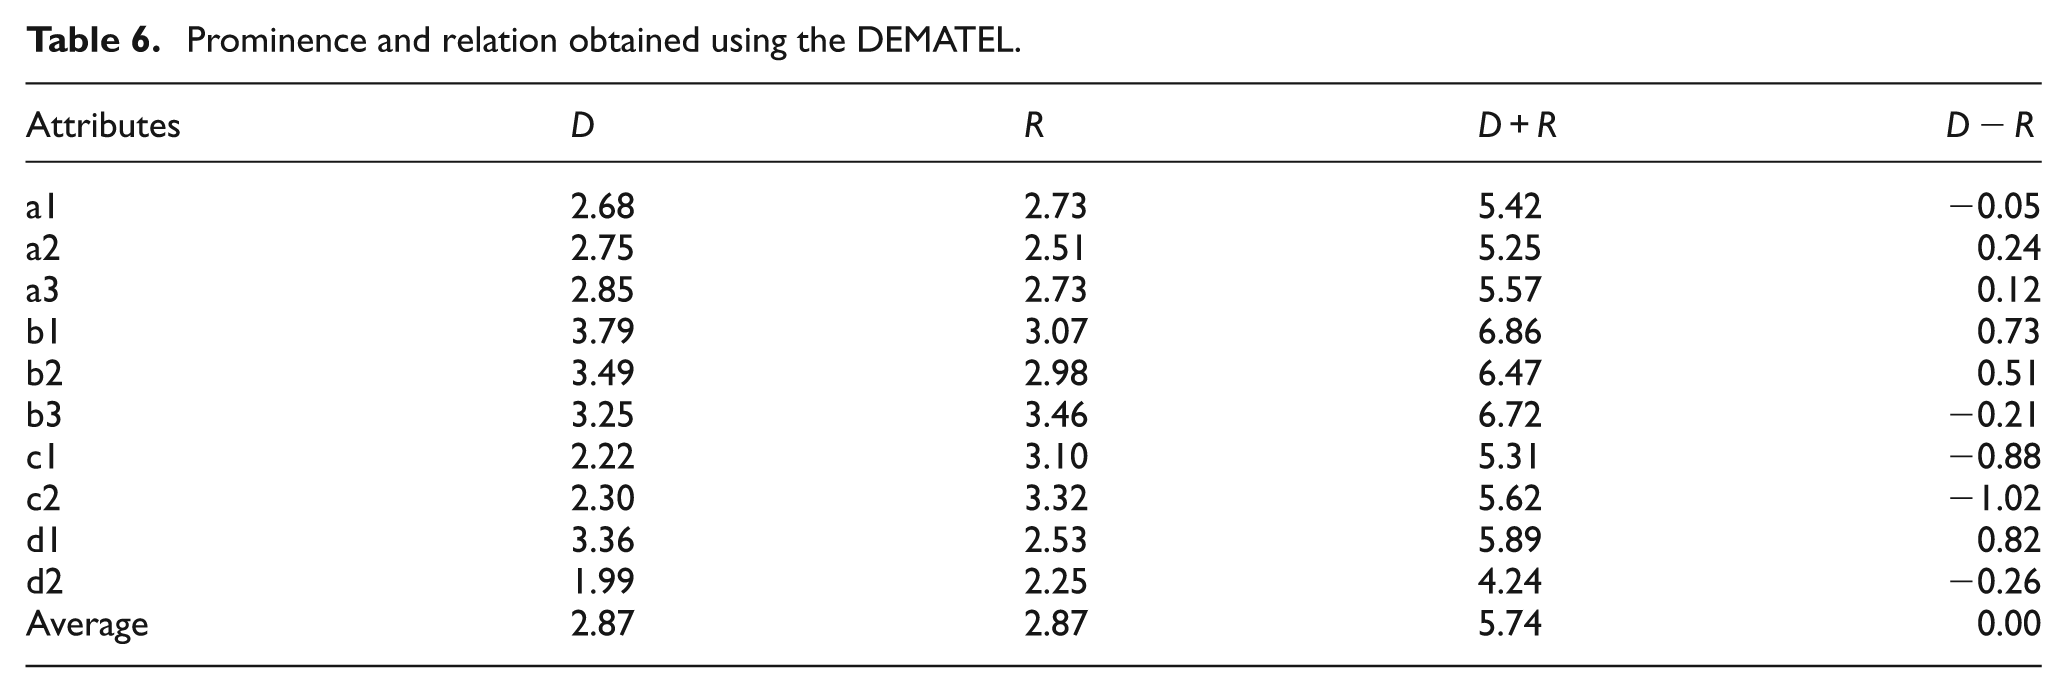
The value of each column (Di) and row (Rj) was calculated using equations (5) and (6), after which the prominence (D + R) and relation (D − R) were obtained. The total influence that the attributes exerted on each other and the influence received from other attributes are summarised in Table 6. In addition, using prominence as the horizontal axis and relation as the vertical axis, the 10 attributes could be plotted accordingly, as shown in Figure 2.
Prominence and relation obtained using the DEMATEL.
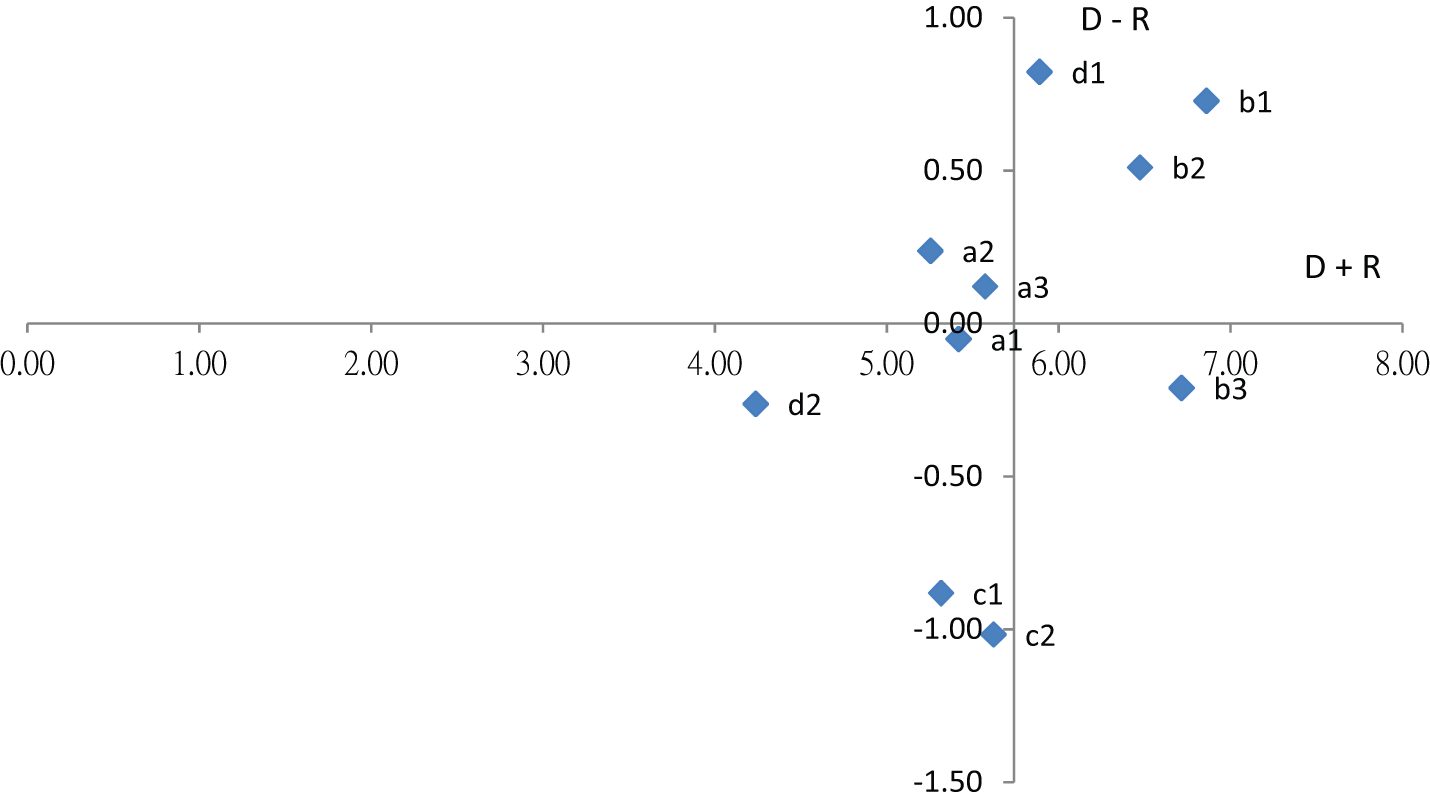
Relations among the 10 attributes.
Using the analysis results obtained from Table 6 and Figure 2, the degree of influence and the causal relationship among the 10 green performance attributes were determined and are described as follows:
High relation, high prominence: effectiveness of the environmental management system (b1), continued compliance with relevant laws (b2), and the volume of products recycled (d1). These three attributes were cause attributes, which are core items that influence other attributes. Thus, they are the crucial driving factors for problem solving.
High relation, low prominence: wastewater discharge (a2) and hazardous waste (a3). These attributes minimally affected few other attributes, indicating that these attributes were relatively independent.
Low relation, high prominence: complete internal management procedures (b3). This attribute was an effect attribute that was influenced by other attributes. Although it required improvement, b3 was an effect attribute that could be improved directly.
Low relation, low prominence: waste gas emission (a1), green sales (c1), green image (c2), and green product packaging (d2). These attributes were subtly influenced by other attributes, meaning that they were relatively independent.
Of the 10 green performance attributes, the effectiveness of the environmental management system (b1), continued compliance with relevant laws (b2), and the volume of products recycled (d1) were located in the high-relation, high-prominence quadrant, indicating that they were the core items capable of influencing the other attributes. By improving the company’s performance with regard to these three attributes, core problems can be resolved. In addition, the performance and competitiveness associated with the other attributes can be enhanced.
Discussion
To improve Company X’s green performance, the nature of the market competition between Company X and its competitors must first be identified; in other words, the attributes that contribute to its competitive advantage, competitive disadvantage, and false advantage must be determined.
The SIPA results indicated that Company X had a competitive advantage based on the attributes of waste gas emission (a1), hazardous waste (a3), the effectiveness of its environmental management system (b1), and continued compliance with relevant laws (b2). These four attributes were Company X’s strengths and should be maintained. Analysing the DEMATEL results revealed that the effectiveness of the environmental management system (b1) and continued compliance with relevant laws (b2) were located in the high-relation, high-prominence quadrant; this suggests that they are the cause attributes that Company X should focus on and continually invest their resources in to sustain these attributes and maintain their lead. This would enable the company to improve its green performance and increase the competitiveness of the other attributes. The attributes of waste gas emission (a1) and hazardous waste (a3) were relatively independent and were unlikely to influence or be influenced by other criteria.
Company X was at a competitive disadvantage based on wastewater discharge (a2) and the volume of products recycled (d1). Therefore, it must gather resources to increase the competitiveness of these two attributes. The DEMATEL results indicated that the volume of products recycled (d1) was located in the high-relation, high-prominence quadrant, signifying that it was a critical cause attribute that influenced the core items of other attributes. This attribute was also the driving factor of problem solving. Therefore, Company X must collect resources to resolve the problem related to this attribute, thereby avoiding the irreversible consequences of being outperformed by its competitors. Wastewater discharge (a2) was located in the high-relation, low-prominence quadrant, signifying that this attribute was an independent attribute that influenced few other attributes to a relatively low degree.
Although Company X exhibited superior performance regarding green sales (c1) and green image (c2) compared with that of its competitors, it was at a false advantage because clients did not value these attributes highly. According to the DEMATEL results, both these attributes were located in the low-relation, low-prominence quadrant, and they exerted only minor influence on few other attributes. No significant improvement in green performance would be observed if Company X invested additional resources in maintaining these two attributes.
The SIPA results indicated that Company X underperformed its competitors regarding green product packaging (d2). However, this was a false alarm because clients considered this attribute insignificant. The DEMATEL results showed that this attribute was located in the low-relation, high-prominence quadrant; therefore, it was an effect attribute that cannot be directly improved.
Both Company X and its competitors excelled in the performance of complete internal management procedures (b3), which was an attribute of high importance that provided the companies with head-to-head competition. Therefore, their performance in this regard should be carefully maintained. The DEMATEL results indicated that this attribute was located in the low-relation, high-prominence quadrant, signifying that the attribute was relatively independent and that no immediate resource investment and improvement were required.
By combining the results obtained using the SIPA-DEMATEL model, competitive strategies for Com-pany X can be proposed. The competition between Company X and its competitors and the competitive strategies for Company X are shown in Table 7.
Green performance competition between Company X and its competitors and the competitive strategies for Company X obtained using the SIPA-DEMATEL model.
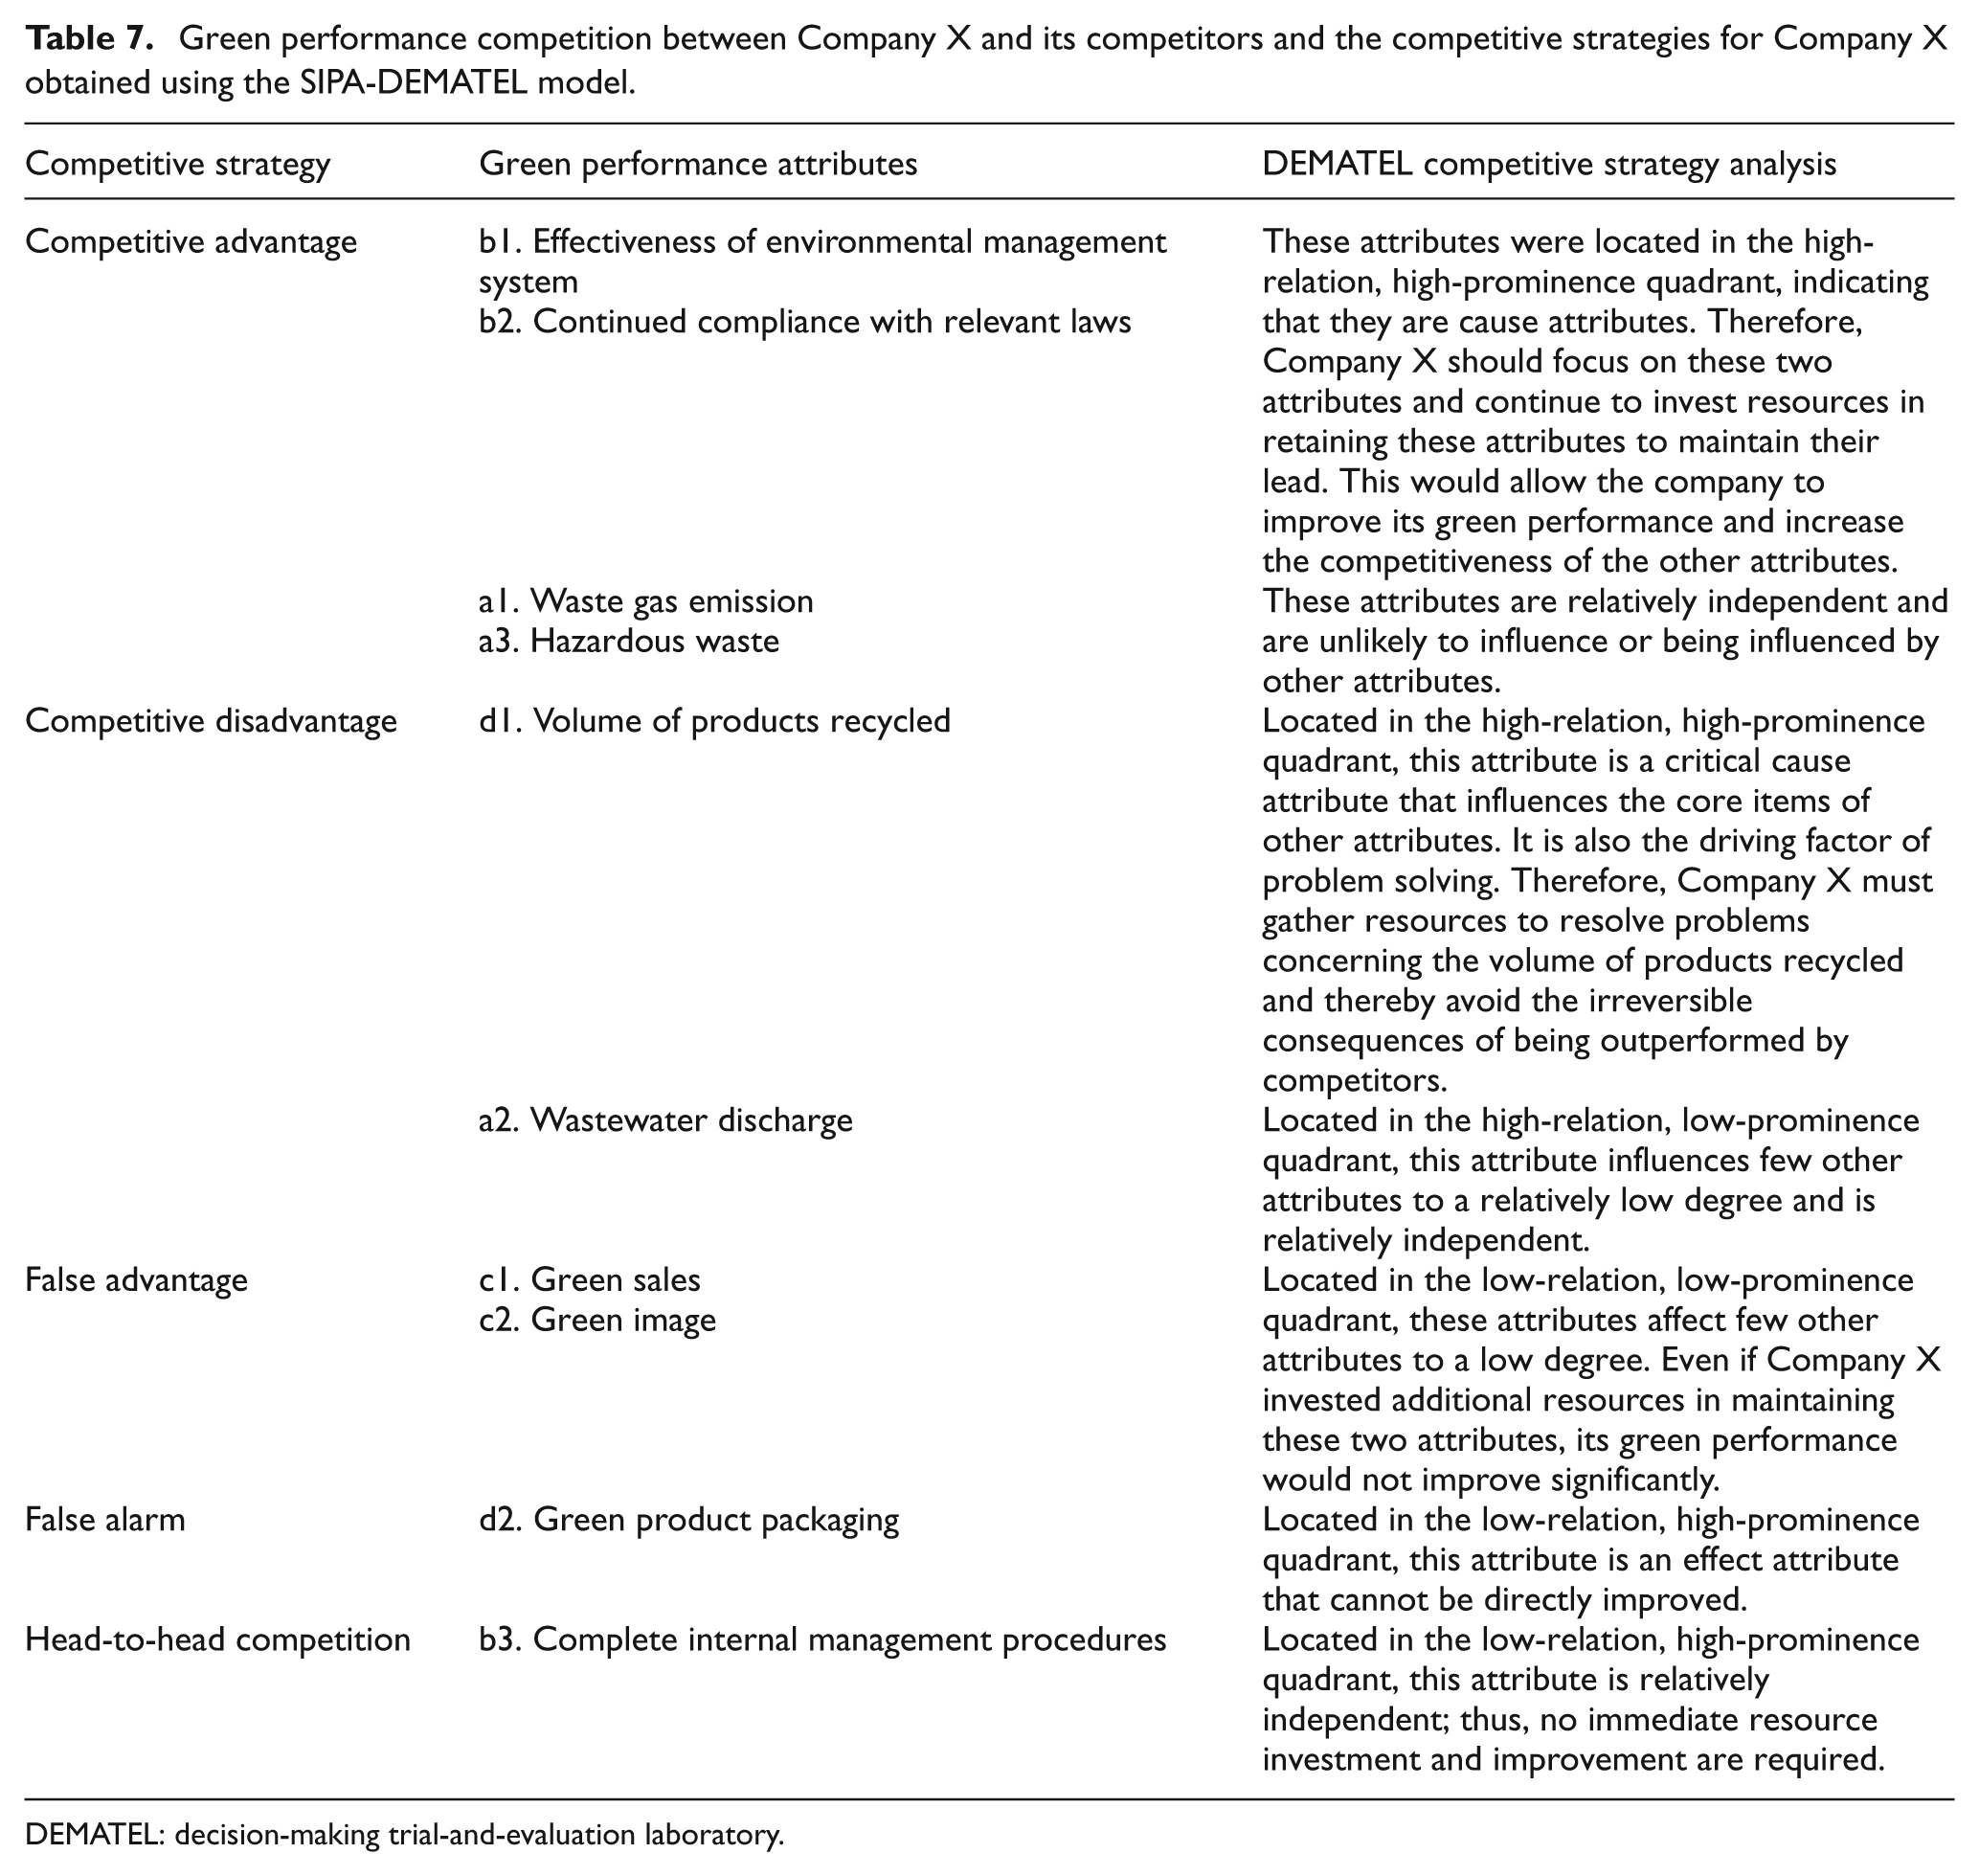
DEMATEL: decision-making trial-and-evaluation laboratory.
Conclusion
GSCs require GSs to apply the concept of environmental protection to products by simultaneously considering product and environmental management and by incorporating environmental protection principles into supplier management mechanisms to enhance market competitiveness.
Previous studies on competitive indices and strategies of GS possess two limitations. First, most studies have assumed that competitive indices are independent of one another and are not causally related. Second, several studies have assumed that the weights of evaluation indices are identical. To overcome these two limitations, this study integrated SIPA and DEMATEL and proposed a SIPA-DEMATEL model. In this study, SIPA was used to explore the green performance and competitive situations of a case company and its competitors. Subsequently, DEMATEL was used to calculate the degrees of influence that the competitive GS indices regarding green performance exhibit on each other and to investigate the causal relationships among competitive indices. Finally, competitive GS strategies for the case company were proposed.
The results indicated that the 10 GS green performance criteria were causally related to one another and mutually influenced one another. In brief, Company X should consider the effectiveness of its environmental management systems (b1) and continuous monitoring and regulatory compliance (b2) as priorities; therefore, it should allocate resources for b1 and b2. By maintaining b1 and b2 attributes, Company X can continue to enhance its green performance and improve its competitiveness regarding the other criteria. In addition, Company X must use its resources to solve product recycling problems (d1) to prevent the green performance of Company X from becoming irreversibly inferior to that of other competitors.
The results demonstrated that the method proposed in this study provides theoretical contributions and can be applied to businesses.
We suggest that future researchers adopt the SIPA-DEMATEL model to examine other situations, industries, and cases to develop another evaluation index system.
Footnotes
Declaration of conflicting interests
The authors declare that there is no conflict of interest.
Funding
This work was supported by the Department of Social Sciences of the Ministry of Education of the People’s Republic of China (No. 11JJD630002 and No. 12CGL033) and the National Natural Science Foundation of China (No. 71372092 and No. 71132001).