
Abstract
This article presents an important investigation of material removal mechanism in grinding utilizing single grit scratch tests. The investigation helps people to understand the abrasive cutting behaviour when the abrasive cutting edge shape alters during single grit grinding. The results provide fundamental knowledge of the grinding material removal process, which helps to improve grinding performance and quality. Cubic boron nitride grits of 40/50 mesh size were used to perform scratch tests on the alloy Inconel 718. The concepts of material pile-up ratio and actual material removal area were introduced to measure the material removal efficiency during grinding. It is found that pile-up ratio decreases and actual material removal area increases when the depth of cut increases, albeit the material removal mechanism is highly dependent on the abrasive grit cutting edge shape. The material removal mechanism along the scratch length shows different behaviours at the entrance and exit sides of the scratching passes. When a grit was moving along its scratch path, it pushed material forward resulting in high material accumulation at the exit side of the scratches. Consequently, cutting is more prominent at the entrance side of the scratch, whereas ploughing or pile-up is extremely high at the exit side of the scratches. The research finding provides crucial information for grinding process optimization.
Introduction
High material removal rate and high surface quality are fundamental requirements of most grinding operations. The material removal ability of abrasive grits is of high interest in order to understand the grinding behaviour and its influence on the ground surface creation, particularly at the micro scale. With the entire grinding wheel–workpiece interaction,1,2 it is difficult to evaluate an individual grit contribution to material removal and difficult to observe the effects of abrasive grit geometrical parameters, such as cutting edge shape, size and depth of cut on the ground surface.
It was postulated that there could exist three stages of material removal in grinding, namely, rubbing, ploughing and cutting, to ultimately remove the material from the workpiece surface in the form of tiny chips. 3 As an abrasive grit slides on the workpiece surface for a small distance at the initial stage, the grit–workpiece interaction does not cause any permanent change on the surface topography, where the interaction only occurs in the elastic range and recovers due to elastic spring back effect after the interaction ends. This stage in the process is called rubbing. The ploughing stage is initiated with increasing penetration of the grit into the workpiece while the abrasive grit travels forward simultaneously. At this stage, the interaction occurs in both the elastic and plastic regions, but no real material removal occurs. When the shearing stresses increase beyond the tearing stresses, the ploughed material in front of the grit is finally removed from the workpiece in the form of chips. This stage is known as cutting. Among these stages, rubbing has negligible contribution to material removal, while ploughing plays a crucial role influencing energy consumption, surface roughness characterization, surface creation and overall efficiency of the grinding process. In order to improve material removal efficiency, effective cutting should be maximized while rubbing and ploughing should be minimized because they consume energy without much contributing to the material removal. 4
To investigate single abrasive grit–workpiece interaction at the micro scale down to the submicron scale as well as the material removal characteristics at that range, single grit scratching tests have been utilized by many researchers.5–11 Albeit there are a substantial amount of tests performed using a shaped abrasive grit or shaped cutting tool (known geometry) such as a diamond indenter or stylus,6,12,13 spherical tool, 14 or negative rake cutter 15 to reduce shape factor influence during material removal, some experimental works also exist with the actual abrasive grits.5,7,8,10,16 Shaped tools are good for experiments because they make easy comparisons with computational models.14,17–22 Besides, the shaped tools make parametric investigation easy to study the effect of speed, depth of cut and hardness of materials on the material removal mechanisms by keeping the tool geometry stable. However, scratches with shaped tools diverge from the reality of actual grinding because the shapes of grit cutting edges continuously alter due to grit wear and fracture occurring during the grinding process. Takenaka 5 performed one of the earliest scratch tests and observed that a chip was produced even at a small depth of cut (lower than 0.5 µm) in the form of torn leaves from the workpiece surface, although the rubbing and ploughing phases are also prominent in that range of depth cuts. Material removal was found mainly by the cutting process when the depth of cut is higher than 1 µm. Komanduri 23 investigated the grinding mechanism using a highly negative rake angled diamond tool and observed chip formation up to a rake angle of −75°. Shaw 24 described the material removal process during single grit–workpiece interaction as an extrusion-like mechanism. Wang et al. 25 performed single grit scratching test with a conical diamond tool on pure titanium to characterize the material removal mechanism. The scratches’ depth of the tests was around 60 µm with a cutting speed of 0.54 m/s. They observed that there exists four zones in the interaction region, namely, a stagnant zone, a lamella zone with shear bands, a hardened sublayer zone and a propagating zone during front ridge development in scratching test. Klecka and Subhash 26 investigated the material removal mechanism and associated damages in single and double scratches on alumina materials with different grain sizes (2, 15 and 25 µm) using a diamond tip dresser as a scratch tool. Experimental result showed that there is a critical separation distance where the maximum material removal occurs for a pair of interacting scratches. Critical scratch separation distance was identified as 90, 125 and 150 µm for the materials with grain sizes of 2, 15 and 25 µm, respectively.
In the literature, the effect of cutting speed was studied mainly using shaped abrasive grits in order to minimize the influence of grit shape alteration during scratching test.11,14,27 The majority of the research shows that lower cutting speed and depth of cut increase the proportion of ploughing and make cutting less efficient.16,27,28 The influence of cutting speed may not be captured appropriately when the grit feature changes significantly due to grit wear and fracture on the cutting edges. Thus, in this research, the effect of cutting speed was not discussed due to significant alteration in the grit profile during scratching. Rather, this article is mainly focused on morphological alteration in aspects of ploughing and cutting during scratching.
In this article, the interaction between single abrasive grit and workpiece is studied in order to provide broader insight into the grinding mechanism. Although the influence of abrasive grit operating condition and the grit–workpiece interaction are the main issues to be investigated in this article, the grit wear phenomenon, attritious wears and fracture wear also exist on the cutting edges of the grit. Various wear phenomena on the grit can be observed by the variation in grit profiles in the scratch tests. For instance, the transformation of scratches from the single edge scratch to the multiple edge scratch can be considered as the result of the fracture of the grit during scratching test. Previous researchers 29 illustrated that attritious wear accounts for the wear flats on the grit cutting edges and causes a reduction in cutting ability of the abrasive grits, while fracture wear is part of abrasive grit loss due to grit breakage or entire abrasive grit dropping from the abrasive wheel due to bond fracture.
Experimental procedure
Scratching test set-up
Single grit scratching tests were conducted on a Nanoform 250 UltraGrind machine centre. The machine centre is able to perform precision grinding and diamond turning with three-dimensional (3D) complex surface forms and is capable of generating surfaces having an average surface roughness Ra better than 1 nm. In order to accommodate a single grit scratching test, a test set-up was designed and manufactured, as shown in Figure 1. The workpiece was mounted on a Kistler three-axis piezoelectric force sensor. In addition, an acoustic emission (AE) sensor was mounted near the workpiece to detect the contact between the grit and the workpiece.
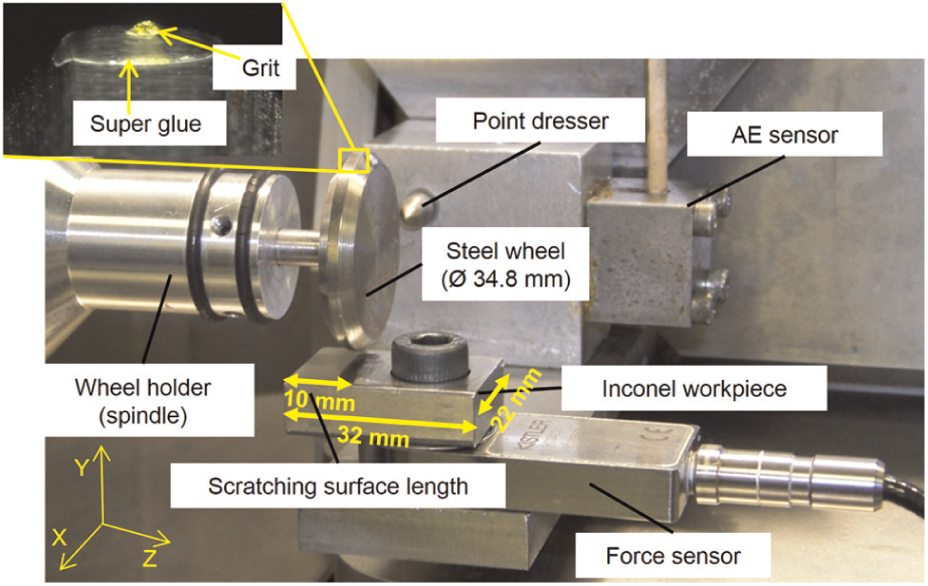
Single grit scratch test set-up.
A cubic boron nitride (CBN) grit of 40/50 mesh size was used for the scratching tests. Inconel 718 with a hardness of 355 HV at a 1 kg load was used as a workpiece. The workpiece surface was ground and polished prior to the scratching tests. The polished average surface roughness Ra was around 0.04 µm throughout the scratching surface. The diameter of the steel wheel was measured as 34.8 mm after grinding the circumferential surface of the steel wheel using a high-speed spindle (rotational speed N = 20,000 r/min or peripheral speed Vc = 8.37 m/s). The steel wheel provided a run-out error less than 1 µm. A CBN grit was glued onto the circumferential surface of the steel wheel using Loctite Super Glue, as shown in Figure 1. The same grit was used during the experiment as long as the grit stayed on the wheel surface. In case of the grit dropped off from the steel wheel, a new grit would be reinstalled to continue the experiment. Throughout this investigation, the same grit was used without experiencing the grit dropping off the steel wheel. A traverse scratching method was used to generate scratches at different depths of cut. Figure 2 shows the schematic representation of this traverse scratching method. The workpiece surface was tilted slightly to generate scratches leading to different depths of cuts; the height difference between the two ends of the scratching surface was less than 13 µm. More detailed description of the scratching process and the traverse scratching method were given in previous publication. 7
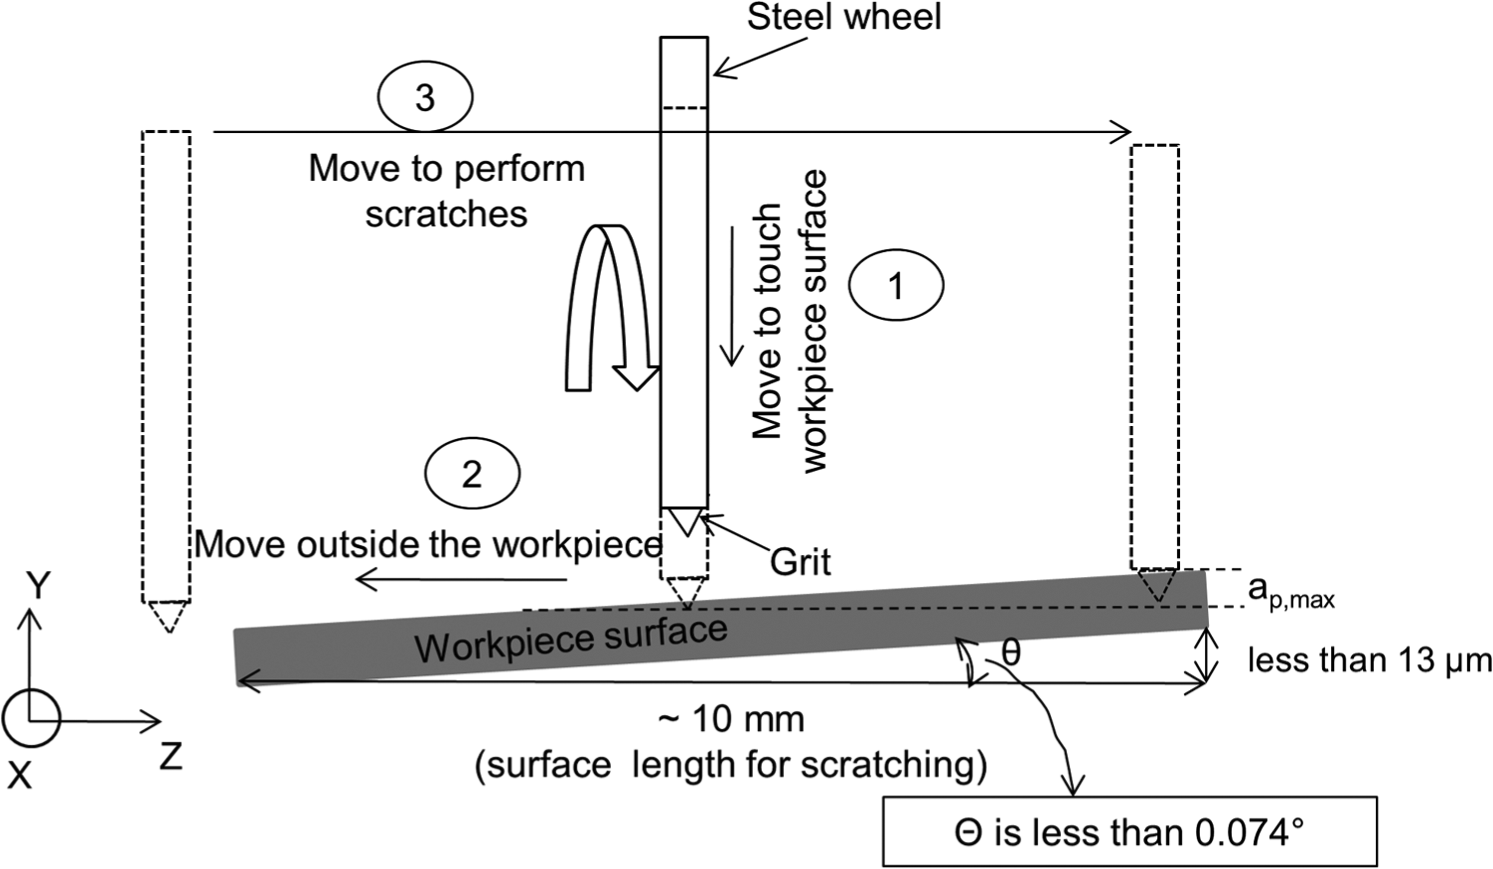
Scratching test methodology on a tilted surface (ap,max: maximum depth of cut).
Scratch profile measurement
A microscopic view of some single grit scratches on an Inconel workpiece with increasing depth of cut is shown in Figure 3. It can be seen that some scratches are less than 100 µm in length and less than 1 µm in grove depth. The scratch profiles of the samples were measured using a Talysurf CCI 3000 white light interferometer. A sample of the resulting 3D profile measurement is shown in Figure 4, where the gouging features can be clearly seen. After 3D profiles of the scratches were obtained, two-dimensional (2D) profile sections were extracted from the deepest point of the scratches to measure the groove depth, groove area and pile-up area. Figure 5 shows the 2D profile of the scratches at the deepest point, from which the total pile-up and groove area sections will be used for analyses.
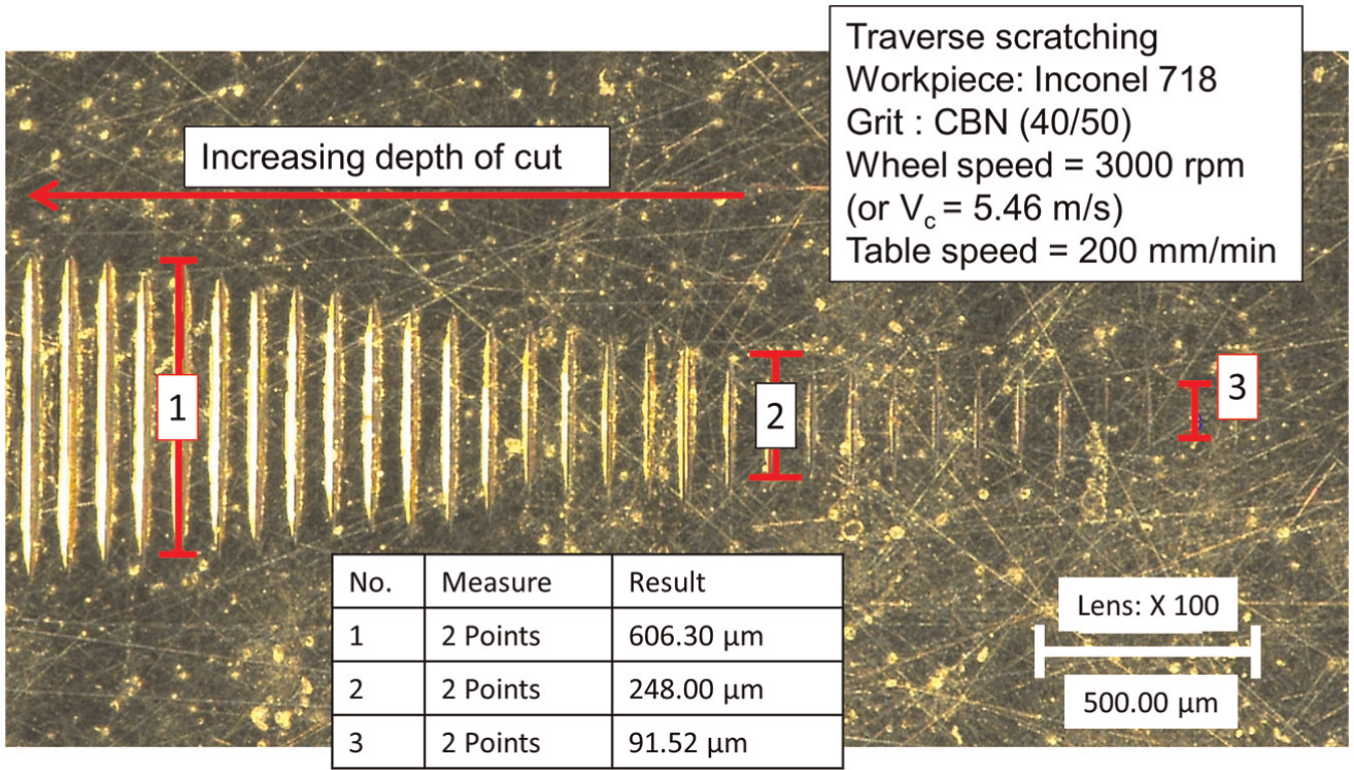
A view of scratches with increasing depths of cut.
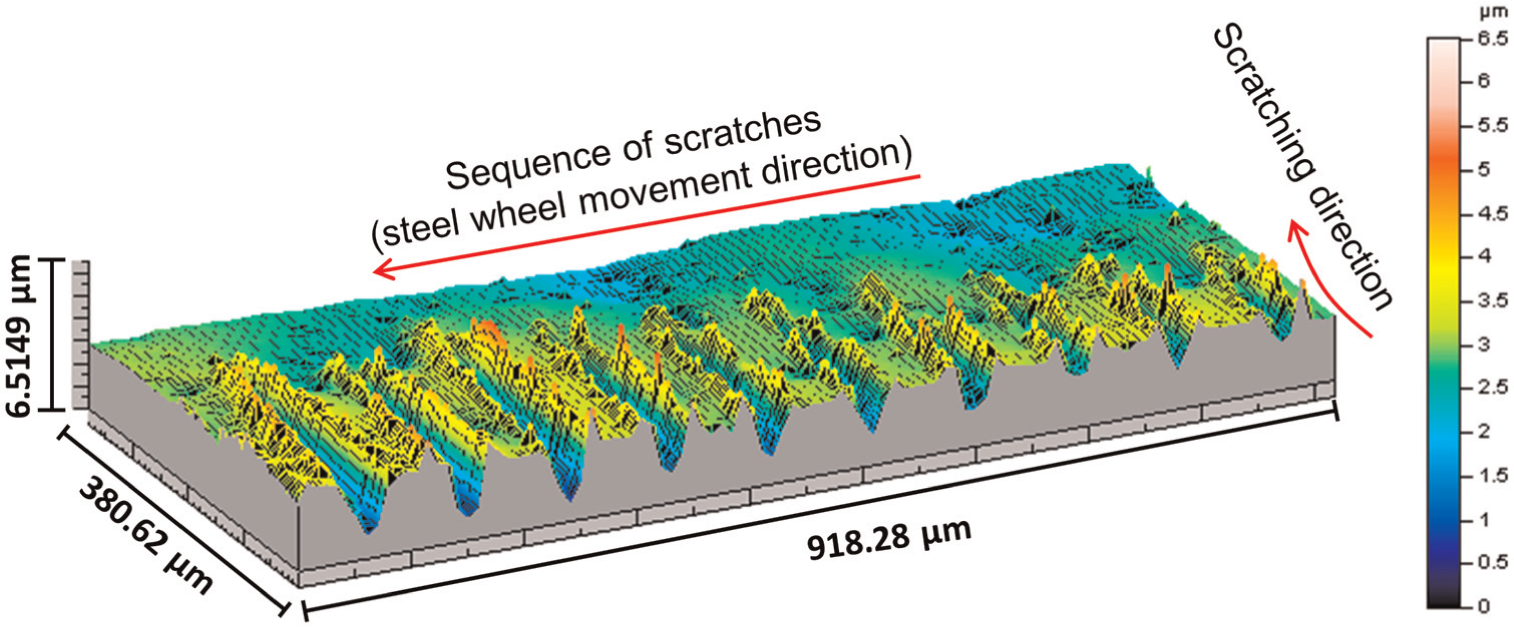
Example of 3D profile of scratches on the Inconel 718 workpiece (obtained from Figure 3).
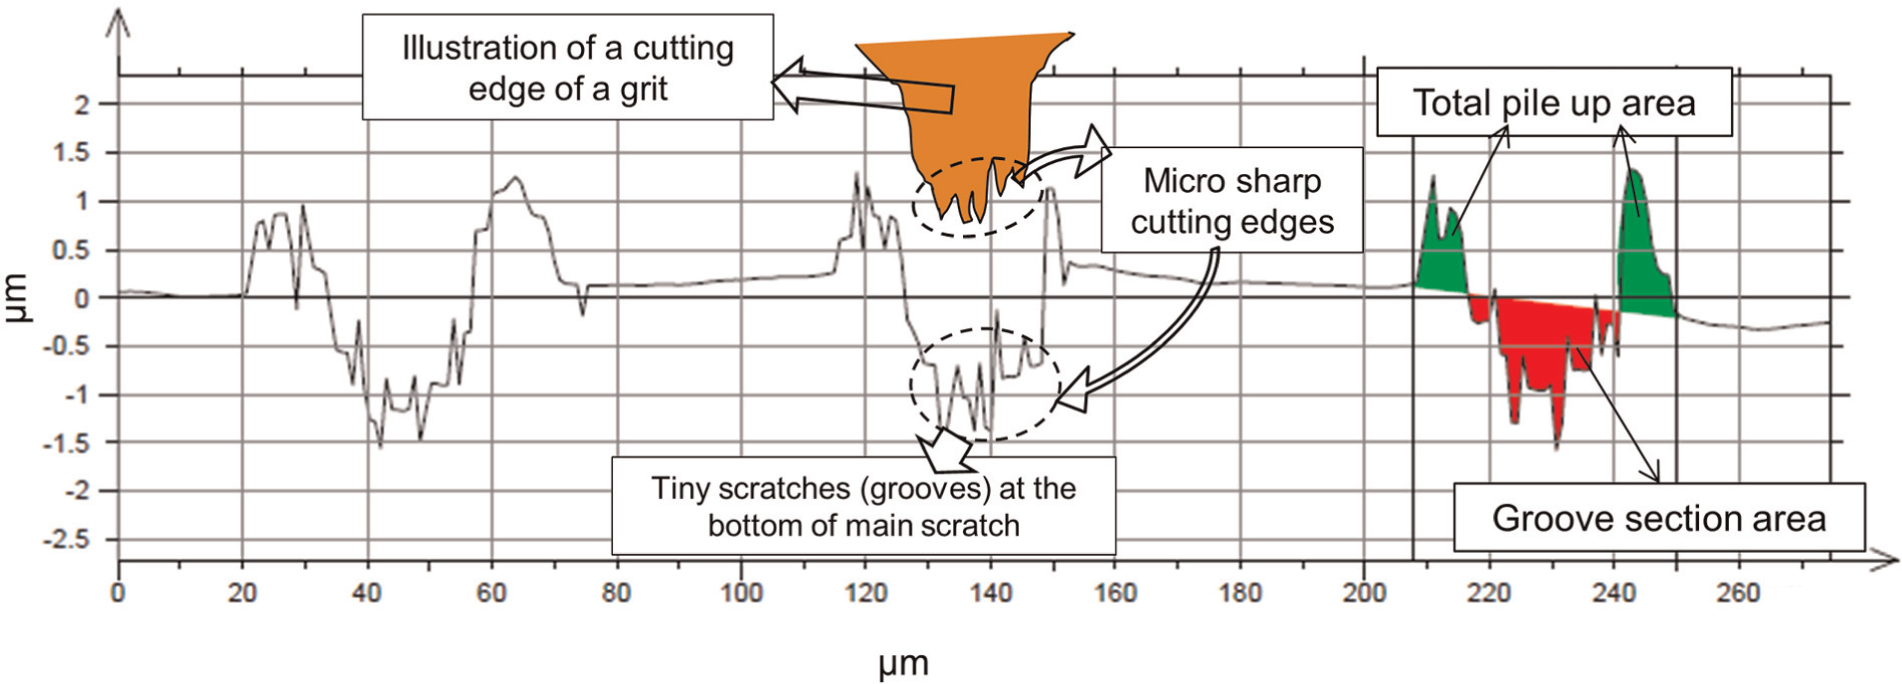
Scratch cross-sectional profile, pile-up area and groove section area demonstration.
The profile of the scratches shows that the shape of the scratched grooves is altering at every consecutive scratch generation due to alteration of the cutting edge shape of the grit. With increasing numbers of scratch generation, the grit wear will present itself in the profile of the scratches. The alteration of the grit cutting edge occurs mainly due to wear flat generation and fracture of the grit. Ultimately, grit fracture leads to new cutting edges, which will maintain sharp cutting edges throughout the scratching. This phenomenon is also known as a self-sharpening during the grinding process. 29 Because it is impossible to measure the grit profile after each consecutive scratching pass under current test set-up, the profile of the scratched grooves on the workpiece can be reasonably considered as the out-most profile of the grit, albeit errors may exist due to elastic deformation, which is insignificant.30,31 As shown in Figure 5, scratched grooves also included some tiny scratches (spikes) inside the main scratches. These tiny scratches could attribute to the existence of sharp cutting edges on the grit edge, which engaged with the workpiece. Although these tiny scratches could also be generated due to brittle fracture of the workpiece material, repeated patterns of the cross-sectional profiles observed in the consecutive scratches (Figure 5), however, suggest that the tiny scratches were generated mainly by micro sharp cutting edges existing on the grit surface. In some circumstances, the grit fracture could be very influential in creating multiple cutting edges, which would, therefore, generate multiple edge scratches. Figure 6 shows the point where the multiple edge scratches appeared on the Inconel 718 workpiece after production of several single cutting edge scratches. Similar phenomenon was also observed during the scratch tests on an EN24T steel where the adjacent multiple scratches developed after some single edge scratches’ formation, as shown in Figure 7. 32 In the case of multiple cutting edges with different cutting edge heights, increasing the depth of cut could facilitate the generation of multiple edge scratches. It was observed that the single grit cutting edge can be altered into three different shapes, as shown in Figure 8, depending on the wear mechanism on the grit surface: (1) a single cutting edge, which generates a single scratch (Figure 8(a), (2) adjacent multiple cutting edges, which act as a single cutting edge and create a single scratch (Figure 8(b)) and (3) multiple distinct cutting edges, which act as separate cutting edges and generate separate scratches (Figure 8(c)). It is noted that the cutting edges profiles, illustrated in Figure 8, were not measured profiles; they were hypothesized from the resultant scratches’ cross-sectional profiles. During the adjacent multiple cutting edges’ engagement with the workpiece, the ploughed material at the adjacent side edge was squeezed together, which reinforced the ploughing function and led to less actual material removal (i.e. less efficient in terms of cutting) during scratching. On the other hand, during the multiple distinct cutting edges’ engagement, the separate scratches due to the separate cutting edges on the grit do not contribute to each other’s material removal, thus dissimilar to the former one (Figure 8(b)). The material removal is strongly dependent on the grit cutting edge shape and other factors (such as grit cutting edge sharpness, bluntness and depth of cut). The efficiency of the material removal in terms of cutting and ploughing processes will be analysed through the article by introducing a concept of pile-up ratio and actual material removal area in later section. Figure 9(a) shows an interferometry measurement of distinct scratches generated by different cutting edges on the same grit and Figure 9(b) shows 2D profiles of the scratches extracted from Figure 9(a). The grit fracture wear is considered as the main responsible mechanism that changed the single edge scratches into multiple edge scratches.
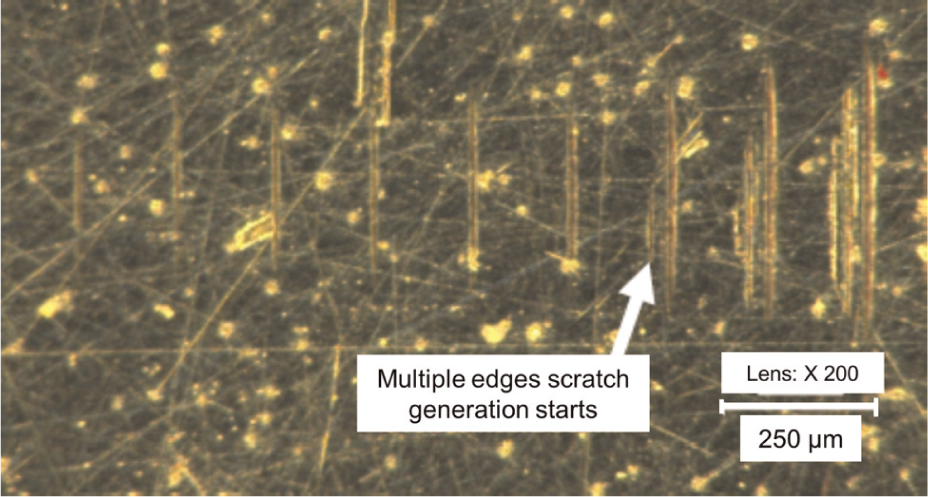
Microscopic picture shows where the grit started to generate multiple edge scratches on the Inconel 718 workpiece.
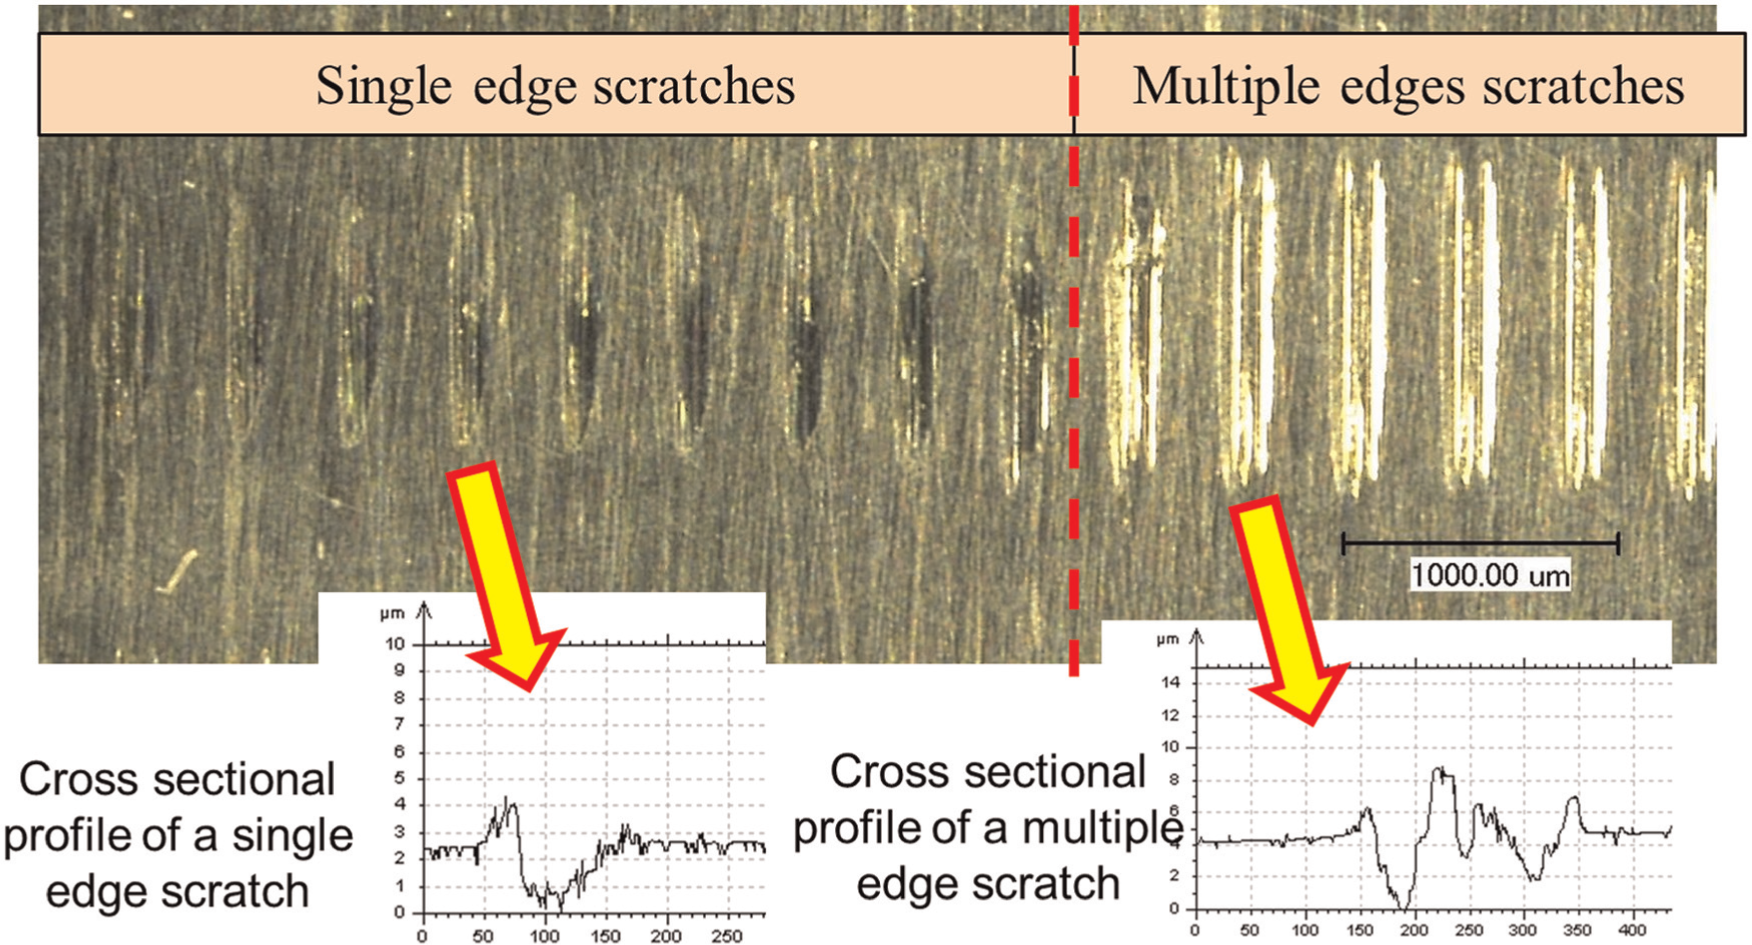
Transition from single edge scratches to multiple edge scratches on an EN24T steel workpiece. 32
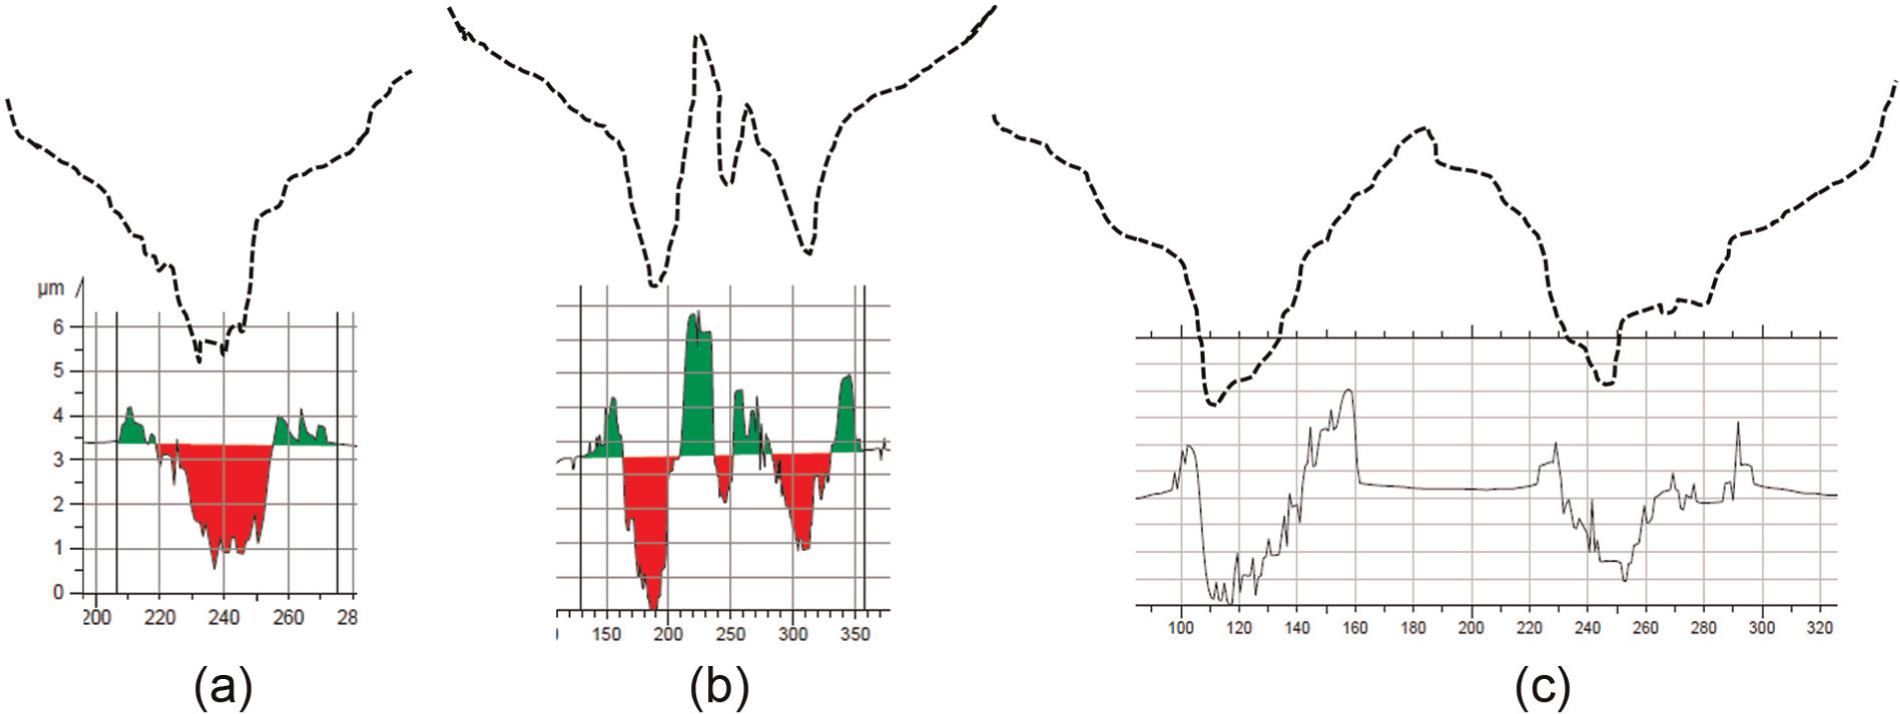
Possible grit cutting edge profiles (not measured profile, it is a hypothesized profile from the cross-sectional profile of the scratch) and alterations during single grit scratching: (a) single cutting edge creates a single edge scratch, (b) adjacent multiple cutting edges act as a single cutting edge and create a single scratch with adjacent multiple grooves and (c) multiple distinct cutting edges act as a separate cutting edge and create separate scratches.
CCI interferometer measurement for two separate scratches at every pass of grit. (a) 3D measurement by Taylor Hobson CCI interferometer for two separates scratches at every pass of grit and (b) 2D cross-sectional profiles of the scratches extracted from the deepest position.
In the scope of this work, the investigation of material removal mechanism during single grit scratching on the Inconel workpiece takes account of the grit cutting edge shape alteration in the ploughing and cutting mechanism analysis. Prominent material removal mechanism is decided using a measure of pile-up ratio, which is defined as the ratio of total pile-up area to total groove section area in the cross section under the consideration (Figure 10). The pile-up areas and groove section areas were calculated at the deepest point of scratches using Mountains software (TalyMap Universal version 3.1.9), which is a software built for the surface measurement on Talysurf CCI 3000 interferometer. Accordingly, the actual material removal area is defined as a new measure to quantify material removal efficiency along the scratch profile, and it is determined by subtracting total pile-up area from the groove cross-sectional area, as shown in Figure 10. According to the concept of pile-up ratio and actual material removal area, the higher the pile-up ratio and actual material removal area, the less the actual material removal, hence the lower cutting efficiency. It is a simplified approach that does not take into account material flow (material accumulation) along scratching direction. Nevertheless, it is a good measure to demonstrate the influence of material removal across the cross-sectional area of the scratch.
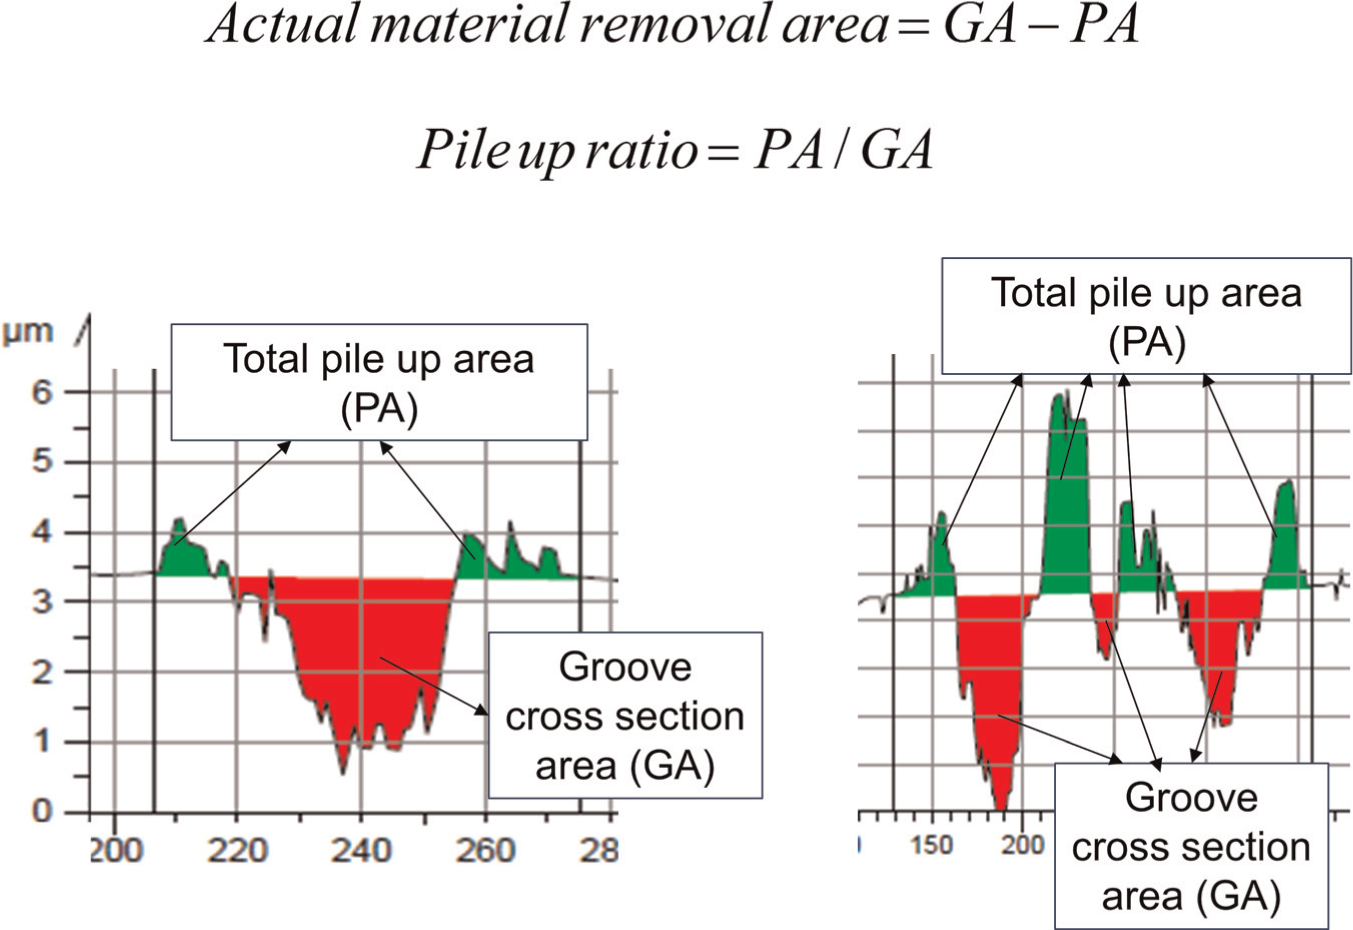
Actual material removal area and pile-up ratio with corresponding section profiles.
Single grit grinding results and analyses
Material removal at the middle of scratching paths
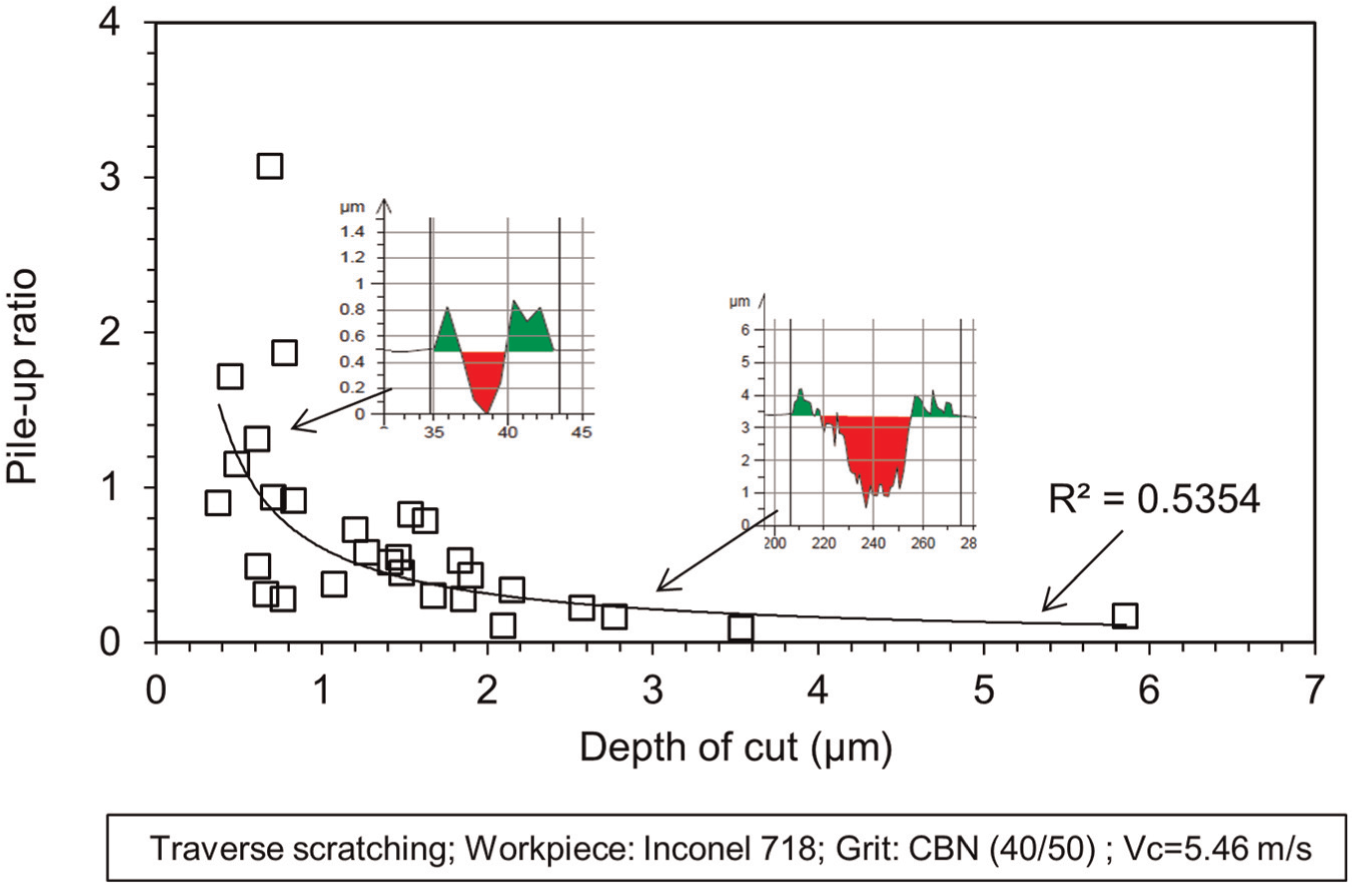
The relations between the pile-up ratio and the depth of cut or the groove cross-sectional area at the middle of scratch paths were investigated by applying multiple scratches on Inconel 718 workpiece with various depths of cut ranged from around 0.5 to 6 µm. Figure 11 shows the pile-up ratio against the depth of cut, where a steep decreasing trend of the pile-up ratio with the increase in depth of cut presents when the depth of cut is less than 1.5 µm. When the depth of cut is greater than about 1.5 µm, the decrease in the pile-up ratio becomes less significant. The trend for the pile-up ratio versus the groove cross-sectional area shown in Figure 12 has similar features as that with the depth of cut.
Pile-up ratio variation with depth of cut (obtained from Figure 4).
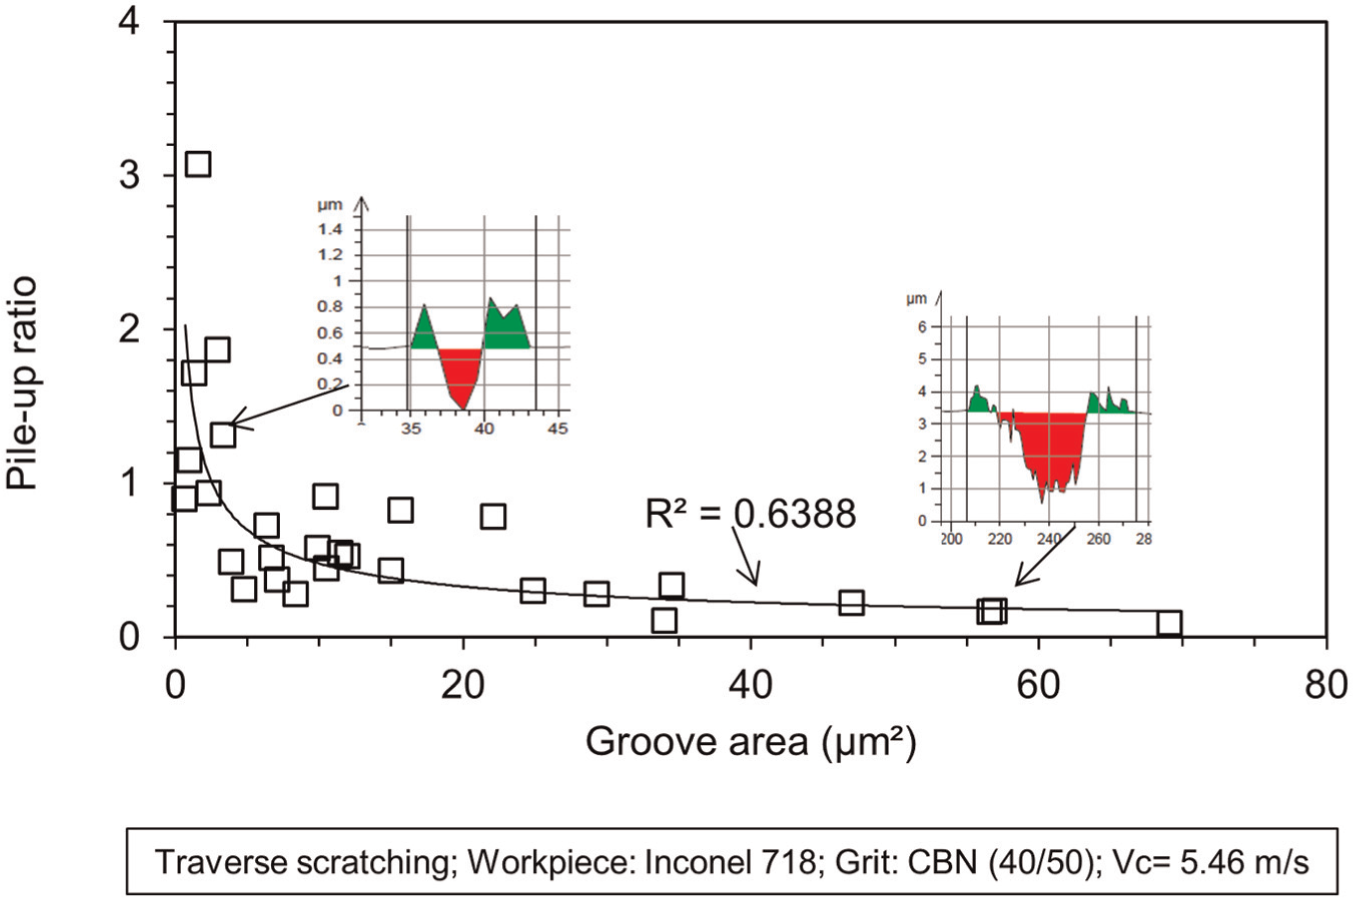
Pile-up ratio variation with groove area (obtained from Figure 4).
It should be pointed out that the pile-up ratio can have a value larger than unity when the depth of cut is very small (e.g. <1 µm), as shown in Figure 11; this can be attributed to ploughing action. It shows that less efficient cutting actions occur at small depth of cut, where material ploughing is more prominent. At small depths of cut, materials were deformed plastically and pushed forward creating ridges in both sides of the groove. Cutting might exist with a very small proportion compared to that exists at a higher depth of cut. When cutting action is not significant at small depths of cut, the pile-up ratio becomes larger than unity. Hence, the larger pile-up ratio can be attributed to not only the smaller depth of cut making the cutting inefficient but also the grit pushes materials forward leading to residual material accumulation at different positions along the scratch path.
As the definition of actual material removal area was given in the previous section, the actual material removal area could demonstrate the efficiency of material removal in relation to the cutting depth and the longitudinal position of a scratch. With the aid of actual material removal area graph, a possible transitional point between material removal stages (ploughing and cutting) and their effects on contribution to the actual material removal can be identified. Figure 13 shows the variation in actual material removal area with the depth of cut using the same data set, as shown in Figure 11. According to Figure 13, a transition point is obtained at around 1.5 µm depth of cut. The trend line of the actual material removal area against the depth of cut has a lower gradient than when the depth of cut is less than 1.5 µm. Up to the transition point, the increase in the actual material removal area could be attributed to the ploughing actions, but when the depth of cut is greater than 1.5 µm, the cutting actions become more prominent. Within the investigation range, the 1.5 µm depth of cut is a critical value to distinguish transition from the prominent ploughing mechanism to the prominent cutting mechanism. The negative values in Figure 13 represent the scratch section where the pile-up ratio is higher than 1 due to the material accumulation by ploughing actions as the grit advances. From the investigation, it was found that the identification of the transition point could be easier using the actual material removal area than using the pile-up ratio because the pile-up ratio data were more scattered. However, it is not easy to obtain the transition point for every set of measurements; the measured data set must include as wide a range of depths of cut as possible.
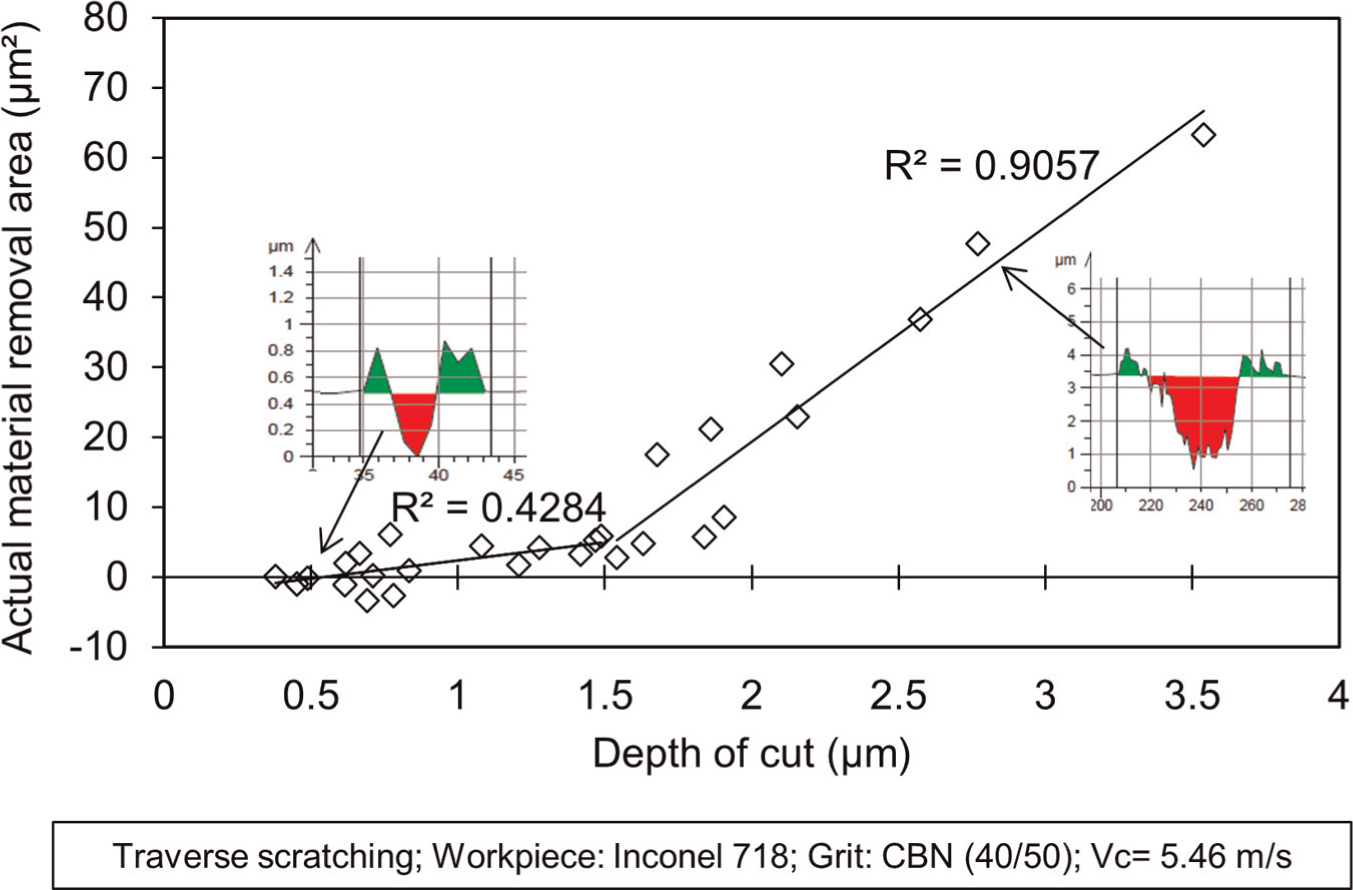
Actual material removal area versus depth of cut (obtained from Figure 4).
Figures 14 and 15 show the variation in the pile-up ratio with the depth of cut and groove area in a test when the grit has two distinct cutting edges interacting with the work sample at each pass of the grit and generates two distinct scratches with different profiles. The trend line looks generally similar to previous graphs for the single cutting edge grit, but the pile-up ratio looks to be highly scattered (lower coefficient of determination R2). Large variation in this test is due to the generation of two different scratches by two different cutting edges. The cross-sectional profiles of different scratches given in Figure 14 can be considered as the reflection of the two different cutting edges’ profiles. In Figure 14, at a depth of cut of about 1.5 µm, it can be seen that the scratch profile above the trend line is sharper than the one below the trend line. The sharpness of the grit cutting edge was determined by examining the scratch cross-sectional profile. Basically, scratch width-to-depth ratio and level of steepness of the cross-sectional profile are the criteria for deciding whether a grit cutting edge is either sharp or less sharp. Thus, scratches are clustered into two groups according to their cross-sectional profiles: scratches with sharp cutting edges and scratches with less sharp cutting edges. The former ones have higher pile-up ratio, which are mainly placed above the trend line, compared to the later ones, which are placed below the trend line. However, some scratches generated with less sharp cutting edge are also placed above the trend line and result in high pile-up ratio (e.g. with pile-up ratio of 1.5 at 1.05 µm depth, as shown in Figure 14). That means pile-up ratio variation with the depth of cut represents highly scattered distribution when two different scratch profiles are created due to multiple cutting edges on the grit. In that case, pile-up ratio versus groove section area shows better correlation, and also coefficient of determination R2 value (0.4644) shows slightly better fit, as shown in Figure 15. Majority of scratches with less sharp cutting edge have less pile-up ratio placed below the scratches with sharp cutting edge having higher pile-up ratio. However, when the groove area is very small (e.g. <5 µm2), pile-up ratio could be very high for both less sharp and sharp cutting edges, as shown in Figure 15. This suggests that cutting edges (sharp or less sharp) act similarly when creating very small scratches. Therefore, these different behaviours of cutting edges indicate that the sharp cutting edge could give higher pile-up ratio so the cutting efficiency could be lower when creating larger scratches with higher depth of cut.
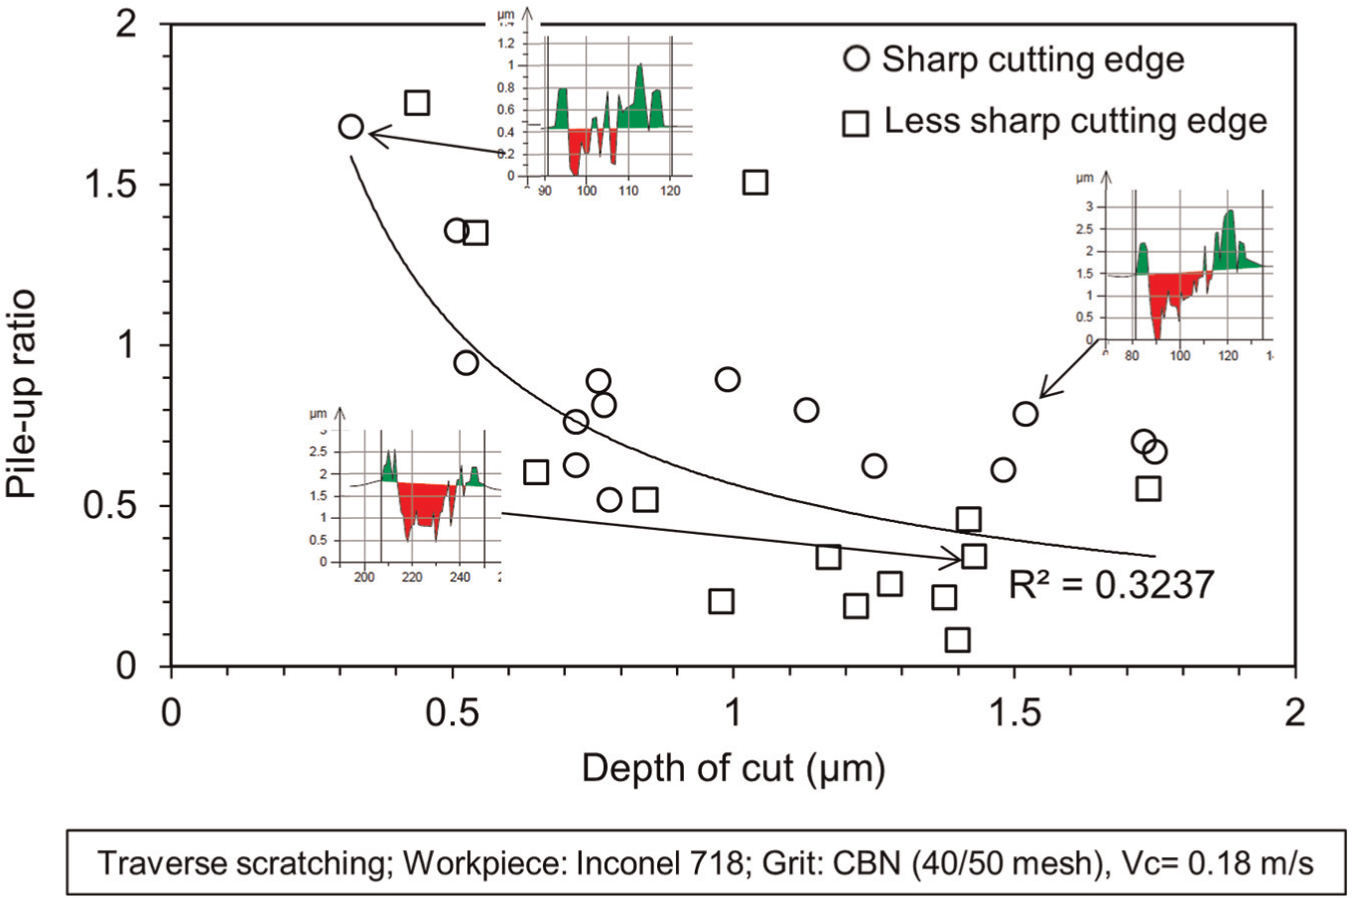
Pile-up ratio versus depth of cut (two separate scratches produced as a result of multiple distinct cutting edges on the grit).
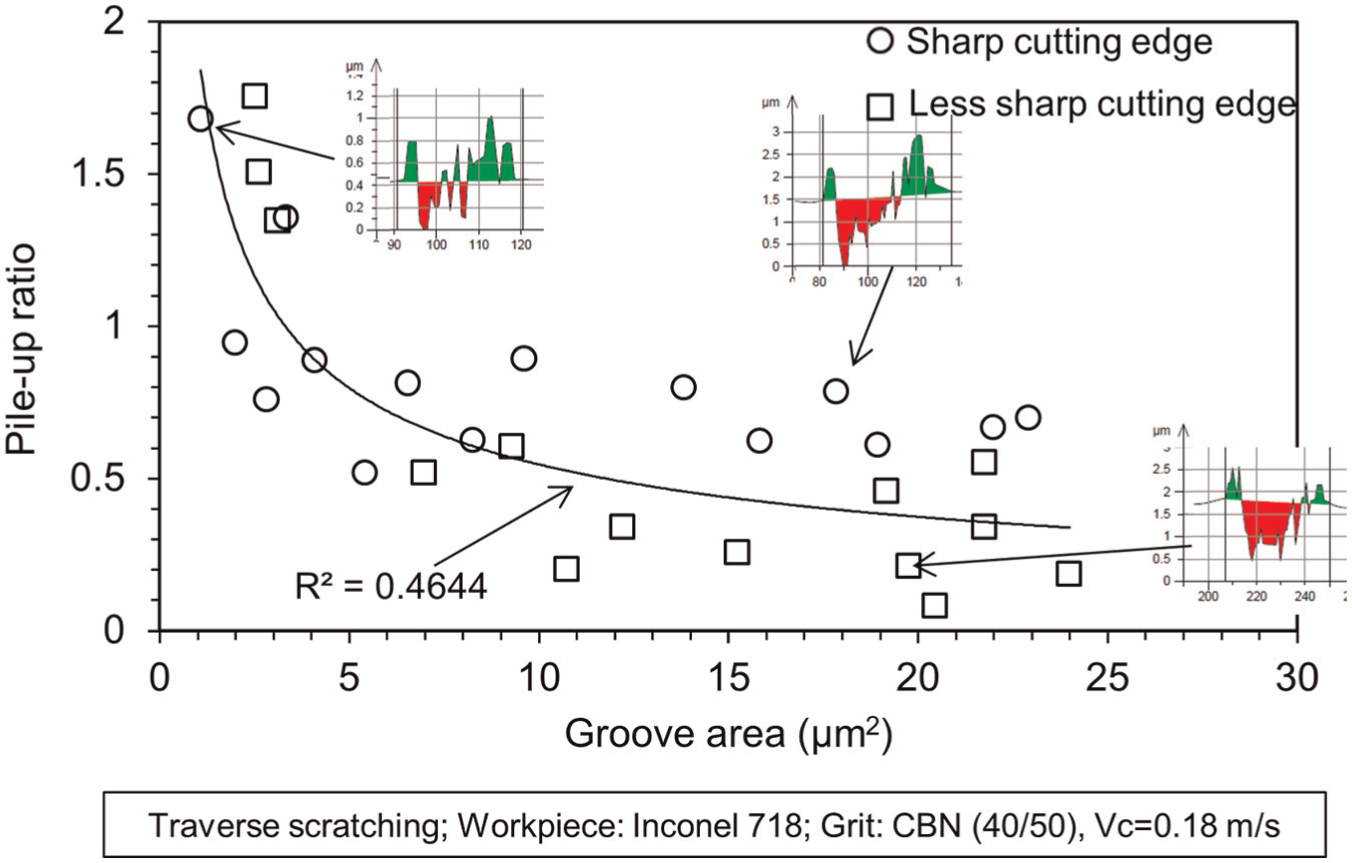
Pile-up ratio versus groove area (two separate scratches produced as a result of multiple distinct cutting edges on the grit).
Similarly, Figures 16 and 17 show the variation in pile-up ratio with the depth of cut and groove area, respectively, for a different test. The scratches in this test also present two different scratch profiles created by two different cutting edges. Two cutting edges interact with the workpiece at each pass of the grit. One of the cutting edges was sharper while the other was less sharp. As shown in the right side of Figures 16 and 17, the sharper cutting edge has a narrower width compared to the less sharp one. Thus, the sharper the grit cutting edge (narrower the width), the higher the pile-up ratio, while wider the cutting edges (less sharp) results in a lower pile-up ratio. This result is also consistent with previous graphs in Figures 14 and 15.
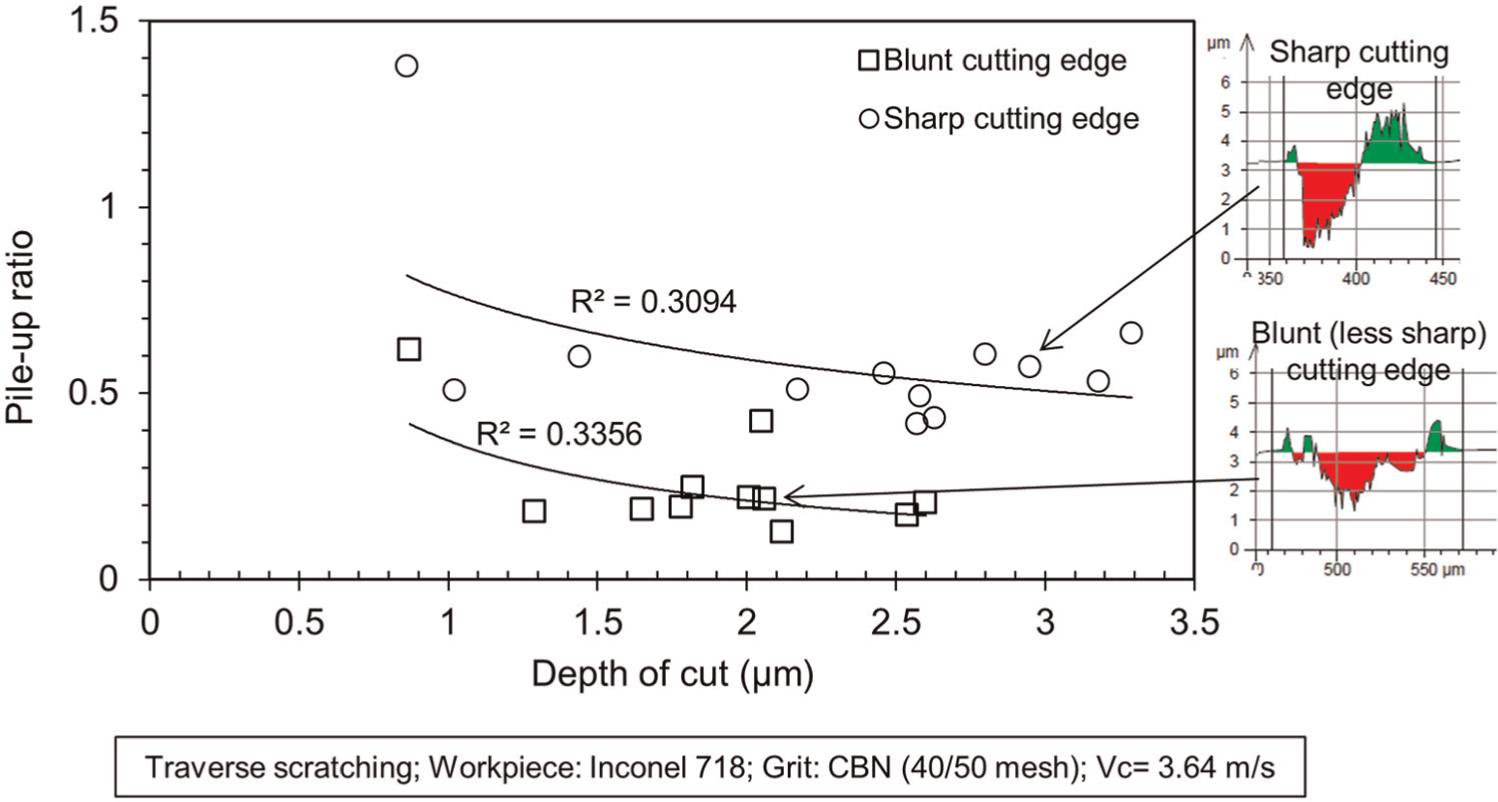
Pile-up ratio versus depth of cut (two separate scratches produced as a result of multiple distinct cutting edges on the grit, see Figure 9).
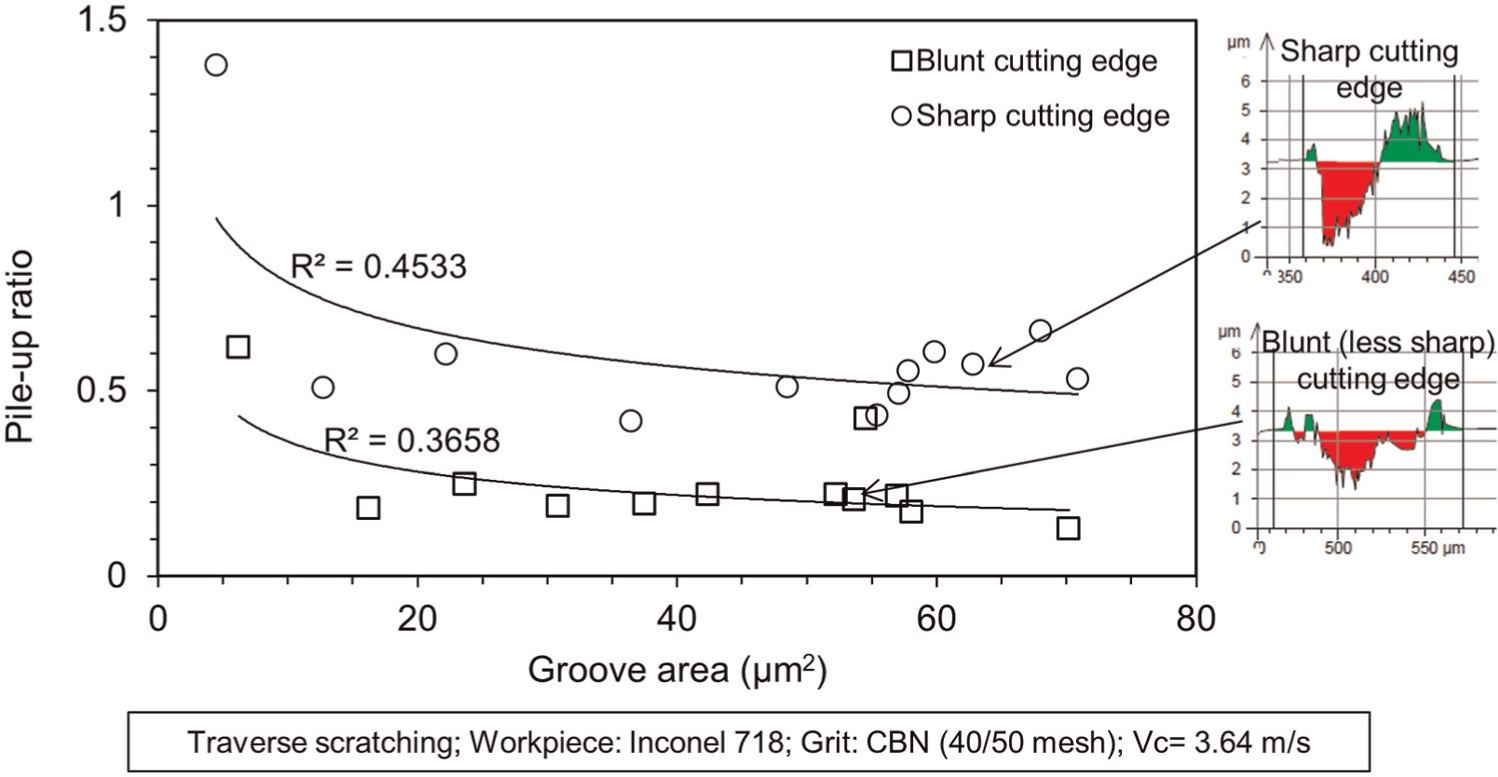
Pile-up ratio versus groove area (two separate scratches produced as a result of multiple distinct cutting edges on the grit, see Figure 9).
Material removal mechanism along scratch path
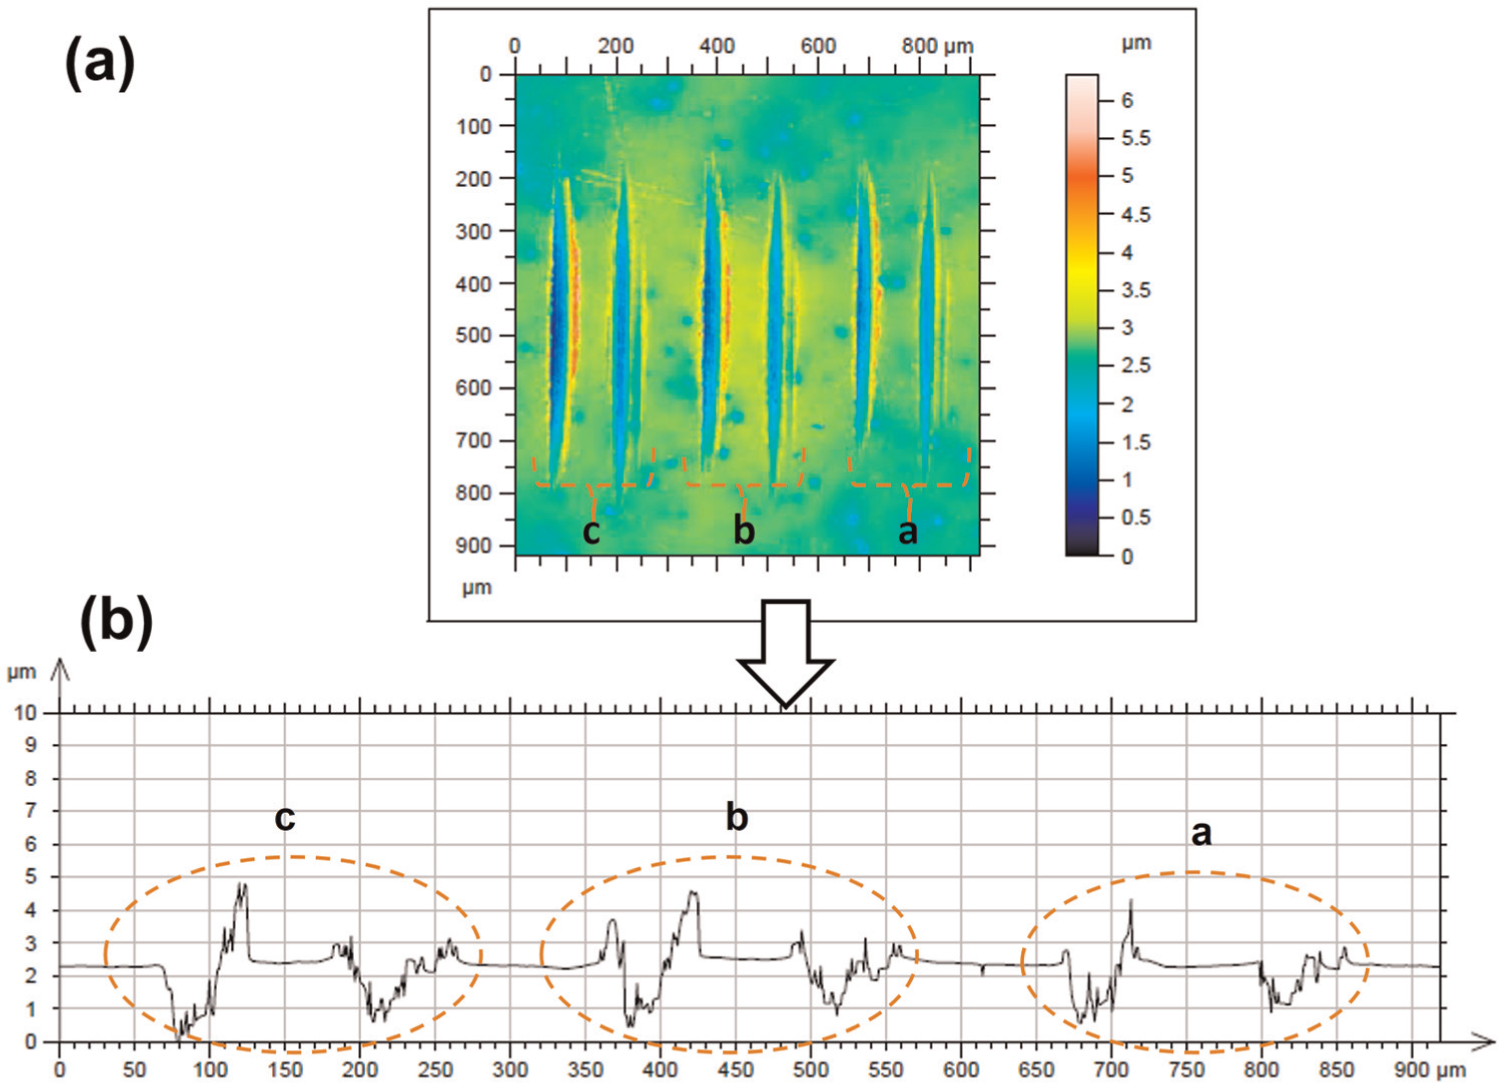
In the previous section, the measurements were done at the deepest point of the scratches. The material removal mechanism along a scratch path cannot be represented by a cross section obtained only at the deepest point of the scratch. A longitudinal and lateral cross section along the scratch path on the Inconel 718 is shown in Figure 18. The fundamental material removal characteristics along the scratch path were revealed. Figure 19 shows the variation in the pile-up ratio along the scratch path beginning from the initial grit–workpiece interaction and continuing to the end of scratch. The pile-up ratio is relatively smaller in the first half of the scratch than that obtained in the second half of the scratch, as shown in Figure 19. At the initial stage of scratch in Figure 19, few spike points for the pile-up ratio represent material removal mechanism dominantly exist as a material swelling up without notable cutting because of very shallow cutting depth in that region (see Figure 20 for pile-up ratio–depth of cut variation). Once remarkable cutting action began, pile-up ratio dropped down to around 0.5, but after that it is continuously rising with fluctuating trend towards the end of scratch. The reason of increasing pile-up ratio towards the end of scratch could be partly attributed to ploughed material accumulation in front of the grit while the grit moves towards the end of scratch. At the end of the scratch, very high pile-up ratios (∼4–5) were measured with almost no cutting action. Grit pushed forward material towards the end of the scratch and material accumulation became very high at the exit side of the scratch. In that region, scratched groove by the grit is above the workpiece surface level, that is, the grit cut the accumulated material rather than work surface (see the end of scratch part in Figure 21). Similarly, little material swelling up above the surface level at the entrance of the scratch was observed (see the entrance of scratch part in Figure 21), but this cannot be attributed to material accumulation at this stage; it seems the grit squeezed some material up around two sides of it without cutting action when it started penetrating into the workpiece. Interestingly, scratch depth profile along the scratch direction does not follow the ideal circular trajectory; uneven depth profile along the scratching direction, as shown in Figure 21, was observed. This is because actual abrasive grit was used in the test rather than shaped cutting tool. Micro break and wear could take place on the grit cutting edges during single scratch generation, and this would change the cutting edge geometry. Sudden change in the cutting edge geometry resulted in uneven scratch depth profile. It can also be claimed that the cutting ability of the grit is better at the entrance side of the scratch than that at the exit side of the scratch. Actual material removal area with the depth of cut along the scratch path is graphed in Figure 22. It shows that cutting action is a significant material removal mechanism when increasing the depth of cut. Negative values of actual material removal area, which are placed mainly at the exit side of the scratch, represent the pile-up ratio is above unity. The groove in this region was created with ploughed material accumulated on the original workpiece surface level.
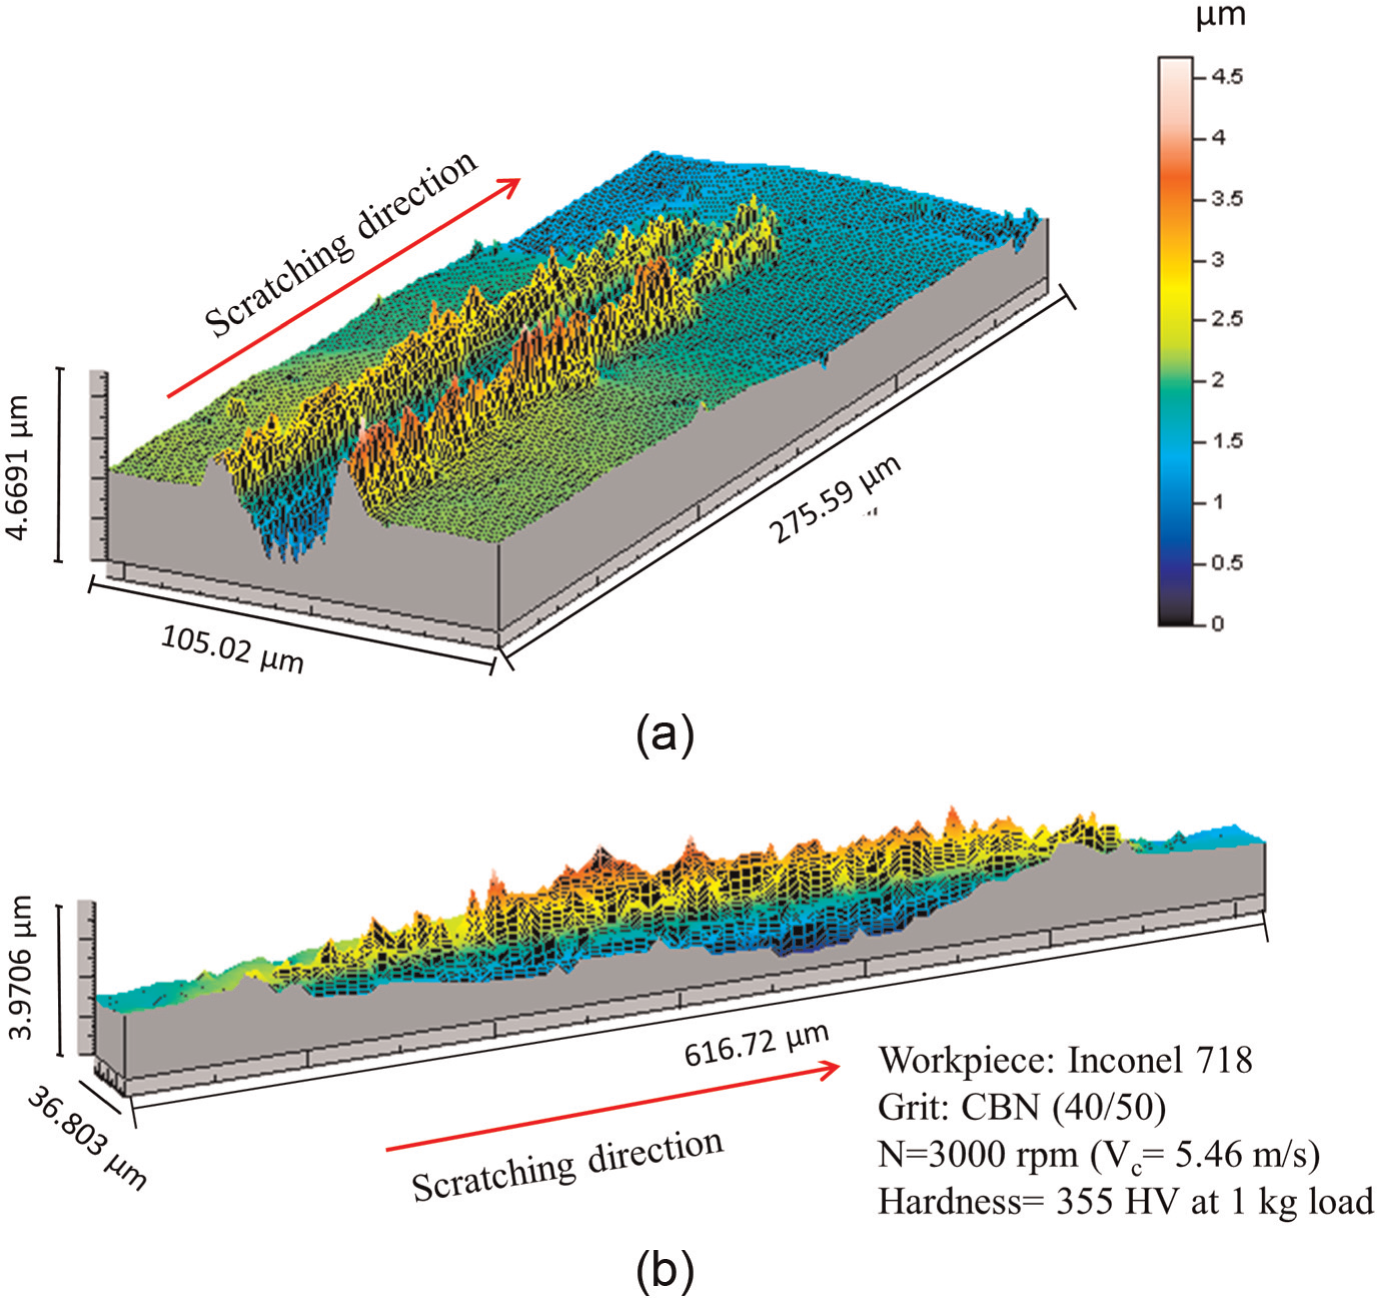
3D view of single scratch: (a) lateral cross section and (b) longitudinal cross section.
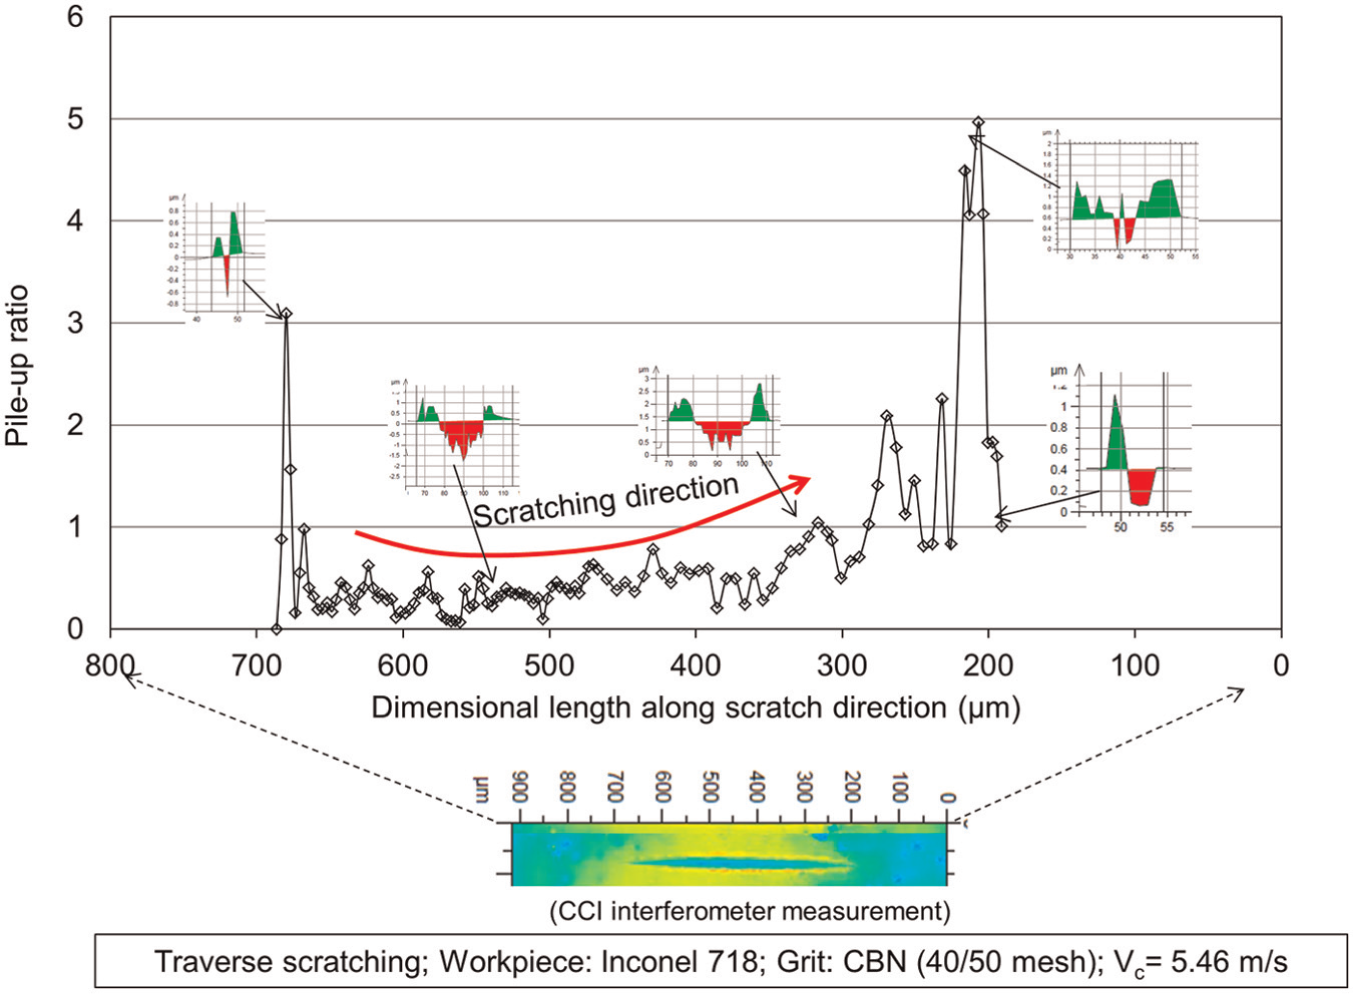
Variation in pile-up ratio along scratch path.
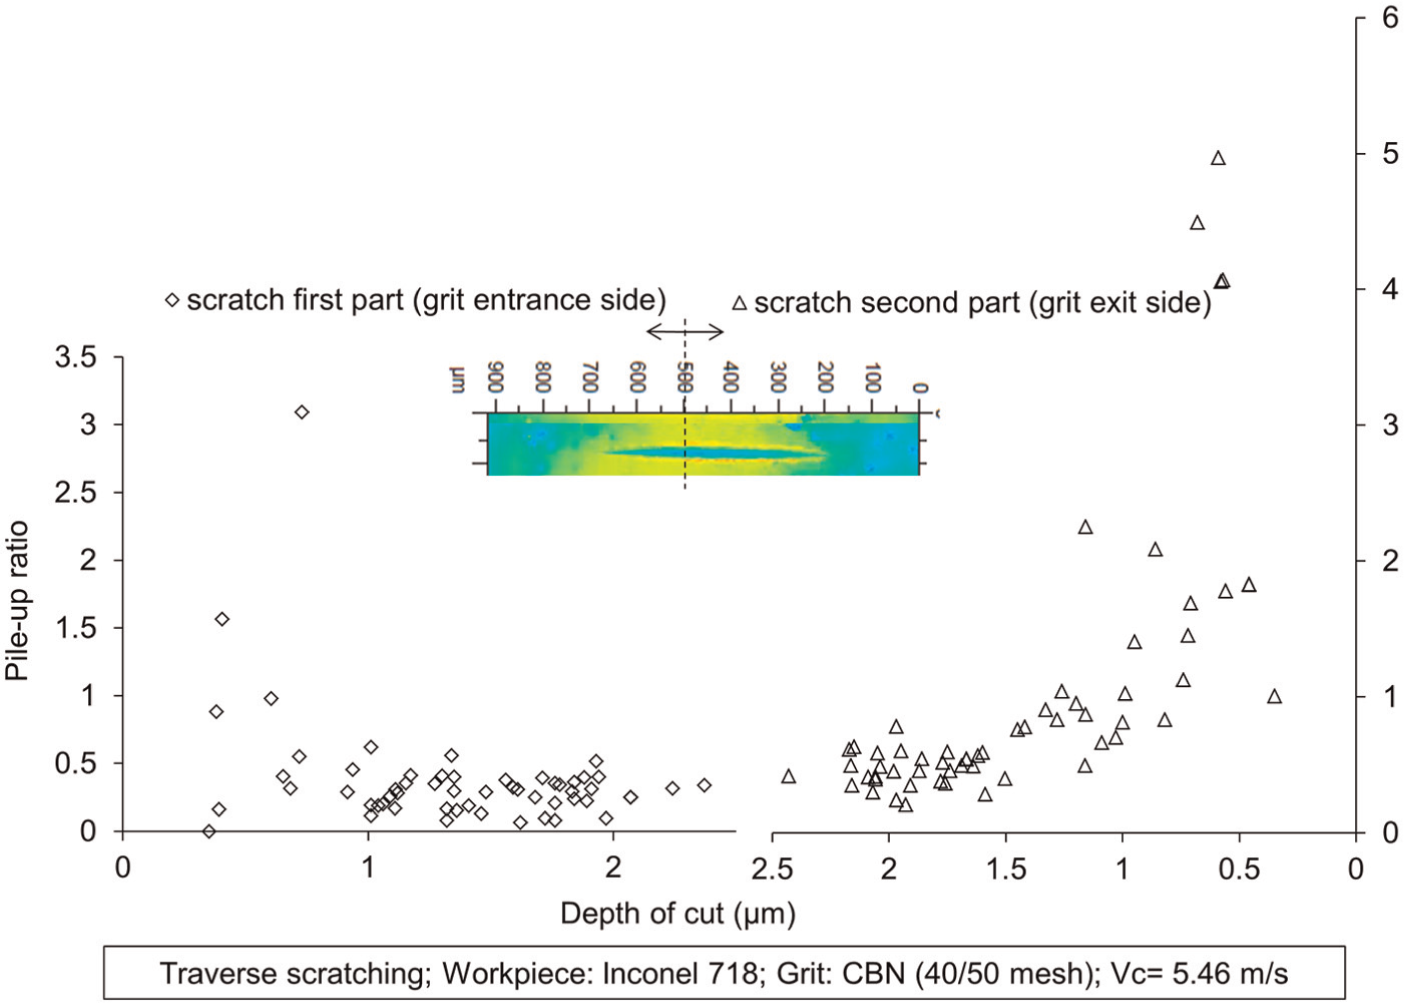
Pile-up ratio versus depth of cut along scratch length.
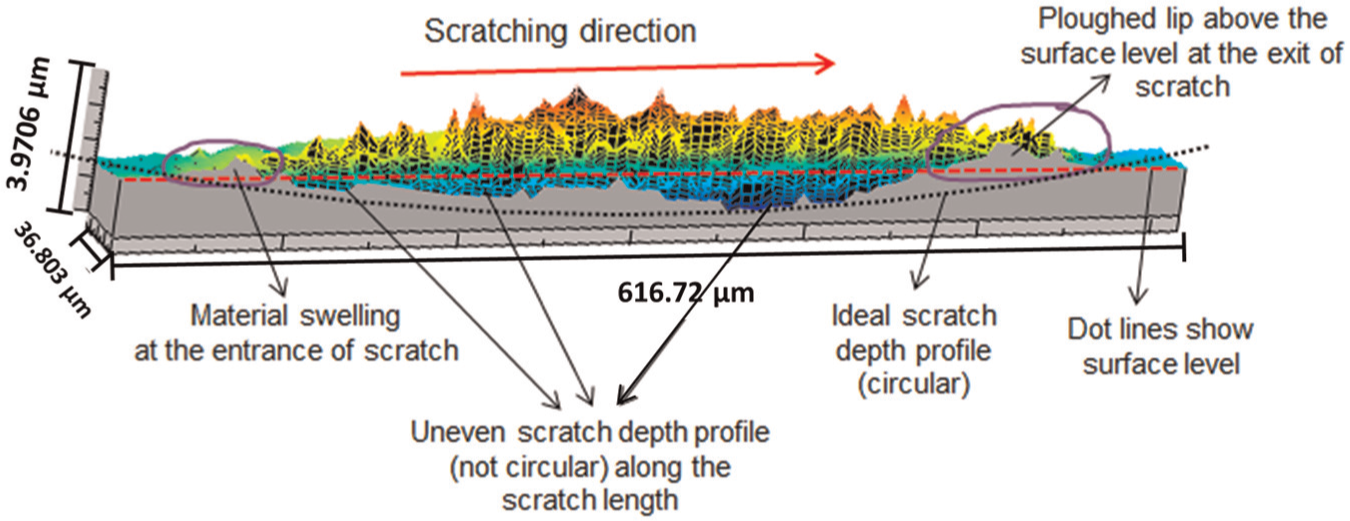
Longitudinal sectional view of a scratch with notations to show material removal characteristics along scratch path.
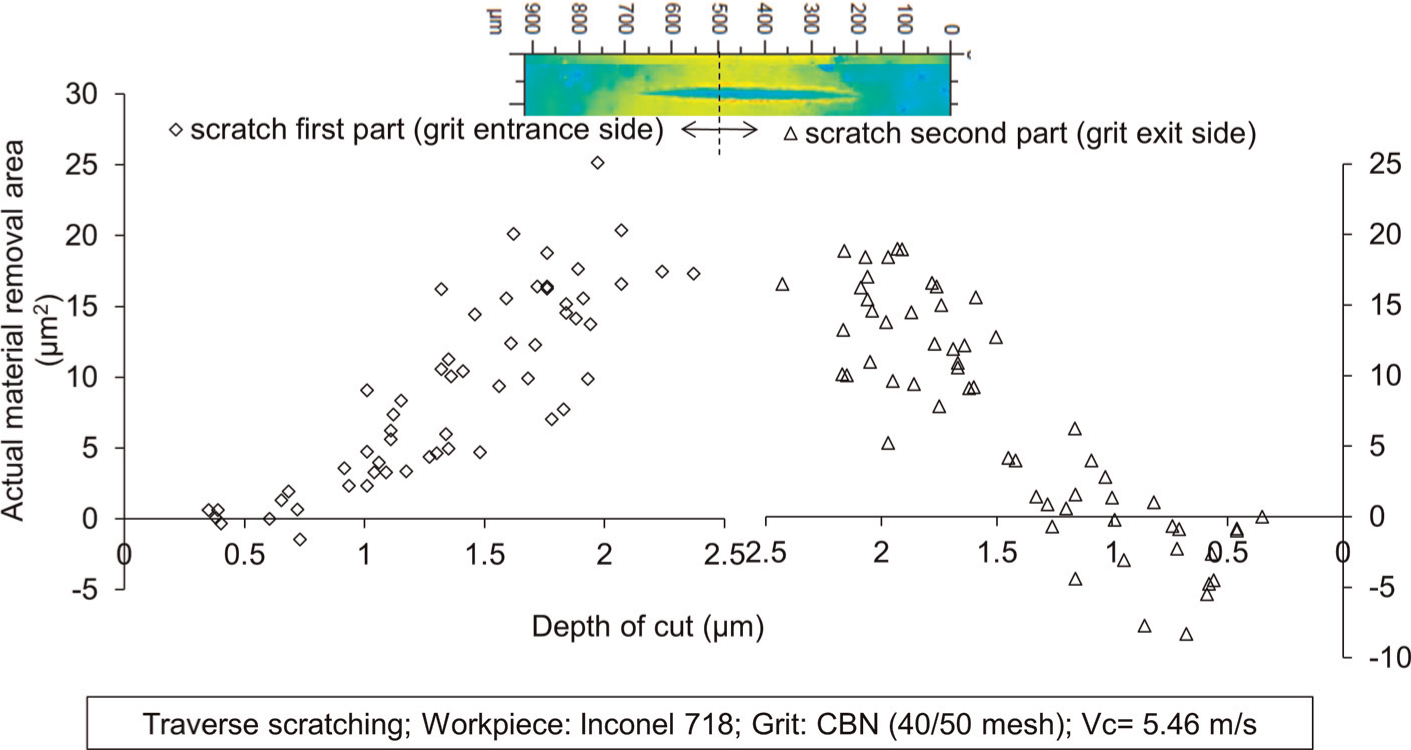
Actual material removal area versus depth of cut along scratch path.
Summary
The cutting ability of a CBN grit on Inconel 718 material sample was studied by utilizing a series of single grit scratching tests. Similar to actual grinding processes, the abrasive grit cutting edge profile changed during the scratching tests. Experiments showed that the cutting edge shape alteration of the grit during scratching process was one of the most influential parameters to determine prominent material removal mechanism in terms of rubbing, ploughing and cutting. The pile-up ratio and the actual material removal area were used as measures to represent the material removal mechanism. The scratches of single cutting edge and multiple cutting edges were generated, which demonstrated that different material removal mechanism could exist simultaneously in grinding due to various cutting edges presented. The pile-up ratio decreases with increasing the depth of cut albeit it is highly dependent on the grit cutting edge shape. Sharp cutting edge resulted in higher pile-up ratio compared to that found in less sharp cutting edge, when two distinct cutting edges exist on a grit. Besides, actual material removal area increases with increasing depth of cut.
The material removal mechanism along the scratch path was also investigated in detail. It was found that the cutting ability of the grit was better at the entrance side of the scratch than that at the exit side of the scratch. Ploughed material due to material accumulation increases towards the end of scratch in the second half the scratch. Thus, pile-up ratio was found dramatically high at the exit side of scratch compared to that found at the entrance side of the scratch. This phenomenon helps to explain the different grinding behaviours between up-cut and down-cut grinding.
Footnotes
Declaration of conflicting interests
The authors declare that there is no conflict of interest.
Funding
This research received no specific grant from any funding agency in the public, commercial or not-for-profit sectors.