
Abstract
In this study, an attempt has been made to statistically model the relationship between cutting parameters (speed, feed rate and depth of cut), cutting force components (Fx, Fy and Fz) and workpiece absolute surface roughness (Ra). The machining case of a martensitic stainless steel (AISI 420) is considered in a common turning process by means of a chemical vapor deposition–coated carbide tool. A full-factorial design (43) is adopted in order to analyze obtained experimental results via both analysis of variance and response surface methodology techniques. The optimum cutting conditions are achieved using mutually response surface methodology and desirability function approaches while the model adequacy is checked from residual values. The results indicated that the depth of cut is the dominant factor affecting (Fx: 86%, Fy: 58% and Fz: 81%), whereas feed rate is found to be the utmost factor influencing surface roughness behavior (Ra: 81%). In addition, a good agreement between the predicted and measured cutting force components and surface roughness was observed. The results are also validated experimentally by determining errors (Fx: 6.51%, Fy: 4.36%, Fz: 3.59% and Ra: 5.12%). Finally, the ranges for optimal cutting conditions are projected for serial industrial production.
Introduction
Numerous engineering structures and mechanical parts are exclusively made from stainless steel with chromium element ranging from 13% to 30%, together with nickel in order to ensure corrosion resistance. 1 Usually, such steels present difficulties in machining because of their foremost ductility, elevated strength, significant work hardening rate and relatively low thermal conductivity.
The accomplishment of whichever machining operation for stainless steel is considerably affected by workpiece properties and material removal process. Basically, these properties and further intrinsic characteristics in relationship with the cutting procedure are commonly summarized in the term “machinability.” For instance, the knowledge of cutting force components and associated surface roughness data provides useful information in relation to plastic deformations and required mechanical power for material machining. Moreover, it makes it possible to delimit the cut zone by choosing safe cutting force values for the tool from standard guides. Usually, turning operation produces the components that have critical features and that entail specific surface finish. 2
When considering product manufacturing process, both optimization and modeling are carefully taken into account as two key issues. Cutting force components and surface roughness are difficult to model because they are affected by a variety of variables. Recently, several studies presented different mathematical/statistical models using cutting force components, surface roughness measurements and a specified machining process with the aim to simulate and subsequently optimize the cutting regime.1,3,4 Noordin et al. 5 studied the performance of a coated carbide insert for the case of hard turning of AISI 420 stainless steel with respect to tool life and surface roughness. The results showed that an extremely fine surface roughness is obtained when using a wiper-coated carbide tool. Xin and It-Meng 6 found that cutting parameters’ influence (represented by cutting speed, feed rate and depth of cut) has been extended to tool material, tool geometry and work materials in terms of dynamic cutting forces. Ciftci 7 presented results of an experimental work for dry turning of two austenitic stainless steels (AISI 304 and AISI 316) using coated cemented carbide tool. The study showed that the higher the cutting speed, the lower the surface roughness values, and the TiC-/TiCN-/TiN-coated cutting tools gave lower cutting forces than TiCN-/TiC-/Al2O3-coated tools. In another study, Lima et al. 8 found that increasing cutting speed decreased machining forces, whereas feed rate and depth of cut had an ever-increasing effect. Additionally, the same study concluded that the surface finish of the machined part was improved at high cutting speeds and deteriorated with increasing feed rate. Liew and Ding 9 established that ductility of tool wear appeared to have influences on the surface roughness during the milling of AISI 420. El-Tamimi and El-Hossainy 10 used carbide cutting tools to study the extreme cutting conditions of stainless steel AISI 420, and then, mean effect and interaction plots were used to extract the most influential factors. Meanwhile, Bouchelaghem et al. 11 concluded that the feed rate remains the most affecting factor on the surface roughness values in turning of AISI D3. More et al. 12 used the statistical analysis (analysis of variance (ANOVA)) to determine the effect of cutting speed and feed rate on tool wear and surface finish when turning hardened AISI 4340 steel. Deng et al. 13 measured the cutting forces during dry turning tests of Cr12Mn5Ni4Mo3Al semi-austenitic stainless steel with two kinds of carbide tools (WC/Co and WC/TiC/Co). The result indicated that the cutting forces of WC/TiC/Co tool are smaller than those of the WC/Co under the same testing conditions. In a recent investigation, Gaitonde et al. 14 presented mathematical models exploring effects of process parameters on bur size during the drilling of AISI 316L stainless steel using RSM methodology. Azlan et al. 15 applied two modeling approaches, regression and artificial neural network (ANN), to predict the minimum Ra value of real experimental data, whereas António and Davim 16 found that the proposed genetic algorithm (GA) approach showed advantages in finding the optimal conditions under the imposed constraints. On the other side, for stainless steel buttress thread turning process, a study led by An et al. 17 concluded that inserts with rake angle of 12°, clearance angle of 3° and chip-curling groove contributed to obtain lower cutting forces, longer tool life, better chip-curling effect and better surface quality. For the case of turning of AISI 52100 bearing steel hardened at 64 HRC with cubic boron nitride (CBN) tool, the ANOVA and RSM method carried out by Bouacha et al. 18 showed that it was possible to combine the effects of cutting parameters on surface roughness and cutting forces. When searching to establish correlations between cutting parameters and surface roughness, it is necessary to use a plan of experiments based, for instance, on the Taguchi techniques 19 or the RSM method for optimum cutting force and surface roughness. This was the case when turning of AISI H11 by CBN7020 tool. 20 Suresh et al. 21 obtained a correlation between cutting parameters, machining force, power and surface roughness, in the machining of hardened AISI 4340 steel, using cemented carbide tools. The analysis of the result revealed that the optimal combination of low feed rate and low depth of cut with high cutting speed is beneficial in favor of reducing machining force. The methodology is also extended to model surface roughness in machining of aluminum silicon carbide (Al/SiC)-metal matrix composite (MMC) through RSM. 22 Yallese et al. 23 predicted the effect of feed rate on surface roughness by a power model deduced from experimental data and compared it with a theoretical model in turning of X200Cr12 steel. Nevertheless, unexpected results have been reported by Lalwani et al., 24 as they found that the cutting speed had no significant effect on both cutting force and surface roughness in turning of MDN250 steel, which can be related to the range of studied speed values. Fnides et al. 25 determined statistical models of surface roughness criteria in hard turning of X38CrMo V5-1, and the data confirmed that the feed rate is still the prevailing influence factor on surface roughness followed by cutting speed.
In this work, the tool-material couple approach is adopted in order to determine cutting parameters. Such a way is frequently preferred in order to establish, for a given tool–workpiece system, cutting conditions that induce a domain of chip fragmentation with a minimal cutting speed and a lesser specific energy. For that, an experimental contribution that focuses on prediction and optimization of cutting force components and surface roughness during the turning of martensitic stainless steel AISI 420 with chemical vapor deposition (CVD)–coated carbide cutting tool is presented. The ANOVA study and RSM method are used to determine the relationship between cutting conditions and the evolution of cutting force components together with surface roughness.
Experimental procedures
Material
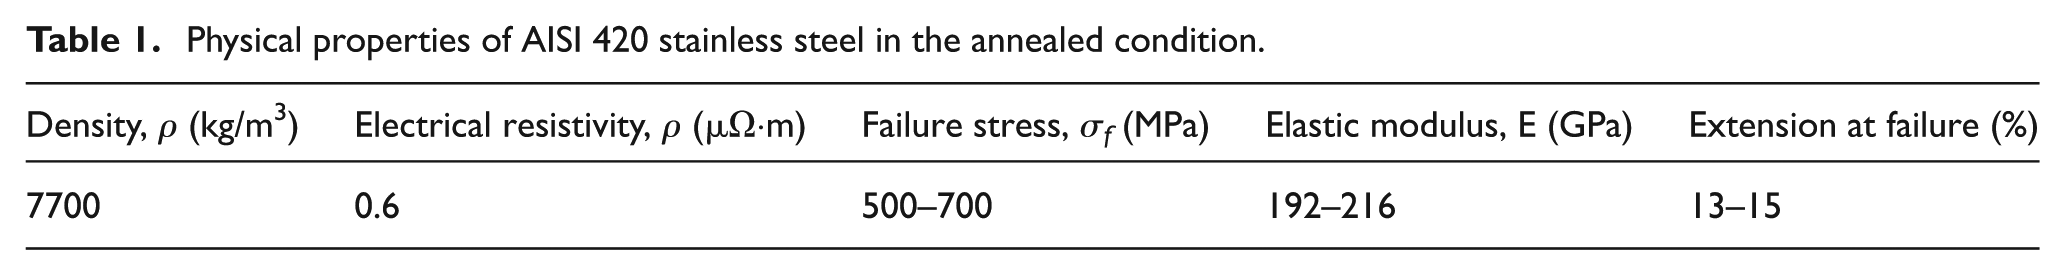
The material used in this study is a martensitic stainless steel designated as AISI 420. Because of its relatively important corrosion resistance and fair hardness (about 180 HB), it is widely employed for many applications such as tools for food processing, surgery, chemical containers and transportation equipment. Its chemical composition (in wt%) is given as follows: 0.36% C, 13.87% Cr, 0.28% Si, 0.52% Mn, 0.04% Mo, 0.005% Al, 0.018% S, 0.19% Ni, 0.005% Sn, 0.04% Cu, 0.019% P and the rest is Fe. Some physical properties of AISI 420 stainless steel in the annealed condition are presented in Table 1. The workpieces are used in the form of round bars having 75 mm and 300 mm in diameter and in length, respectively. The machining experiments were performed under dry conditions using a conventional lathe-type SN 40C with 6.6 kW spindle power.
Physical properties of AISI 420 stainless steel in the annealed condition.
Cutting tool and tool holder
Coated carbide inserts of International Organization for Standardization (ISO) geometry SNMG 120408 (GC2015) manufactured by Sandvik are used throughout the investigation. The CVD coating is a multilayer of TiN/TiCN/Al2O3 formed on a cemented carbide substrate. It consists of a thick, moderate temperature (MT) CVD of TiN for heat resistance and providing low friction coefficient. Despite the fact that TiCN offers a good resistance to wear and thermal stability, a layer of Al2O3 is required to bear effects resulting from high-temperature conditions, hot hardness and crater wear damage. By now, it is well confirmed that this combined top coating and associated gradient substrate confer excellent behavior during dry machining. 21 The ISO tool holder reference is PSBNR 2525 K12 and the tool geometry is characterized as follows: χr = + 75°, λ = −6°, γ = −6° and α = +6°.
Measurement setup
The setup used to measure the three components of the cutting force, feed force (Fx), thrust force (Fy) and tangential force (Fz), is schematically shown in Figure 1. The tool holder is mounted on a three-component piezoelectric dynamometer (Kistler 9257B). The measurement chain also included a charge amplifier (Kistler 5019B130), data acquisition hardware (A = D 2855A3) and graphical programming environment (DynoWare 2825A1-1) for data analysis and visualization. The whole measurement chain has been statically and dynamically calibrated. The static calibration of the dynamometer was made in each force direction. The outputs are voltage signals that are averaged for each direction. The loads up to 3000 N by 25 N intervals were applied, and the deflection values were recorded for each load interval. Thus, calibration curves were obtained to convert the output readings into cutting force values. In order to verify the consistency, the measurements were repeated three times. The effect of loading in a given dynamometer direction on the other force components was also examined and minor fluctuations were found. These effects were small enough to be ignored. Instantaneous measurements of absolute roughness (Ra), for each cutting condition, are obtained by means of a Mitutoyo Surftest 201 roughness meter. It consists of a diamond point (probe) with a 5 µm radius and moves linearly on the working surface. The length examined is 4 mm with a cutoff of 0.8 mm and the measured values of Ra are within the range 0.05–40 µm. In order to reduce uncertainties due to resumption operations, roughness is directly measured on the workpiece without dismounting it from the lathe. The measurements are repeated three times on the surface of the workpiece at three reference lines equally positioned at 120°, and the final result is an average of these values. In addition, several measurements were carried out using a 3D with optical platform of metrology modular Altisurf 500.
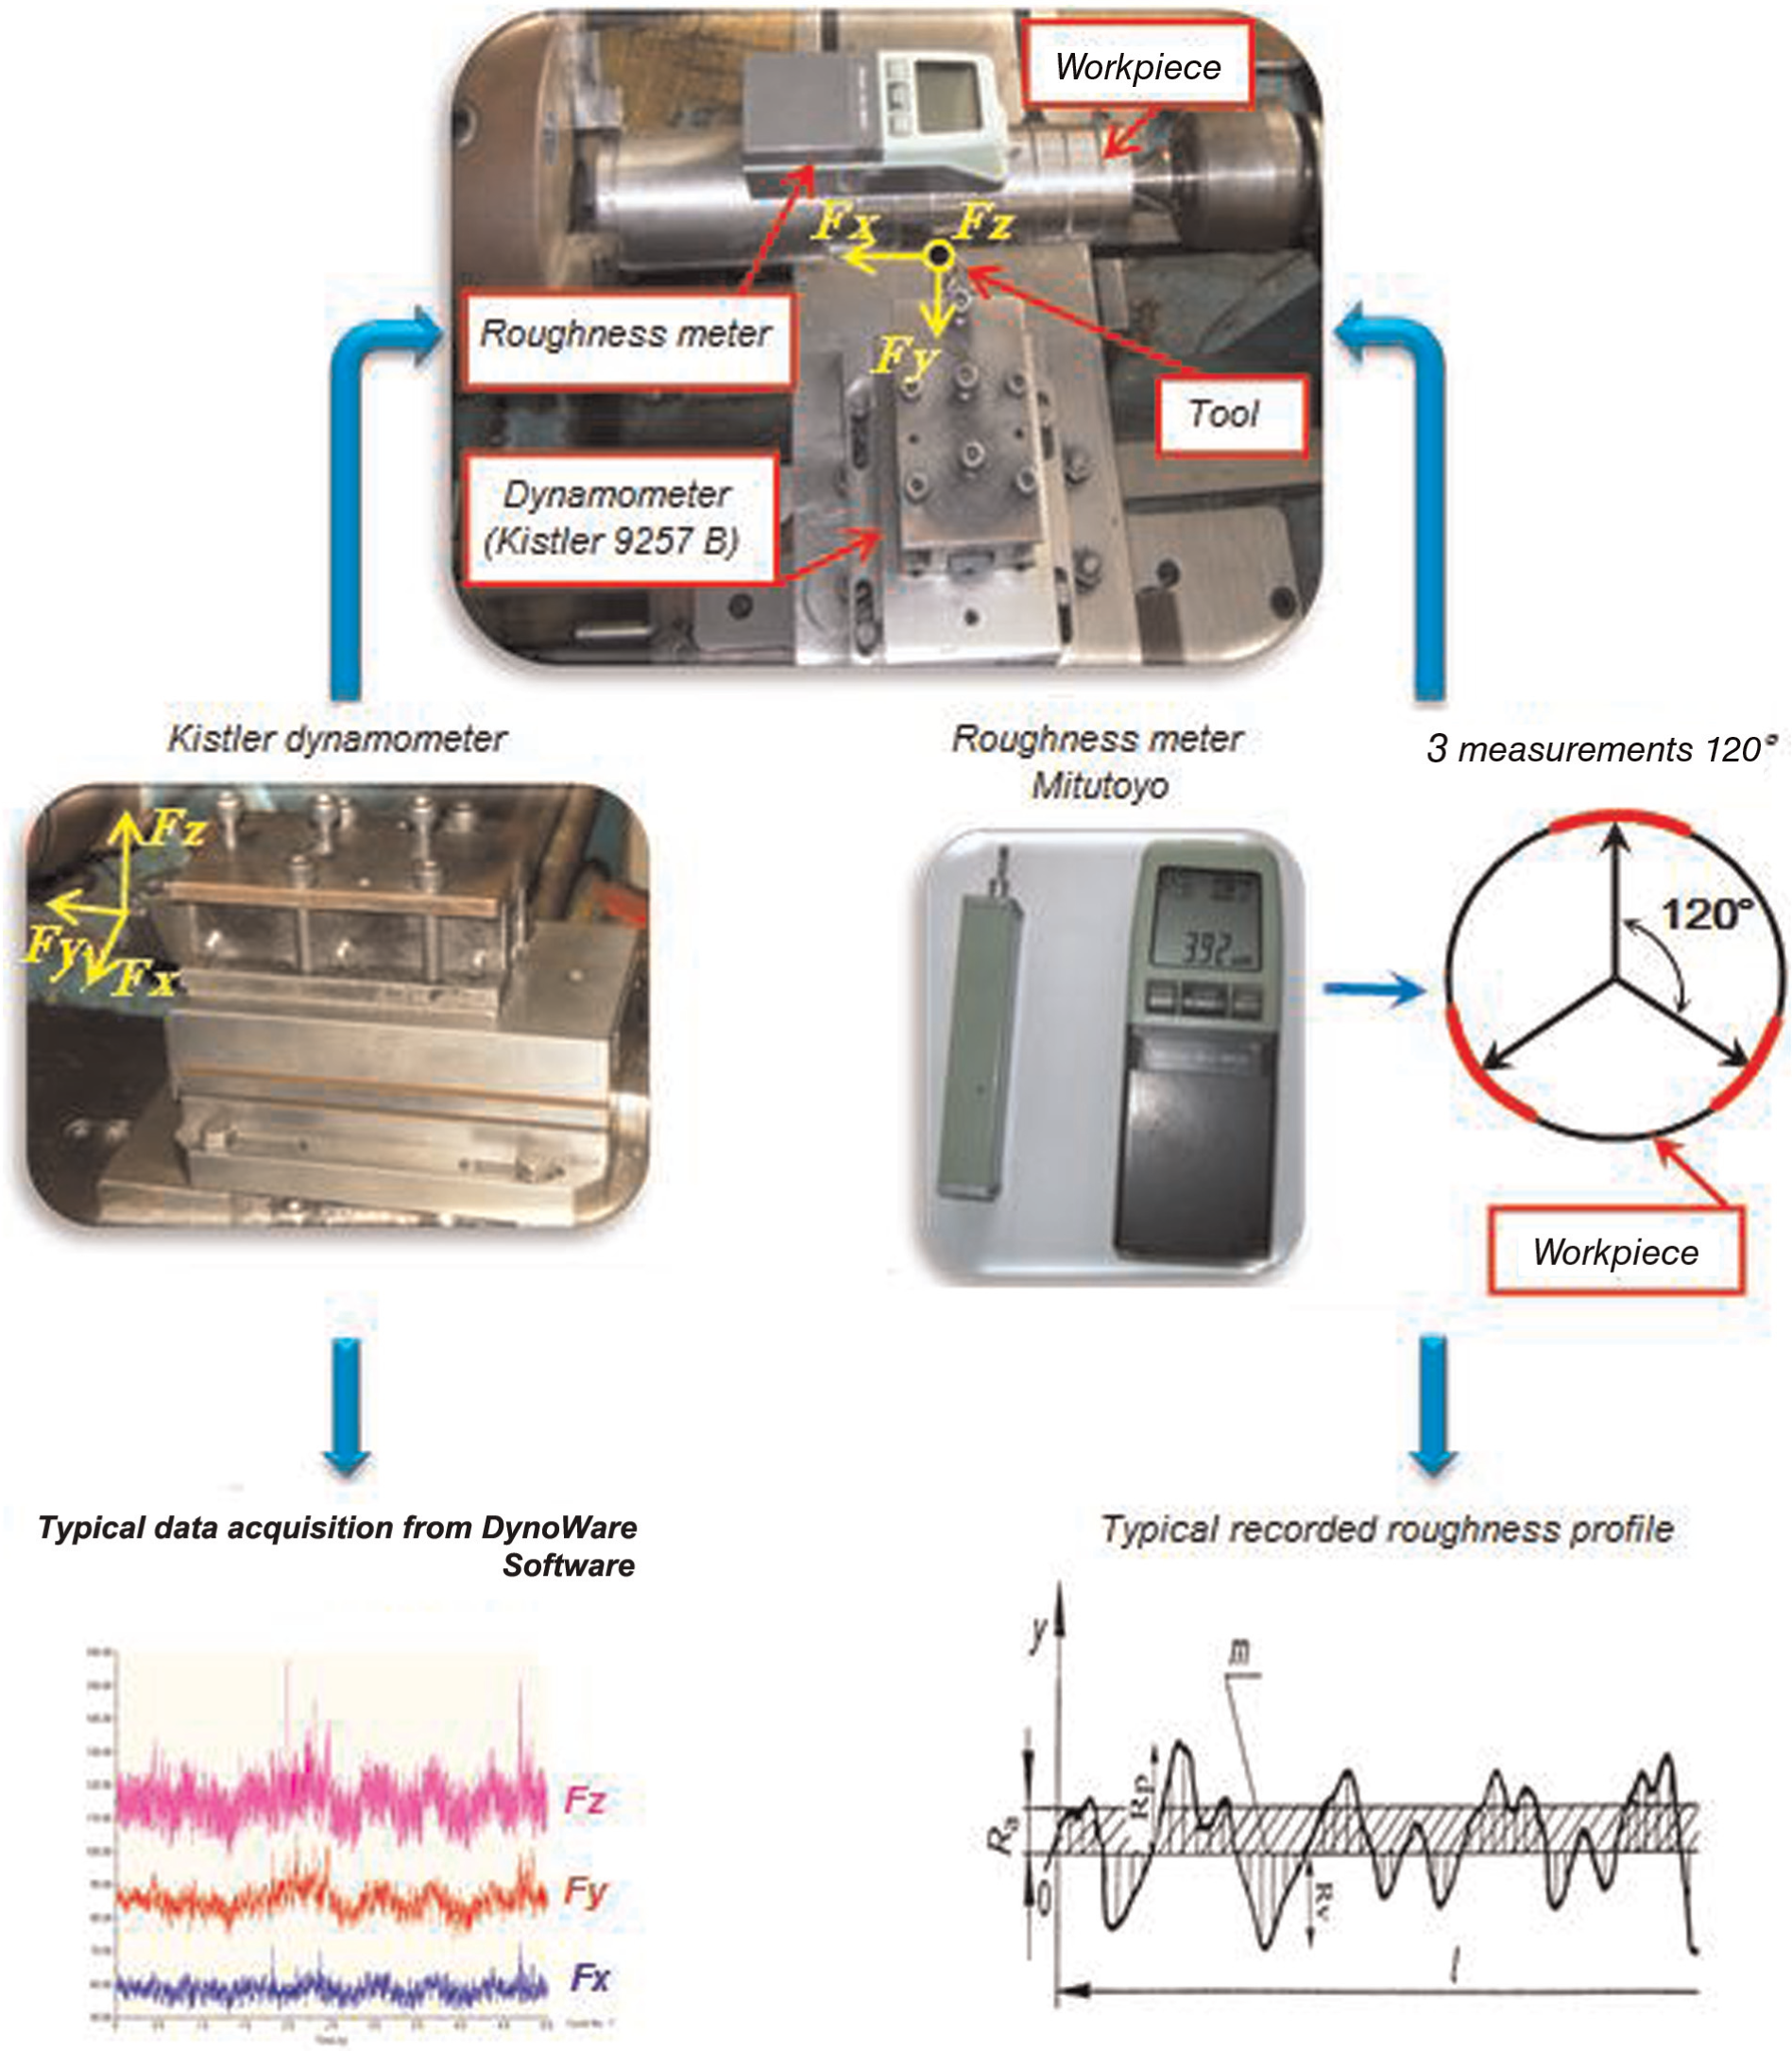
Experimental setup for cutting force and roughness measurements.
Planning of experiments
RSM is an empirical approach dedicated for the determination of a relationship between various process parameters and related responses. The purpose is to explore the effect of process parameters on outputs and then carry on an optimization of these responses. 26 The invoked procedure includes six steps which can be summarized as follows:
Define the independent input variables and the desired output responses;
Adopt an experimental design plan;
Perform a regression analysis with the quadratic model of RSM;
Perform a statistical ANOVA for the independent input variables in order to identify which parameters significantly affect the response;
Determine the situation of the quadratic model of RSM and decide whether the model of RSM needs screening variables or not;
Optimize, conducting confirmation experiment and verifying the predicted performance characteristics.14,20
In this investigation, the relationship between the INPUT consisting of the cutting conditions (cutting speed, Vc; feed rate, f and depth of cut, ap) and the dependent variable that corresponds to the resulting effects of interest in the experiment 27 (OUTPUT), designated by Y, and indicative of machinability aspects (cutting force components (Fx, Fy, Fz) and surface roughness, Ra), is presented as

where φ is the response function and the approximation of Y is proposed using a nonlinear (quadratic) mathematical model, which is suitable for studying the interaction effects of process parameters on machinability characteristics. In this work, the RSM-based second-order mathematical model is selected
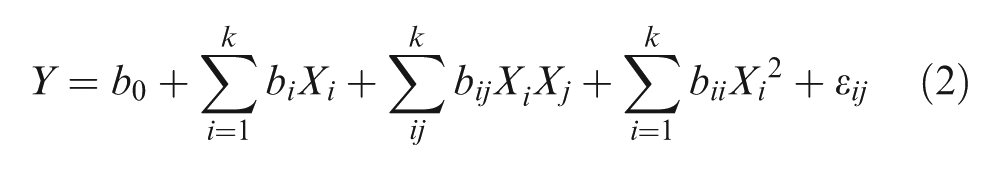
where b0 is the free term of the regression equation, the coefficients b1, b2, …, bk and b11, b22, bkk are the linear and the quadratic terms, respectively, while b12, b13, bk−1 are the interacting terms. Xi represents the input parameters (Vc, f, ap) and
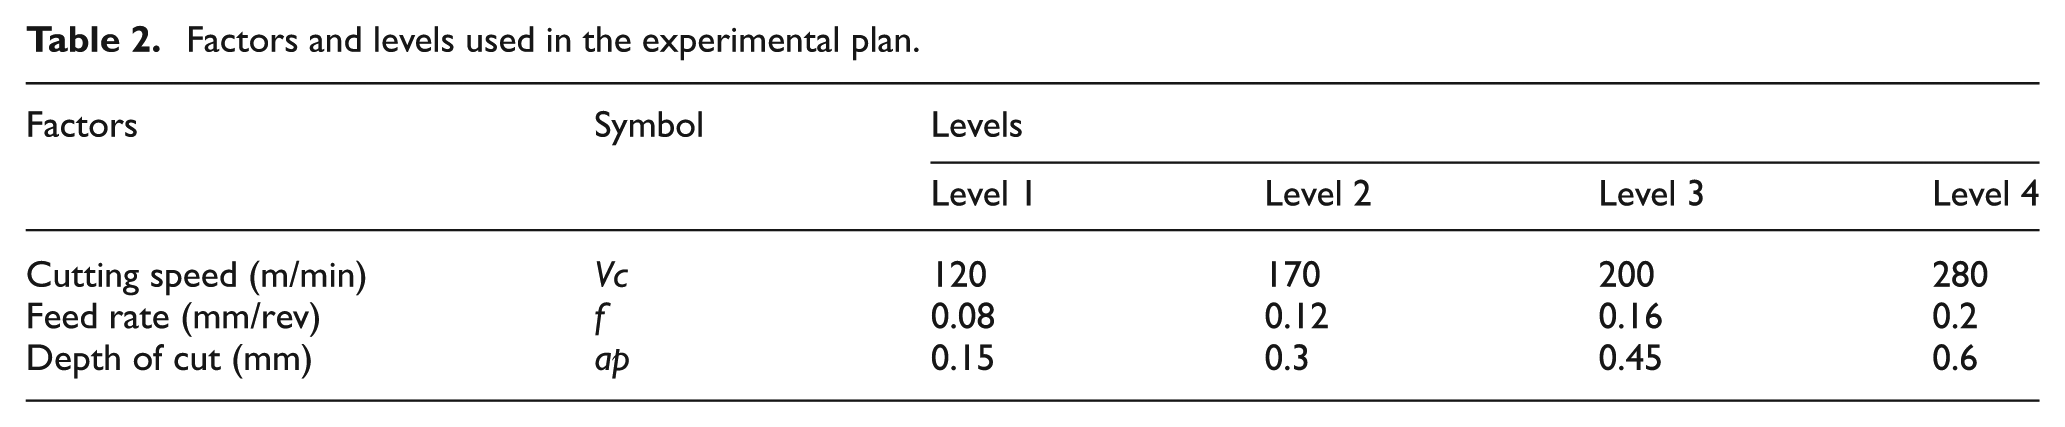
Four levels are considered for each of the identified factors as shown in Table 2. Cutting parameters are selected based on the hardness of workpiece material, chemical composition and cutting tool manufacturer guidelines. Full-factorial design (43 = 64 runs) is adopted for the design of experiments.
Factors and levels used in the experimental plan.
Results and discussion
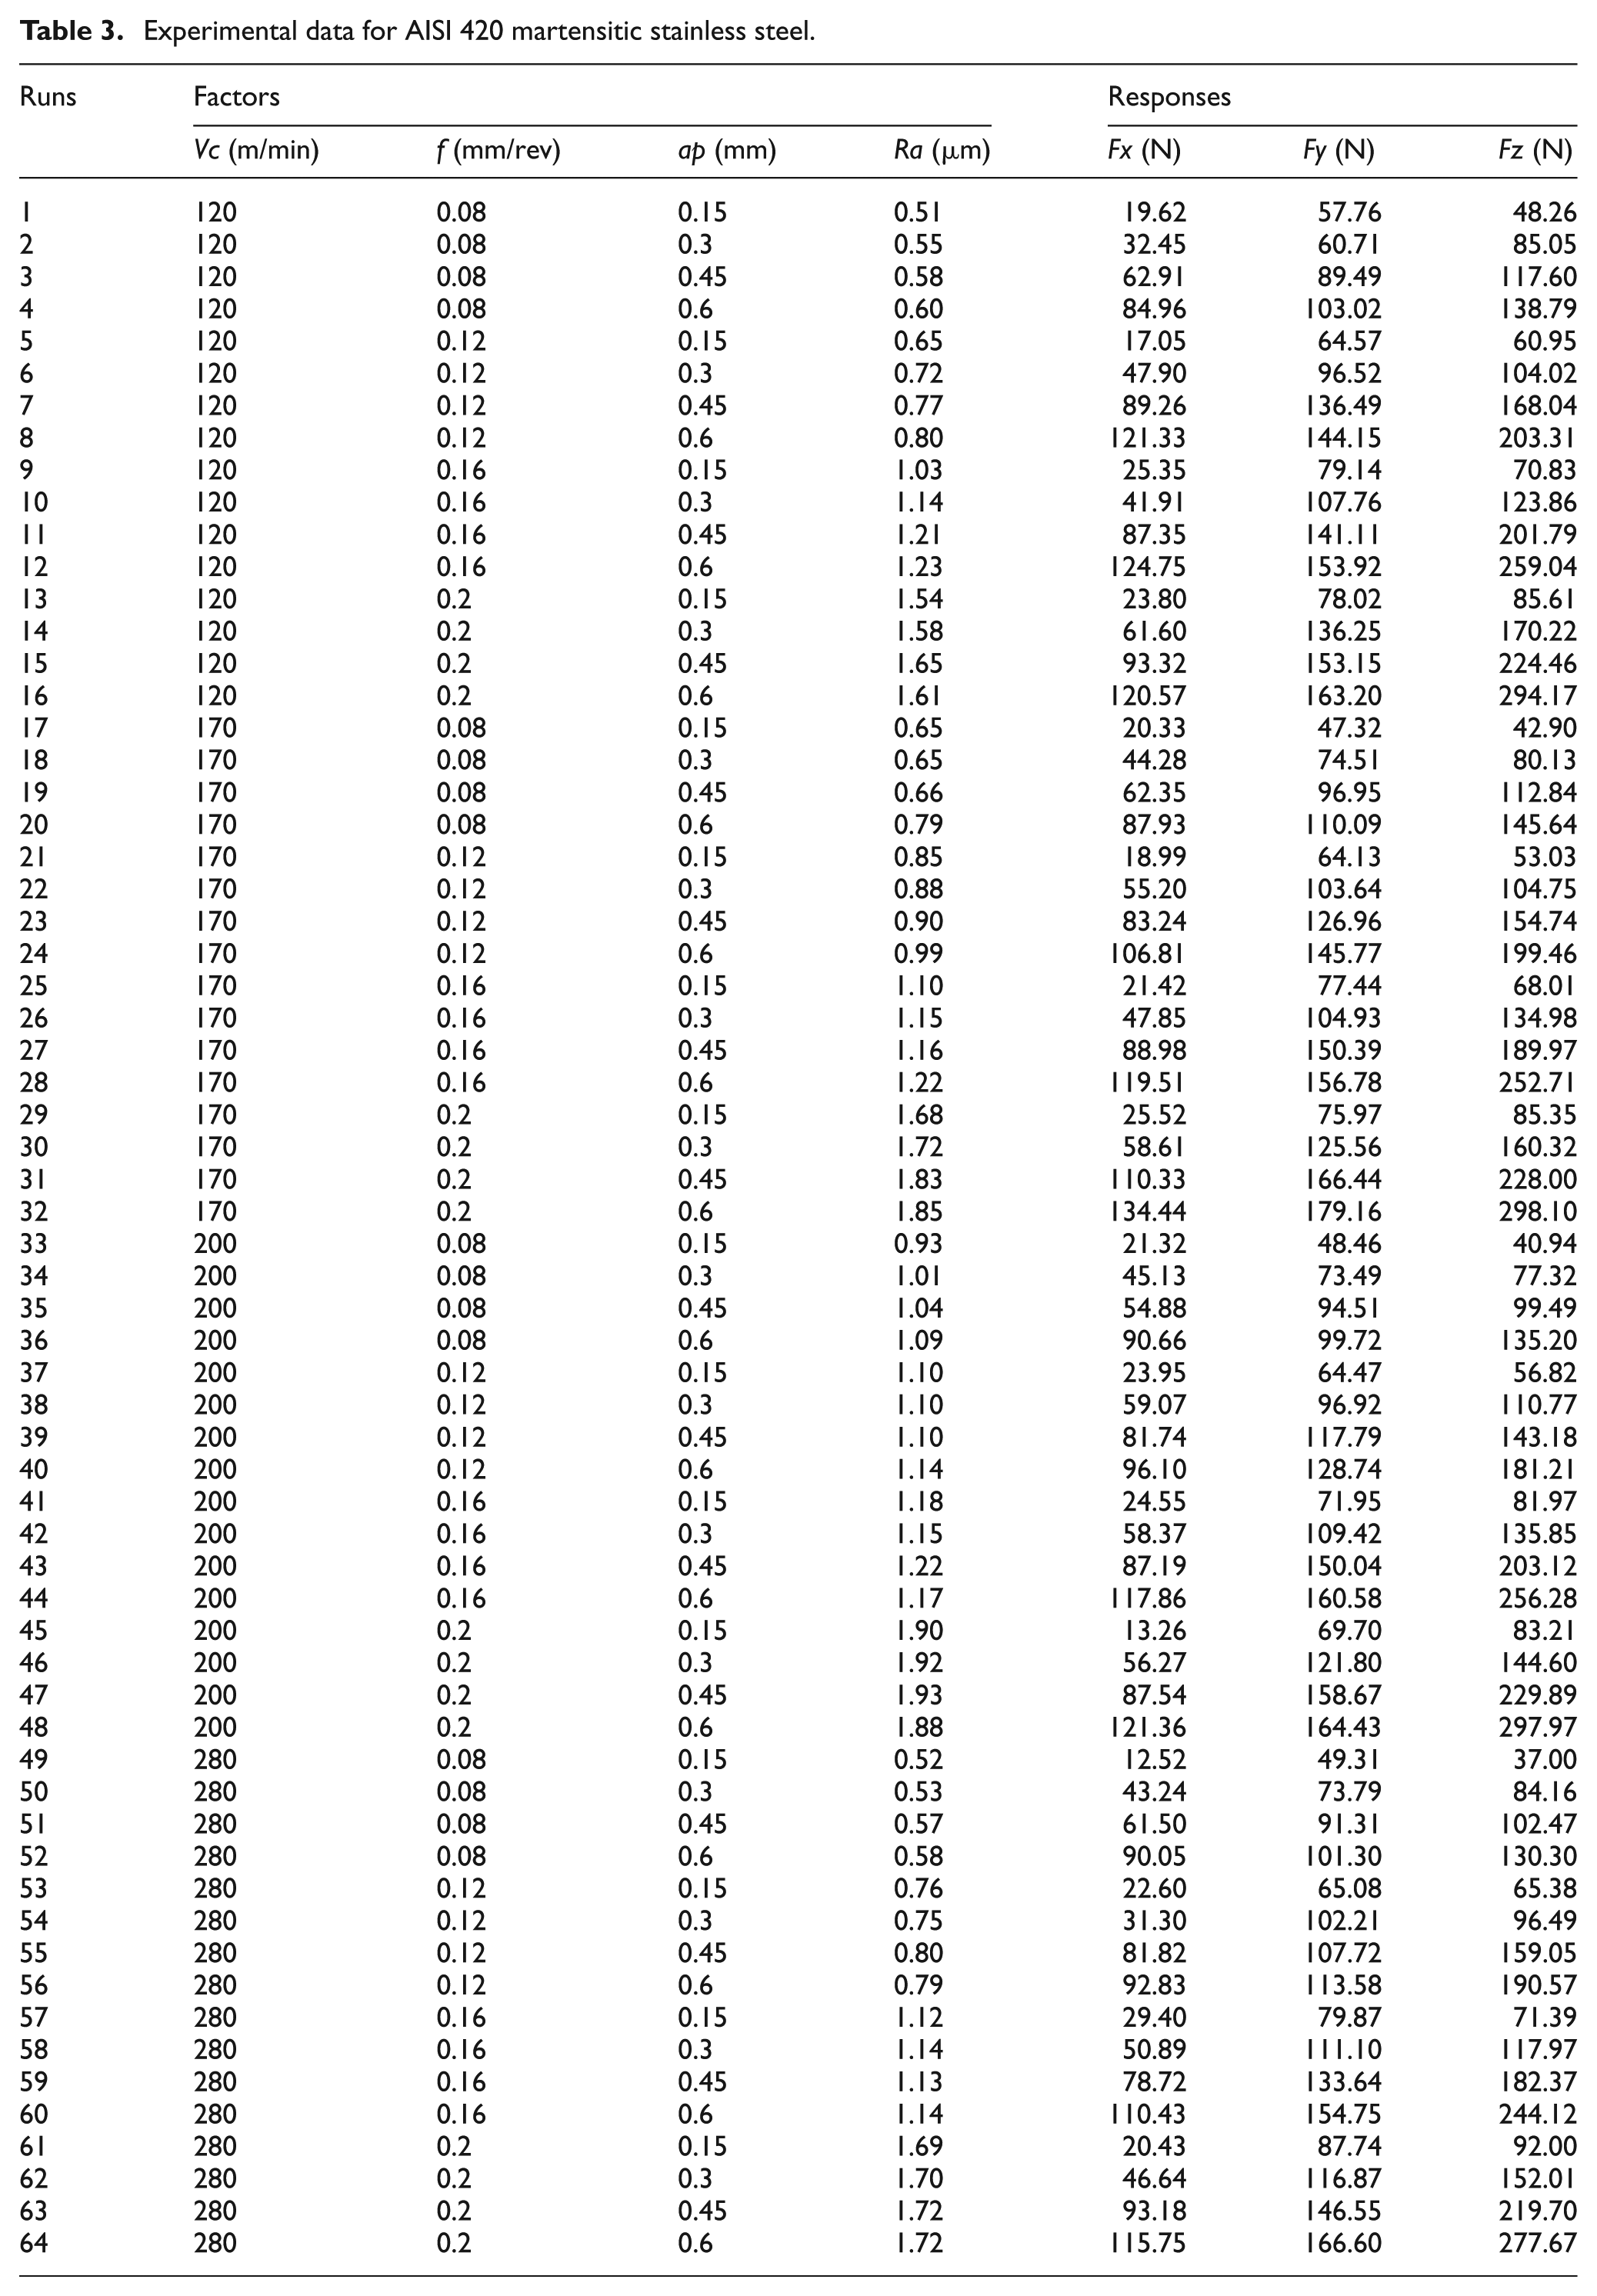
A set of 64 runs is carried out as planned and the experimental results are given in Table 3. For each cutting condition, four types of responses are recorded accordingly and checked as requested.
Experimental data for AISI 420 martensitic stainless steel.
Statistical data treatments are carried out in two steps. In the first one, the ANOVA and the effect of each factor and its interactions are determined. To achieve this goal, the response surface plots are generated considering two parameters at a time while the third one is kept constant. The second step focused on the optimization and modeling aspects using RMS outputs.
ANOVA results
ANOVA is useful to figure out the influence of given input parameters from a series of experimental results by the method of design of experiments for machining processes, and it also allows to supply an interpretation of output data. 21 It essentially consists in partitioning the total variation in an experiment into components ascribable to the controlled factors and generated errors. The statistical significance of the fitted quadratic models is evaluated by the p values and F values of ANOVA.
In ANOVA table, p value is the probability (ranging from 0 to 1) that the results observed in a study (or results more extreme) could have occurred by chance.
If p value > 0.05, the parameter is insignificant;
If p value < 0.05, the parameter is significant.
The sum of squares (SS) is used to estimate the square of deviation from the grand mean
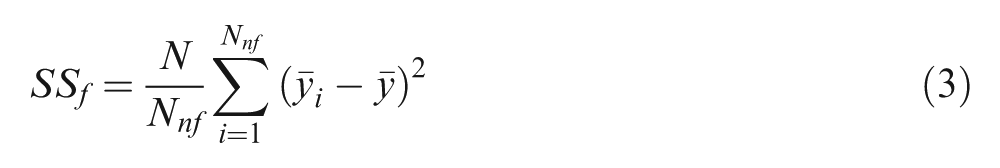
where
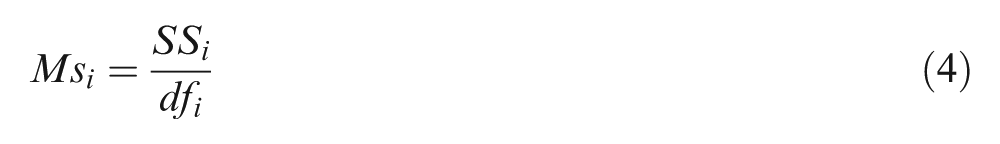
Mean squares are estimated by dividing the SS by degrees of freedom
In order to check the adequacy of the model, the index F-ratio is used with the basis that calculated F values should be greater than those obtained from the F-table
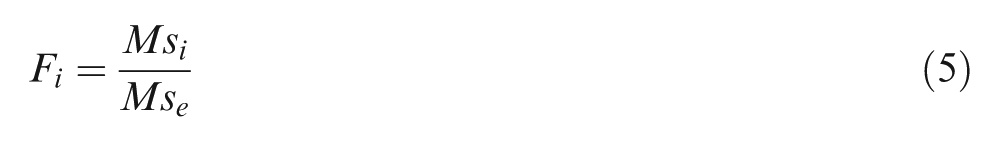
with Mse the mean squares of error.
The model is adequate at 95% confidence level whenever the F-calculated value is greater than the F-tabulated value. When p values are less than 0.05 (or 95% confidence), the obtained models are considered to be statistically significant. Thus, it is demonstrated that the terms adopted in the model have significant effects on the responses. The determination coefficient (R2), which is defined as the ratio of the explained variation to the total variation, is a measure of the goodness of fit. In other words, the more R2 approaches unity, the better the response model fits the actual data 28
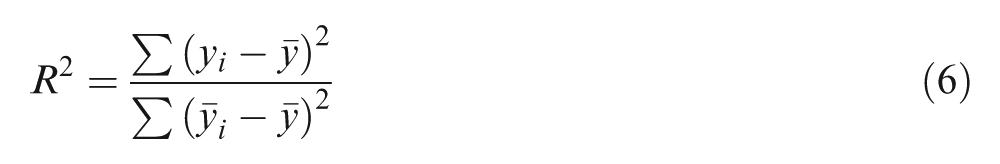
The last but one column of ANOVA tables shows the factor contribution (percentage; Cont.%) on the total variation, indicating the degree of influence on the result
The obtained results are analyzed using the statistical analysis software Design-Expert 8. Tables 4–7 illustrate ANOVA results for Fx, Fy, Fz and Ra, respectively, for the 95% confidence level. The discussion of the details of each case is given below.
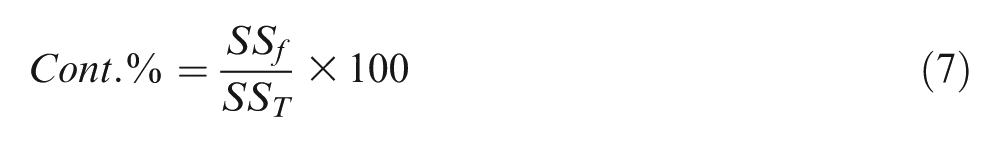
Analysis of variance for Fx.
DF: degree of freedom; SS: sum of squares; Ms: adjusted mean squares.
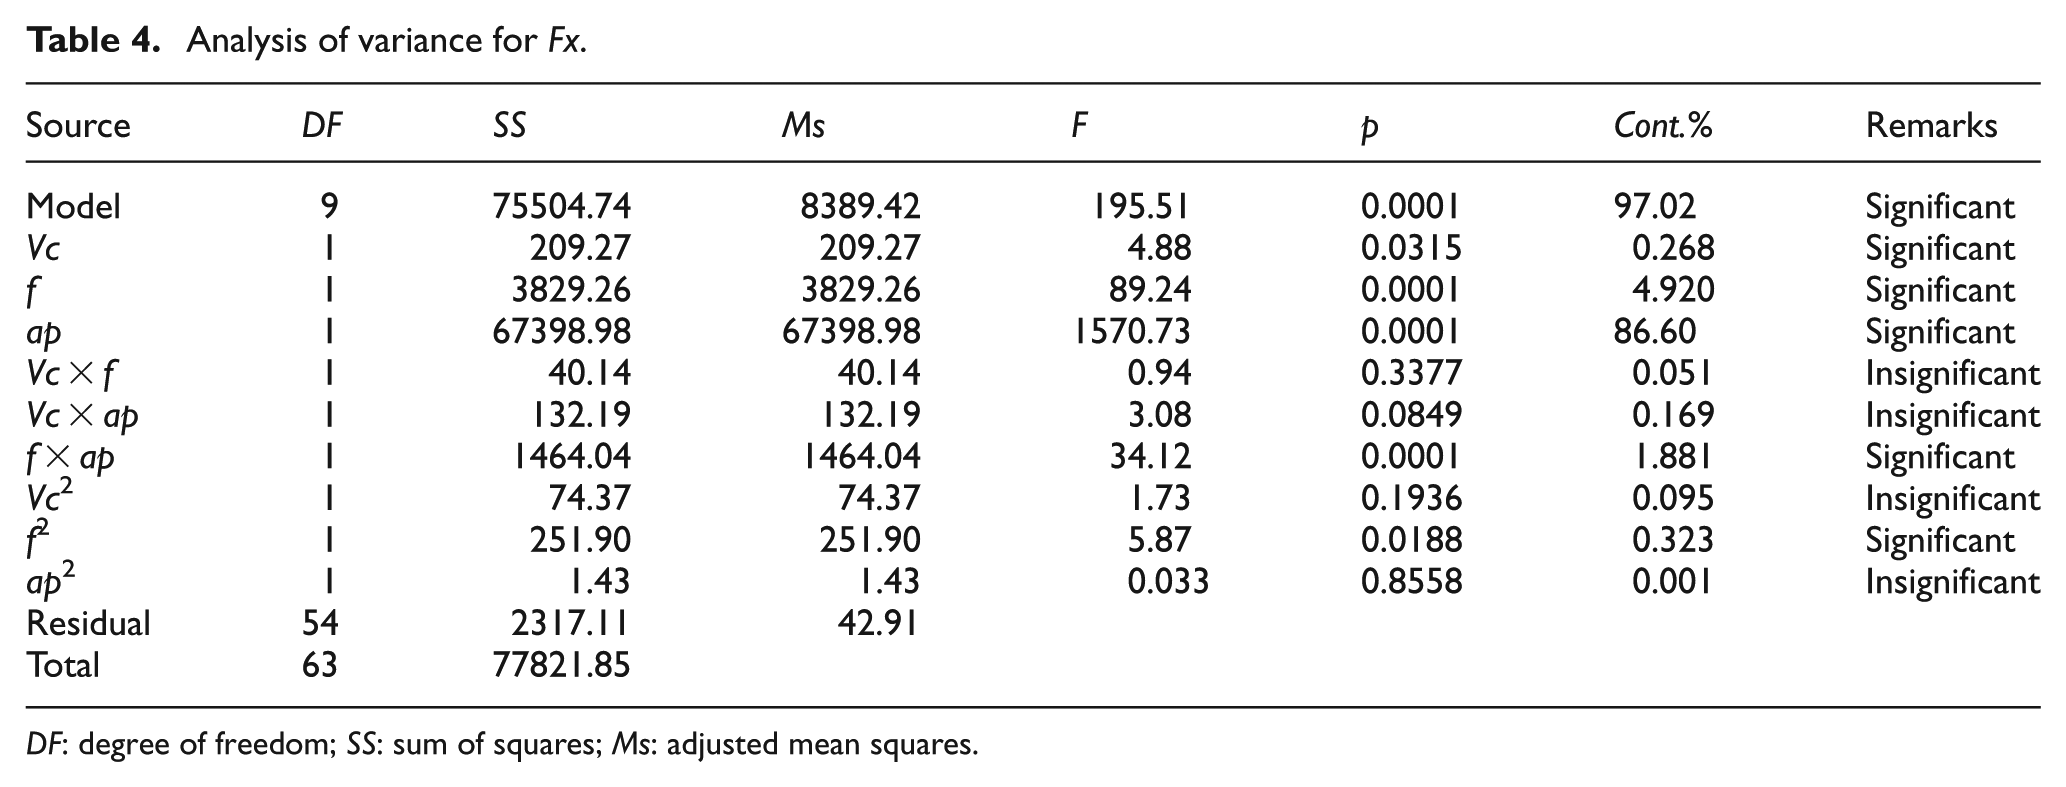
Analysis of variance for Fy.
DF: degree of freedom; SS: sum of squares; Ms: adjusted mean squares.
Analysis of variance for Fz.
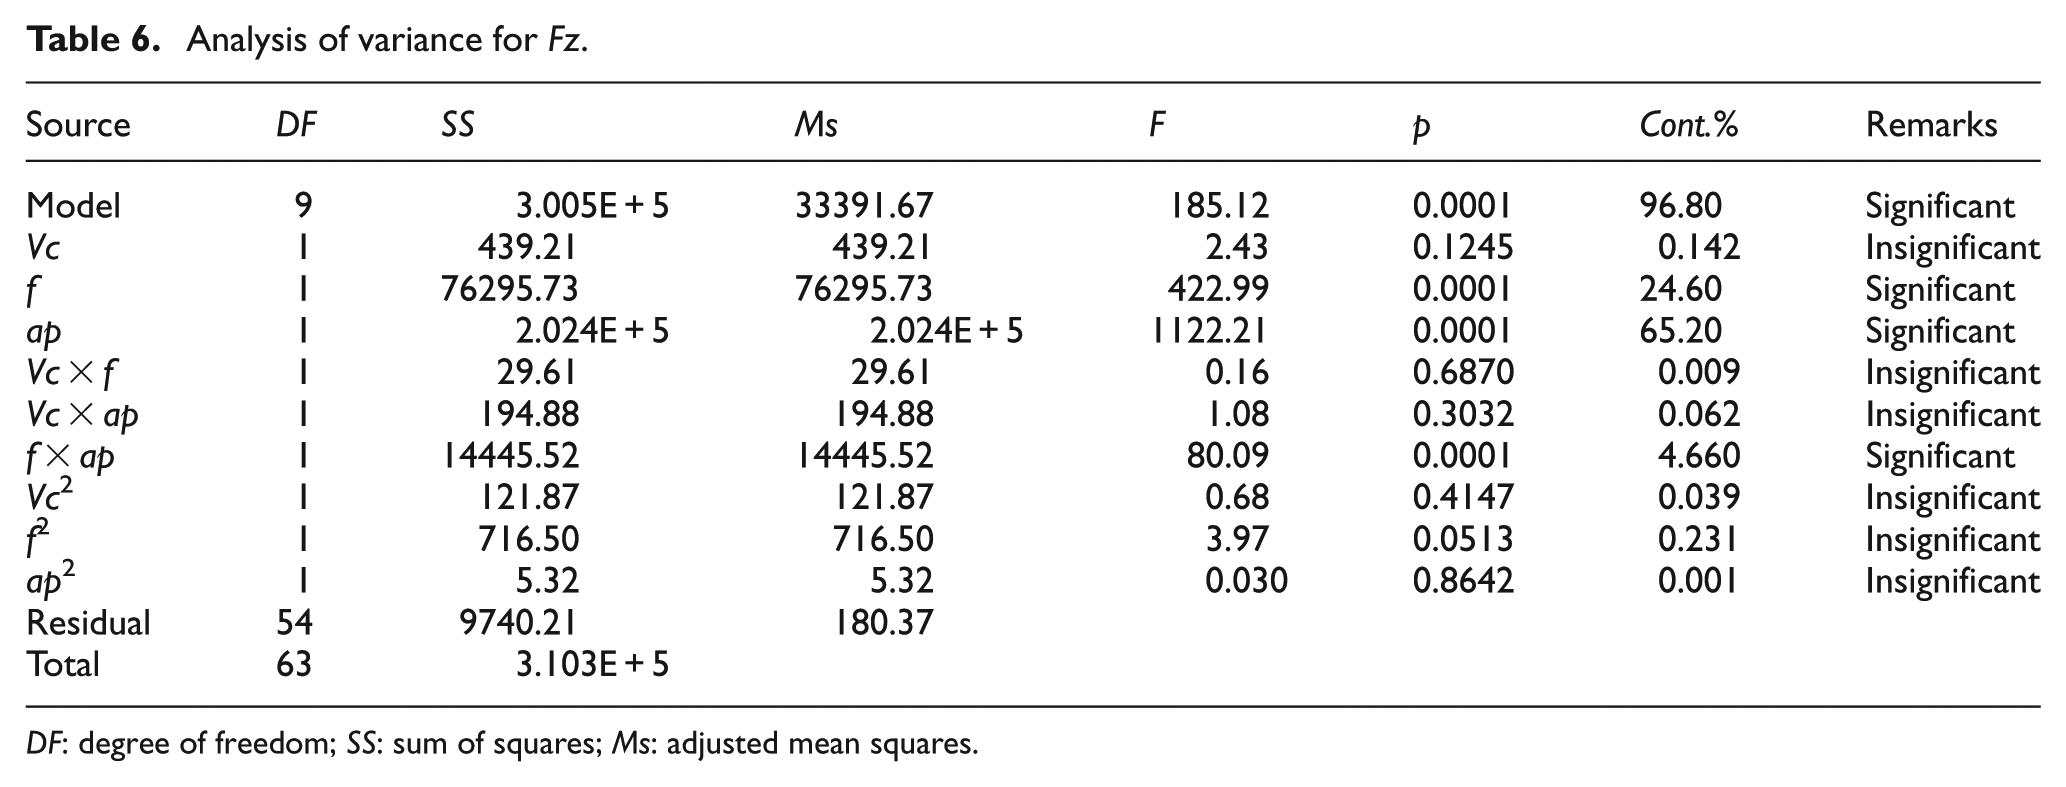
DF: degree of freedom; SS: sum of squares; Ms: adjusted mean squares.
Analysis of variance for Ra.
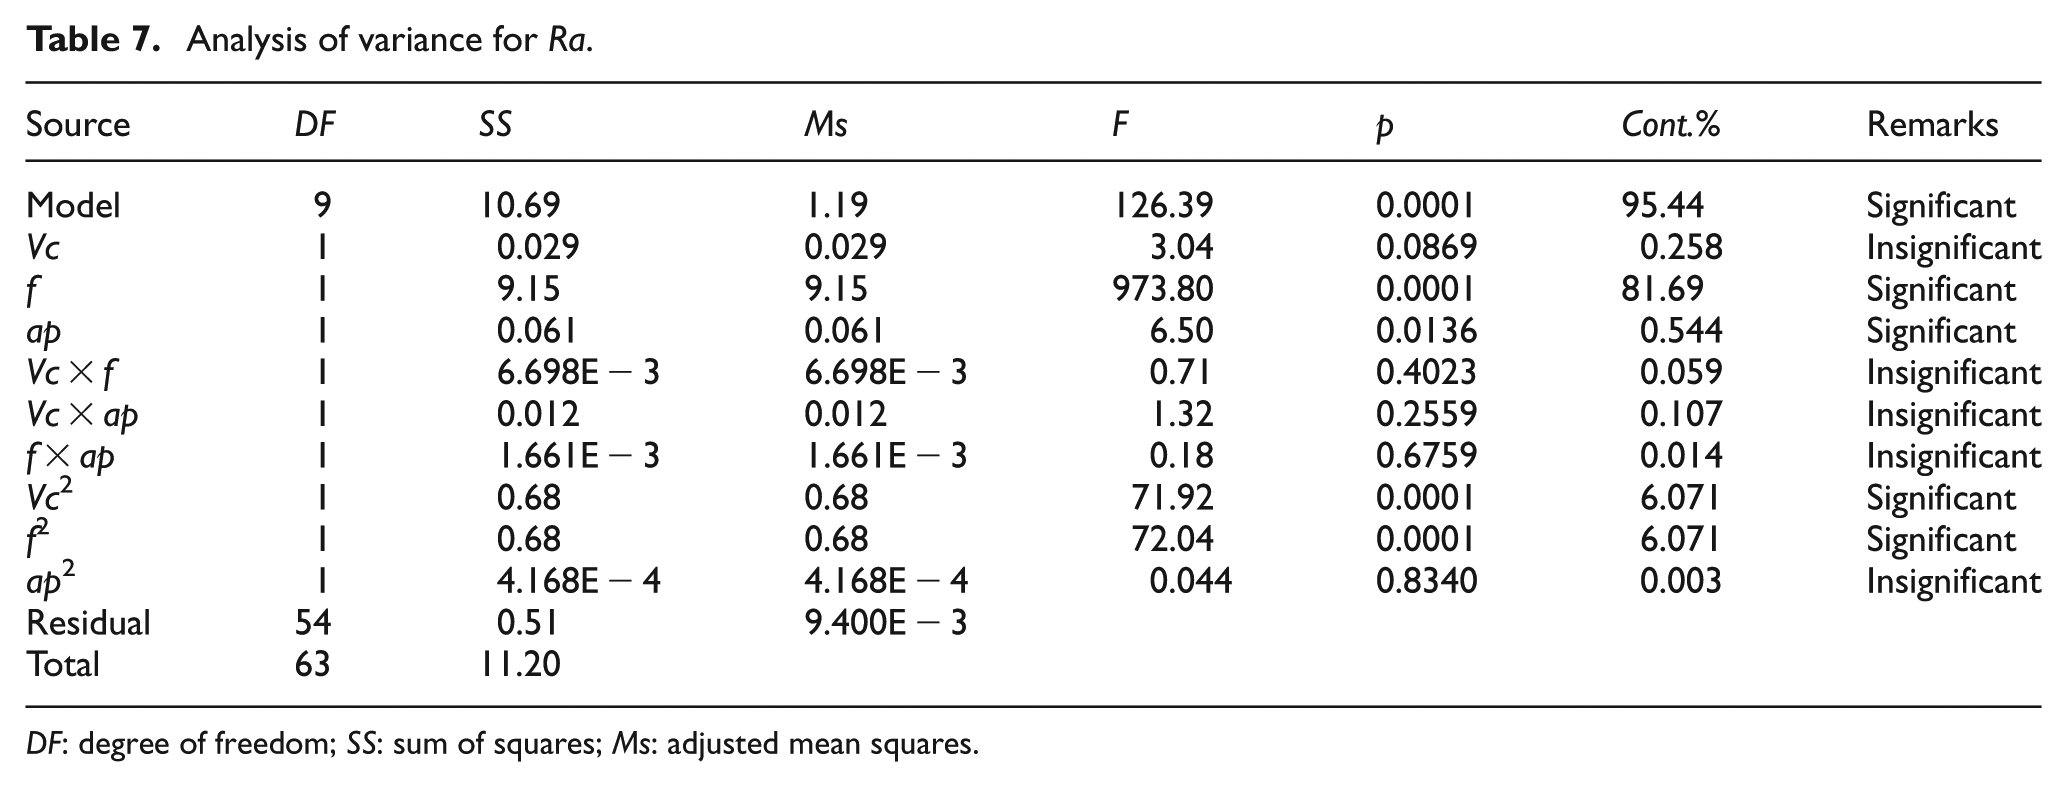
DF: degree of freedom; SS: sum of squares; Ms: adjusted mean squares.
Cutting parameters versus cutting force components
Table 4 shows that the depth of cut has the highest statistical significance (86.6%) followed by feed rate (4.92%), whereas cutting speed (0.26%) was found to be less significant on the feed force (Fx). The interaction (f × ap) and the product (f2) had less signification, while (Vc × f) and (Vc × ap) interactions were found to be mostly insignificant.
Table 5 presents ANOVA results for the thrust force (Fy). It can be stated that the depth of cut has the highest statistical significance (58.5%) followed by feed rate (29.57%). The interactions (Vc × ap, f × ap) and the products (f2, ap2) were found to be less significant while those of cutting speed and (Vc × f) are just insignificant.
When considering the tangential force (Fz), the results (Table 6) indicate that the depth of cut has the highest statistical significance (65.2%) followed by feed rate (24.6%). On the other hand, the interactions (f × ap) are less significant, while interactions involving cutting speed (i.e. Vc × f and Vc × ap) and products (Vc2, f2, ap2) were found to be insignificant.
It is observed that every rise in cutting force components is the result of increases in the depth of cut and/or feed rate. This is in good agreement with Hamdi et al. 20 when turning AISI H11 steel. When increasing feed rate, the section of the sheared chip increases too, and, as a result, the force required for material removal augments. Moreover, increasing the depth of cut results with a thicker metallic chip (i.e. larger deformed volume material) which requires greater cutting forces. It should be noted that when increasing (ap), the cut becomes outside of the tool nose radius limit, and the workpiece exerts a penetration resistance to the tool in both tangential and axial directions. This situation implies that the tool–work contact length has become sufficiently high and does not cut anymore with its nose radius as it should do.
Figure 2 shows the interaction effect of (cutting speed (Vc)–depth of cut (ap)) and (feed rate (f)–depth of cut (ap)) on the cutting force components (Fx, Fy and Fz). As observed from Figure 2(a), (c) and (e), the cutting speed has a negligible effect on the three components of cutting force; similar results were reported by Suresh et al. 21 when turning of AISI 4340 steel, using multilayer-coated carbide tool. While in Figure 2(b), (d) and (f), for a given feed rate, the cutting force components sharply increase with the increases in the depth of cut. For low feed rates, the cutting force components are highly sensitive to the depth of cut and for any augmentation of the latter; it abruptly increases the cutting force components. Accordingly, it is understood that the depth of cut is the most influential factor on cutting force components. In other words, the cutting force can be minimized by employing lower values of feed rate, depth of cut and cutting speed, while the highest values are found at the maximum feed rate and depth of cut.
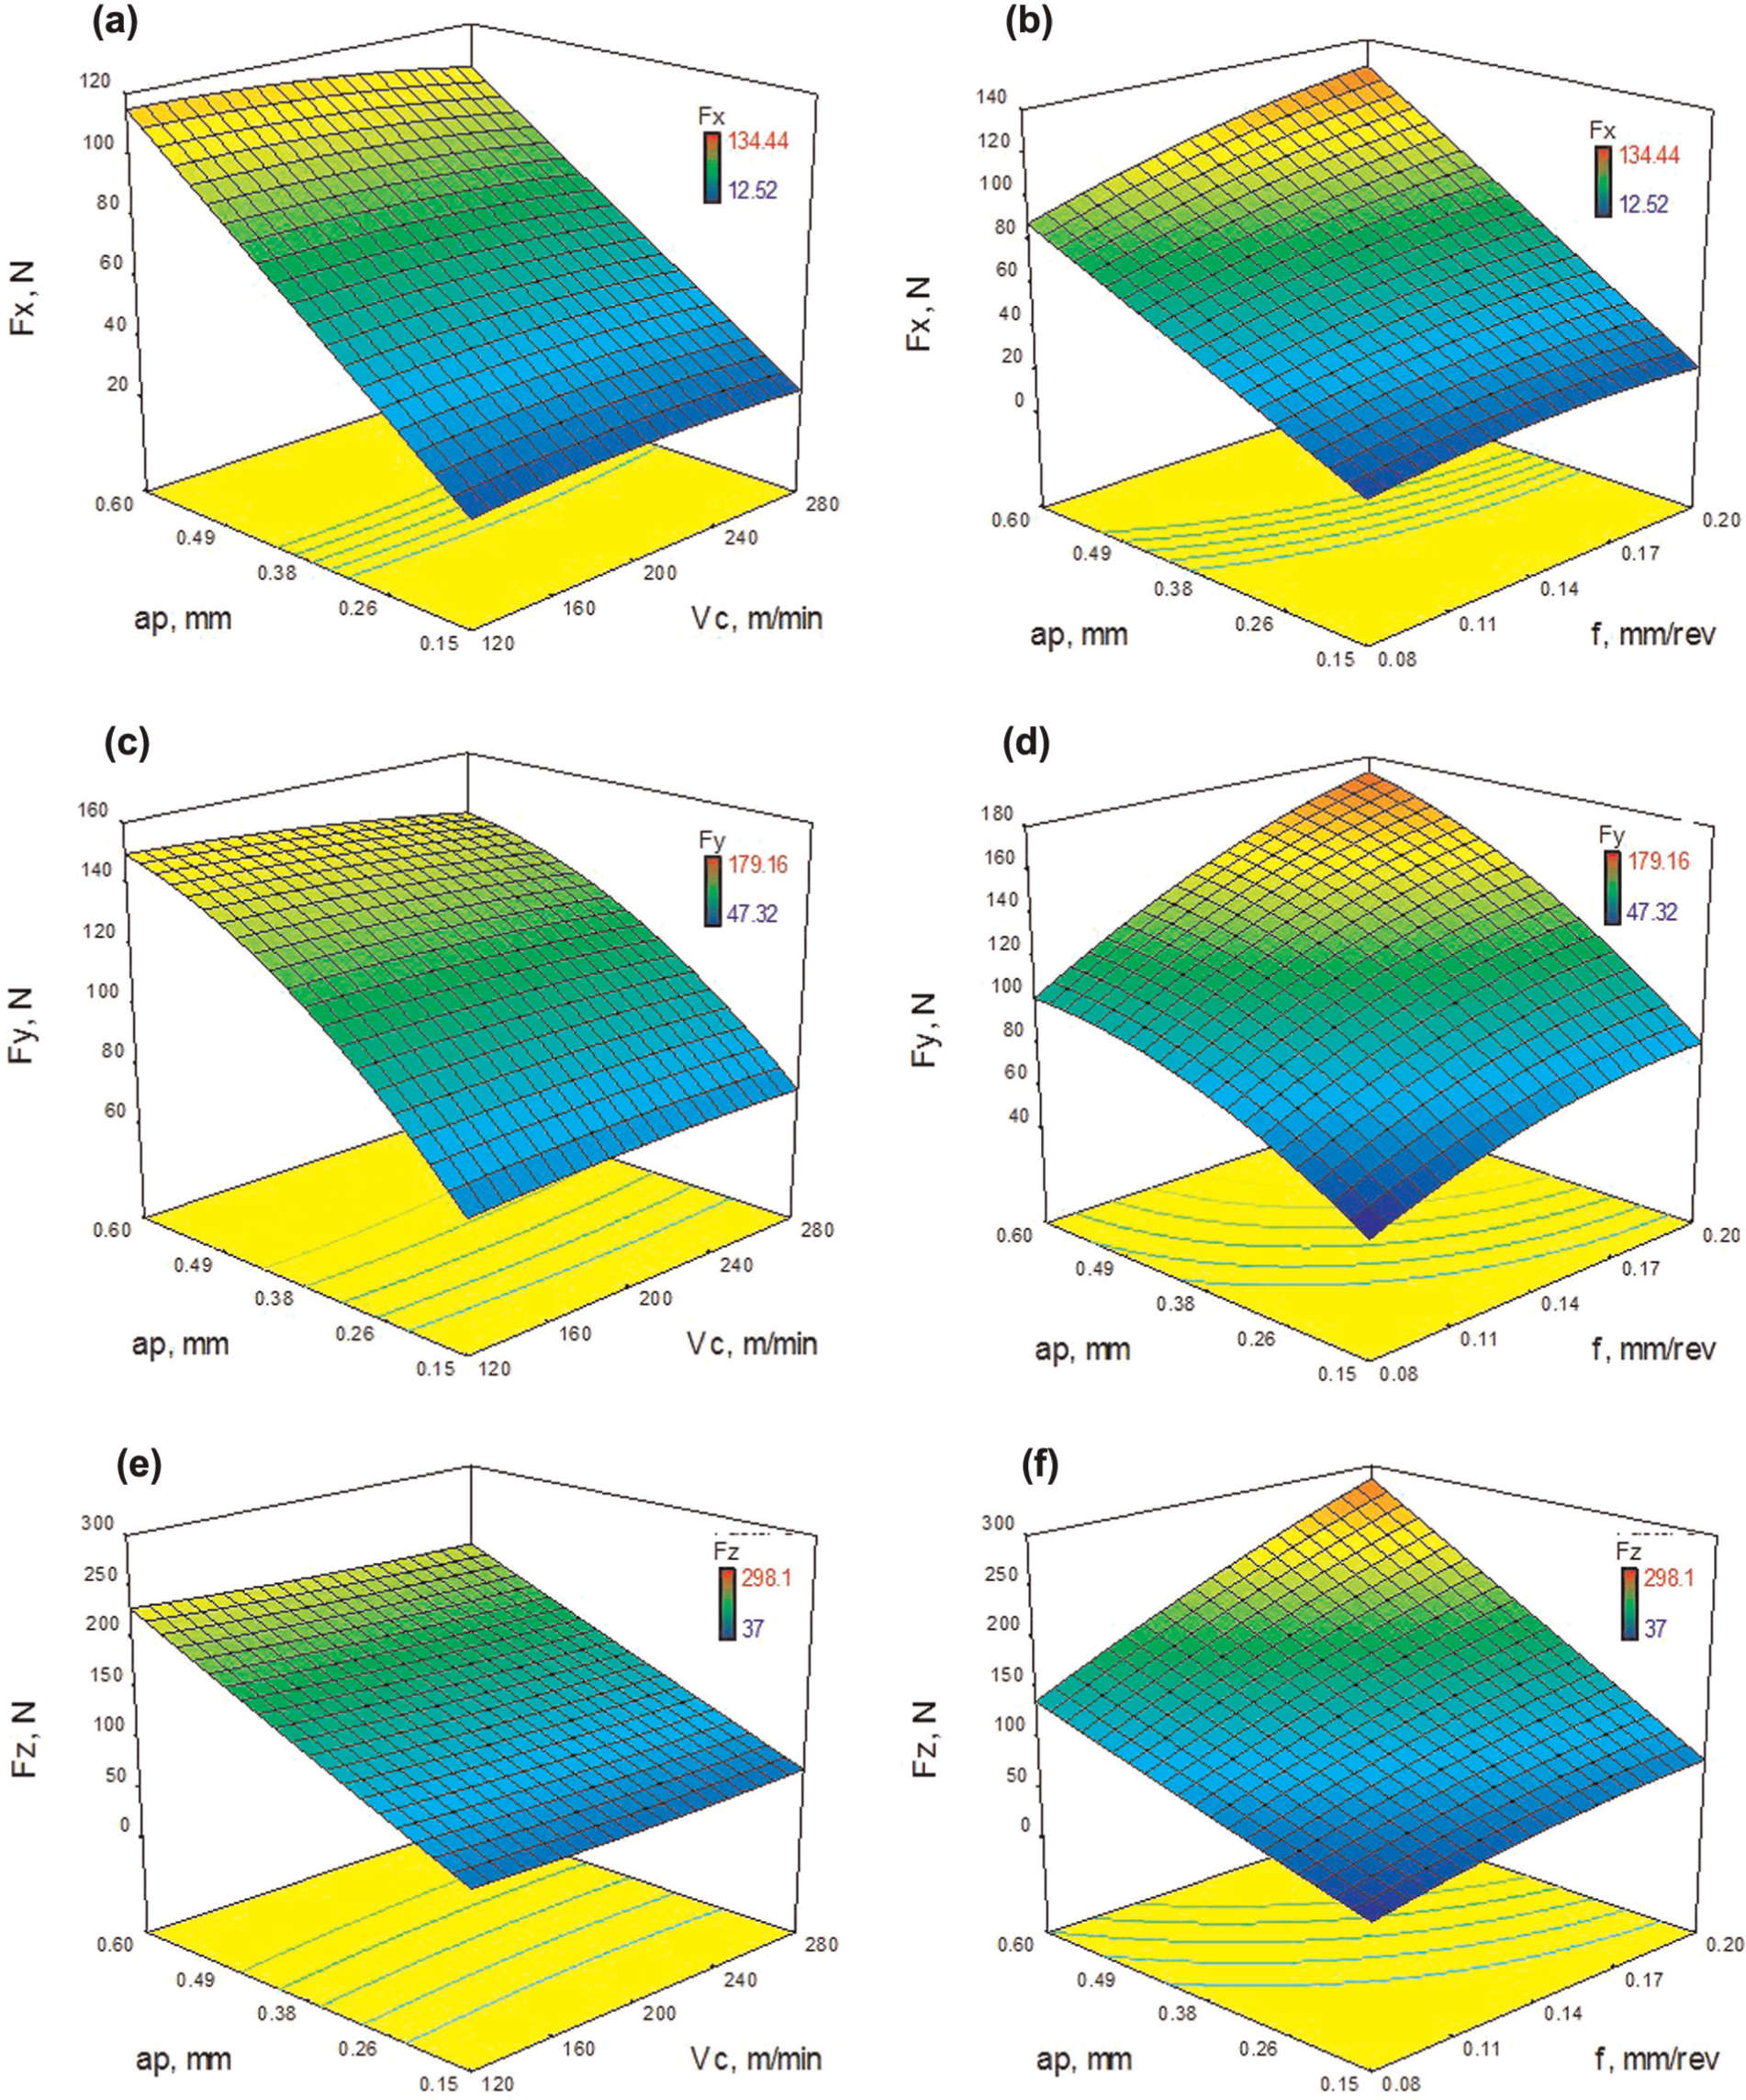
3D plots for cutting force components as a function of cutting parameters.
Cutting parameters versus surface roughness
Table 7 summarizes the interaction results for Ra. The most important factor affecting the quality of surface finish is the feed rate (f); similar results were reported by Bouacha et al., 18 Hamdi et al., 20 Yusuf and Riza 29 and Xavior and Adithan. 30 Its contribution is 81.69% in this type of models, and it is known that augmentation of (f) generates furrows in the form of helicoids imparted by tool shape and the system tool–workpiece movements. The furrows are deeper and broader as the feed rate increases. To visualize these furrows, a representative example of 3D image of turned surface is envisioned by means of isometric view (Figure 3). The effects of products (Vc2, f2) are significant with contribution values (6.07%, 6.07%), respectively. Cutting speed (Vc) has no significant effect, this is in disagreement with the published research work of Ibrahim, 7 when turning of AISI 304 and AISI 316 austenitic stainless steels using two different grades of cemented carbide cutting tools. The results proved that cutting speed has a significant effect on the machined surface roughness values. Both depth of cut (ap) and (Vc × f) and (Vc × ap) interactions remain insignificant.
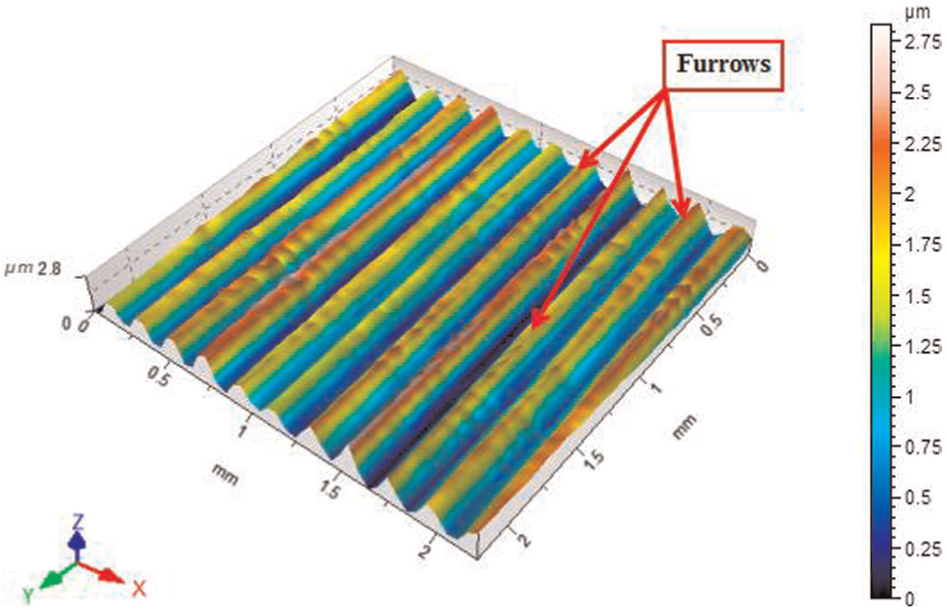
3D surface topography for (Ra): Vc = 120 m/min, f = 0.2 mm/rev and ap = 0.15 mm.
The amount of heat generation increases with increase in feed rate, as the cutting tool has to remove more volume of material from the workpiece. The workpiece plastic deformation is usually proportional to the amount of generated heat and promotes roughness on the surface finish.31,32 Because of the increased length of contact between the tool and the workpiece, the depth of cut has a much smaller effect compared to that of the feed rate.
As deduced from the interaction plot of Figure 4, it can be observed that the surface roughness (Ra) rapidly increases with increasing feed rate. However, cutting speed and the depth of cut have weak influence on surface roughness. It should be noted that the minimal surface roughness occurred for the combination of three low values of the parameters (f, ap and Vc).
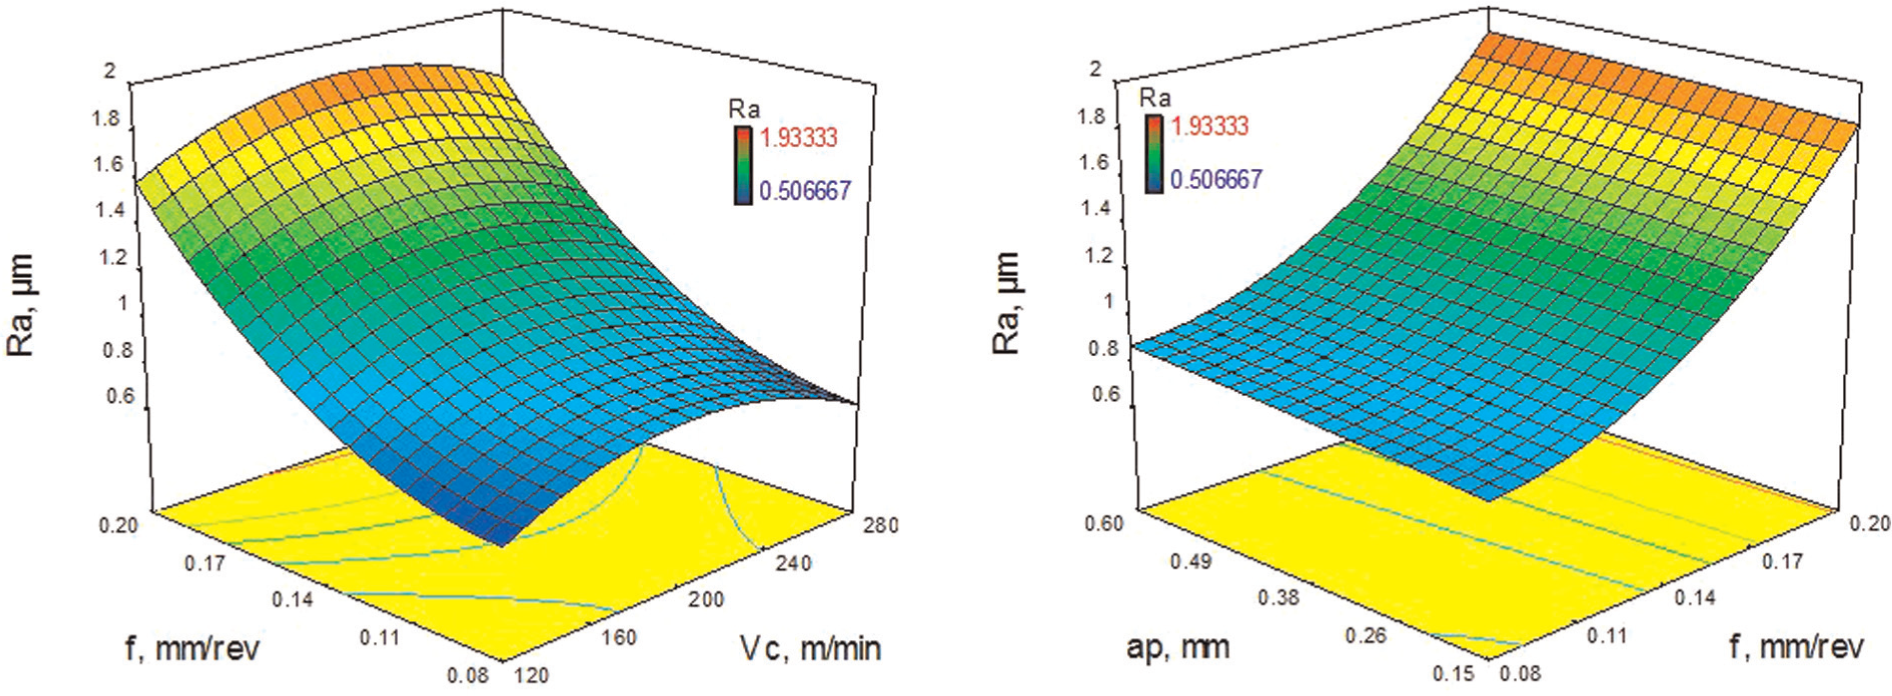
3D plots for surface roughness (Ra).
Based on these results, feed rate is found to be the most significant factor on surface roughness evolution for this kind of steel. This is in good agreement with previously published research work.8,11,33
The graphs of main effects and interactions are presented in Figure 5. It is concluded that the depth of cut (ap) strongly affects cutting force components (Fx, Fy and Fz) followed by feed rate (f) (Figure 5a, b and c). As expected, the depth of cut (ap) has an increasing effect on cutting force components, while the cutting speed has a very weak significance effect on cutting force components. The interaction (f × ap) has significance on the three components of cutting force, whereas the interactions (Vc × f and Vc × ap) have no significant effect. For surface roughness (Figure 5d), the variation in the depth of cut did not imply any significant changes. The interactions (Vc × f, Vc × ap and f × ap) have no significant effect.
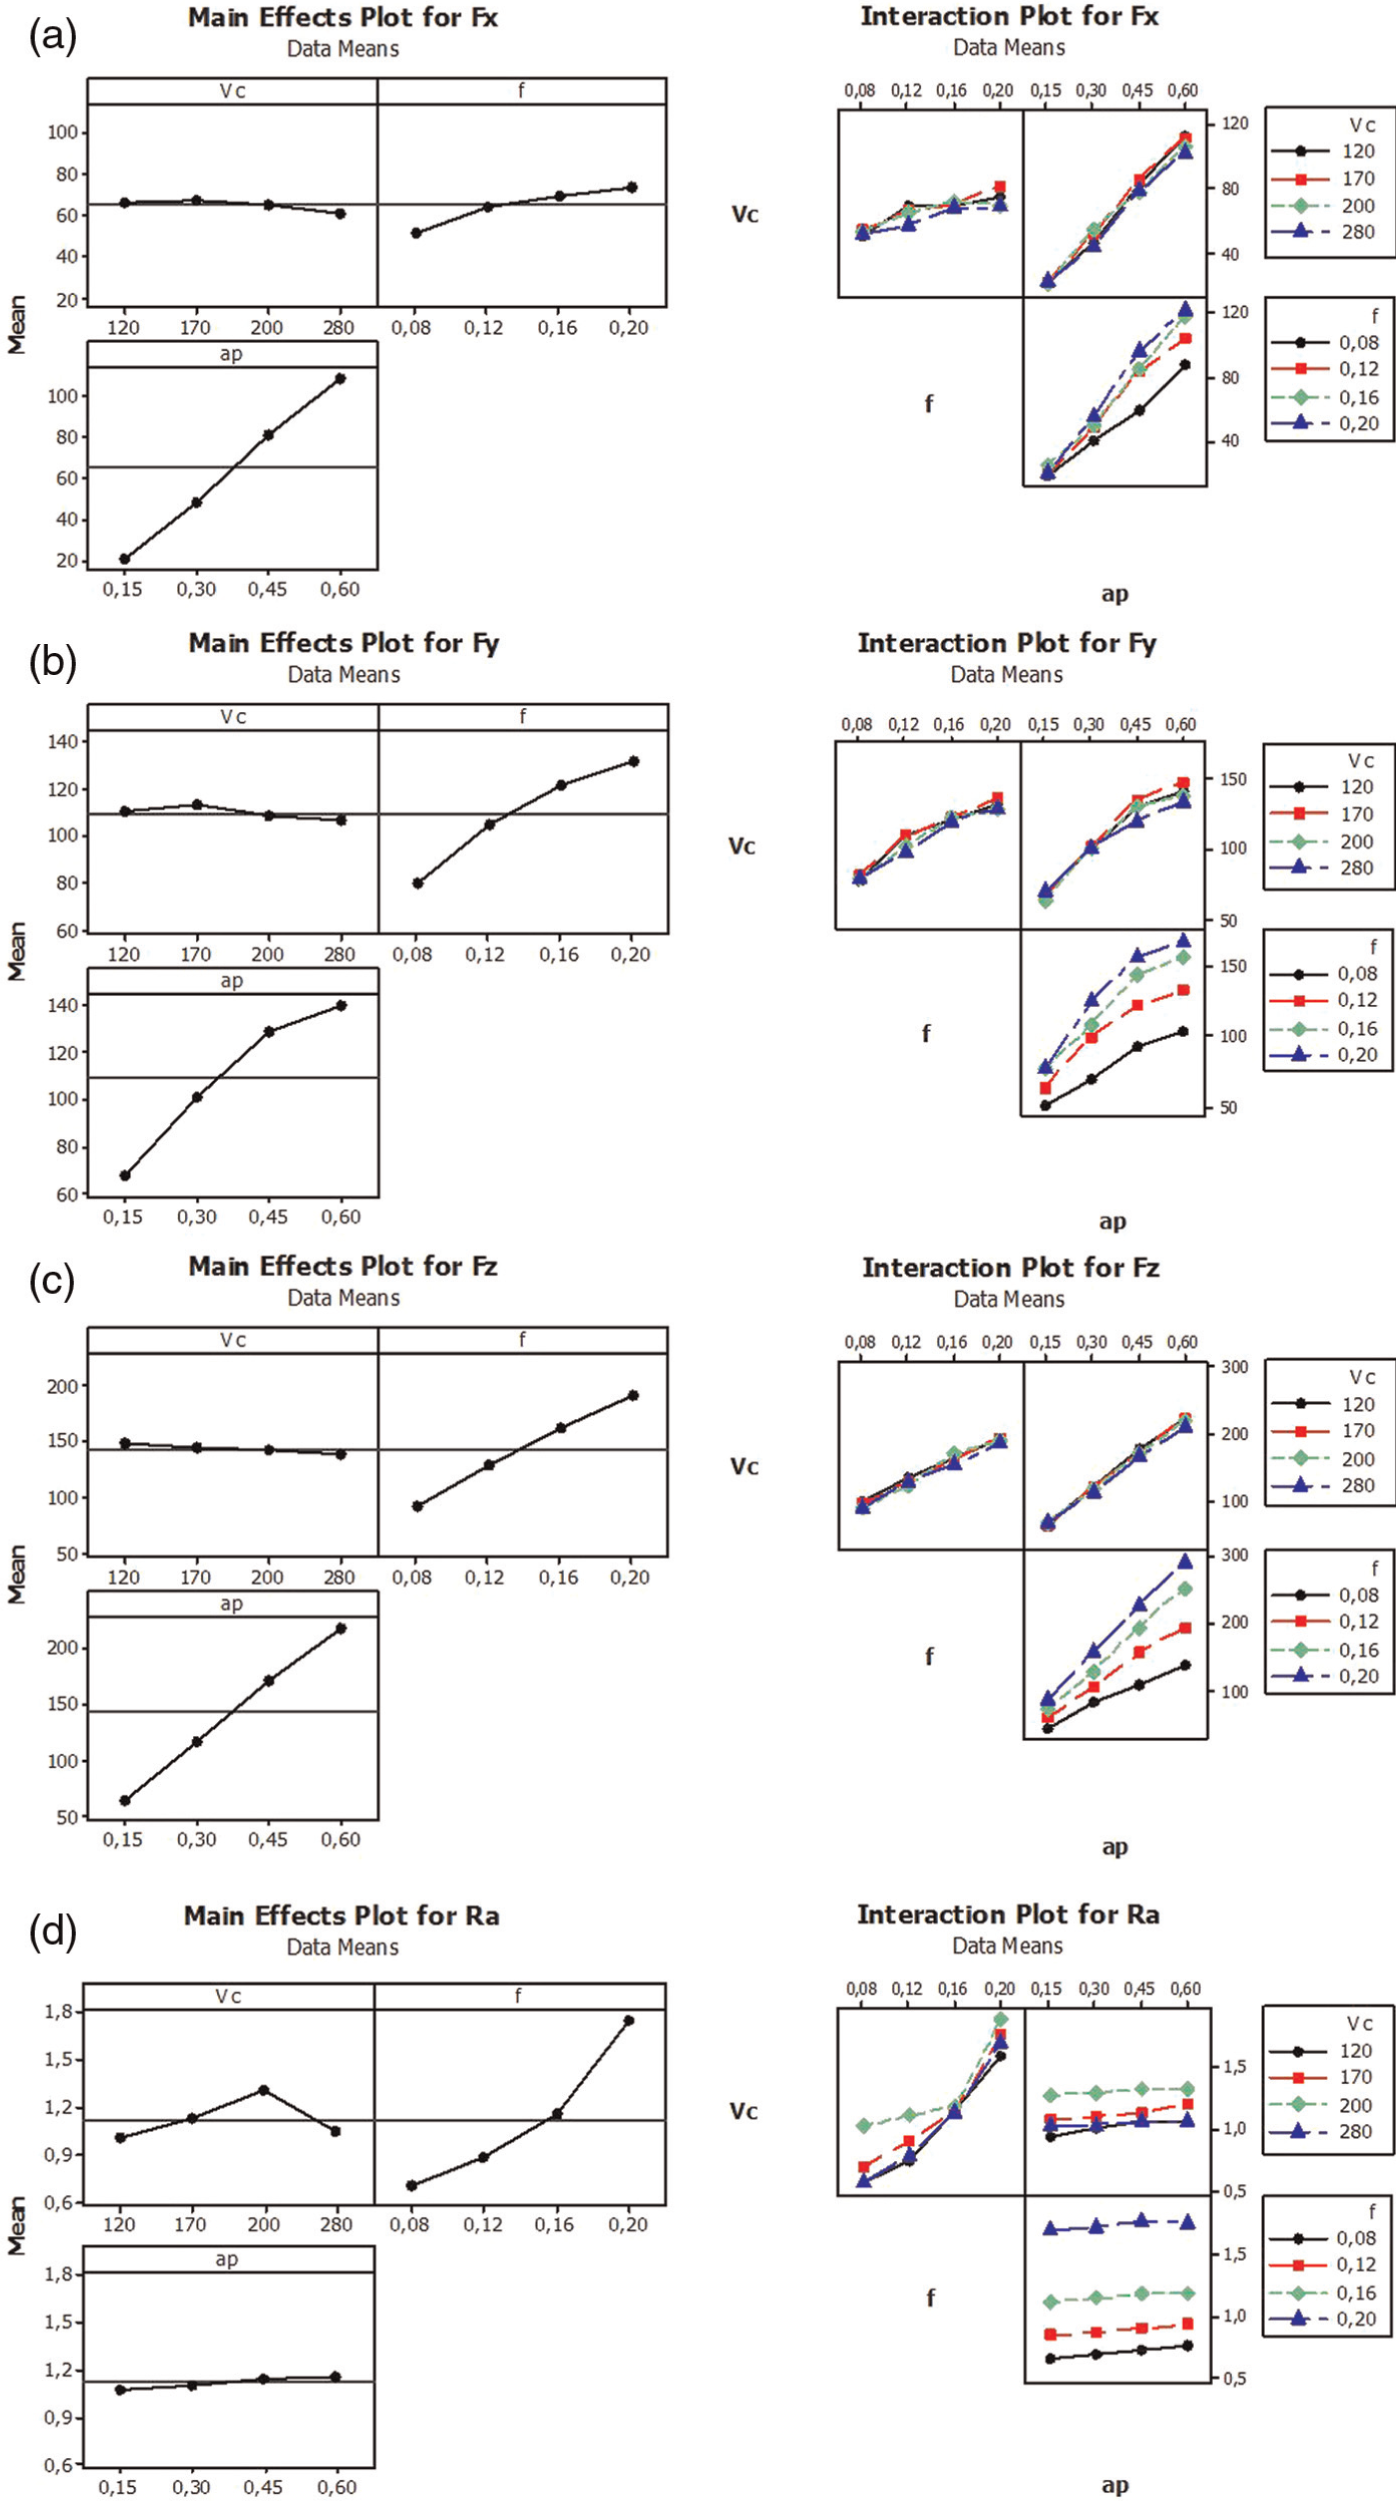
Graphs of main effects and interactions for Fx (a), Fy (b), Fz (c) and Ra (d).
Regression equations
The relationship between input parameters and performance measurements (outputs) is modeled by quadratic regression. The regression equations are obtained together with determination coefficients (R2). The feed force model (Fx) is given by equation (8)
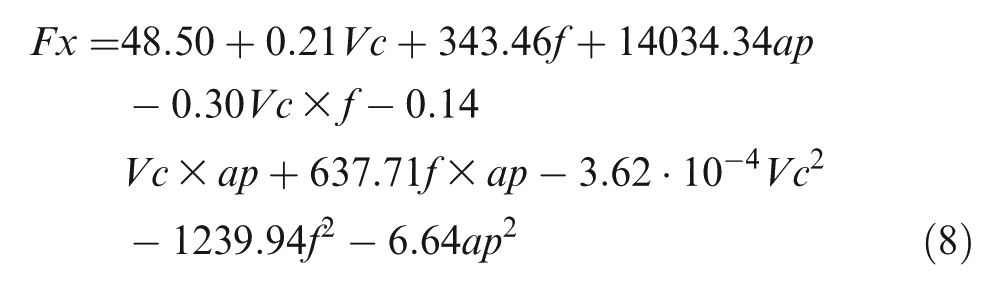
(R2 = 97.02%)
The thrust force model (Fy) is given by equation (9)
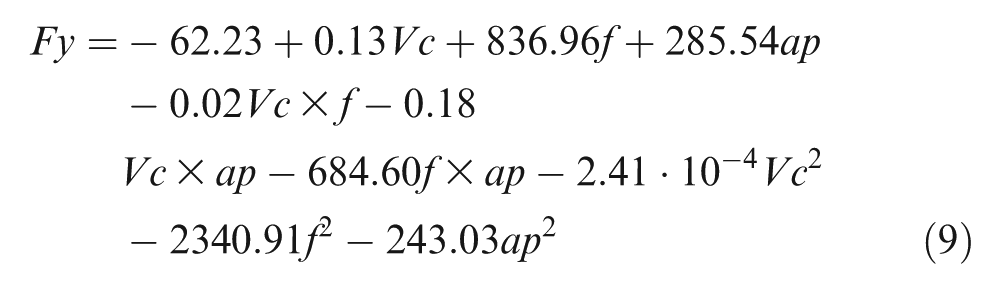
(R2 = 96.74%)
The tangential force model (Fz) is given by equation (10)
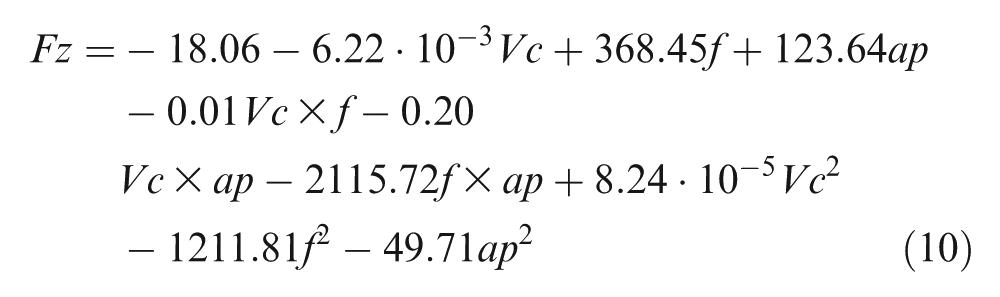
(R2 = 99.21%)
The arithmetic mean roughness (Ra) model is given below in equation (11)
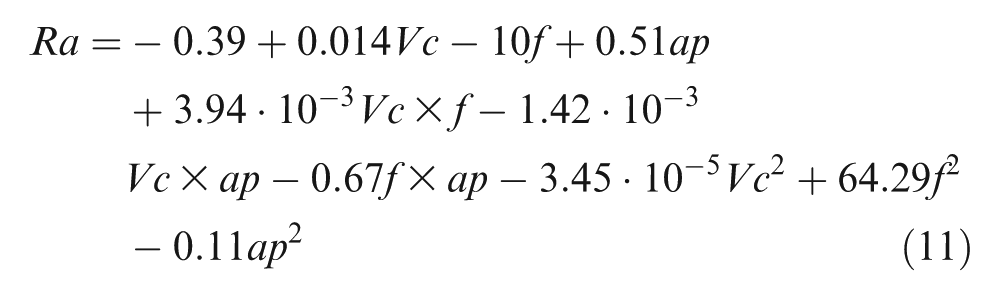
(R2 = 95. 47%)
Models are reduced by eliminating terms with no significant effect on the responses, and they are given by equations (12)–(15)
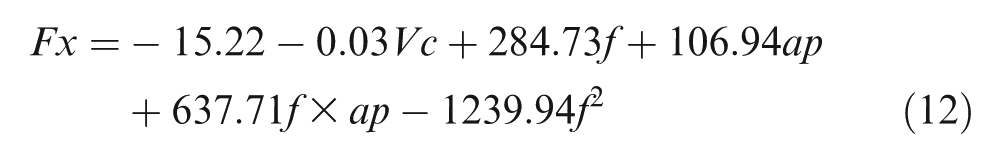
(R2 = 96.7%)
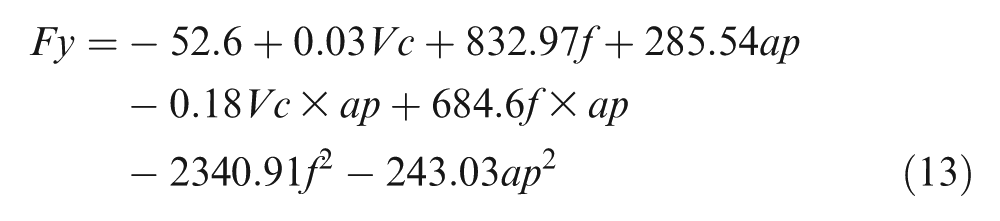
(R2 = 96%)

(R2 = 99.02%)
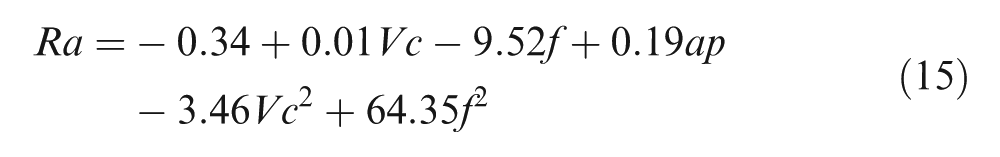
(R2 = 95.27%)
The diagnostic checking of the model has been carried out by the examination of the residuals. They represent the differences between the respective observed and predicted responses. Residual analysis of data is presented in Figures 6 and 7. The normal probability plots of Fx, Fy, Fz and Ra are depicted in Figure 6(a)–(d). The figures revealed that the residuals fall on a straight line implying that the errors are normally distributed. Figure 7(a)–(d) show the residuals with respect to the 64 experimental runs of Fx, Fy, Fz and Ra. The residuals do not show any obvious pattern and are distributed in both positive and negative directions. This implies that the model is adequate and there is no reason to suspect any violation of the independence or the constant variance assumption.
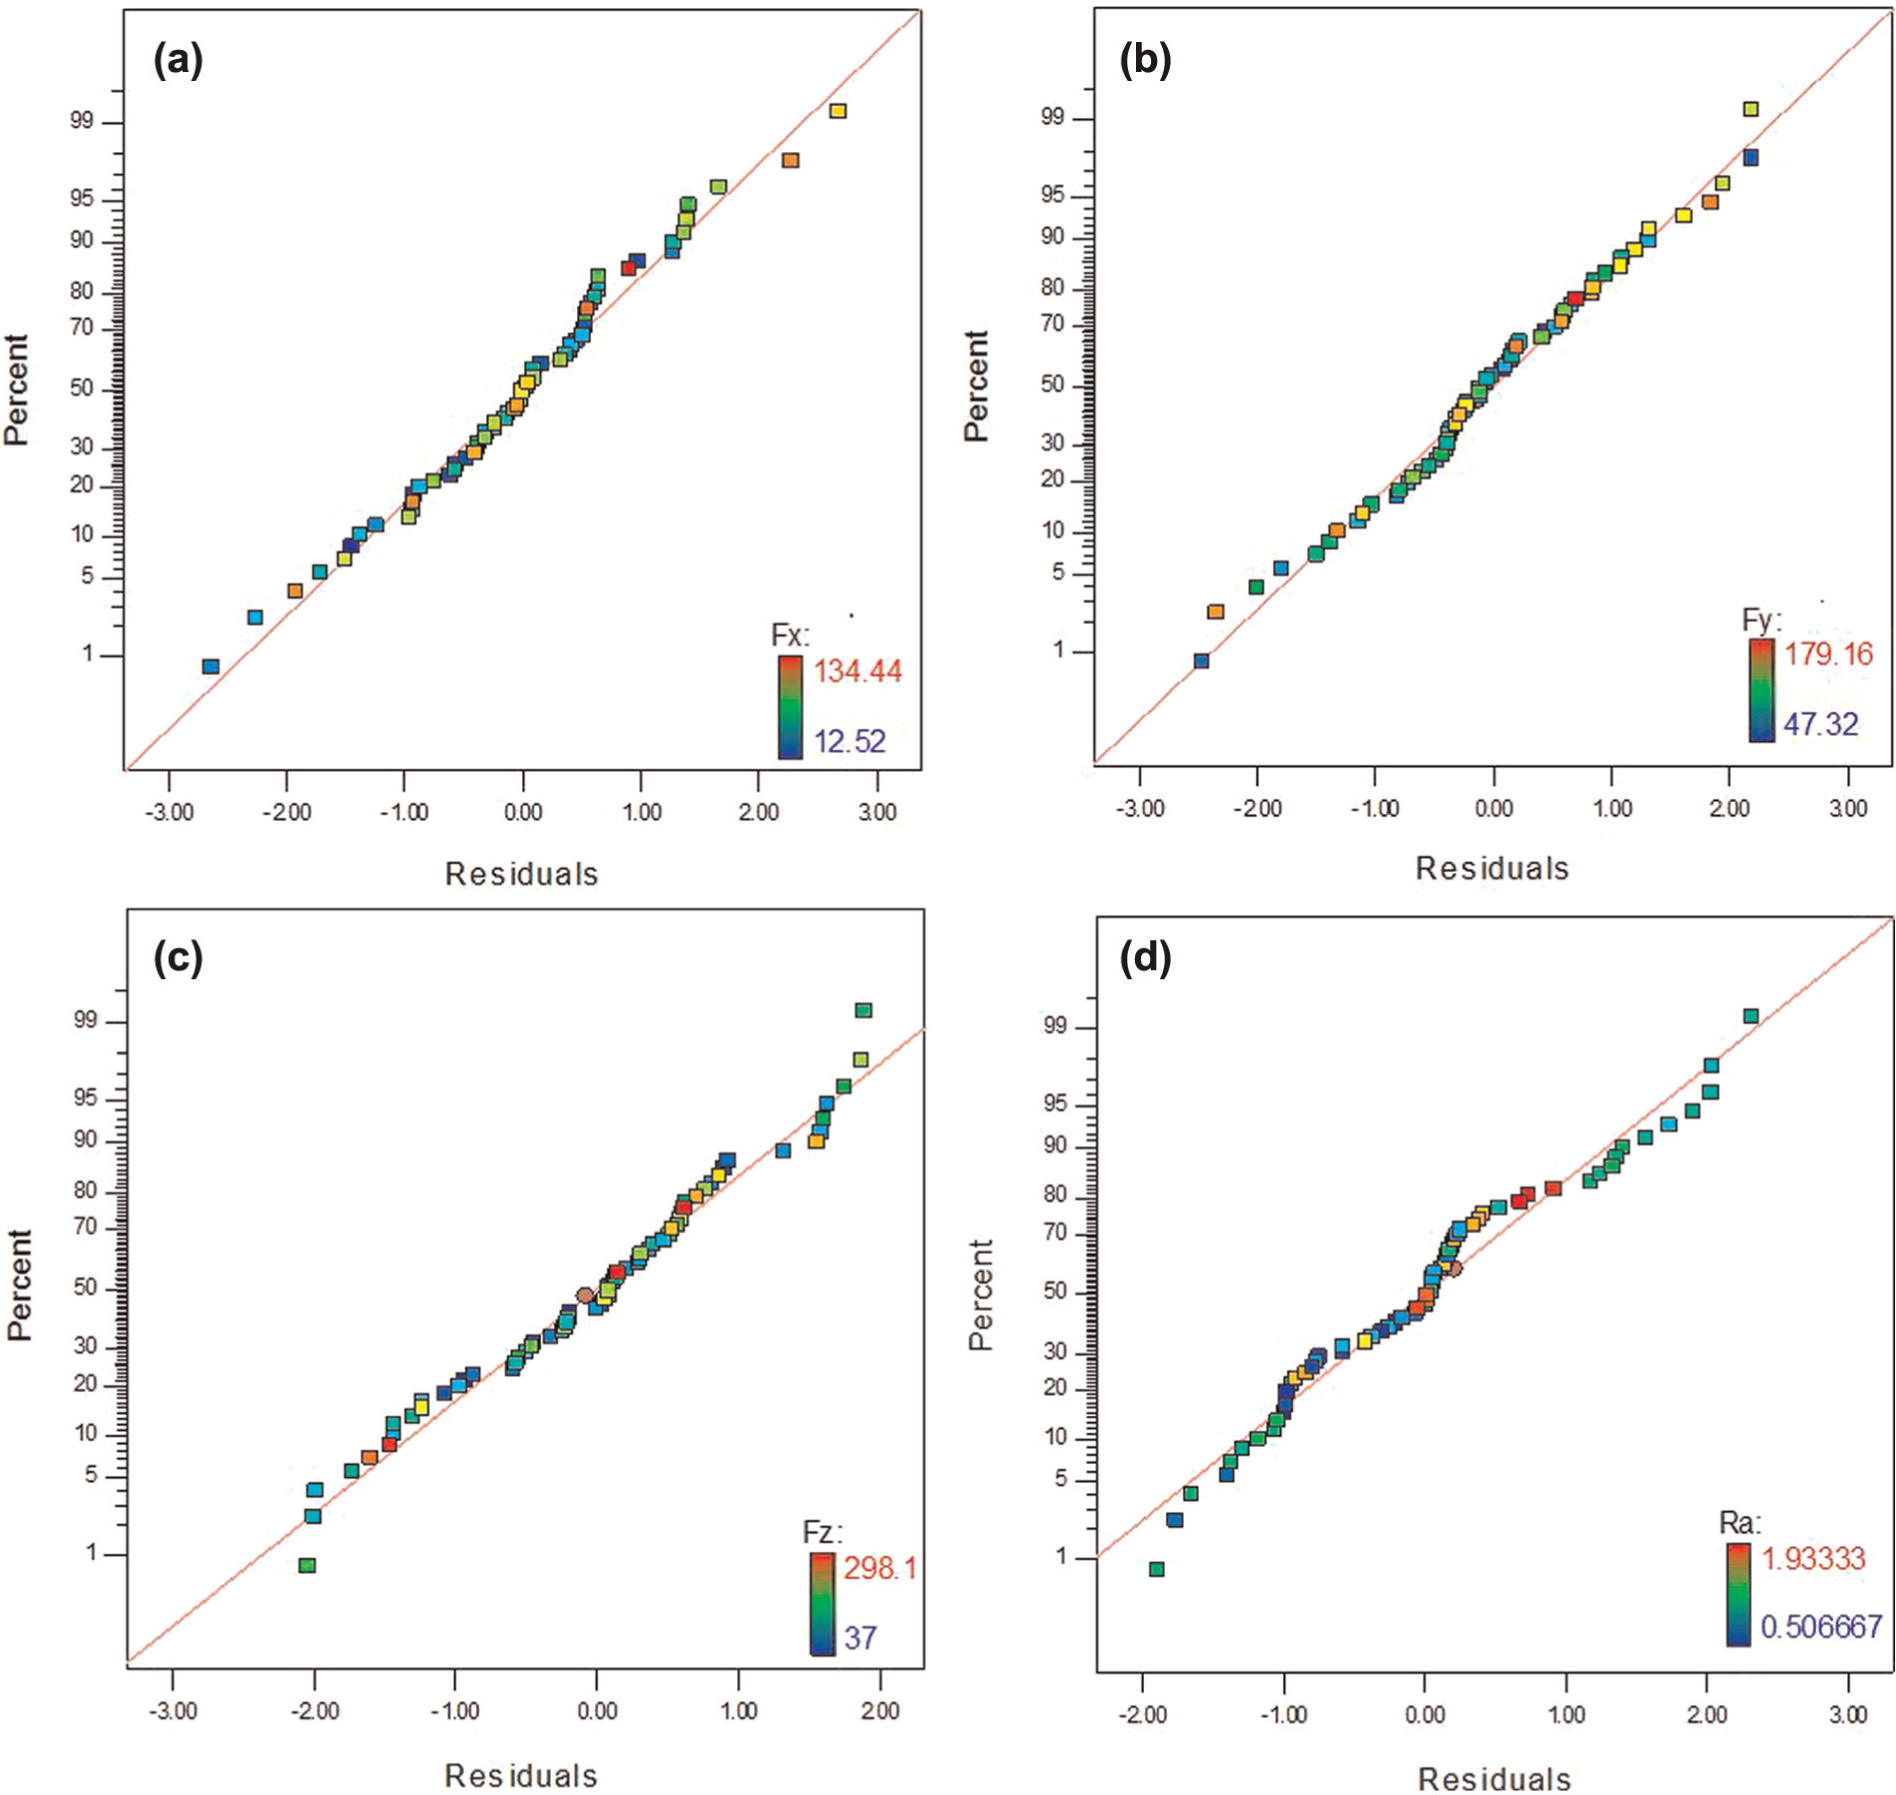
Normal probability of residuals for (a) Fx, (b) Fy, (c) Fz and (d) Ra data.
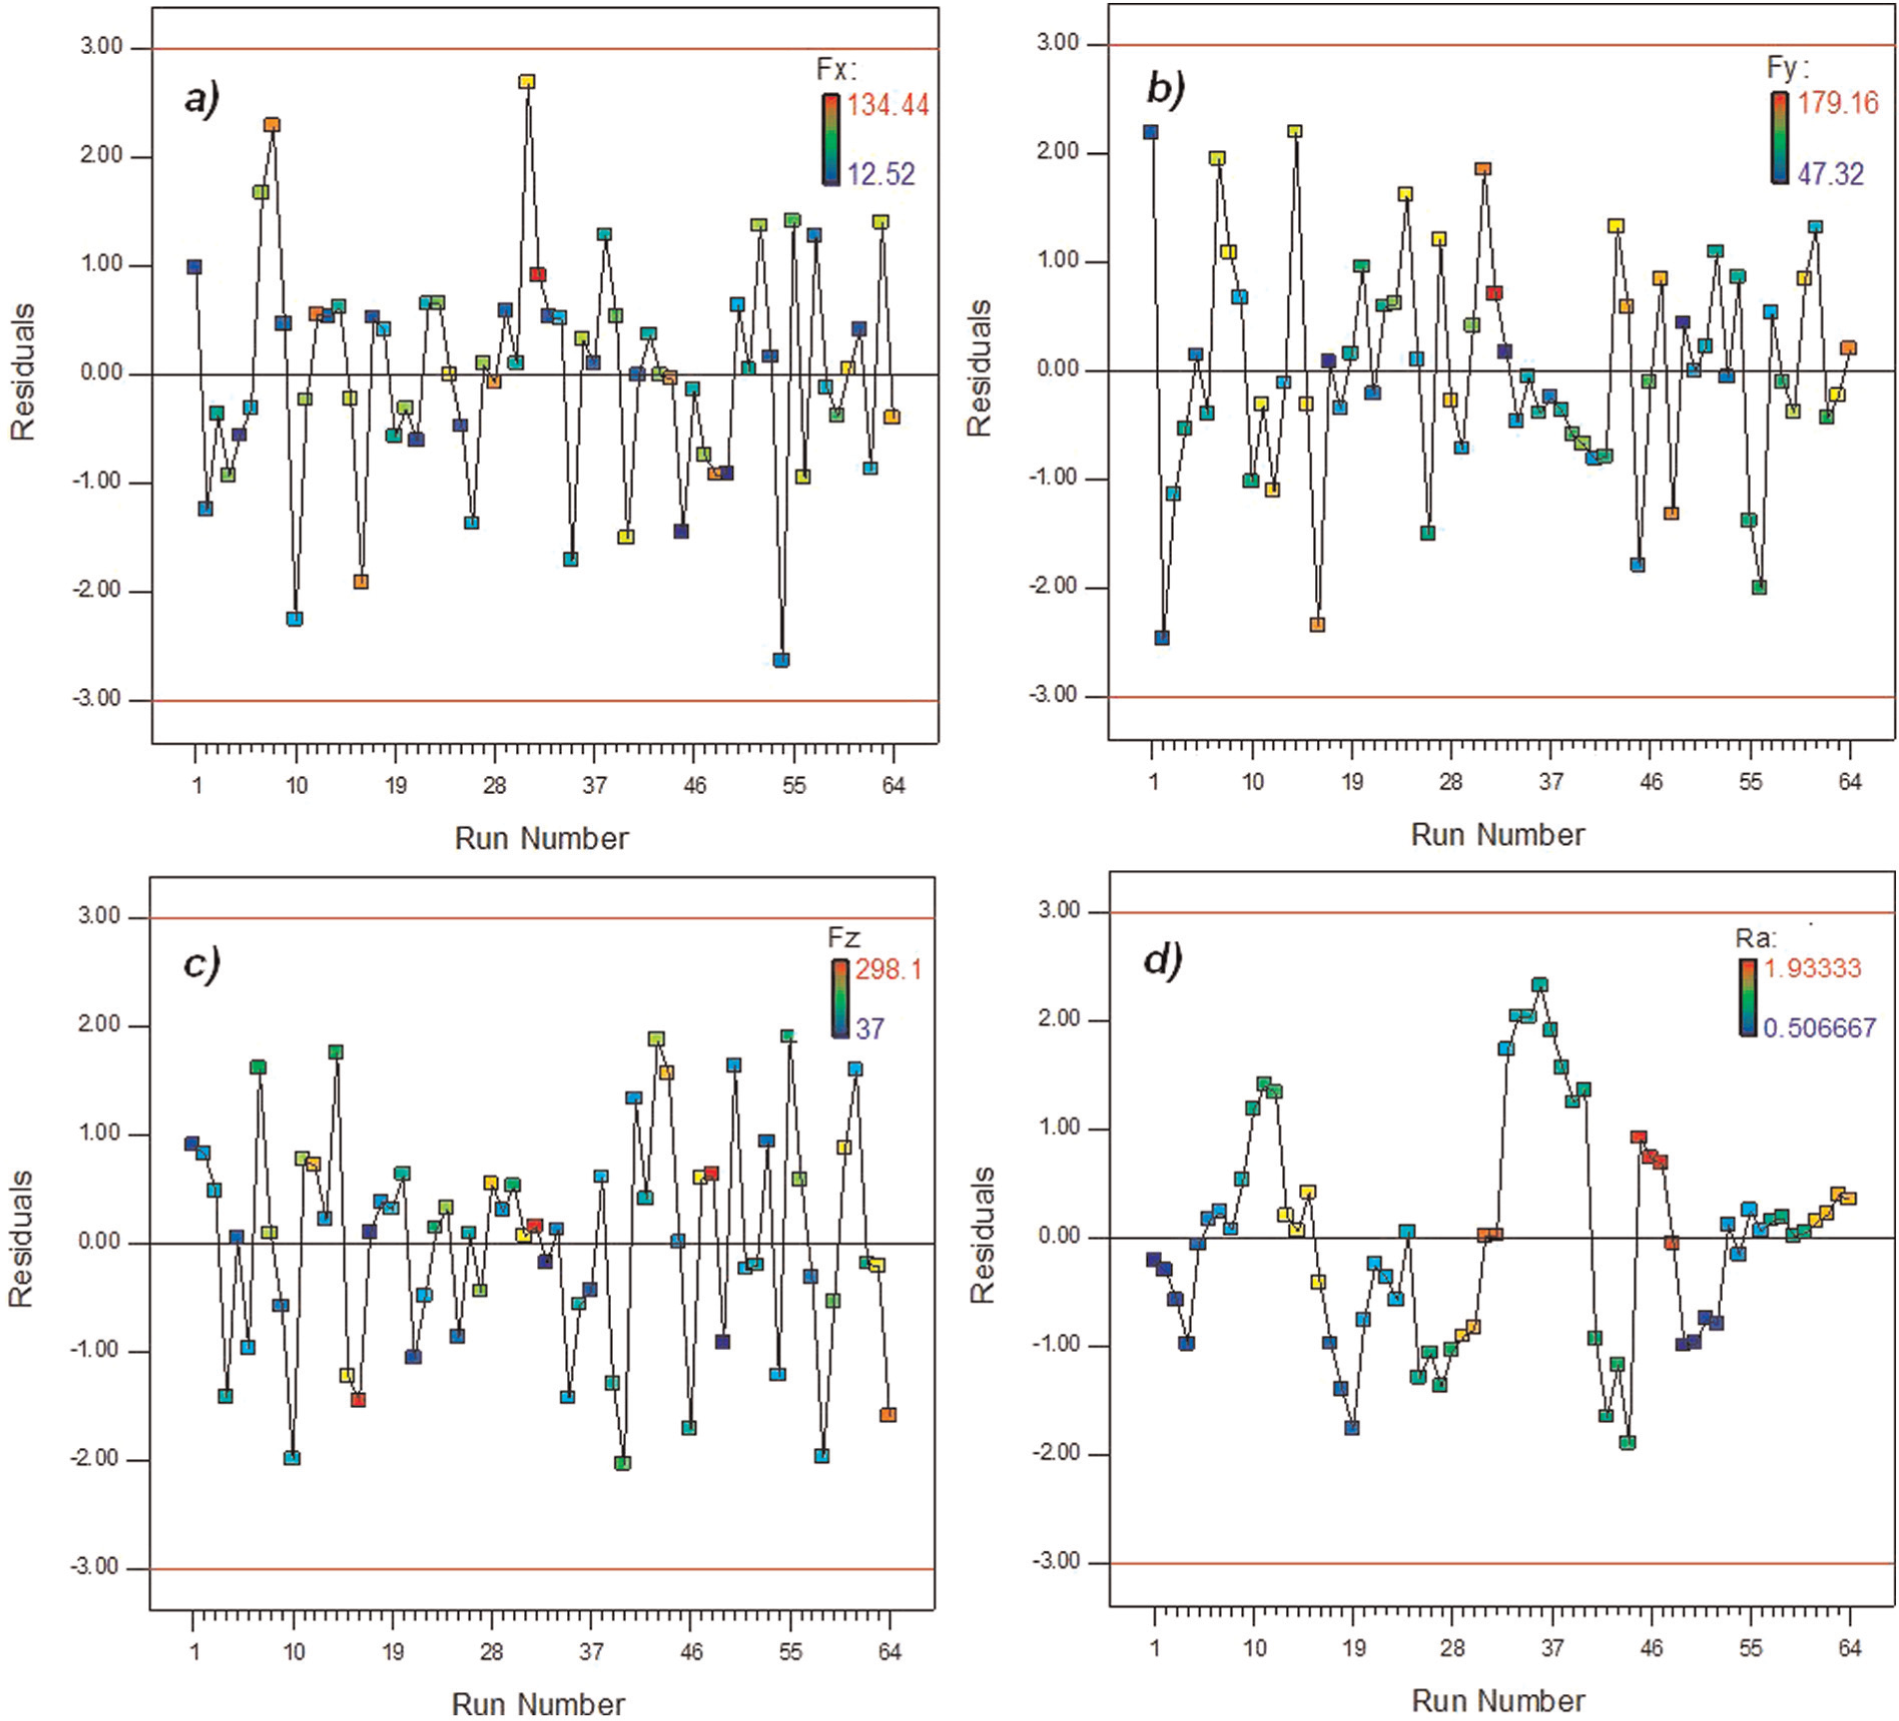
Plot of residuals versus run numbers for (a) Fx, (b) Fy, (c) Fz and (d) Ra data.
The adequacies of the developed equations were checked by ANOVA technique. The models are adequate as F-calculated values 195.51, 177.84, 185.12 and 126.39 to Fx, Fy, Fz and Ra, respectively, are greater than F-table value at 95% confidence level. R2 is a coefficient of multiple determinations, which measures variation proportion in the set of data points. 34 In this study, R2 values are very close to 1 suggesting a reasonable goodness of the model which can be used for prediction within the limits of the factors investigated. Figures 8 and 9 show the comparison between the predicted and measured values of cutting force components (Fx, Fy and Fz) and surface roughness (Ra). It is concluded that the results of the comparison prove that predicted values of the cutting force component and surface roughness are very close to those experimentally recorded.
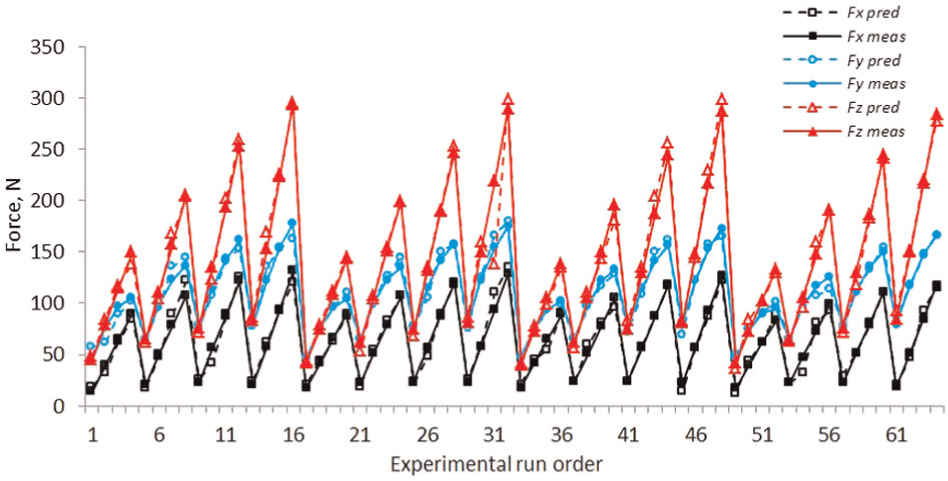
Comparison between predicted and measured values for the cutting force components.
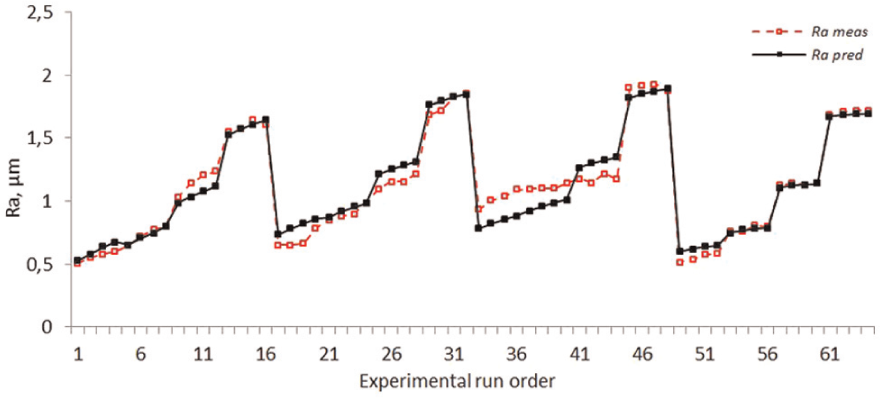
Comparison between the predicted and measured values for the surface roughness (Ra).
Confirmation tests
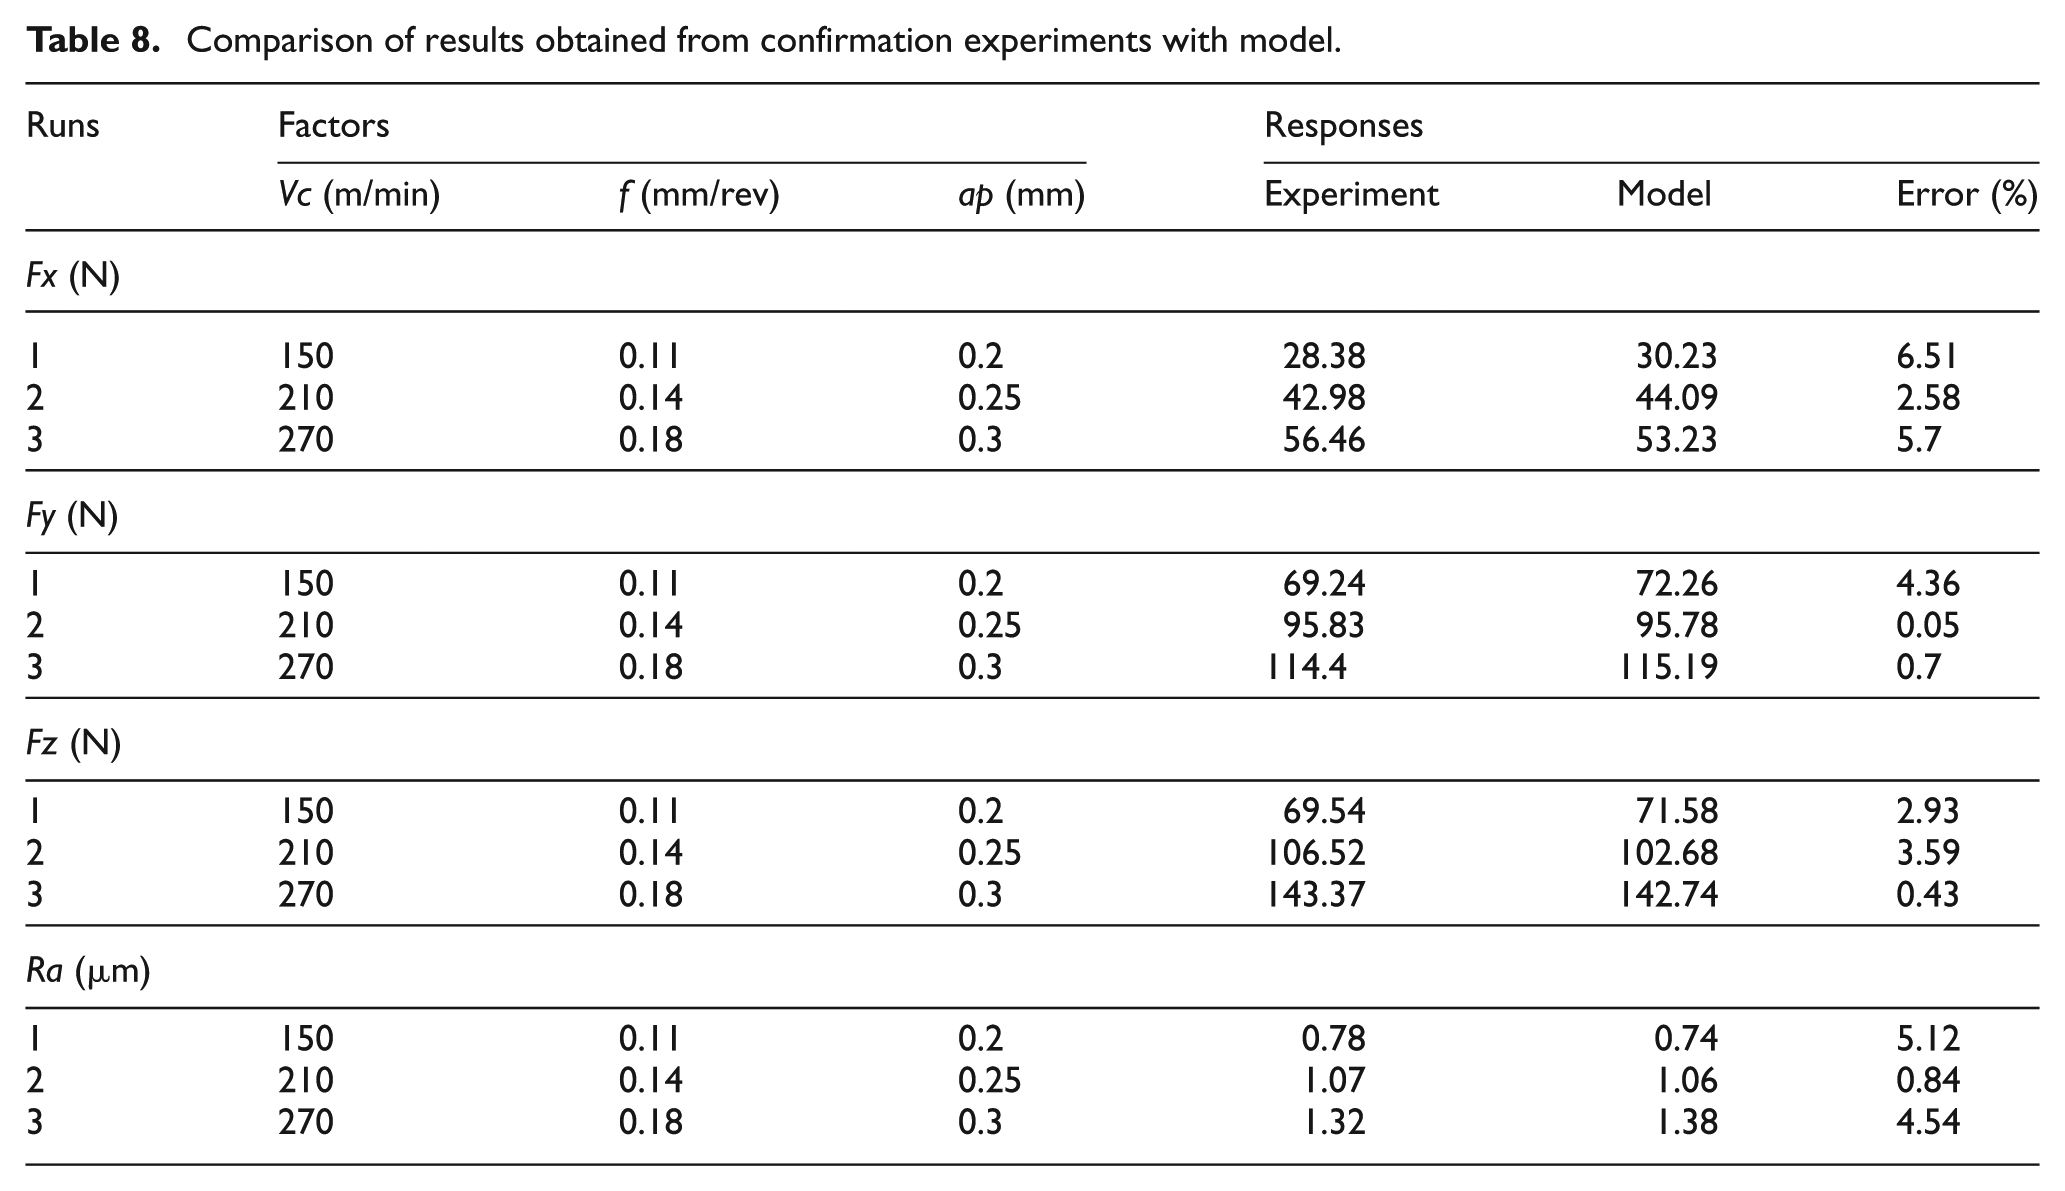
In order to verify the adequacy of the model developed, three new trials were performed; the test conditions for the confirmation test were chosen so that they are within the range of the levels defined previously. The predicted values and the associated experimental values are compared. The error percentage is within permissible limits (Table 8). Therefore, the obtained response equation through RSM can be used to successfully forecast the cutting force components and surface roughness values for any combination of the cutting speed, feed rate and depth of cut within the range of the performed experimentation. Based on the analysis of results in Table 8, it can be observed that the calculated error for the three components of cutting force (Fx (maximum value 6.51% and minimum 2.58%), Fy (maximum value 4.36% and minimum 0.05%) and Fz (maximum value 3.59% and minimum 0.43%)) and surface roughness (Ra (maximum value 5.12% and minimum 0.84%)) is relatively low.
Comparison of results obtained from confirmation experiments with model.
Optimization of responses
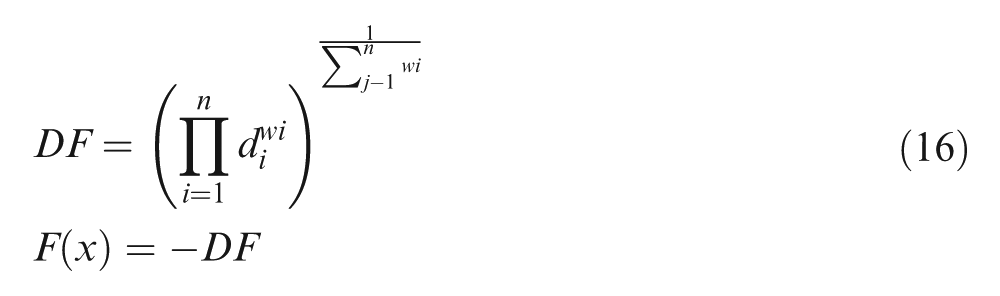
According to Mohamed et al., 35 desirability function approach has been used for multiple response factors’ (Fx, Fy, Fz and Ra) optimization. The optimization module searches for a combination of factor levels that simultaneously satisfy the requirements placed on each of the responses and factors in an attempt to establish the appropriate model. During the optimization process, the aim is to find the optimal values of machining parameters in order to produce the lowest cutting force components (Fx, Fy and Fz) and lowest surface roughness (Ra). To resolve this type of parameter design problem, an objective function, F(x), is defined as follows 36
where di is the desirability defined for the ith targeted output and wi is the weighting of di. For various goals of each targeted output, the desirability di can be defined in different forms. If the goal is to reach a specific value of Ti, the desirability di is written as
In the case of searching for a maximum, the desirability is rewritten as follows
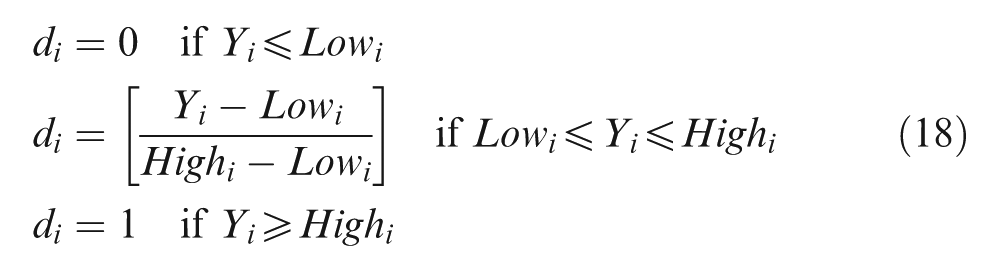
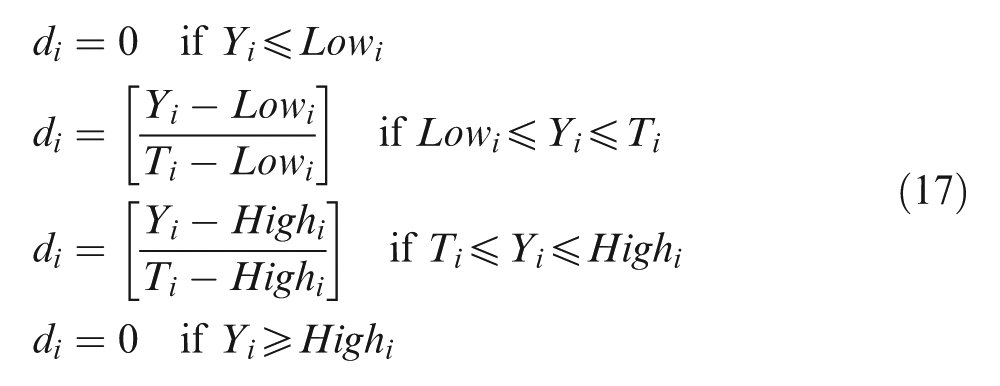
In the case of searching for a minimum, the desirability can be defined by the following equations
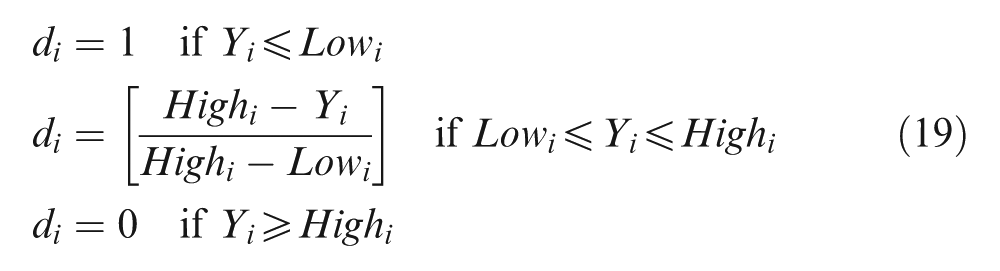
where Yi is the found value of the ith output during optimization processes and Lowi and Highi are the minimum and the maximum values of the experimental data for the ith output, respectively. In equation (16), wi is set to 1 since the di is equally important in this study. The DF is a combined desirability function, 36 and the objective is to choose an optimal setting that maximizes a combined desirability function DF, that is, minimizes F(x).
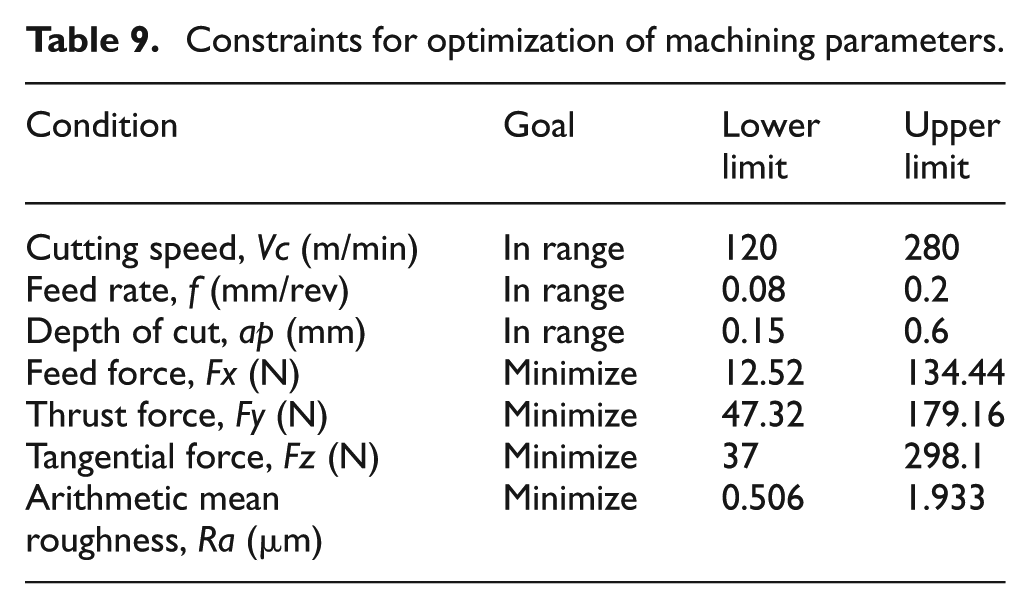
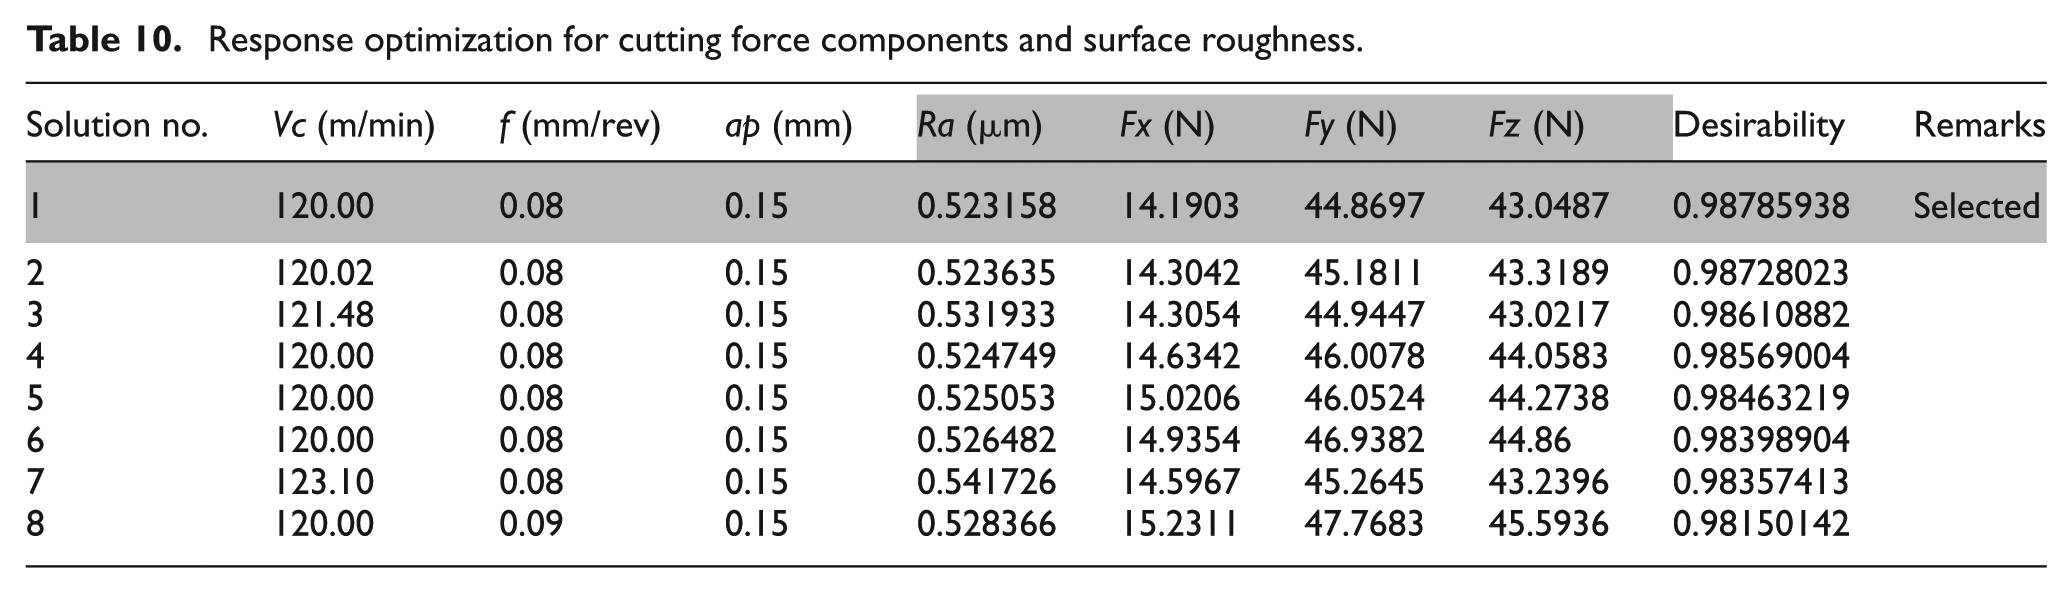
The constraints used during the optimization process are summarized in Table 9. The optimal solutions are reported in Table 10 in order to decrease the desirability level. Figure 10 and Table 10 show the optimization results. Values of optimal cutting parameters are found to be as follows: Vc = 120 m/min, f = 0.08 mm/rev and ap = 0.15 mm. The optimized cutting force components are as follows: Fx = 14.190 N, Fy = 44.869 N, Fz = 43.048 N and Ra = 0.52 µm. Figure 11 presents the bar graph of desirability for the cutting conditions and the responses together with a combined desirability = 0.9878.
Constraints for optimization of machining parameters.
Response optimization for cutting force components and surface roughness.
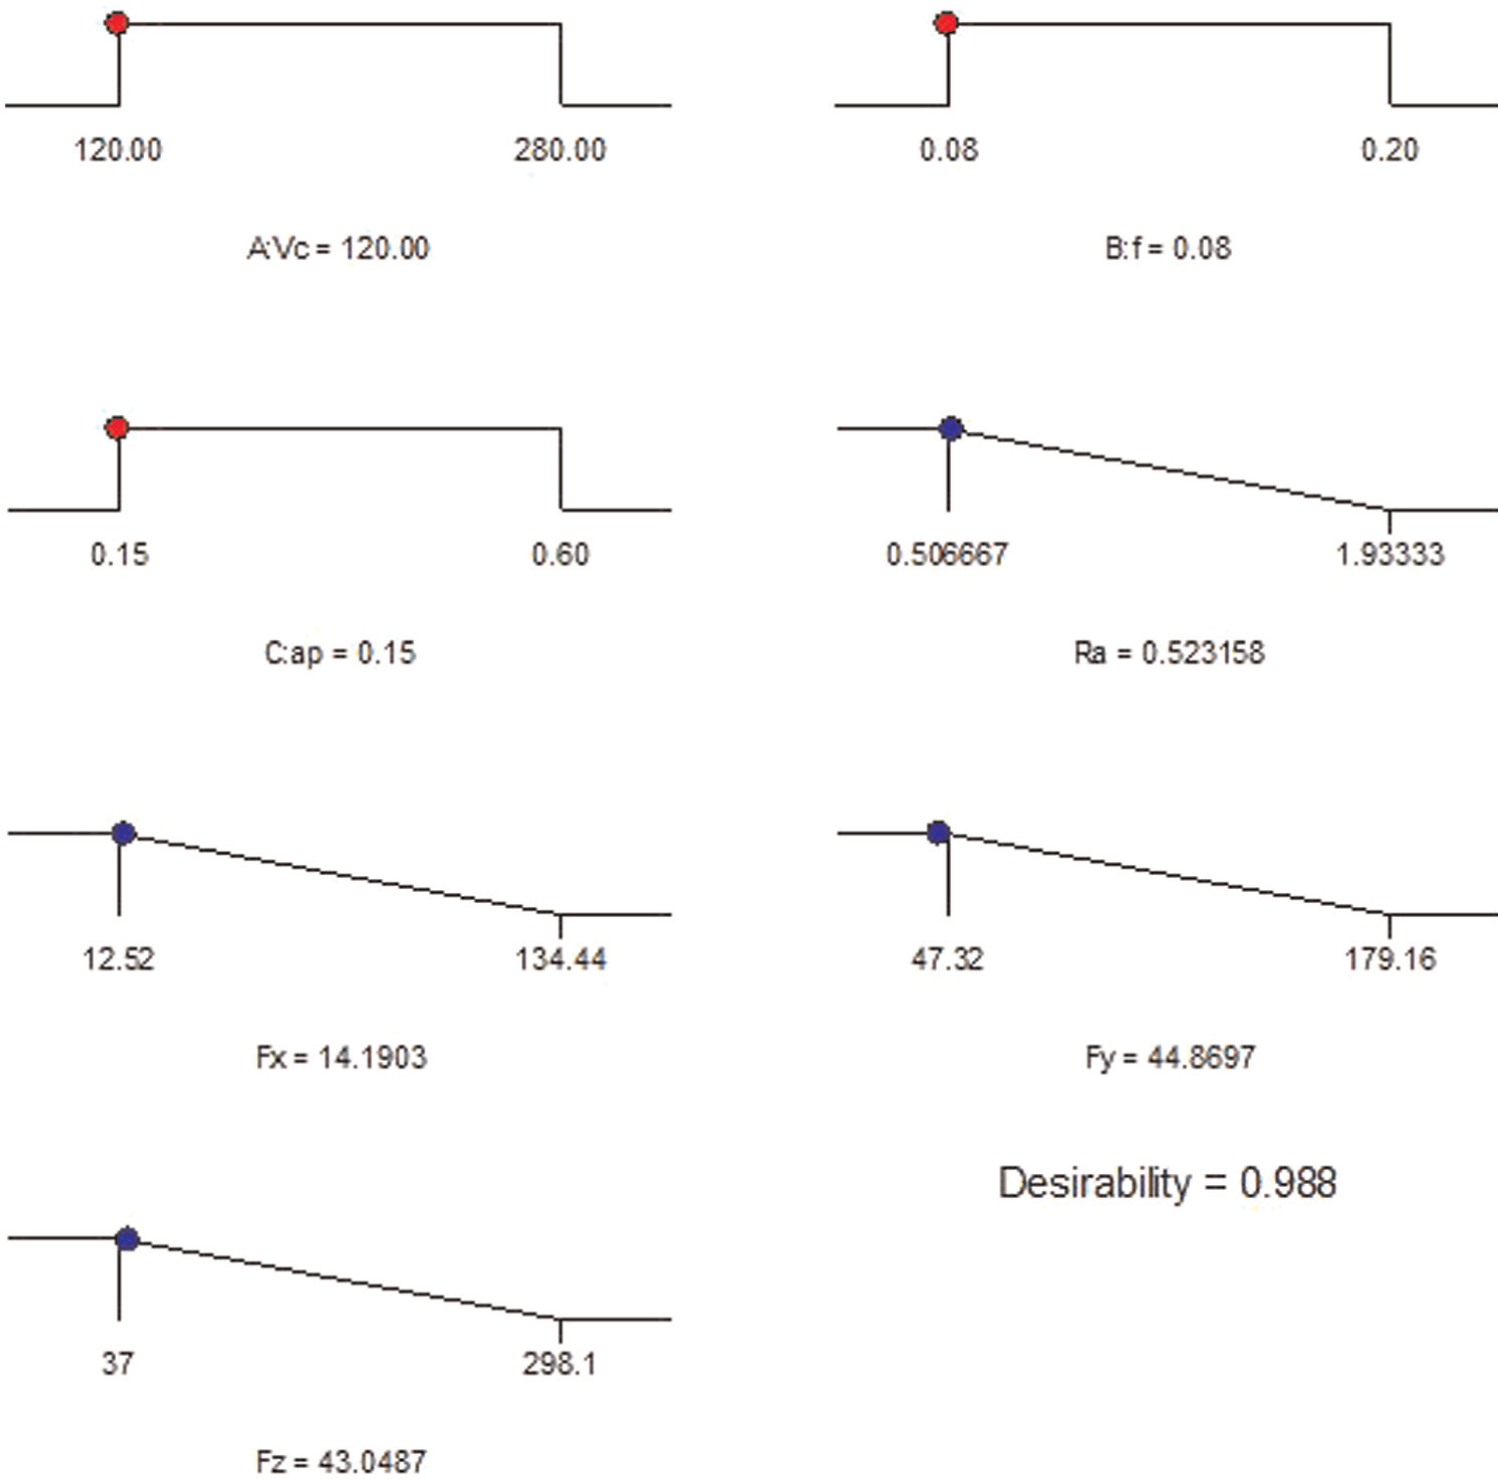
Ramp function graph for cutting force components and surface roughness.
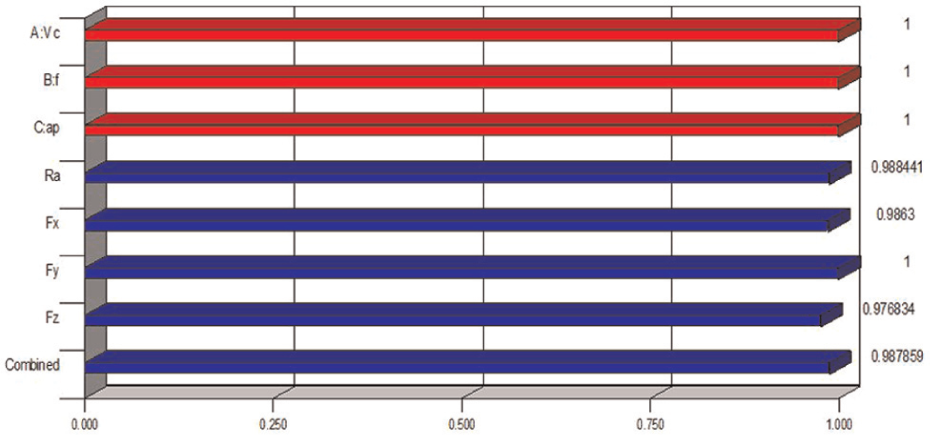
3D bar graph of desirability.
Conclusion
In this study, the RSM method is used to investigate and subsequently optimize the machining of AISI 420 martensitic stainless steel. The work is based on establishing the effects of cutting parameters on the cutting force components and workpiece surface quality. The foremost conclusions that can be drawn are as follows:
The ANOVA of the machining data has confirmed that the depth of cut (ap) has highest influence on the machining force to perform the machining operation (Fx: 86.6%, Fy: 58.5% and Fz: 65.2%). A lesser influence is obtained for feed rate (f), as shown from respective contributions (4.92%, 29.57% and 24.60%). Machining force initially increases with the increase in both cutting depth and feed rate. The lower this force, the higher the cutting speed. The reduction in the forces is probably due to the increase in the temperature in the shear plane area, resulting in a reduction in shear strength of the material.
The statistical analysis based on ANOVA has established that the feed rate has the highest influence on the surface roughness (81.69%). In the second rank comes both Vc2 and f2 with 6.071% and 6.071% contributions, respectively. The depth of cut parameter has a very less effect compared to that of the feed rate. The best surface finish is obtained at a lower cutting speed with lower feed rate and lower depth of cut.
The reduced models obtained for Fx, Fy, Fz and Ra using the RSM quadratic modeling, with correlation coefficient R2 of 96.7%, 96%, 99.02% and 95.27%, respectively, showed strong correlations with the input data. The comparison between predicted and measured values for the cutting force components and surface roughness proved that predicted values are very close to experimental ones. These models can be employed to predict the cutting force components and surface roughness patterns developed during the turning of AISI 420 steel with coated carbide tool.
Based on the response surface optimization and the composite desirability method of RSM, the optimal turning parameters of martensitic stainless steel AISI 420 with coated carbide tool are found to be as follows: Vc = 120 m/min, f = 0.08 mm/rev and ap = 0.15 mm. The optimized responses are Fx = 14.190 N, Fy = 44.869 N, Fz = 43.048 N and Ra = 0.523 µm, with a composite desirability of 0.987.
From the confirmation test, it can be said that the empirical models developed are reasonably accurate. The errors for the three components of cutting force are as follows—Fx = maximum value 6.51% and minimum 2.58%; Fy = maximum value 4.36% and minimum 0.05% and Fz = maximum value 3.59% and minimum 0.43%, and the error of surface roughness is Ra = maximum value 5.12% and minimum 0.84%.
In order to have a complete study concerning the cutting of a martensitic stainless steel (AISI 420) using a CVD-coated carbide tool, other quality criteria such as tolerances, burr and residual stress constraints have to be investigated in the future. Consequently, this will help to optimize efficiently cutting operations.
Footnotes
Appendix 1
Acknowledgements
This work was achieved in the LMS (Guelma University, Algeria) in collaboration with LaMCoS (INSA-Lyon, France).
Declaration of conflicting interests
The authors declare that there is no conflict of interest.
Funding
This study received financial support from the Algerian Ministry of Higher Education and Scientific Research (MESRS) and the Delegated Ministry for Scientific Research (MDRS) through CNEPRU Research Project (Code: 0301520130001).