
Abstract
Conventional forming limit diagram concept to determine the forming severity in tube hydroformed products might be restrictive because materials experience complex stress and strain path changes during the shaping process. In this study, a polar effective plastic strain diagram approach was adopted as a strain path–insensitive measurement to establish a criterion for evaluation of necking and, consequently, bursting failures in the tube hydroforming process. The polar effective plastic strain–based failure prediction uses information of the effective plastic strain and the direction defined by the arctangent of the current strain-rate ratio. These values were measured and calculated from free-expansion tests of straight AA6063 tubes for various combinations of axial feed and internal pressure using a stereo vision-based surface strain measurement system. The polar effective plastic strain diagram was constructed and applied to finite element analysis to predict the forming limit of AA6063 tubes. The effect of pretensions was also considered.
Introduction
A combination of reliable formability prediction tools and finite element (FE) simulations in the stage of generating virtual tryouts has become important for not only reducing design and production cost, but also improving process robustness and product quality. The concept of the forming limit diagram (FLD) has been widely applied to the sheet metal forming industry to predict formability because of its simplicity and ease of use.1,2 However, when the sheet metals experience nonlinear strain paths, the application of the conventional FLD might be restrictive.3–5 The forming limit curve (FLC) is dynamic in nature, whose shape and position are subjected to significant change with strain path. 6 This makes the prediction of limit strains for processes with complex strain paths, for example, tube hydroforming processes, more difficult and ambiguous. 7
Most of practical tube hydroformed products experience complex stress and strain path changes during the shaping process. Therefore, for tube hydroforming processes, assessment of forming severity based on the as-received FLD might be inappropriate. 7 The FLC may reasonably predict the necking of straight tubes in free-expansion bursting test, which has almost linear strain path.8–10 However, typical hydroforming application exhibits considerable nonlinearity in strain path, and therefore, the as-received FLD can no longer be a reliable criterion to predict forming severity. For this reason, alternative criteria have been introduced to remove or reduce the strain path sensitivity. For example, the forming limit stress diagram (FLSD) could be a solution as it is almost independent to strain path changes.11–14 More recently, several attempts have been made toward a strain path–independent metric to assess the severity of sheet metal forming processes, one among them being the polar effective plastic strain (PEPS) diagram. 7 The concept has been proven to be effective for the specific process described in Stoughton and Yoon. 7 Accordingly, the PEPS diagram was demonstrated to be less sensitive to the strain path change compared to FLSD.
This article presents the application of PEPS diagram in FE simulation to evaluate the formability of hydroforming operations. The experimental study, including free-expansion tests without and with pretension of AA6063 tubes, was conducted to verify the formability prediction.
The PEPS diagram
Efforts have been made to introduce more reliable and user-friendly criteria for evaluating the sheet metal forming limit during general forming processes with complex strain paths.1,4,7,13,15,16 Among the proposed solutions to the strain path dependency of the classical FLDs, the PEPS diagram appears to be a promising alterative method for industrial applications.
7
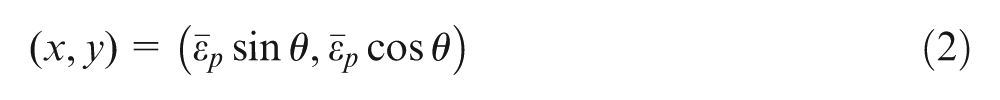
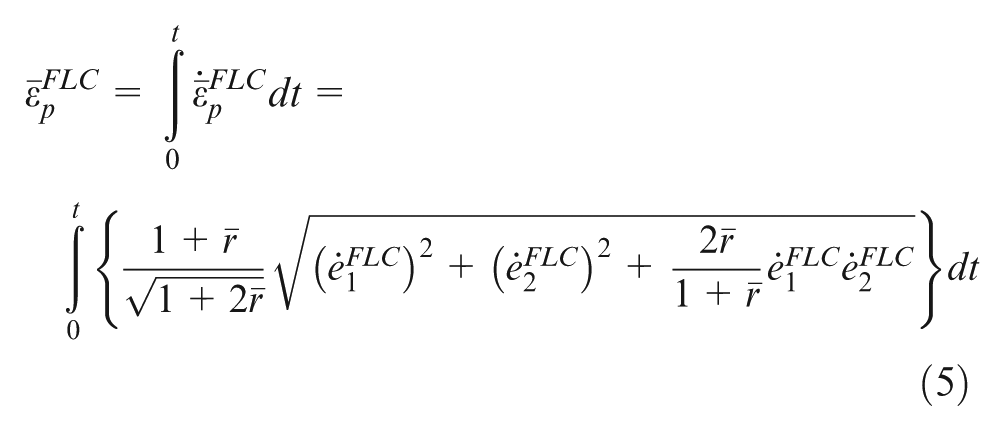
In this approach, the effective plastic strain, which is analytically or numerically computed depending on the yield criterion in use, is displayed in a polar representation to establish the PEPS FLD. Variables constituting the PEPS diagram include the effective plastic strain,

where
Each point of the FLC can be mapped to a point on the PEPS curve, whose equivalent Cartesian representation is
As schematically shown in Figure 1, a bilinear path and an arbitrary strain path in the strain space are mapped to new paths in the polar presentation. The new paths are determined based on the magnitude of increment in effective plastic strain and the direction of the strain increment in the strain space. The shape of PEPS curve is similar to that of the FLC: both have the same direction that corresponds to uniaxial, plane-strain and equal-biaxial strain path. In addition, the PEPS curve also has a cusp at plane-strain mode. The similar shape of the PEPS to that of the strain-based FLC may make it more intuitive to engineers who are familiar with the FLC.
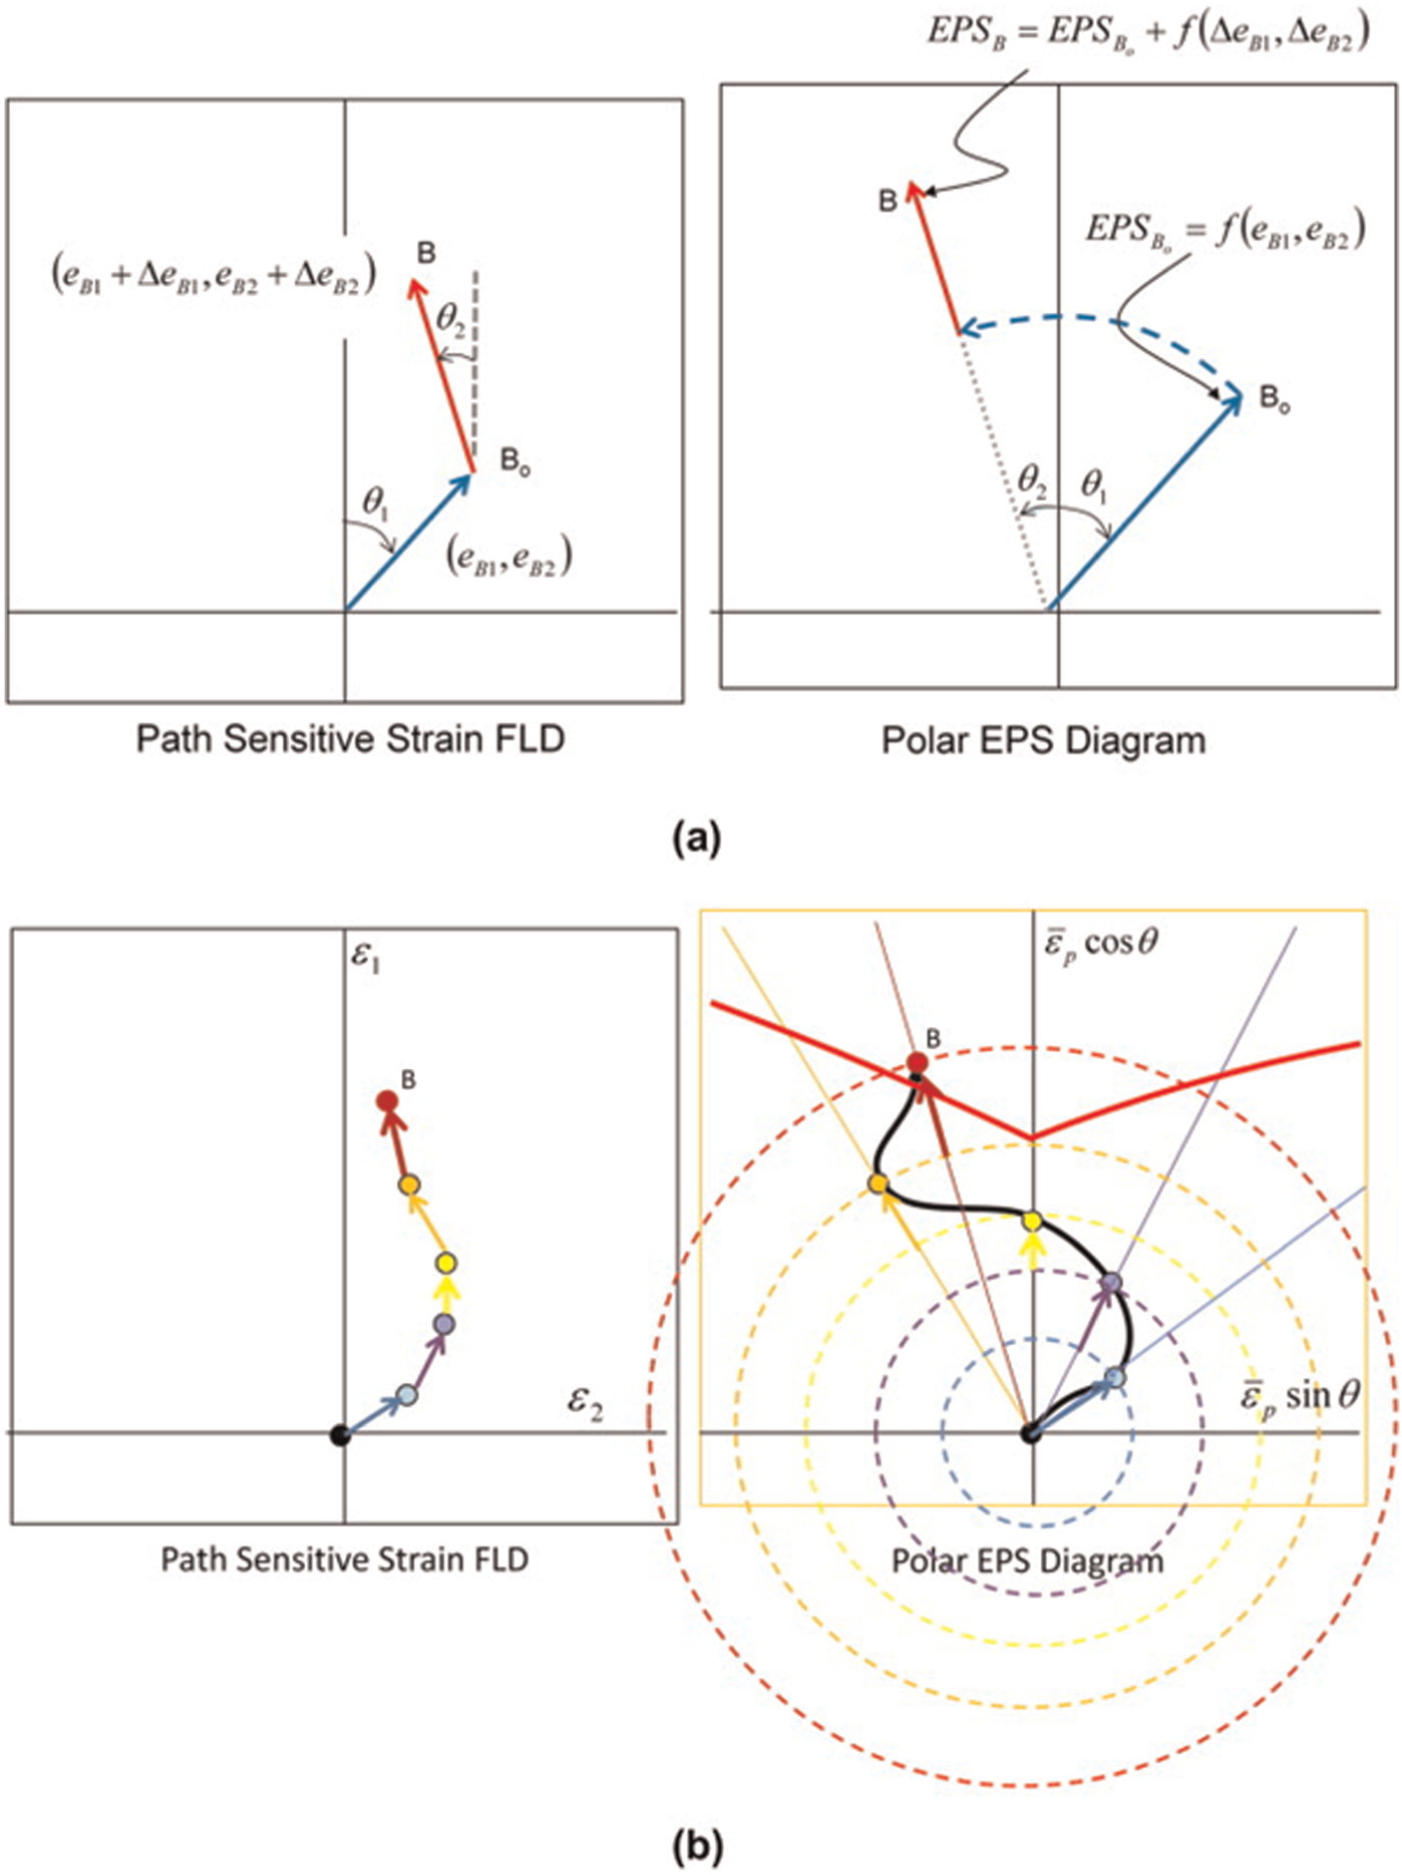
Graphical illustrations of the PEPS diagram (a) bilinear path and (b) arbitrary path. 7
To summarize, the main features of the PEPS diagram were reported as follows: 7
Practically independent to the strain path change;
More appealing compared with other alternate Cartesian diagrams;
Insensitive to the strain-hardening behavior of the stress–strain relationship;
In this study, the PEPS curve is incorporated in a commercial FE simulation tool, PAM-STAMP®. The application of PEPS is demonstrated using a hydroformed part. It is found that the failure location corresponds to the limiting value given by the PEPS curve.
Experimental results
Hydroformability tests were conducted on AA6063 extruded tubes with the nominal wall thickness of 2.25 mm and the outer diameter of 41 mm. The mechanical properties of the material were characterized using the standard uniaxial tensile tests. Details of the testing system have been reported elsewhere. 8 The true stress–true strain relationship of the selected material was reported to obey the Swift model, 8 that is
The free-expansion tests were carried out on the straight tube specimens. Figure 2 shows the geometry of the tooling for the tube formability study of AA6063 tubes. Axial displacement in conjunction with internal hydraulic pressure was applied to bulge the tube. A pressure intensifier unit, including a hydraulic circuit and three servo valves, was used to control the pressure and supply of water to obtain a desired internal pressure profile in the tube. A plunger, which has three O-rings to seal the tube end and the inlet of pressurized water, is used to connect the tube to the horizontal cylinder piston. The tube is partly clamped in the tooling set at two ends, and the middle section is free to bulge in the cavity of the tool. Axial feed of tube is accomplished using a plunger at the tube ends. A thin polymer sheet was used to reduce the friction effect between the tube and the die cavity.
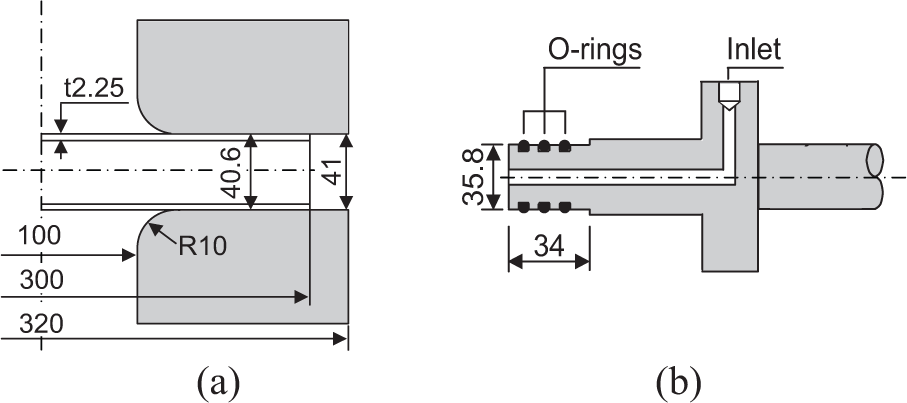
Geometry of the tooling for tube hydroformability tests: (a) free-expansion die and (b) plunger.
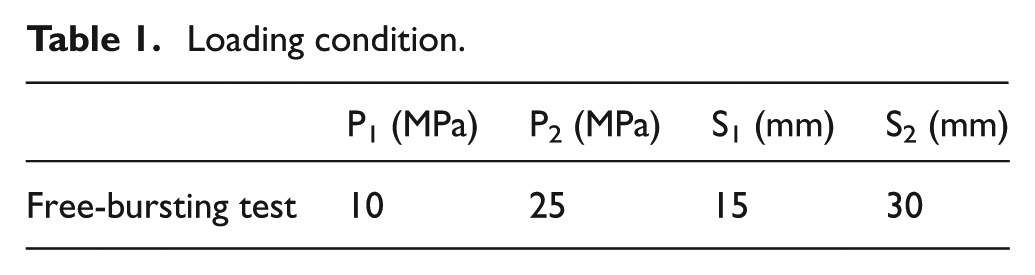
It has been shown that different strain paths can be achieved by varying the amount of the axial feeding.4,17 Therefore, different combinations of internal pressure and axial feeding were applied to the free-expansion forming tests of straight tubes to define the FLC. The input combinations are schematically shown in Figure 3. The various deformation modes were induced during the bursting. Table 1 shows the values of the applied internal pressure and axial feeding.
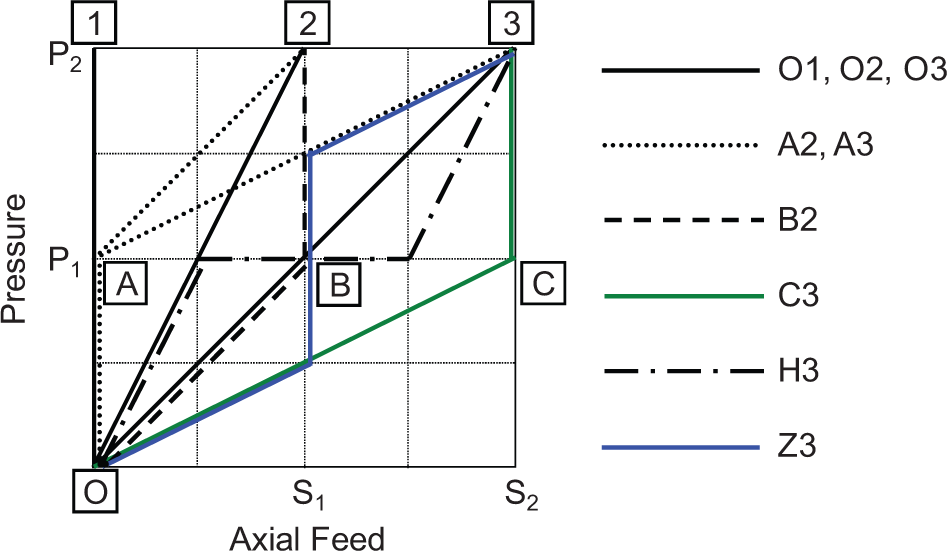
Combinations of internal pressure versus axial feed loading condition in the free-expansion tests.
Loading condition.
Selective data points to define the FLC were acquired from the free-expansion tests (see Figure 4(a)). Major and minor strains were measured and calculated using a stereo vision–based surface strain measurement system, namely, ASIAS. 8 The limit strains were automatically measured from deformed grids around the burst area following a procedure of image capturing, image enhancement, mesh identification, sub-pixel measurement, surface smoothing, camera calibration, 3D coordinates and strain calculation and post-processing. Details of the procedure can be found elsewhere. 8
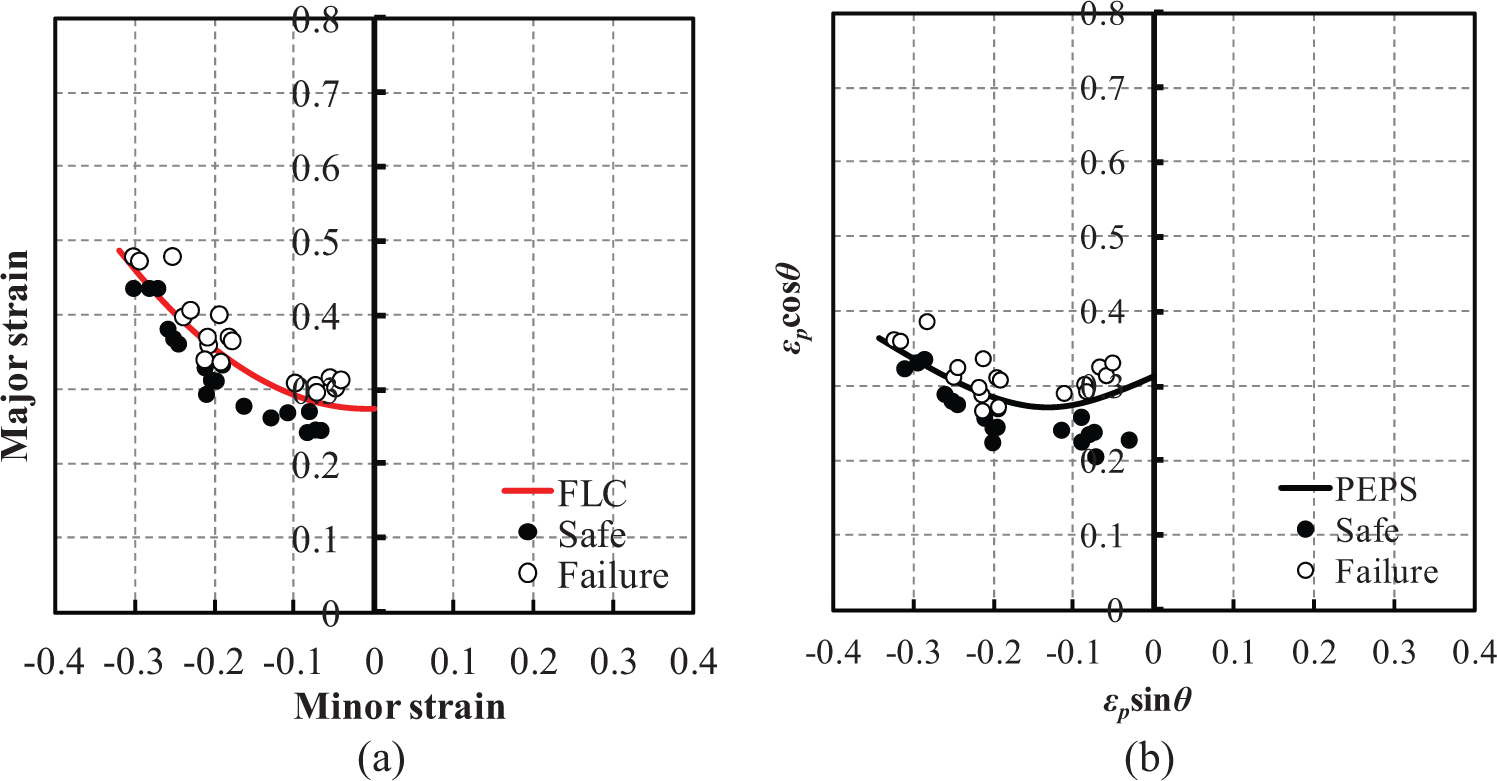
The forming limit curves of AA6063 tubes: (a) FLC and (b) PEPS curve.
All the points of the measured FLC appear in the range of negative minor strain. For the free-expansion hydroforming operations of straight tubes, the loading path is sufficiently close to linear (proportional loading).4,8 Therefore, the measured strains can be reasonably used to define the FLC. Some points are even located in the area beyond the uniaxial tension mode, that is,
Results and discussion
The free-expansion hydroforming test was assumed to be a proportional loading process in which the material follows linear strain paths. Therefore, it is possible to directly transform the measured FLC into the PEPS curve following either one of the two methods: analytical calculation and FE-based transformation. In both methods, the measured limit strains are used as input for the calculation of the plastic strain
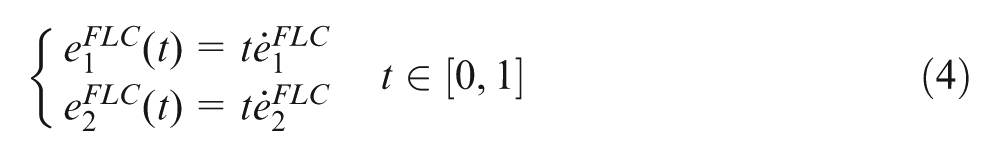
At failure points on the FLC, equation (4) yields
where
The latter uses a single element model (SEM) of unit square in FE simulation. Accordingly, the limit strains in principal strain space are converted to displacement components, u1 and u2, using an appropriate strain–displacement relation. With the assumption of proportional loading in the formability test, these displacement values are then incrementally applied to the SEM with suitable boundary conditions to simulate the same deformation mode of the tube. The resulting uniform plastic strain in the SEM can be easily obtained from the FE outputs to be fed in equation (2) for the calculation of PEPS curve. The procedure is generic and independent of yield criterion, hardening rule, rate or other effects. Moreover, it is applicable to rate-dependent material models and is possible in principle to extend to include other effects, for example, damage evolution. 19
Each point of the FLC was consistently mapped into the polar representation to a point of the PEPS curve following the mapping scheme presented in the previous section (see Figure 4(b)). Simulations of the free-bulging processes provided good prediction of the limit strains. 8
Owing to its proven insensitivity to the strain path change, this PEPS curve will be utilized to evaluate the formability of the investigated material. First, the free-expansion hydroforming tests of the straight tubes without pretension were simulated, and the predicted limit strains were validated using the experimental data to investigate the reliability of the transformed PEPS curve. Then, the PEPS diagram was applied to investigate the prediction of necking in the free-expansion hydroforming tests of the tubes with 10% and 15% tensile prestrain in the axial direction. In this case, the subsequent strain path direction induced in the hydroforming operation far deviates from the one in the pretension step. Predictions of failure based on the FLD were also presented in this case.
The dynamic explicit FE software PAM-STAMP was used to simulate the tube hydroforming processes. Owing to symmetry condition, only one-eighth of the tube was modeled using 3000 Belytschko–Tsay shell elements. The tool was modeled by 450 rigid surface elements. The material was assumed to obey the von Mises yield condition. The stress–strain relationship in equation (3) was used to define the hardening behavior. The fluid cell method in PAM-STAMP was used to apply the internal pressure rather than a pressure–time function, which may cause instability problems as described in Ahmetoglu and Altan 20 and Park et al. 21 A friction coefficient of 0.04 between the tube and the die was assumed in all simulations. The value was chosen from the comparison of length reduction in free-expansion test with zero axial feeding (path O1 in Figure 3) between the experimental measurement and that of FE simulations for different values of friction coefficient in the range from 0.01 to 0.2. 8 The so-called accurate contact algorithm in PAM-STAMP was applied in all simulations.
Figure 5 shows two typical cases of the free-expansion forming without pretension: the loading cases O1 and A2. The broken lines starting from the origin are the strain paths of failed elements generated by the FE simulations. The paths are linear for the loading case O1 in strain space and polar representation. For the loading case A2, the path is partially linear in the strain space, but is no more considered to be a line in the polar representation. The nonlinearity of the loading path, which seems to be negligible in the strain space, can be exposed clearly in the polar presentation.
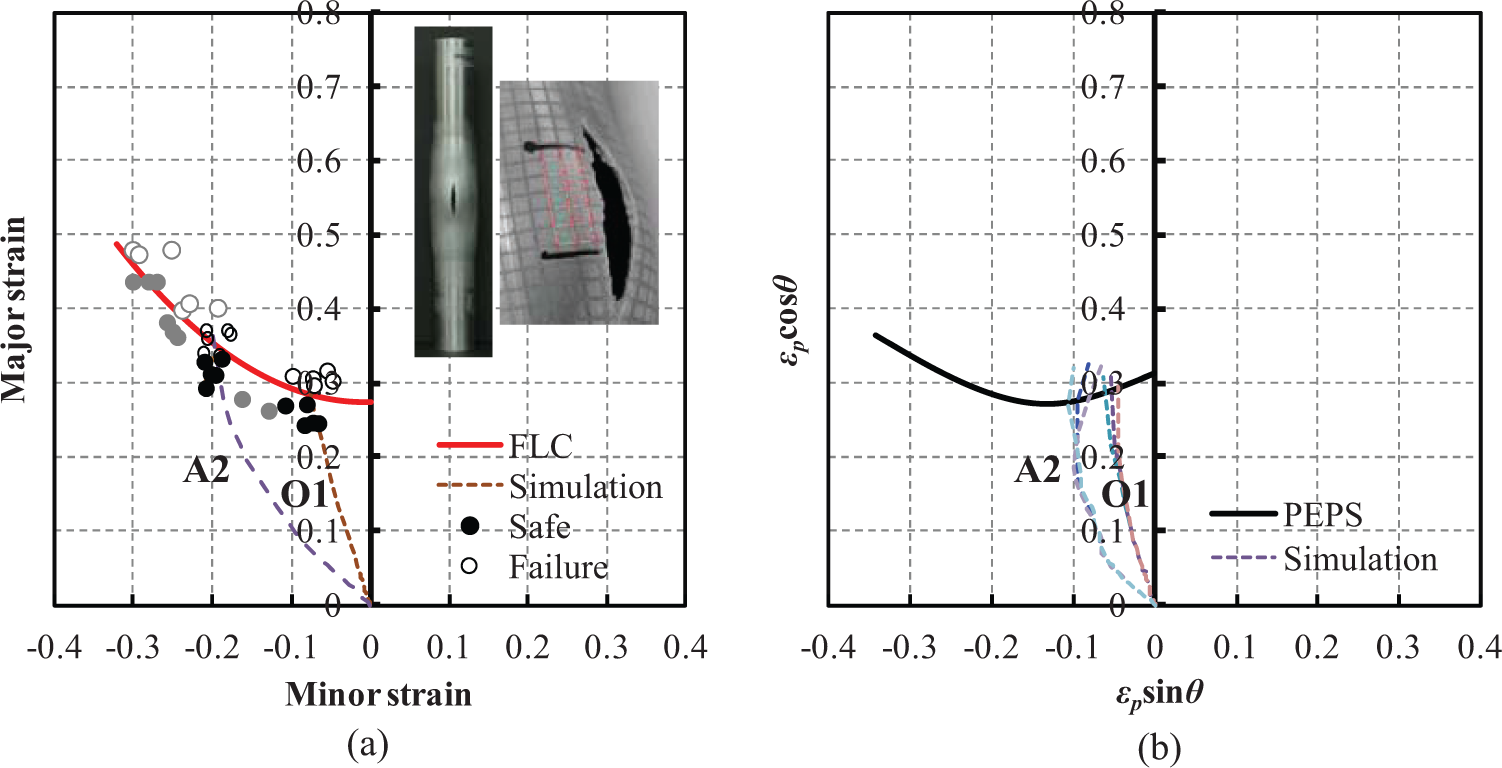
Predictions of necking failure in the tube free-expansion hydroforming operations using (a) FLC and (b) PEPS curve.
Predictions using the FLC (Figure 5(a)) and PEPS curve (Figure 5(b)) can give reasonable results on the failure timing and location for the two investigated loading cases. The PEPS predicted a little bit higher values of the limit strains. For the loading case A2, according to the agreement of test data and the prediction, the nonlinearity of the path tends to shift the failure point along the PEPS curve toward that of the O1 loading case.
Tube specimens with different amounts of prestrain, that is, 10% and 15%, were applied in the tube prior to the hydroforming operations. The critical values of limit strains obtained from the tubes with pretension appear in the positive minor strain region and were considerably lower than that with no pretension, as shown in Figure 6(a). The FLC cannot predict the failure in this case due to the lack of information in the positive minor strain region. It can be seen from the simulations that the strain paths in the cases with pretension effect deviate much from a proportional one. Actually, the paths in these cases include two segments: one by the pretension loading and the other by the hydroforming operation. The two segments locate in the positive minor strain region, which has no baseline to help the prediction.
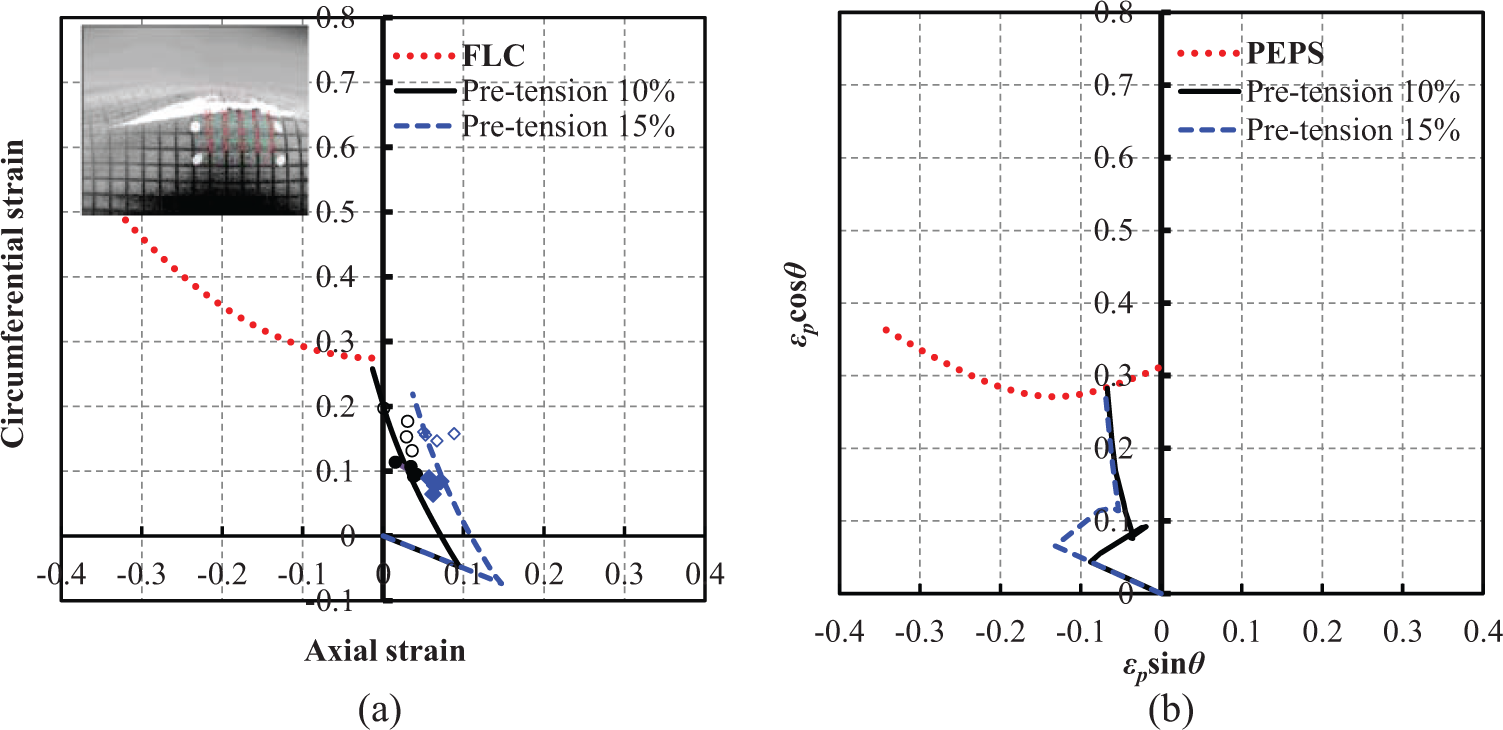
Predictions of necking failure in the prestrained tube followed by the O1 loading case free-expansion hydroforming operation using (a) FLC and (b) PEPS curve.
FE simulation and prediction of the forming limit using PEPS curve for the case of pretension followed by the free-expansion formation taking the O1 path are shown in Figure 6(b). The simulation includes two steps: tension and free-expansion hydroforming. Springback effect of the tube after tension and prior to the die closure of free-expansion was considered negligible, therefore, not modeled in the simulation.
Unlike the strain space, the loading path in the polar presentation has three segments: one by the pretension loading, one by the hydroforming operation and a transient step in between resulting from the change in arctangent of the strain-rate ratio between the two loadings. The pretension path is linear, while the hydroforming path follows the one in the case of free-expansion forming. The whole path belongs to the left half of the PEPS diagram. Therefore, evaluation of the hydroformability using the PEPS concept is possible in this case.
Prediction of hydroformability of the investigated element using the PEPS curve in this case exhibits no failure prior to the final point of the loading path under the prescribed loading case. The safe condition corresponds to portion of the path lying below the PEPS curve. However, further loading leads to failure as the loading path gets closer to and then intersects the PEPS curve. Although the failure is slightly underestimated, the PEPS diagram captures the forming severity accurately unlike the strain-based FLC. The prediction is consistent with the test data, which showed only the failure-free grids prior to the sudden burst at the end of the loading path.
Conclusion
The concept of the PEPS diagram, which shows strain path insensitivity, was applied in this study to predict the limit strains and necking failures of tube hydroforming operations. The present numerical and experimental investigation leads to the following conclusions:
Major strain in most of the hydroforming processes is in the circumferential direction, since expanding in the radial direction is dominant as compared with the elongation in the axial direction.
The limit strains defining the FLC was selectively measured from free-expansion tests of straight tube with different combinations of axial feeding and internal pressure. Only the left half of the FLD could be obtained. To obtain information toward the positive minor strain region, pretension tube specimens with different values of prestrain were tested. However, the limit strains in these cases should be used neither to define the FLC nor to judge as failed or safe.
Free-expansion of the straight tubes shows almost linear strain path in several combined loading operations. For this reason, applications of the FLD can give reasonable predictions of necking.
Transformation of the FLD to the PEPS diagram becomes much simplified with the assumption of proportional loading for each selective source point on the FLC. However, care must be taken in the application for a general loading case of free-expansion hydroforming process. A negligible nonlinear path in the strain space can lead to a wrong positioning of the mapped point in the polar presentation.
Application of the PEPS diagram to determine forming severity in the investigated cases is quite encouraging. The method can be potentially used to predict necking failure of more general loading cases or with complicated die geometry.
Footnotes
Appendix 1
Acknowledgements
The authors appreciate the support by POSCO.
Declaration of conflicting interests
The authors declare that there is no conflict of interest.
Funding
This work was supported by the National Research Foundation of Korea (NRF) grant funded by the Korean government (MEST) (no. 2012R1A2A2A 01014141) and (MSIP) (no. 2012R1A5A1048294). The study was also supported by the National Research Foundation of Korea (NRF) grant funded by the Korean government (MSIP) (no. 2012R1A5A1048294) and Industrial Source Technology Development program (no. 10040078) of MKE.