
Abstract
A novel technique called abrasive-assisted drilling has been designed and developed to improve the surface finish of the drilled hole wall during the drilling of Al6063/10%SiC metal matrix composites. The developed process eliminates the use of supplementary surface finishing process such as abrasive flow machining or deburring of drilled hole, which adds to the cost of product. With the help of this technique, fine polished drilled hole wall surface can be produced by removing small fragments of material generated by the high-energy abrasive particles. A considerable increase in surface finish of the drilled hole wall has been observed for metal matrix composites. Taguchi’s methodology has been used to explore the effect of input process parameters on the surface roughness and hole oversize of the drilled hole. The input process parameters under consideration are rotational speed, finishing time, abrasive size and abrasive concentration.
Introduction
The polishing is the most common method to improve the surface finish. The rough surface produces the stress concentration at the mating parts and also becomes the cause of crack propagation during different conditions. Furthermore, it has been observed that the surface roughness (SR) of the machined component plays a significant role for the prediction of fatigue life of the product. Experimentally, it was observed that the finished surface has higher fatigue life as compared to semi-finished or rougher surface. 1 Therefore, polishing or finishing of the product is essential in order to increase the product life cycle of the product. The technology of providing highly efficient and accurate methods for polishing has become an important research topic. Numerous techniques for polishing have been developed by researches over a period of time. The most important method used by researchers as well as in industry is abrasive flow machining (AFM). In AFM, the abrasive fluid flows through the workpiece performing erosion. Abrasive particles in the fluid come in contact with the raised features on the surface of the workpiece and remove them. 2 AFM may be performed once as a one-way flow process or repeatedly as a two-way flow process.
Gorana et al. 3 studied the influence of controllable variables extrusion pressure, abrasive concentration and grain size on material removal rate, SR, cutting forces and active grain density using AFM. Jain and Adsul 2 studied the effects of different process parameters, such as number of cycles, concentration of abrasive, abrasive mesh size and media flow speed, on material removal rate and surface finish. The dominant process parameters found were concentration of abrasive, followed by abrasive mesh size, number of cycles and media flow speed. Singh and colleagues4–7 revealed the effect of magneto AFM on the SR and the material removal rate. The input parameters for maximum material removal rate were optimized and the SR was reduced by applying the magneto AFM process. Walia et al.8–10 used centrifugal force–assisted AFM (CFAAFM) process, a hybrid AFM process to improve the surface finish of the workpiece material. A centrifugal force was applied to the abrasive media with the help of rotating centrifugal rod. The existing methods employ additional finishing processes on the machined component, specially drilled workpiece to enhance the surface finish of the drilled hole wall. Also, the setups require high-pressure connected pistons to impel the abrasive medium. 11 The solution of these problems is the abrasive-assisted drilling (AAD) as a polishing method for improved surface finish along with micro-deburring. Therefore, the present experimental investigation targets to develop a new concept of hole surface finish and polishing during the drilling process itself.
Problem formulation
The statement of problem can be stated as design and development of experimental setup for minimizing the SR and micro-deburring of the drilled hole wall during drilling operation on metal matrix composite (MMC) to increase the product life cycle.
Conceptualization of AAD process
The AAD process consists of applying a high rotational speed to drill point geometry to make the abrasive media flow and circulate around the drilled hole wall after the drilling process ends. A centrifugal force is applied by the rotating drill point geometry on the abrasive media, and as a result of this action, the abrasive particles come in direct contact with the workpiece. The high-energy abrasive particles, when strike the drilled hole wall, produce the honing or burnishing effect along the direction of rotation. Furthermore, the abrasive media entrapped between the land of the drill point geometry and drilled hole wall act as a fine grinding wheel and provide additional improvement in surface finish. Additionally, a magnetic field was also applied around the circumference of the drilled hole wall to propel the abrasive particles along with centrifugal force provided by the drill point geometry toward the drilled hole wall. The combined effect of the three mechanism causes a decrease in the SR values along with deburring of drilled hole wall. A conceptualized schematic of AAD is shown in Figure 1.
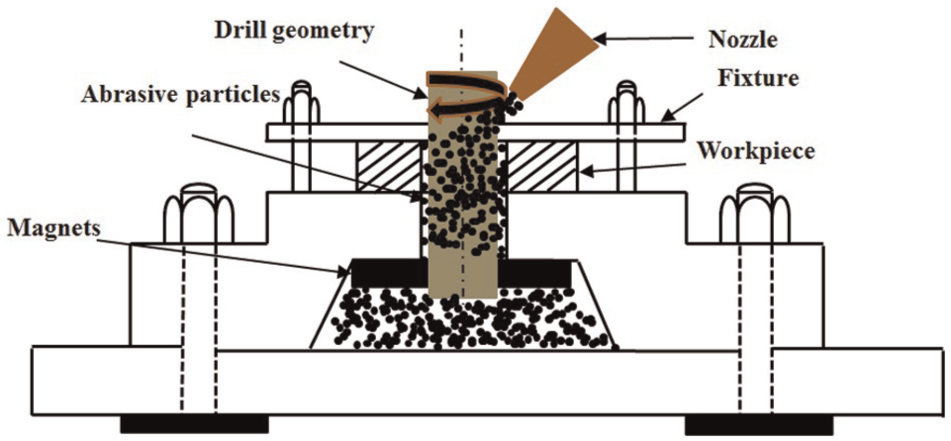
Conceptualization of abrasive-assisted drilling setup.
Selection of process parameters
The selection of the process parameter was based upon machine tool parameters, cutting tool parameters and abrasive parameters. The machine tool parameters and cutting tool parameters (cutting speed, feed, step diameter and point angle) were kept constant, and their selection was based upon the pilot experimentation conducted under dry conditions using one-factor-at-time (OFAT) approach design. The selection criteria for machine tool and cutting tool parameters were to produce minimum cutting forces along with minimum SR and tool wear. The selected machine tool and cutting tool parameters were as follows: cutting speed (560 r/min), feed (0.05 mm/rev), step diameter (5 mm) and point angle (118°). The centrifugal force exerted by the drill point geometry on the abrasive particle depends upon the rotational speed of the drill geometry. Therefore, the rotational speed of the drill point geometry (after drilling hole) was considered as input process parameter for AAD process.
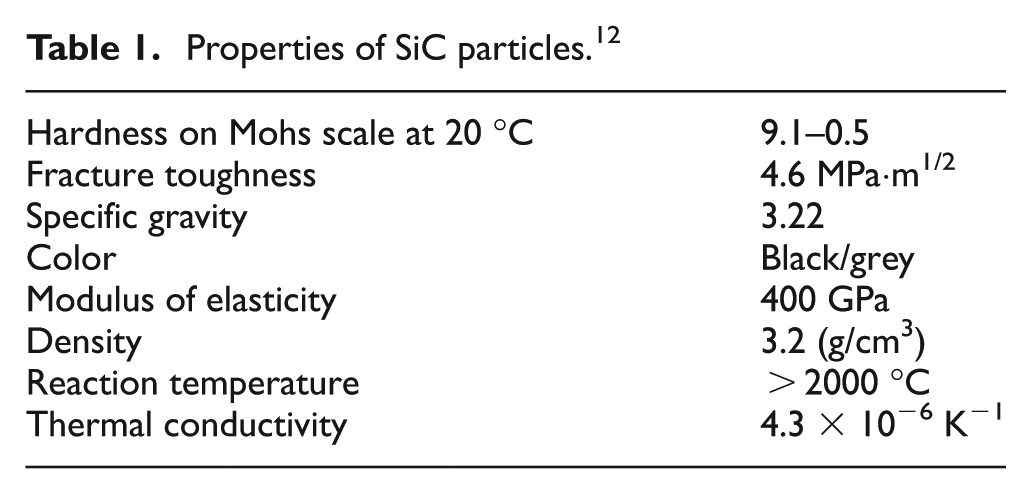
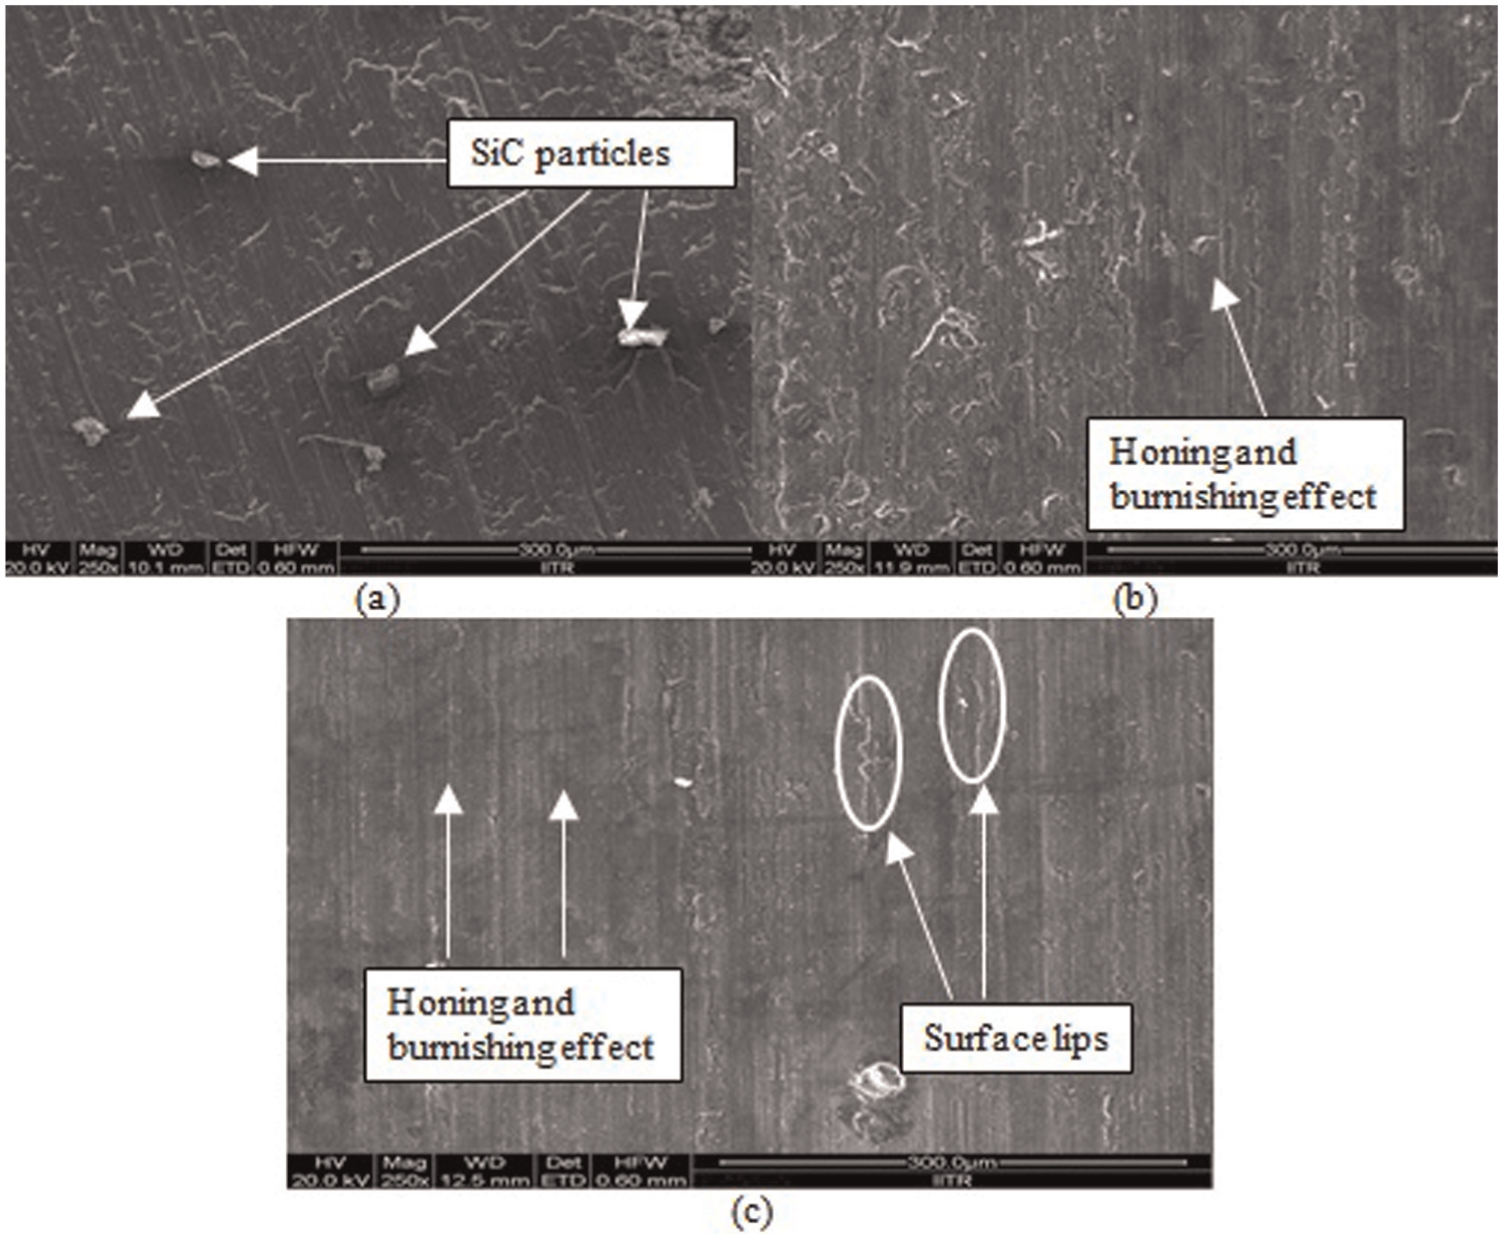
The selection of abrasive parameters (abrasive size and abrasive concentration) was very critical for the performance of the developed process. To explore the behavior of abrasive parameters during AAD process, a comprehensive pilot experimentation was conducted using OFAT approach on the tool wear. The abrasive particles with 180 (83 µm), 220 (68 µm), 320 (47 µm), 400 (37 µm), 500 (30 µm), 600 (25 µm) and 800 (19 µm) mesh sizes were investigated for 5%−15% of abrasive concentration. The lower mesh size abrasive particles (180 and 220) have higher tendency to settle down in slurry; therefore, a continuous stirring setup has to be installed for proper mixing of the abrasive particles in the slurry. Furthermore, the continuity of the slurry striking the workpiece was sometime interrupted due to the choking of the impeller or nozzle. Therefore, smaller mesh size particles were not considered for experimental investigation. A severe land and flank surface damage was observed as shown in Figure 2, when abrasive particles of mesh size 320 were used. It is because of three-body abrasion caused by the entrapped abrasive particles on the drilled hole wall surface as well as on the drill point geometry. Therefore, smaller mesh size particles up to mesh size 320 were not considered for experimentation purpose. An insignificant improvement in SR of the drilled hole wall was observed with the abrasive particles of mesh size 800. Also, the larger mesh size abrasive particles are costlier than the smaller mesh size particles. Therefore, for the experimentation, a trade-off between the tool wear and cost of abrasive particles was considered for economical production of abrasive-assisted drilled holes. The shape (morphology) and properties of the abrasive particle used for the experimentation are shown in Figure 3 and Table 1, 12 respectively.
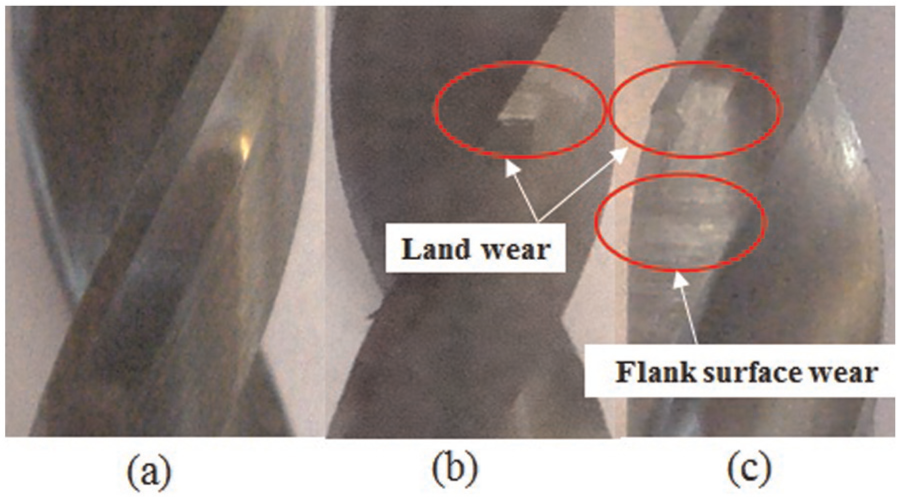
Photographs: (a) no wear, (b) land wear and (c) land wear and flank surface wear.
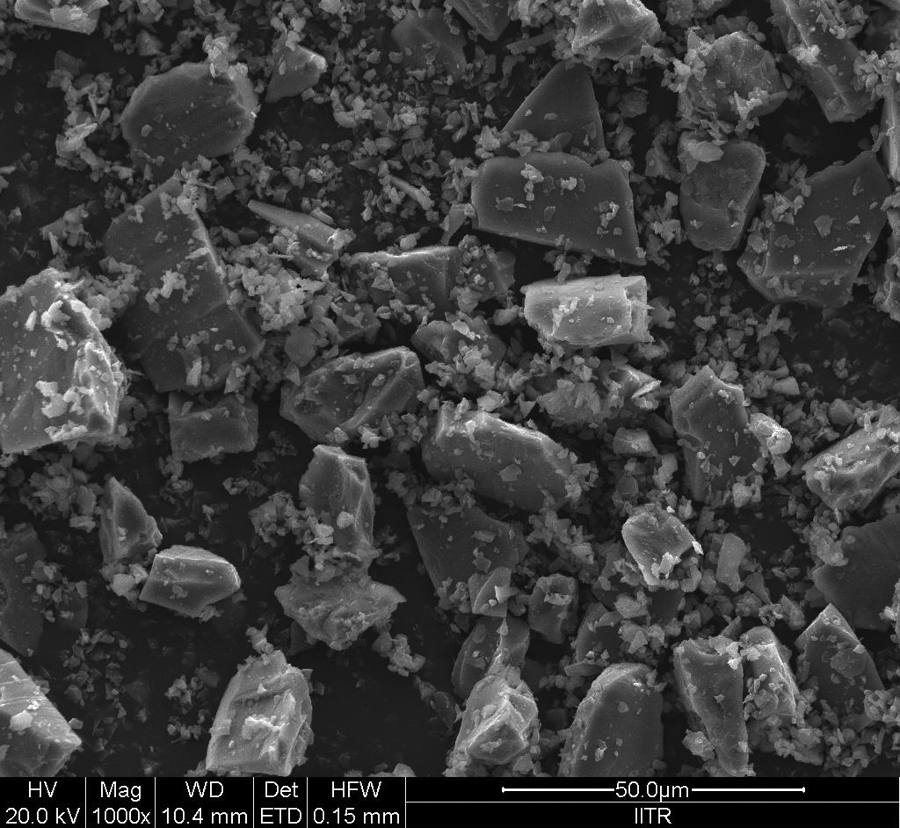
Morphology of abrasive particles used for experimentation (mesh size 600).
Properties of SiC particles. 12
AAD of MMCs
Experimentation for AAD of MMCs was carried out on conventional radial drilling machine. A special fixture was designed as shown in Figure 4 to hold the workpiece along with guided flow of abrasive particles during the drilling process. The workpiece was gripped with the help of top plate bolted rigidly to the fixture. Drilling experiments were performed as per experimental design based upon Taguchi’s methodology using L27 orthogonal array (OA). The process parameters under consideration were rotational speed (r/min), finishing time (min), abrasive size (mesh) and abrasive concentration (%). The working levels for process parameters were decided on the basis of pilot experimentation and are presented in Table 2
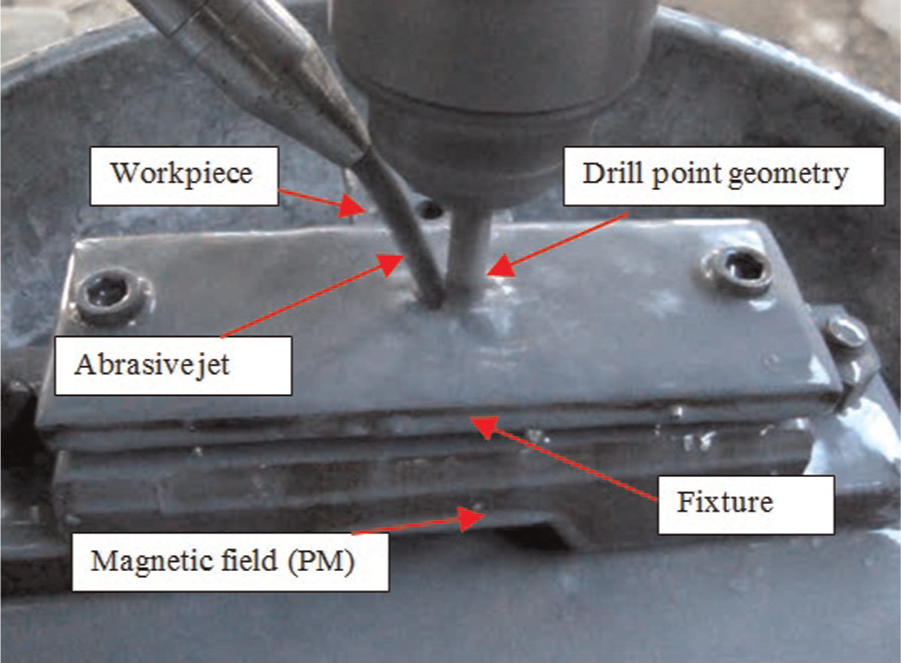
Abrasive-assisted drilling process.
Process parameters at different levels.
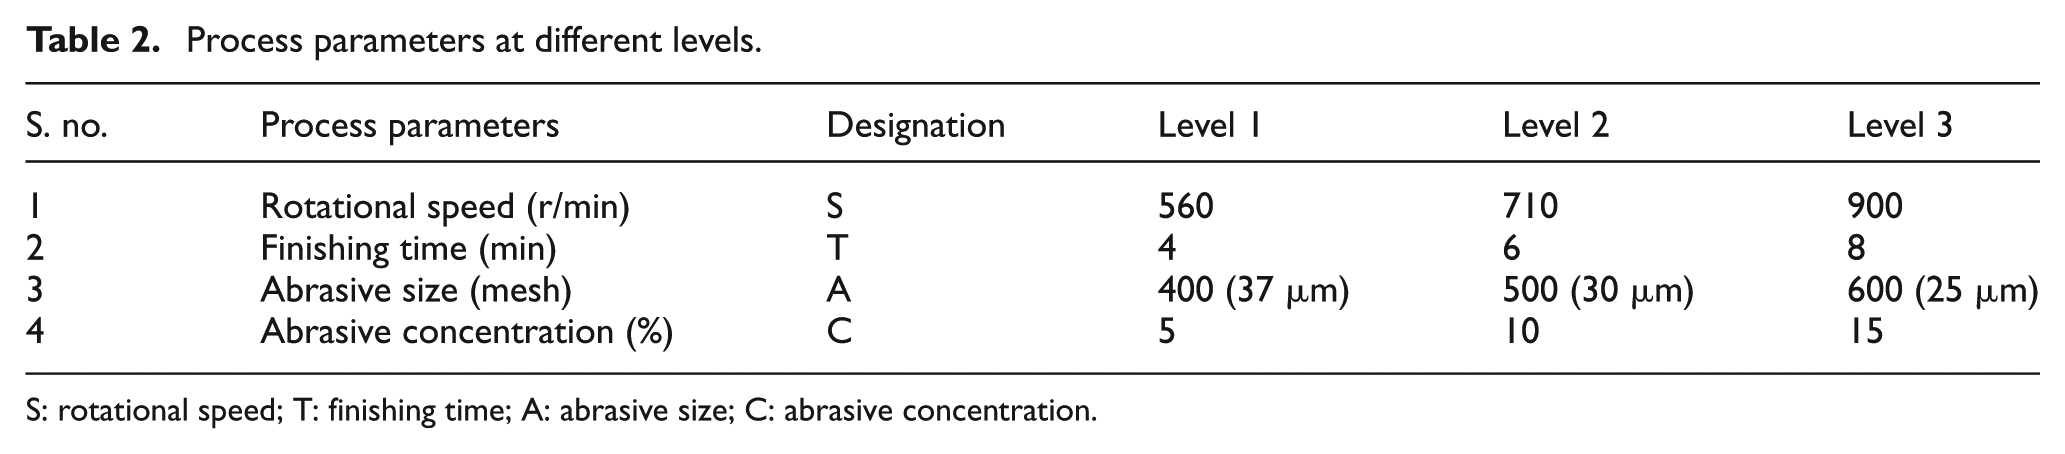
S: rotational speed; T: finishing time; A: abrasive size; C: abrasive concentration.
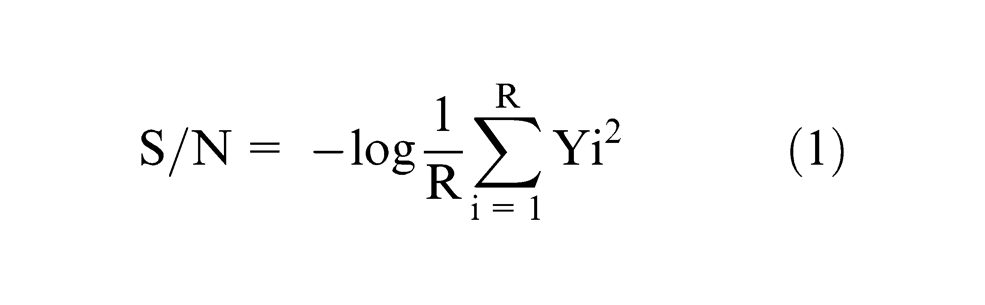
Four process parameters were selected for investigation at three levels as nonlinear behavior can only be determined if more than two levels are used. An L27 OA was used to study the parametric space. A total of 27 experimental combinations were designed and a total of 27 × 3 (3 repetitions) experiments were performed as per the L27 OA. In order to find out the effect of process parameters on the quality characteristic (QC), the mean and signal-to-noise (S/N) ratio were calculated (Table 3). The quality criteria for SR and hole oversize (HO) should be minimum for better process performance. Thus, “smaller-the-better” criterion was used as given in equation (1). Mitutoyo SJ-400 SR tester was used to measure the SR of the drilled hole wall at four positions spaced at 90° to each other. The average of the four readings of SR (Ra) values was considered as the SR (Ra) of the drilled hole wall. The HO was measured with the help of tool maker’s microscope having a least count of 0.01 mm. Three readings for HO were taken along the diameter of the drilled hole, and the average of three readings was considered as HO for the drilled hole.
Average value of SR, HO and S/N ratio.
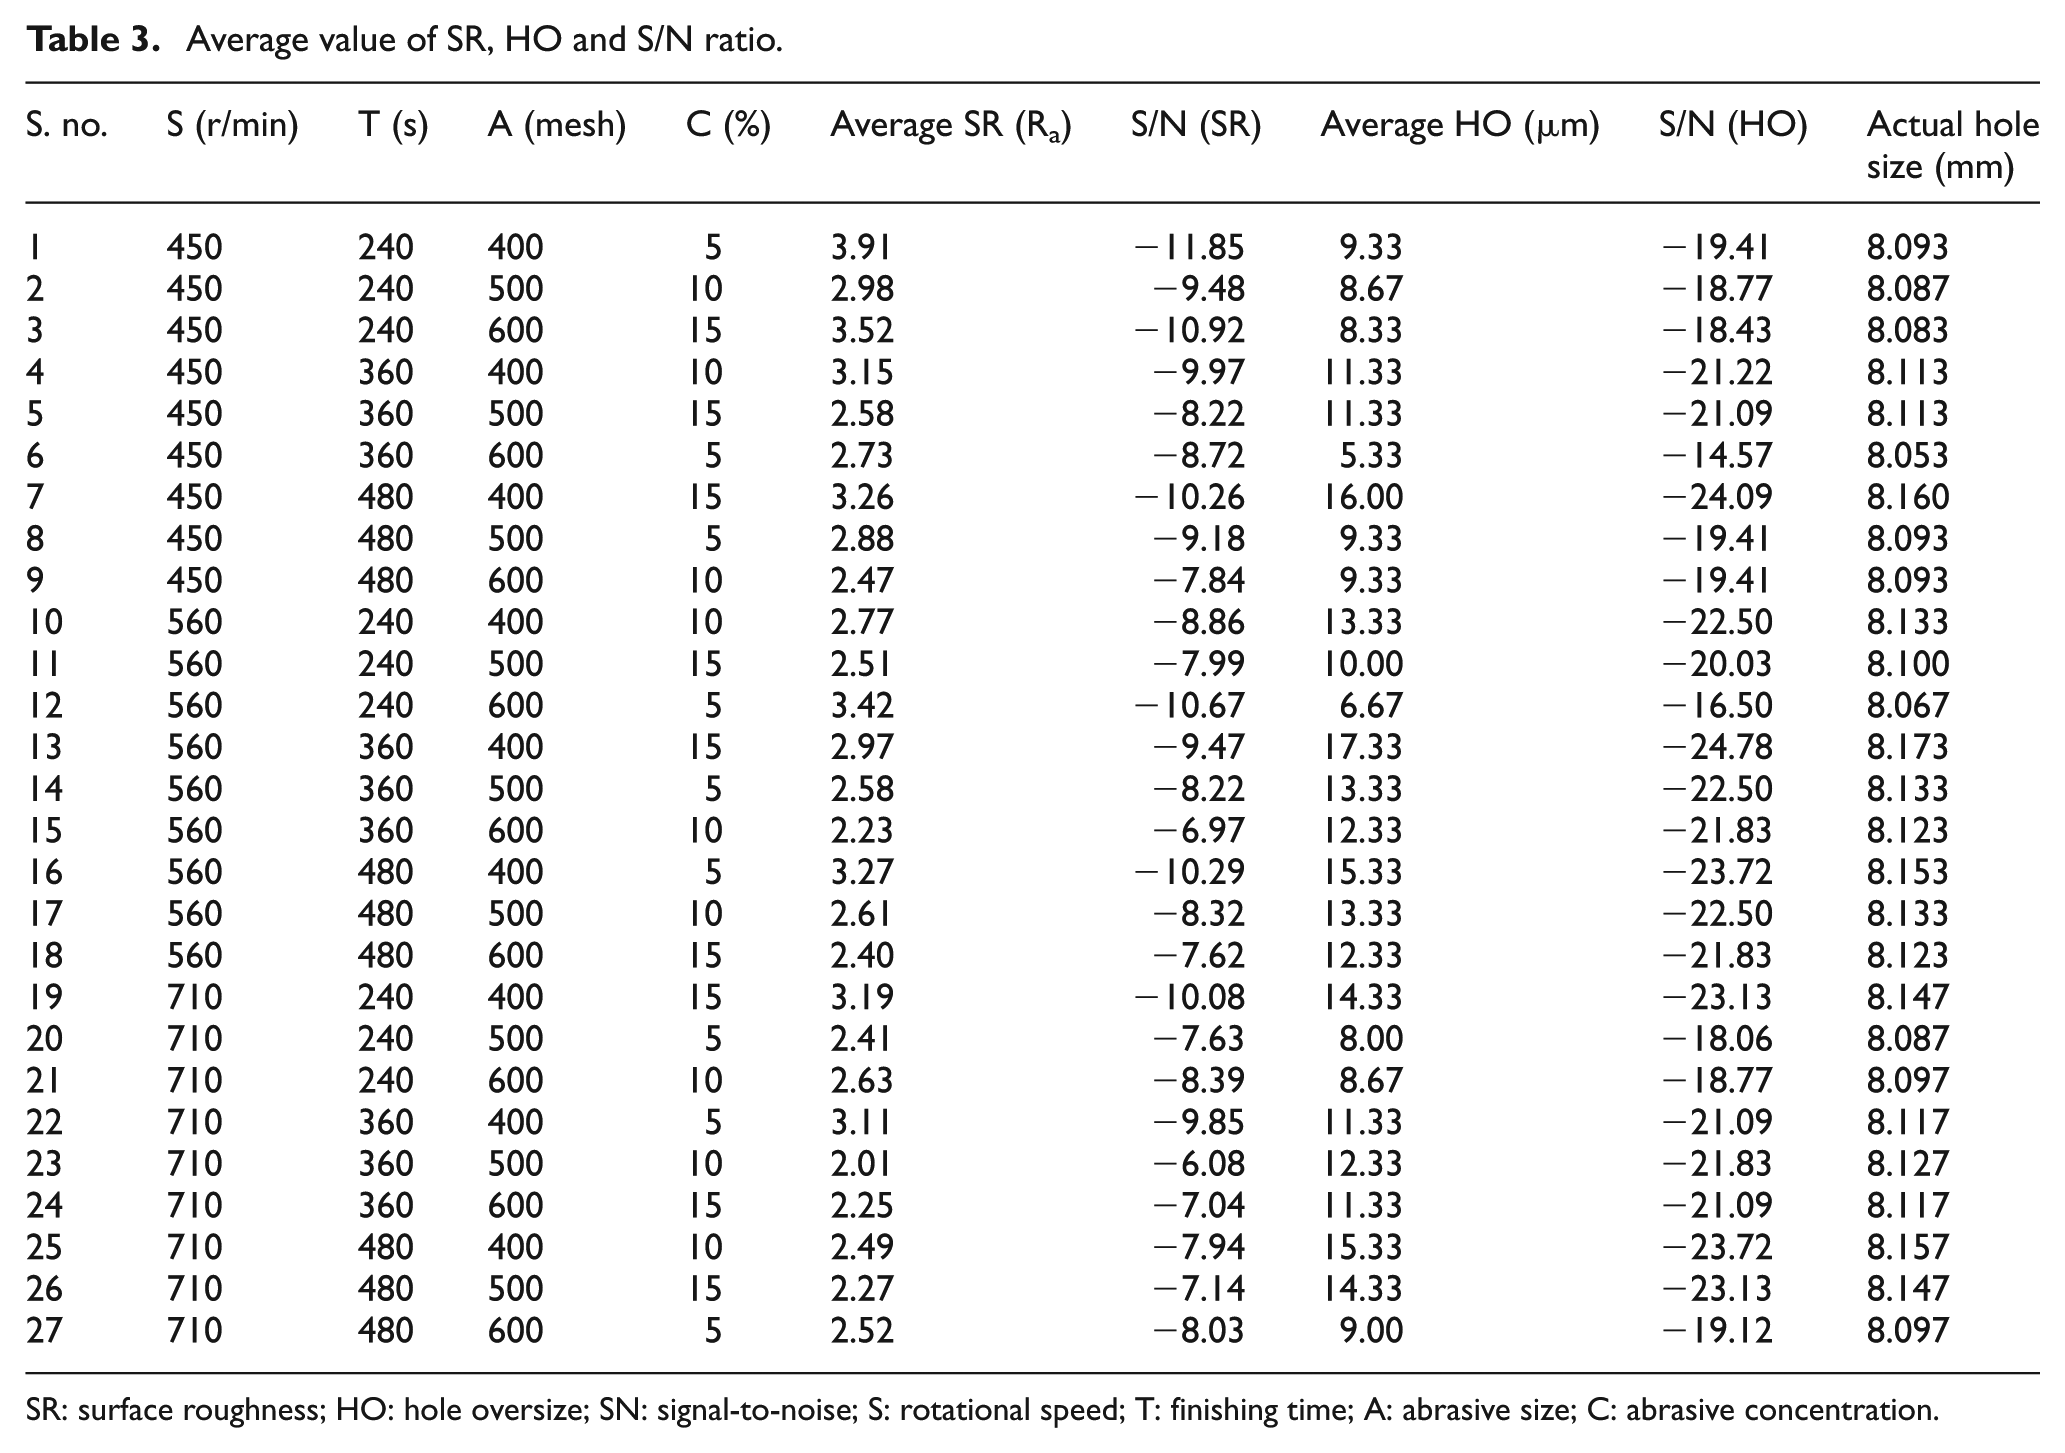
SR: surface roughness; HO: hole oversize; SN: signal-to-noise; S: rotational speed; T: finishing time; A: abrasive size; C: abrasive concentration.
Results and discussion
Effect of process parameters on SR
The mean response refers to the average value of the performance characteristics for each parameter at different levels. The average value of SR (raw data) and S/N ratio of the various parameters at different levels are given in Table 4. The S/N ratio for SR (“lower-the-better”) was calculated from equation (1). The response curve for the individual effect of four process parameters on the average value of SR and S/N ratio is plotted using the experimental data (Figure 5). The lower values of SR are considered to be optimal. It can be seen from the response curve that third level of rotational speed (S3), second level of finishing time (T2), second level of abrasive size (A2) and second level of abrasive concentration (C2) are the best parametric combinations for lower SR, in terms of both raw data and S/N data.
Average value of raw data and S/N data for SR and HO.
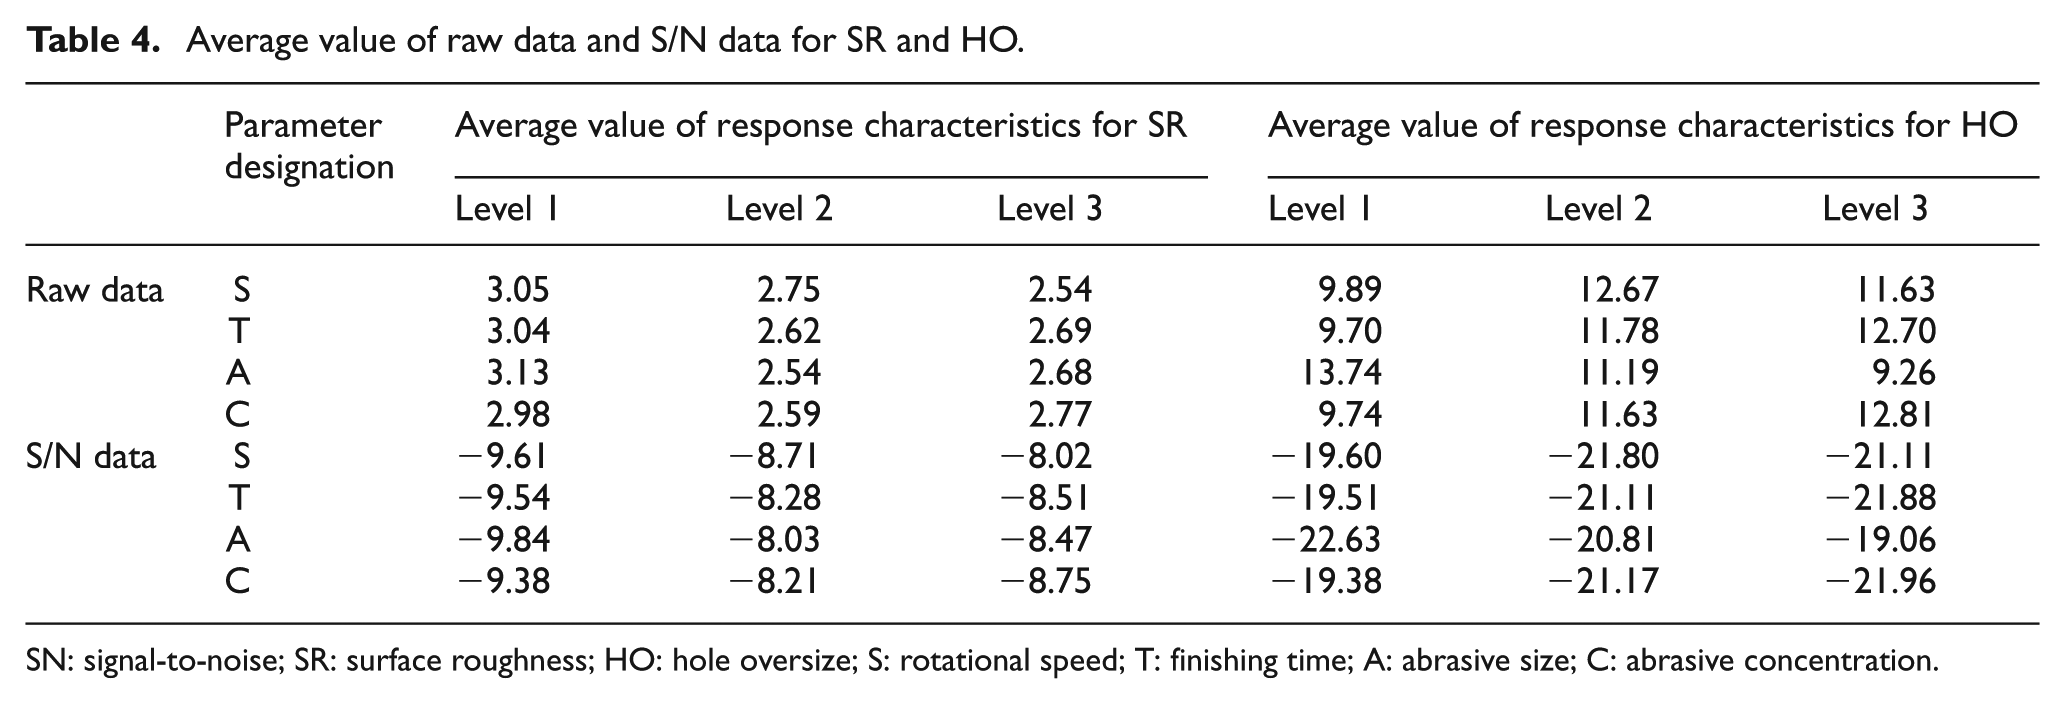
SN: signal-to-noise; SR: surface roughness; HO: hole oversize; S: rotational speed; T: finishing time; A: abrasive size; C: abrasive concentration.
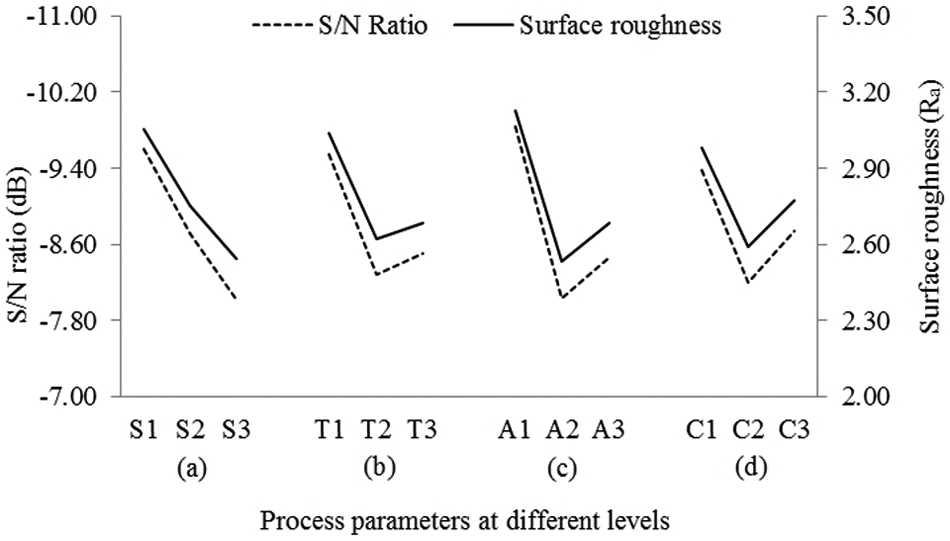
Variation of surface roughness with the variation in process parameters.
The analysis of variance (ANOVA) for raw data (Table 5) indicates that all the input process parameters significantly affect the output QC (SR). The percentage contributions of the process parameters affecting the SR are rotational speed (21.34%), finishing time (16.10%), abrasive size (30.87%) and abrasive concentration (11.94%). Figure 6 indicates that the statistical influence of abrasive size on SR of the drilled hole wall is more followed by the rotational speed, finishing time and abrasive concentration.
ANOVA for SR and HO (raw data).
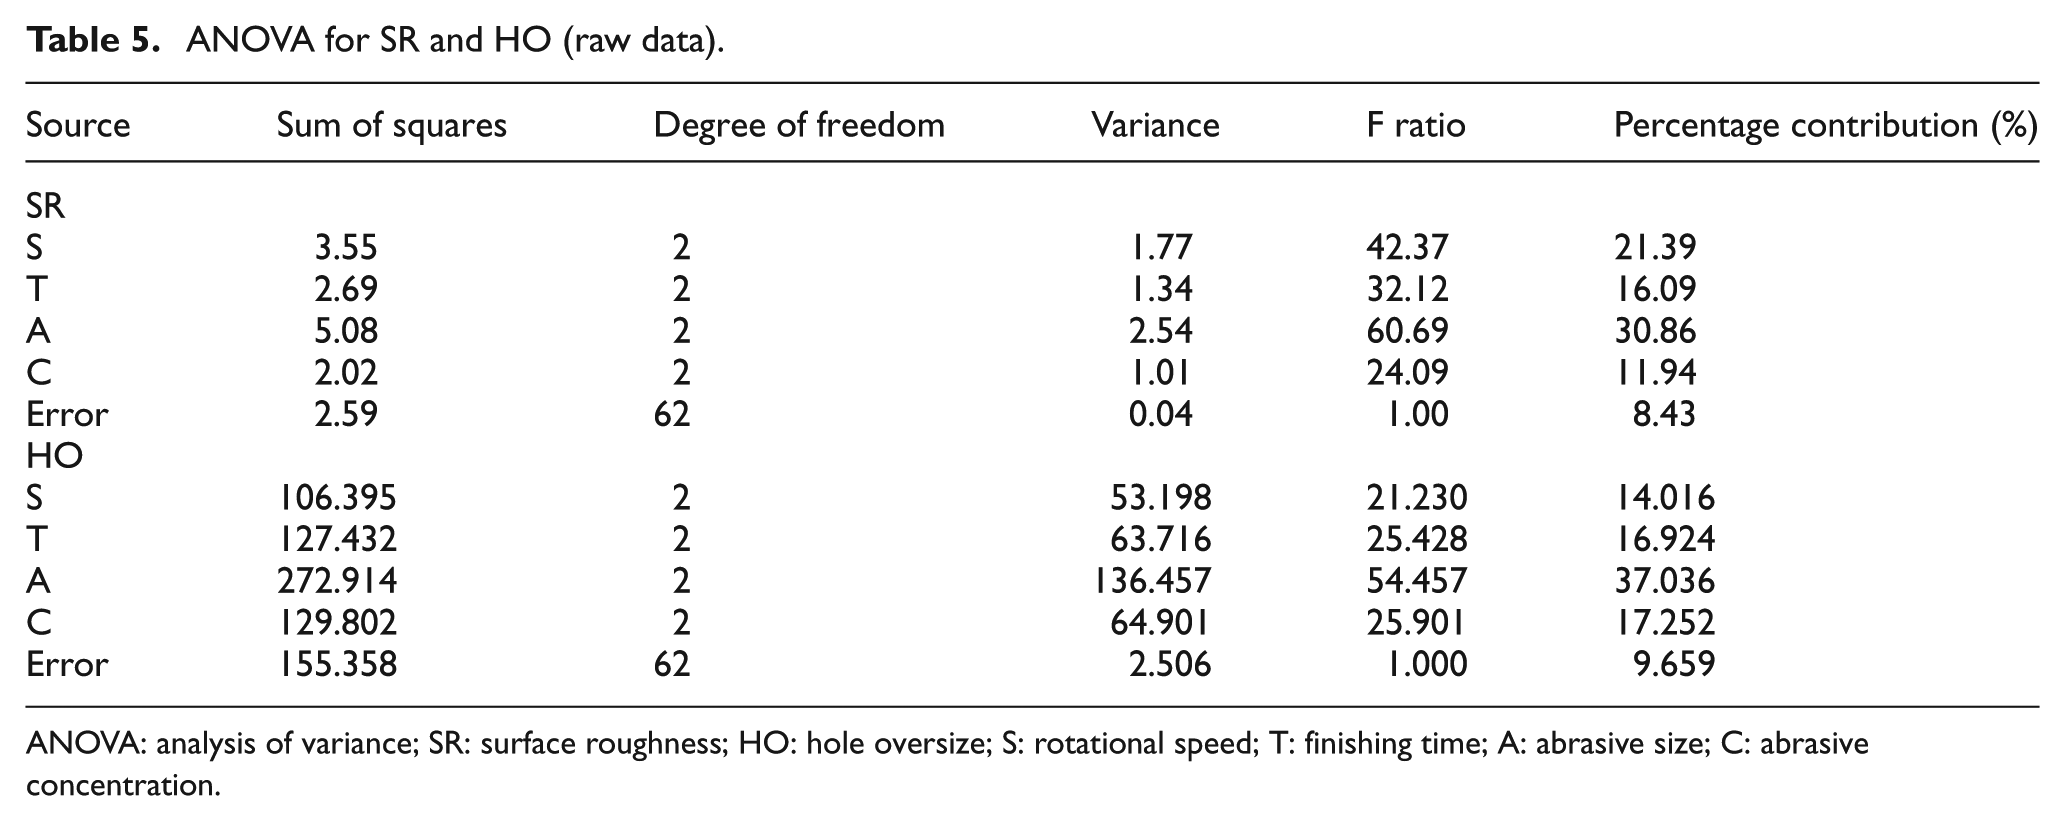
ANOVA: analysis of variance; SR: surface roughness; HO: hole oversize; S: rotational speed; T: finishing time; A: abrasive size; C: abrasive concentration.
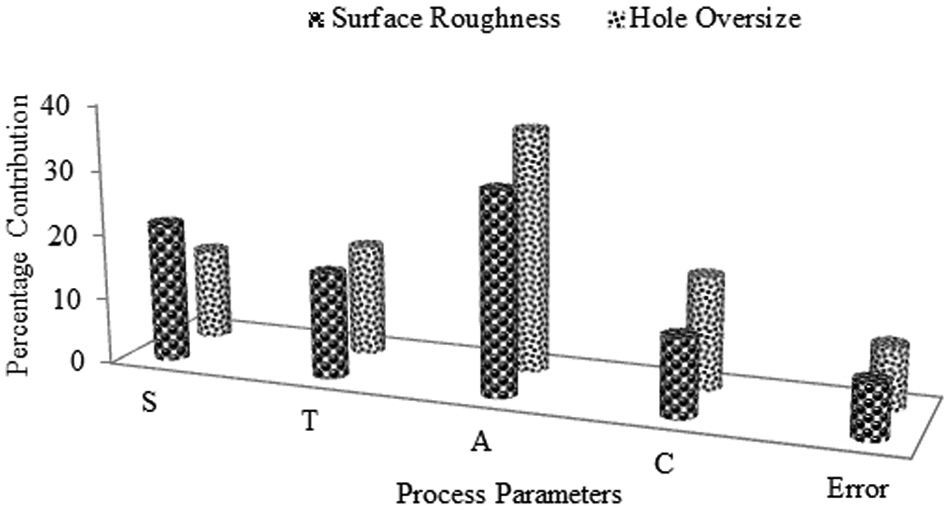
Percentage contributions of various process parameters.
The interactions between the process parameters have been studied in terms of severity index (SI). The 100% SI means 90° angle between lines, indicating strongest presence of interaction, and 0% SI will indicate parallel lines with no interaction between process parameters. Qualitek-4 (17.1.0) software has been used to calculate the SIs, and the results are presented in Table 6. The test for interaction suggests that for minimum SR, the optimal levels for rotational speed, finishing time, abrasive size and concentration are S3, T2, A2 and C2, respectively. These levels of the process parameters are already included in the optimum conditions as per Figure 5.
Interaction between process parameters in terms of SI.
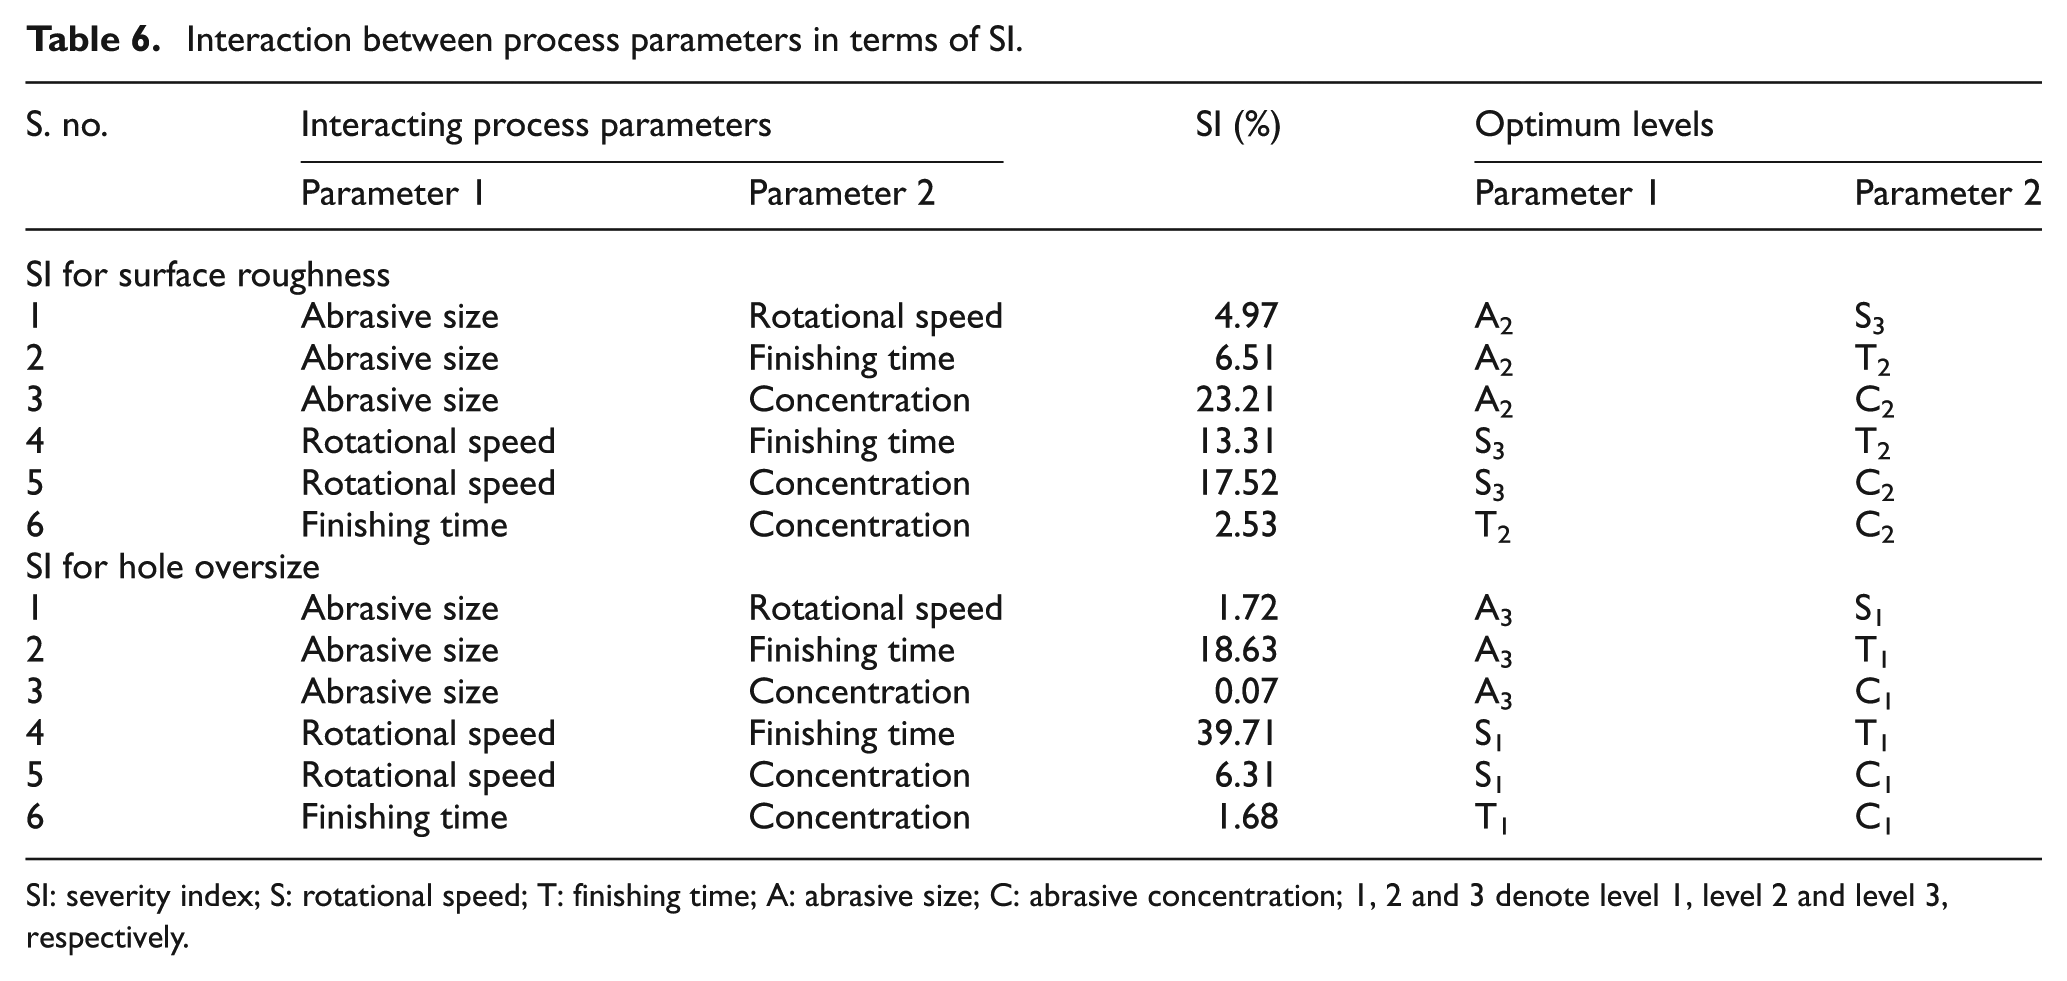
SI: severity index; S: rotational speed; T: finishing time; A: abrasive size; C: abrasive concentration; 1, 2 and 3 denote level 1, level 2 and level 3, respectively.
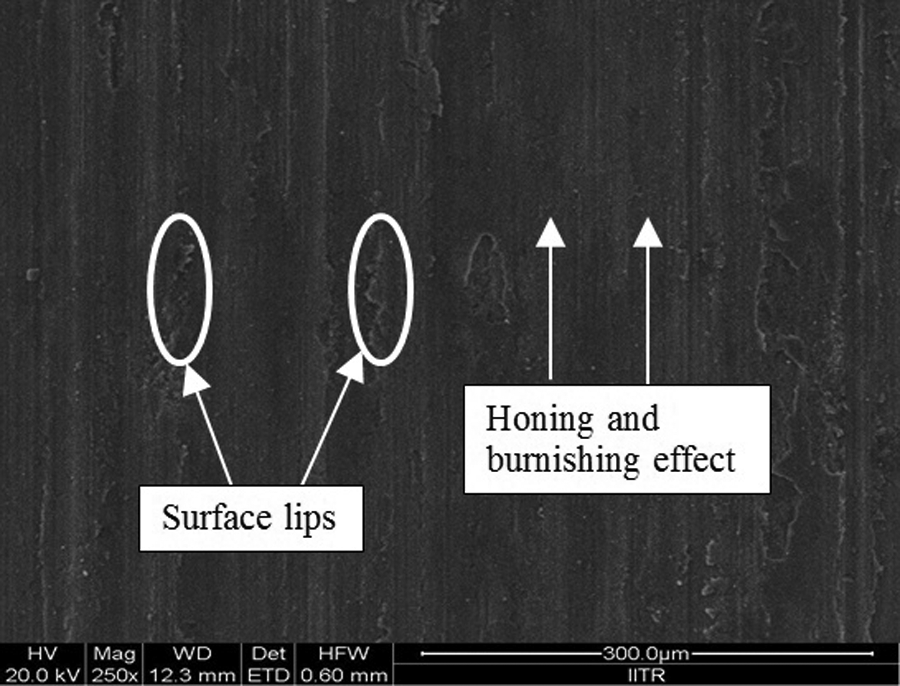
The variation in SR of the hole wall with the variation in rotational speed is shown in Figure 5(a). It was observed from Figure 5 that with an increase in rotational speed, the SR of the drilled hole wall decreases. It may be because of an increase in the centrifugal force acting on the abrasive particles with the increase in rotational speed. Also, with an increase in the rotational speed, the greater number of abrasive particles may strike on the surface of drilled hole wall. The striking abrasive particles act as grinding wheel and remove the debris or surface undulations in the form of micro-chips. An increase in centrifugal force acting on the abrasive particles causes the abrasive particle to strike on the surface of drilled hole wall with greater impact and liberate their energy. It causes breaking of atomic bonds, and new surfaces are generated by dislodging of atoms, material is removed and better surface finish is produced. The scanning electron microscopy (SEM) images as shown in Figure 7(a)–(c) produced at different combinations of rotational speed also suggest a decrease in the SR of the drilled hole wall. The SEM images reveal the effect of rotational speed on the drilled hole wall surface. It can be observed from these images that the AAD causes the formation of grooves on the workpiece surface because of the smearing action of the abrasive particles. The abrasive particles experience strong shear and normal stresses (centrifugal forces) because of rotational speed of the drill point geometry. These stressed abrasive particles interact with the surface of the workpiece and cause the formation of longitudinal grooves. On both the lateral sides of the grooves, surface lips are formed because of excessive plastic deformation. Due to continued plastic deformation, the projected material of the lips gets work hardened, and the surface lips start developing brittleness and finally get fragmented and separated from the parent material surface. 4
SEM images of drilled hole wall surface: (a) without AAD 4.37 µm, (b) with AAD at S2T2A3C2 SR 2.23 µm and (c) with AAD at S3T2A2C2 SR 2.01 µm.
Figure 5(b) shows the variation in SR with the variation in finishing time. It can be observed from this figure that with an increase in finishing time from T1 to T2, a considerable decrease in SR is observed. However, with further increase in finishing time from T2 to T3, no significant change in SR was observed. In some experimental runs, an increase in SR was observed with the increase in finishing time from T2 to T3. The initial decrease in SR is a result of increased number of abrasive particles impinging on the drilled hole wall surface. The impinging abrasive particles liberate their energy at the surface of the drilled hole wall, and the process behaves like a “Short Peening” which may cause the localized surface hardening of the drilled hole wall along with burnishing effect produced by the high-energy abrasive particles. Because of localized surface hardening of the drilled hole wall, an insignificant change in SR was observed with further increase in finishing time.
The abrasive size is highly significant with percentage contribution of more than 30% toward the SR. The morphology of the abrasive particles used for the experimentation is as shown in Figure 3. It can be observed from this figure that most of the abrasive particles have irregular shape and sharp edges. These sharp edges act as cutting tools and abrade the drilled hole wall surface, which causes a decrease in SR of the hole wall surface. The effect of abrasive size on SR is presented in Figure 5(c). It is clear from this figure that the SR decreases with increase in mesh size from level 1 (400) to level 2 (500) and later increased at level 3 (600). With an increase in mesh size from level 1 to level 2, the number of abrasive particle strikes per unit surface area will be more. It causes an increase in burnishing effect along with smaller groove formation because of the plowing action of abrasive particles. However, with further increase in mesh size from level 2 to level 3, a decrease in SR was observed. Although the number of abrasive particles striking per unit surface area increases, the energy possessed by the abrasive particles decreases because of increase in mesh size (decrease in particle size). This decrease in energy possessed by abrasive particle may not be sufficient to plastically deform the hole surface wall. The abrasion caused by the entrapped abrasive particles between the hole wall and land of drill geometry may cause a decrease in SR of the drilled hole wall.
The variation in SR with the variation in abrasive concentration is presented in Figure 5(d). The abrasive concentration is significant with nearly 12% contribution toward SR. The SR decreases with increase in concentration from level 1 (5%) to level 2 (10%), and after that, an increase in the SR was observed with increase in concentration (level 3, 15%). It may be because of the number of abrasive particles striking that the hole wall surface per unit area increases with an increase in the abrasive concentration. These particles effectively participate in abrasion and burnishing of drilled hole wall. However, with further increase in abrasive concentration, the behavior of abrasive particles is reversed. The abrasive particles smear the hole surface wall along with scratches on drill point geometry (Figure 2). The scratches on the drill point geometry (flank surface) and land wear were because of entrapped abrasive particles between the land of drill geometry and drilled hole wall surface. As a result, the entrapped abrasive particles cause the abrasion of drill point geometry along with abrasion of drilled hole wall.
Effect of process parameters on HO
The average values of HO (raw data) and S/N ratio for the various process parameters at different levels are given in Table 3. The S/N ratio for HO (“lower-the-better”) was calculated from equation (1). The response curves for the individual effect of the four process parameters on the average value of HO and S/N ratio were plotted by using the experimental data and are presented in Figure 8.
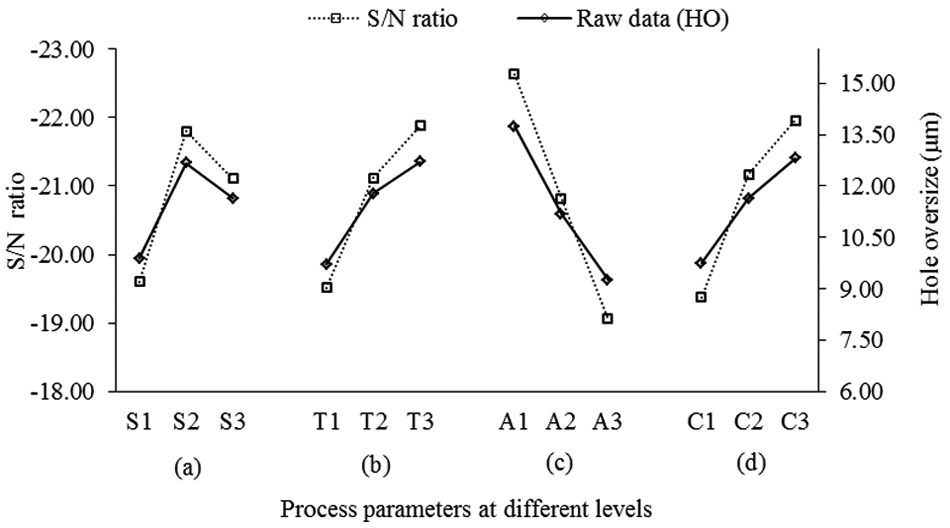
Variation in hole oversize with the variation in process parameters.
The lower values of HO are considered to be optimal. It can be easily seen from the response curve and Table 4 that first level of rotational speed (S1), first level of finishing time (T1), third level of abrasive size (A3) and first level of abrasive concentration (C1) are the best for lower value of HO, in terms of both raw data and S/N data.
ANOVA was performed to study the relative significance of the process parameters on HO. ANOVA was performed for raw data and is presented in Table 5. The ANOVA for raw data indicates that all the input process parameters significantly affect the output QC; that is, the HO. The percentage contributions of the process parameters affecting the HO are rotational speed (14.02%), finishing time (16.92%), abrasive size (37.06%) and abrasive concentration (17.25%). Figure 6 indicates that the influence of abrasive size is more on the HO followed by the abrasive concentration, finishing time and rotational speed.
The interactions between the process parameters have been studied in terms of SI, and the results are presented in Table 6. The test for interaction suggests that for HO, the optimal levels for rotational speed, finishing time, abrasive size and abrasive concentration are S1, T1, A3 and C1, respectively. These levels of the process parameters are already included in the optimum conditions as per Figure 8.
The variation in HO with the variation in rotational speed is presented in Figure 8(a). It was observed from this figure that an increase in HO was observed with an increase in the rotational speed from level 1 (450 r/min) to level 2 (560 r/min). However, with further increase in rotational speed to level 3 (710 r/min), the variation in HO is insignificant. It may be because of an increase in the rotational speed that the impact energy with which the abrasive particles strikes on the hole wall surface increases, and it causes increase in deformation of hole wall surface. Although with further increase in rotational speed, the impact energy of the abrasive particles increases, simultaneously the drilled hole wall surface hardens because of surface hardening caused by the impact energy of the abrasive particles. Therefore, an insignificant change in HO was observed with further increase in rotational speed.
The variation in HO with the variation in finishing time is presented in Figure 8(b). It is observed from this figure that with an increase in the finishing time, the HO increases. A precipitous rise in HO was observed with the increase in finishing time from level 1 (4 min) to level 2 (6 min), after that the increase in HO was at a lower rate. A similar behavior for HO was observed for rotational speed and finishing time, and it strongly favors the concept of surface hardening of the drilled hole wall.
Figure 8(c) presents the variation in HO with the variation in abrasive mesh size. It is observed from this figure that a steady decrease in HO was observed with the increase in mesh size from level 1 to level 3. It may be due to larger particle size of the abrasive particles at lower mesh size which causes the abrading of surface layer of the drilled hole wall when entrapped between the drill point geometry and hole wall surface. Furthermore, the larger grain size particles possess higher centrifugal energy delivered by the rotary drill point geometry to the abrasive particles. These high-energy abrasive particles strike the drilled hole wall with higher impact, which results in an increase in HO.
The variation in HO with the variation in abrasive concentration is presented in Figure 8(d). It is observed from this figure that with the increase in concentration from level 1 to level 3, the HO increases. It may be due to increased number of abrasive particles actually participating in AAD process. With the increase in abrasive concentration, the material removal by the abrasive particles increases and results in increase in hole size.
Estimation of optimum SR and HO
The optimal value of SR is predicted considering the effect of significant process parameters. The significant process parameters and their optimal levels for minimum SR are S3, T2, A2 and C2. The mean value of SR can be computed as
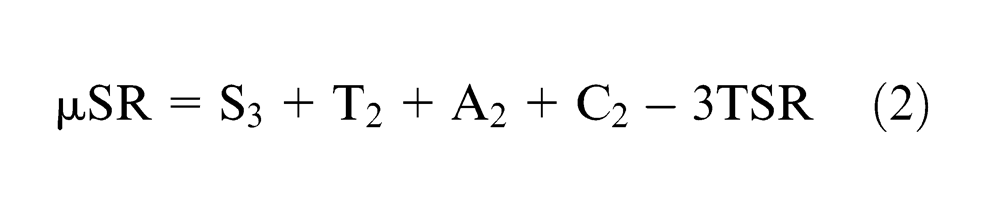
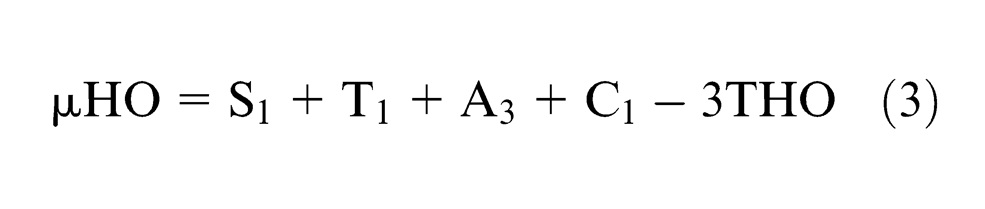
where TSR = 2.78 µm and THO = 11.556 are the grand averages for the SR and HO, respectively, and the values of the process parameters S, T, A and C at different levels for SR and HO are given in Table 4.
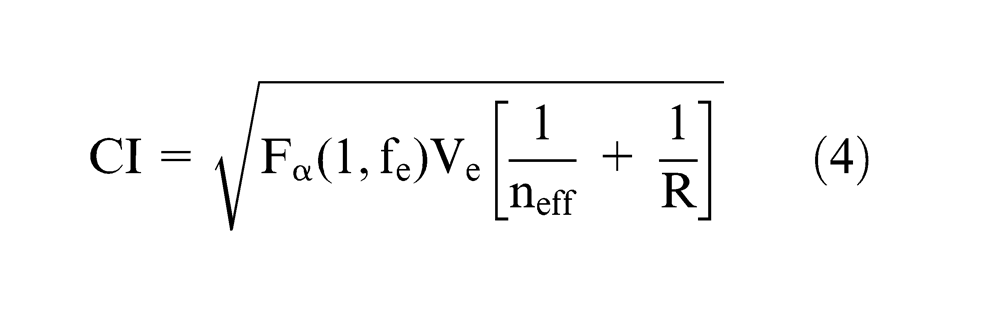
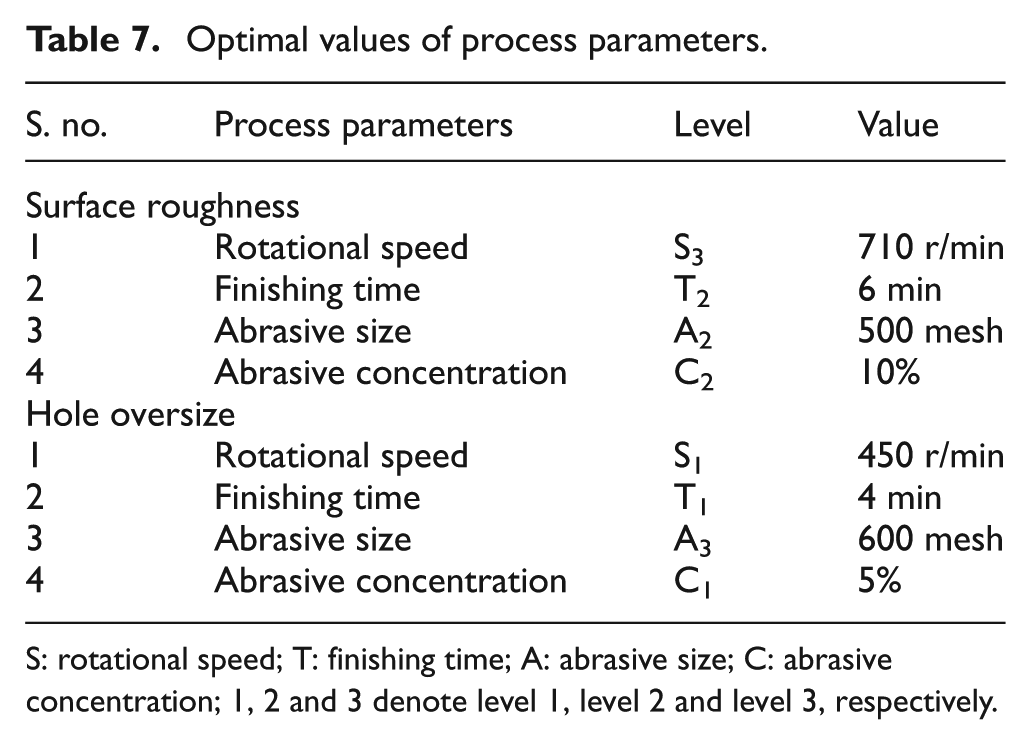
The confidence interval (CI) for the predicted result can be calculated from equation (4). Where Fα (1, fe) is the F ratio at a confidence level of (1 −α) against degrees of freedom (DOFs) equal to 1 and error DOF (fe); Ve is the error variance; R is the sample size for confirmation experiment = 3; neff is the effective number of replications = N/1 + (total DOF in the estimation of mean); N is the total number of results (27 × 3 = 81); Ve = 0.042 for SR and 2.506 for HO (Table 5); total DOF in estimation of mean = 8 (DOF of the significant process parameters from Table 5); neff = 9, F0.05(1, 72) = 3.974 (tabulated); and the CI = ±0.037 for SR and ±2.213 for HO. The 95% CI of the predicted optimum SR is 1.91□ micron SR □ 1.99 and HO 1.73 □ micron HO □ 6.15. The optimal values of process parameters for the predicted range of SR and HO are presented in Table 7
Optimal values of process parameters.
S: rotational speed; T: finishing time; A: abrasive size; C: abrasive concentration; 1, 2 and 3 denote level 1, level 2 and level 3, respectively.
Confirmation experiments
Confirmation experiment is the final step in verifying the conclusions drawn based on Taguchi’s methodology. The optimum conditions are set for significant process parameters, and selected numbers of experiments are run under constant optimum process parameter conditions. The average of the results of the confirmation experiments is compared with the predicted average based on the parameters and levels tested. Three confirmation experiments were conducted at the optimum levels of the process parameters recommended by the experimental investigation. The results of comparison are given in Table 8. The results are within the 95% CI of the predicted optima of QCs, SR and HO. The expected decrease in SR and HO at optimum machining conditions is 28.77% and 52% over the average values of 2.78 µm (Ra) and 11.556 µm (HO), respectively. The SEM image of the drilled hole wall surface for confirmation experiment is shown in Figure 9. The corresponding SR of the drilled hole was found to be 1.98 Ra.
Confirmation experiments at optimal conditions.
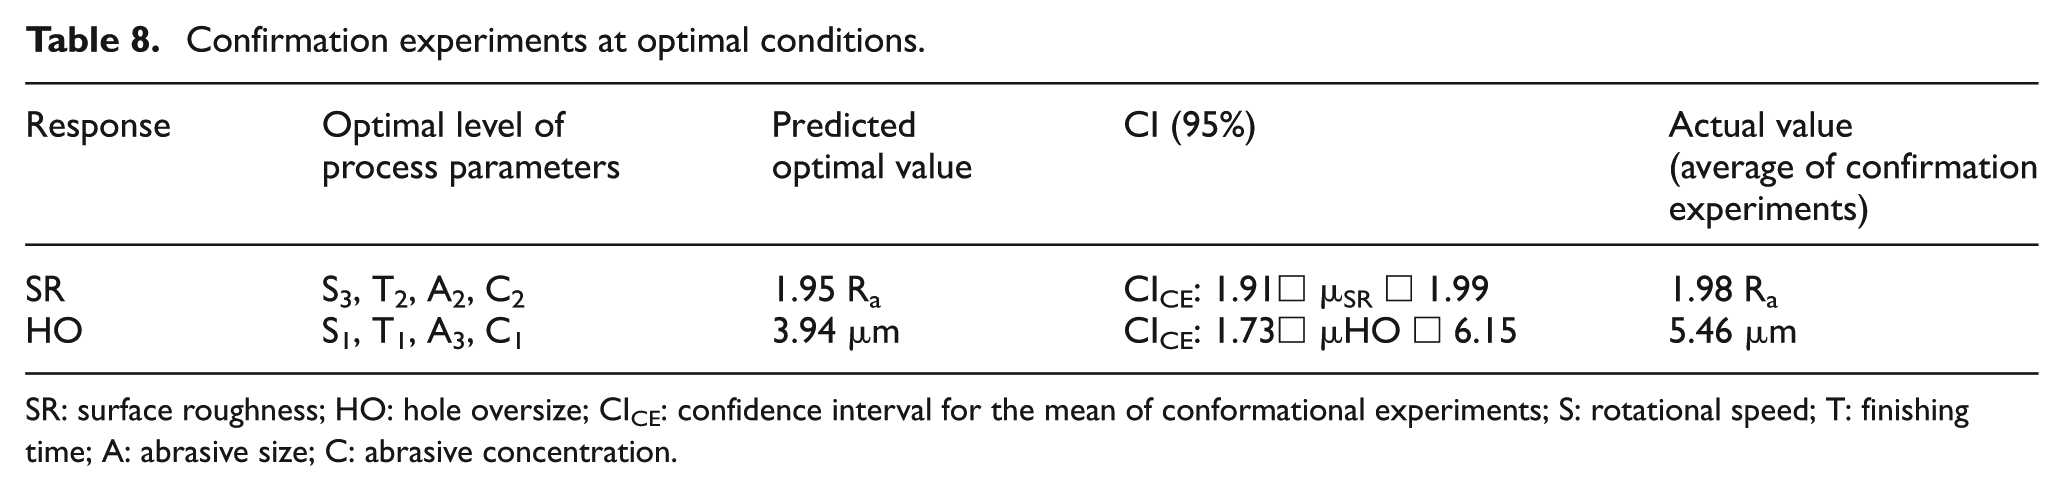
SR: surface roughness; HO: hole oversize; CICE: confidence interval for the mean of conformational experiments; S: rotational speed; T: finishing time; A: abrasive size; C: abrasive concentration.
SEM image of the drilled hole wall at optimal conditions.
Conclusion
The following conclusions can be drawn from the present experimental investigation using the concept of AAD:
The increase in surface finish of the drilled hole wall is because of burnishing and honing effects produced by the abrasive particles due to the centrifugal force exerted by the drill point geometry.
The abrasive particles act as cutting edges when entrapped between the drill point geometry and hole wall surface. They may increase the hole wall surface finish as well as damage the tool (drill point geometry).
Localized surface hardening may be caused by the abrasive particles on the surface of the drilled hole wall, which limits the further improvement in the SR with an increase in the rotational speed and machining time.
The statistical analysis of AAD process for SR reveals that the abrasive size has percentage contributions of 31%, followed by rotational speed, 21%; finishing time, 16% and abrasive concentration, 12%.
The SI analysis suggests a strong interaction between abrasive size and concentration followed by rotational speed and concentration, and rotational speed and finishing time. The optimal levels of these process parameters are rotational speed, level S3 (710 r/min); finishing time, level T2 (360 s); abrasive size, level A2 (500 mesh) and abrasive concentration, level C2 (10%).
The burnishing and honing effects caused by the abrasive particles are evident from the field emission (FE)-SEM images of the drilled hole wall produced by AAD process.
The statistical analysis of the HO data reveals that the abrasive size has percentage contributions of 37% followed by abrasive concentration, 17%; finishing time, 17% and rotational speed, 14%.
Footnotes
Acknowledgements
We extend our sincere thanks to the reviewers for critical analysis of the submitted article entitled “Design and development of abrasive-assisted drilling process for improvement in surface finish during drilling of metal matrix composites.” The modifications suggested by the reviewers are deeply acknowledged and the article has been modified accordingly. The suggested modifications have certainly enhanced the technical merit of this article.
Declaration of conflicting interests
The authors declare that there is no conflict of interest.
Funding
This research received grant under the Head of Faculty Initiation Grant (Scheme B) No. IITR/SRIC/122/F.I.G (B) to Dr Akshay Dvivedi, Assistant Professor, Department of Mechanical and Industrial Engineering, Indian Institute of Technology Roorkee, Roorkee, India.